

Translate this page into:
Electrosynthesis and characterization of adherent poly(2-aminobenzothiazole) on Pt-electrode from acidic solution
⁎Corresponding author. smsayyah@hotmail.com (S.M. Sayyah)
-
Received: ,
Accepted: ,
This article was originally published by Elsevier and was migrated to Scientific Scholar after the change of Publisher.
Peer review under responsibility of King Saud University.
Abstract
The electrochemical oxidation of 2-aminobenzothiazole, 2-ABT, on Pt-electrode has been investigated using CV in HCl solutions under nitrogen atmosphere at different temperatures, different monomer concentrations and different Na2SO4 concentrations. The experimentally obtained kinetic equation was RP,E = kE [monomer]1.19 [acid]1.32 [electrolyte]1.08, which was deduced from values of the first anodic current density (ipI). A simplified mechanism for the electrochemical oxidation of 2-ABT is proposed. Activation energy, which was obtained from the experimental data, was almost same in studied parameters. This means the electrochemical oxidation mechanism for 2-ABT must be the same. The obtained polymer films are found to be thermally stable and have tubular or fibrillar elongated crystals. Different tools have been used to characterized P(2-ABT) as: 1H NMR, Uv–vis, IR spectroscopy and elemental analysis.
Keywords
Electrosynthesis
2-Aminobenzothiazole
Cyclicvoltammogram
SEM

1 Introduction
Benzothiazoles (BTs), a group of xenobiotic compounds containing a thiazole (Th) ring fused with benzene ring, have a wide range of biological properties (Brownlee et al., 1992; Bujdakova et al., 1993; Hartley and Kidd, 1987; Choi et al., 2006; Dubey et al., 2006; Gaja and Knapp, 1997). BTs have been detected in industrial wastewaters and in various environmental media (Kloepfer et al., 2003, 2005). BTs are soluble in water, resistant to biodegradation, only partially removed in wastewater treatment (Kloepfer et al., 2005; Weiss and Reemtsma, 2005; Kloepfer et al., 2004; Cancillia et al., 2003), and they may pass the water treatment processes employed in the production of drinking water. These compounds are often found in the aquatic environment (Reemtsma et al., 2006; Wever et al., 2007). Some of these molecules show toxic effects toward microorganisms, animals or humans. Therefore, it is important to investigate methods to overcome or decrease its toxicity (Reemtsma et al., 2006; Wever et al., 2007).
The electrochemical oxidation of hazardous organic species is a promising method for wastewater remediation. In our previous work (Sayyah et al., 2004) we study the electrooxidation of 2-amino-4-phenylthiazole on Pt-electrode in acid medium under different reaction conditions; an amorphous, homogeneous and compact adhering film on Pt-electrode was obtained. Also, the electrooxidation of a binary mixture of 3-chloroaniline and 2-amino-4-phenyl-thiazole on Pt-electrode in acid medium under different reaction conditions was studied (Sayyah et al., 2005); a block copolymer film on Pt-electrode is obtained.
The kinetic equation of the electropolymerization reactions of different monomers was calculated from ex situ microgravimetric data (Sayyah et al., 2004a, 2005, 2003, 2004b, 2006a,b,c,d, 2007a), from both the ex situ microgravimetric and electrochemical data (Sayyah et al., 2007b; Mu et al., 1997) and from electrochemical data (Sayyah et al., 2011). The effect of HCl concentration, monomer concentration, support electrolyte concentration and temperature is an important parameter on electrosynthesis of conducting polymer (Sayyah et al., 2004a,b, 2005, 2003, 2006a,b,c,d, 2007a,b).
In this study, we have focused on a CV study of 2-ABT in acid (HCl) medium on a Pt-electrode in order to investigate kinetic equation of the electropolymerization reaction. Potentiodynamic cyclic voltammetry measurements provide important information on the electrochemical characterization of the species under study and are a simple method for screening the processes occurring in a wide potential range used more often for the practical purposes. Also, the characterization of the obtained polymer film should be done with different tools.
2 Experimental
2.1 Materials
2-Aminobenzothiazole (2-ABT) and anhydrous sodium sulfate were provided by Merck (Darmstadt, Germany), hydrochloric acid solution and Dimethylformamide (Riedel-de Haën, Germany). All solutions were prepared under nitrogen atmosphere in freshly double-distilled water.
2.2 Electropolymerization cell
Electropolymerization of the 2-aminobenzothiazole monomers and formation of the polymer films was carried out using cyclic voltammetry technique as described elsewhere (Sayyah et al., 2004a, 2005, 2003, 2004b, 2006a,b,c,d, 2007a,b).
2.2.1 Electrodes
2.2.1.1 Working electrode
The working electrode (WE) was a Platinum sheet with dimensions of 1 cm height and 0.5 cm width.
2.2.1.2 Auxiliary electrode
The auxiliary (counter) electrode (CE) was a platinum foil with the same dimensions as the WE. Before each run, both the WE and the CE were cleaned and washed thoroughly with water, double distilled water, rinsed with ethanol and dried.
2.2.1.3 Reference electrode
A saturated calomel electrode (SCE) was used as a reference electrode. The values of the electrode potential in the present study are given relative to this electrode. The potential value for the calomel electrode is 0.242 V vs. NHE at 25 °C. The reference electrode was periodically calibrated and checked. Electrochemical experiments were performed using the Potentiostat/Galvanostat Wenking PGS 95.
The I–E curves were recorded by computer software from the same company (Model ECT). Except otherwise stated, the potential was swept linearly from −0.5 V (SCE) into the positive direction up to a certain anodic potential with a given scan rate and then reversed with the same scan rate up to the starting cathodic potential. For each run, freshly prepared solutions as well as a cleaned set of electrodes were used. All experiments were conducted at a given temperature (±0.5 °C) with the help of circular water thermostat. After polymer film formation, the working electrode was withdrawn from the cell, rinsed thoroughly with doubly distilled water to remove any traces of the formation medium constituents; the deposited polymer film was subjected to different experimental tests to characterize it.
2.3 IR, Elemental analysis, 1H NMR, UV–vis and TGA
IR measurements were carried out using shimadzu FTIR-340 Jasco spectrophotometer (Japan).
Elemental analysis was carried out in the microanalytical center at Cairo University by oxygen flask combustion and dosimat E415 titrator (Metrohm).
1H NMR measurements were carried out using a Varian EM 360 L, 60-MHz NMR spectrometer. NMR signals of the electropolymerized sample were recorded in dimethylsulfoxide using tetramethylsilane as internal standard.
UV–vis spectra of the prepared polymer sample were measured using Shimadzu UV spectrophotometer (M160 PC) at room temperature in the range 200–900 nm using dimethylformamide as a solvent and reference.
TGA of the obtained polymer was performed using a Shimadzu DT-30 thermal analyzer (Shimadzu, Kyoto, Japan). The weight loss was measured from ambient temperature up to 600 °C, at the rate of 20 °C min−1 to determine the degradation rate of the polymer.
2.4 Scanning electron microscopy and X-ray diffraction
Scanning electron microscopic analysis was carried out using a JXA-840A Electron Probe Microanalyzer (JEOL, Tokyo, Japan). The X-ray diffractometer (Philips 1976 Model 1390, Netherlands) was operated under the following conditions that were kept constant for all the analysis processes:
X-ray tube: Cu
Current: 30 mA
Preset time: 10 s
Scan speed: 8 °min−1
Voltage: 40 kV
3 Results and discussion
3.1 Electropolymerization of 2-ABT
Electropolymerization of 2-ABT on Platinum electrode from the deoxygenated aqueous solution containing 0.3 M HCl, 0.001 M monomer and 0.05 M Na2SO4 at 309 K in the absence and presence of monomer, was studied by cyclic voltammetry at potential between −0.53 and +1.49 V (vs. SCE) with scan rate of 25 mV s−1. The obtained voltammogram is represented in Fig. 1A and B, respectively. In the absence of monomer the voltammogram exhibits no peaks in anodic and cathodic directions, as a result of the inert behavior of Pt-electrode. In the presence of monomer, a well-adhering P(2-ABT) film is electrodeposited on the Pt-surface. The voltammogram exhibits two oxidation peaks (I and II) that progressively developed at +90 and +1320 mV (vs. SCE) repetitively as found in our previous work (Sayyah et al., 2011). On one hand, the first oxidation peak (I) corresponds to removing of one electron from nitrogen atom of the amino group to give radical cation (Sayyah et al., 2006b,d, 2011). The formed radical cation interacts with the other monomer molecule to form dimer radical cation, which followed by further reaction with monomer molecule gives trimer radical cation and so on. Finally, the semiquinone radical cation (polaron state) is formed, which is adsorbed on the electrode surface (Sayyah et al., 2006b,d, 2011) as shown in Scheme 1. On the other hand, the second oxidation peak (II) is assigned to the oxidation of the formed semiquinone radical cation (polaron state) to the quinoneimine (bipolaron state) (Sayyah et al., 2006d, 2011; Buzarovska et al., 2001) and represented in Scheme 1. Therefore, the second redox process is attributed to the conversion of the formed radical cations to the fully oxidized form (quinoidal structure). However, as soon as polymerization is nucleated, a brown polymer film is rapidly deposited on the electrode surface. The charge of the second peak (II) is smaller than that of the first one (I), which means that not all the formed radical cations interact to give polaron and then bipolaron. The potential difference between the first and the second oxidation peak (I and II) is ≈1230 mV, and no middle peaks were observed between them which confirm the non-existence of degradation products during the anodic direction, higher regularity, homogeneity and adherence of the deposited film to the electrode surface (Sayyah et al., 2006d, 2011; Buzarovska et al., 2001).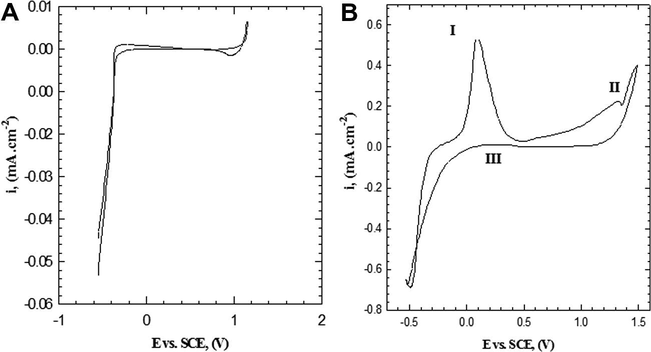
Cyclic voltammogram of Pt-electrode from solution containing 0.3 M HCl and 0.05 M Na2SO4 at 309 K with scan rate of 25 mV s−1 in (A) absence of monomer, (B) 0.001 M monomer.
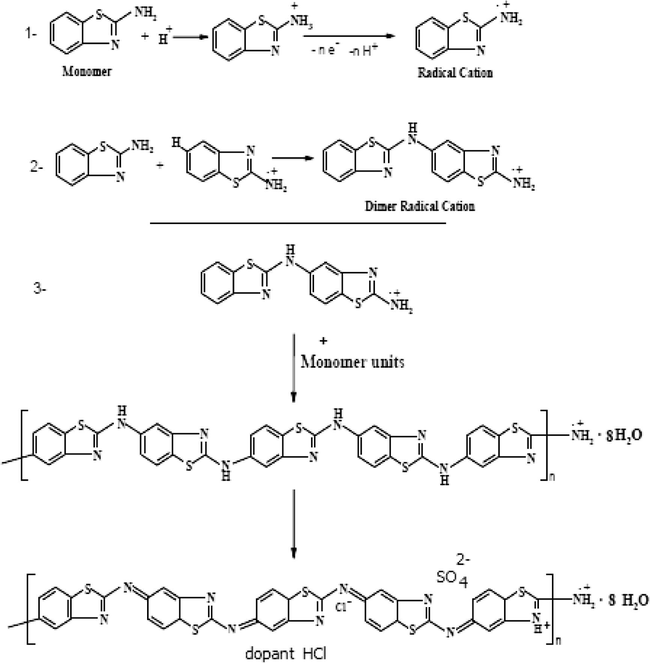
Suggested mechanism of P(2-ABT) formation.
Sometimes, redox chemical species produce square wave voltammetry peaks that overlap i.e. at 0.65 V. In the case of such a problem, it is necessary to deconvolve the voltammetric peaks. The smoothed voltammogram is inspected automatically.
After 1.49 V Cl2 gas began to evolve near the working electrode (Strmcnik et al., 2005; Pérez et al., 2001; López-Cudero et al., 2003), we make the final limit of the voltammogram 1.49 V to prevent the effect of Cl2 on the polymer formation.
On reversing the potential scan from +1.49 up to −0.53 mV vs. SCE, the reversing anodic current is very small indicating, the presence of adhere layer of the polymer on the electrode surface. Beyond 500 mV, the reversing current starts to increase, forming a reactive anodic peak (III), indicating the partial removal of the deposited polymer film from the surface as a result of degradation process and consequently radical cation formation at this potential (Sayyah et al., 2006b; Mu et al., 1997).
When we use a lower potential rang (−2 to −0.53 V vs. SCE) no deposition of polymer occurs. So, the suitable rang of work is from −0.53 to 1.49 V.
Fig. 2 shows the repetitive cycling on the formation of P(2-ABT) from solution containing (0.001 M monomer, 0.3 M HCl and 0.05 M Na2SO4 at 309 K). The data reveal that, the peak currents (ipI, ipII) of the two anodic peaks (I and II) decrease. The decrease of the anodic currents could be attributed to the presence of a part of the polymer film on the electrode surface, therefore, the currents of the following anodic half cycle decrease. It is possible that the stability of the deposited film enhances with successive cycling and therefore, the peak currents (I and II) decrease with repetitive cycling (Sayyah et al., 2006b; Mu et al., 1997).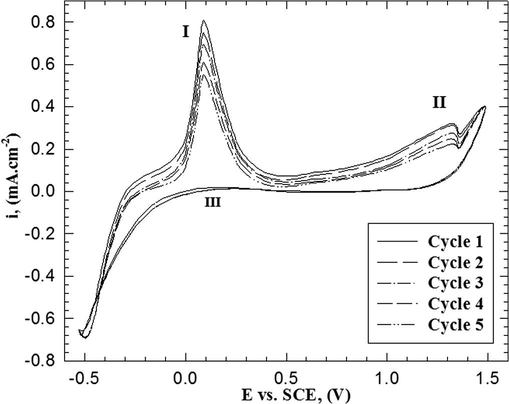
Repetitive cycling of electropolymerization of 2-ABT from solution containing 0.001 M monomer, 0.3 M HCl and 0.05 M Na2SO4 at 309 K with scan rate of 25 mV s−1.
Fig. 3A shows the influence of scan rate (5–25 mV s−1) on the anodic polarization curve for the electropolymerization of 2-ABT from solution containing (0.001 M monomer, 0.3 M HCl, 0.05 M Na2SO4) at 309 K on platinum electrode. The data reveal that, the peak current densities (ipI and ipII) of the first and second anodic peak respectively increase with increase of the scan rate. This behavior may be explained as follows (Mu et al., 1997), When enough potential is applied at an electrode surface causing oxidation of species in the solution, a current arises due to the depletion of the species in the vicinity of the electrode surface. As a consequence, a concentration gradient appears in the solution. The current (ip) is proportional to the gradient slope, dc/dx, imposed (iα dx/dc). As the scan rate increases the gradient increase and consequently the current (ip), values of ip are proportional directly to v1/2 according to the Sevick (1948) and Randles (1948) equation:
where n is the number of exchanged electron in the mechanism, F is Faraday’s constant (96,485 C/mol), A is the electrode area (cm2), C is the bulk concentration, D is the analyst diffusing coefficient (cm2/s), and v is the scan rate (V/s). R is the universal gas constant (8.134 J/mol K) and T is the absolute temperature (K). The calculated D at (0.3 M HCl, 0.001 M monomer, 0.05 M Na2SO4, 309 K and scan rate 25 mV s−1) was found to be 2.68 × 10⁻¹⁰ m2 s−1.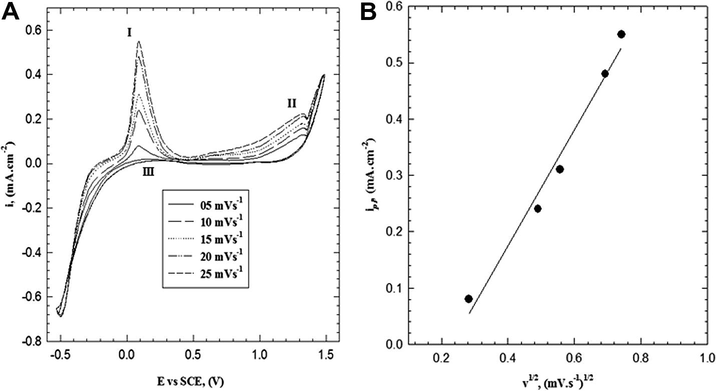
(A) Effect of scan rate on the electropoly-merization of 2-ABT from solution containing 0.001 M monomer, 0.3 M HCl and 0.05 M Na2SO4 at 309 K. (B) Relation between IpI vs. v1/2.
Fig. 3B shows the linear dependence of the first current peak, (ipI) versus ν1/2. This linear regression equation was with a correlation coefficient of r2 = 0.981. So we suggest that the electroformation of radical cation may be described partially by a diffusion-controlled process (diffusion of reacting species to the polymer film/solution interface) (Mazloum-Ardakani et al., 2009; Rieger, 1985; Nicholson, 1965). The intercept in Fig. 3B is small and negative, −0.235, which could be attributed to a decrease of the active area during the positive scan (Ureta-Zanartu et al., 2002). It seems that, initially the electroformation of radical cation is controlled by the charge transfer process. When the thickness of the polymer becomes thick, the diffusion of reactant inside the film becomes the slowest step, the process changes to diffusion transfer, which confirms the data in Fig. 2.
3.2 Kinetic studies
The electropolymerization kinetics were carried out using deoxygenated aqueous solution containing monomer in the concentration range between 0.0002 and 0.0012 M, hydrochloric acid concentration in the range between 0.1 and 0.5 M, and Na2SO4 in the concentration range between 0.02 and 0.07 M at 309 K. The kinetic equation was calculated by means of electrochemical study from the values of the anodic current densities (Mu et al., 1997; Sayyah et al., 2011).
The value of the anodic current density (ipI) is proportional to the electropolymerization rate (RP,E) at a given concentration of the monomer, acid and electrolyte, then we can replace the electropolymerization rate by the anodic current density (Mu et al., 1997; Sayyah et al., 2011, 2009, 2010).
3.2.1 Effect of HCl concentration
Fig. 4A represents the influence of HCl concentration in the range between (0.1 and 0.4 M) on the cyclic voltammogram using scan rate of 25 mV s−1. The voltammogram shows that, the anodic peak current densities (ipI and ipII) increase with the increasing of the HCl concentration up to 0.3 M and then starts to decrease with further increase of HCl concentration. A double logarithmic plot of the current density (ipI) –related to radical cation formation– against HCl concentrations in the range between 0.1 and 0.3 M is graphically represented in Fig. 4B. A straight line (with correlation coefficient r2 = 0.977) with slope of 1.32 was obtained. Therefore, the reaction order with respect to HCl concentration is a first order reaction.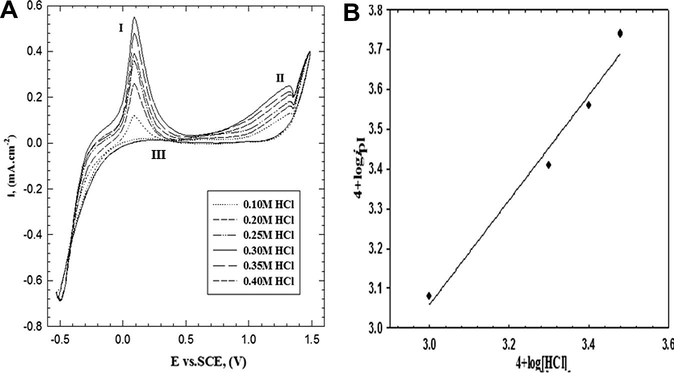
(A) Cyclic voltammogram curves for the effect of HCl concentration on the electropolymerization of 2-ABT from solution containing 0.001 M monomer and 0.05 M Na2SO4 at 309 K with scan rate of 25 mV s−1. (B) Double logarithmic plot of ipI versus HCl concentrations.
3.2.2 Effect of monomer concentration
Fig. 5A represents the influence of monomer concentration in the range between (0.0002 and 0.0012 M) on the cyclic voltammogram using scan rate of 25 mV s−1. The voltammogram shows that, the anodic peak current densities (ipI and ipII) increase with the increasing of the monomer concentration up to 0.0010 M and then starts to decrease with further increase of monomer concentration. A double logarithmic plot of the current density (ipI) –related to radical cation formation– against monomer concentrations in the range between 0.0002 and 0.0010 M is graphically represented in Fig. 5B. A straight line (with correlation coefficient r2 = 0.968) with slope of 1.19 was obtained. Therefore, the reaction order with respect to monomer concentration is a first order reaction.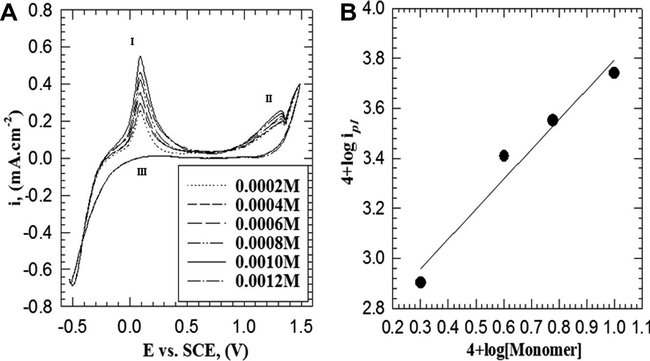
(A) Cyclic voltammogram curves for the effect of monomer concentration on the electropolymerization of 2-ABT from solution containing 0.3 M HCl and 0.05 M Na2SO4 at 309 K with scan rate of 25 mV s−1. (B) Double logarithmic plot of ipI versus monomer concentrations.
3.2.3 Effect of electrolyte concentration
Fig. 6A shows the effect of Na2SO4 concentration in the range between (0.020 and 0.070 M) on the cyclic voltammogram using scan rate of 25 mV s−1. The anodic peak current densities (ipI and ipII) increase with the increasing of the Na2SO4 concentration up to 0.050 M and then starts to decrease with further increase of Na2SO4 concentration. A double logarithmic plot of the current density (ipI) –related to radical cation formation– against Na2SO4 concentrations in the range between 0.02 and 0.05 M is graphically represented in Fig. 6B. A straight line (with correlation coefficient r2 = 0.959) with slope of 1.08 was obtained. Therefore, the reaction order with respect to Na2SO4 concentration is a first order reaction. This means that, Na2SO4 has a role in the polymer formation by doping of the polymeric chain unit with
anion.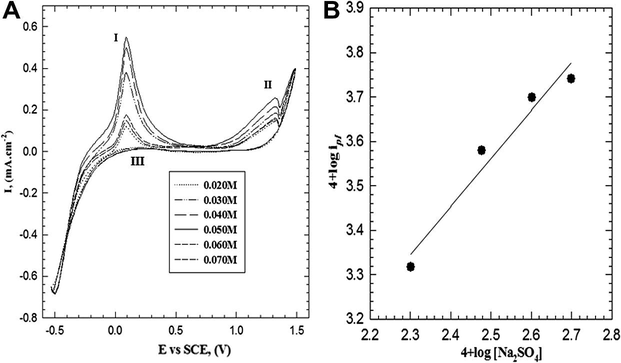
(A) Cyclic voltammogram curves for the effect of electrolyte concentration on the electropolymerization of 2-ABT from solution containing 0.3 M HCl and 0.001 M monomer at 309 K with scan rate of 25 mV s−1. (B) Double logarithmic plot of ipI versus Na2SO4 concentrations.
Depending upon the above results, the kinetic rate law obtained from this method can be written as: where, RP,E is the electropolymerization rate and k is the kinetic rate constant. This equation is valid only before reaching the optimum conditions for P(2-ABT) formation that is described previously.
3.2.4 Effect of temperature
The potentiodynamic polarization curves as a function of the solution temperature in the range between 294 and 314 K under the same experimental conditions as mentioned above were illustrated in Fig. 7A. From the figure, it is clear that, an increase of temperature up to 309 K results in a progressive increase of the charge included in anodic peaks (I and II). The plot of the log (ipI) versus 1/T is represented in Fig. 7B, a straight line is obtained with a slope equal to −4.33 and then the apparent activation energy (Ea) was calculated using Arrhenius equation and it is found to be 82.91 kJ mol−1. The calculation of Ea at different scan rates show almost values approach 82 kJ mol−1 which means that the mechanism of formation of the polymer film on Pt-electrode is the same.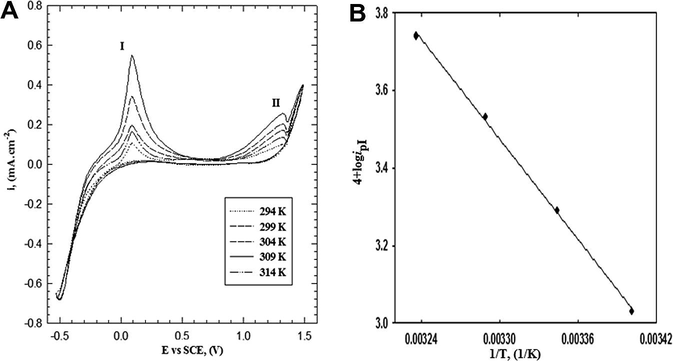
(A) Cyclic voltammogram curves for the effect of temperature on the electropolymerization of 2-ABT from solution containing 0.3 M HCl, 0.007 M monomer and 0.05 M Na2SO4 with scan rate of 25 mV s−1. (B) Arrhenius plot of the electropolymerization of 2-ABT to radical cation.
3.3 Elemental, thermogravimetric and spectroscopic analysis
Elemental analytical data are given in Table 1, which is in a good agreement with those calculated from the suggested structure (Sayyah et al., 2011).
Element (%)
C
H
N
Cl
S
Calc.
Found
Calc.
Found
Calc.
Found
Calc.
Found
Calc.
Found
35.09
35.30
04.81
04.20
10.03
09.71
20.34
20.31
16.01
15.72
The presence of water molecules in the repeated unit is confirmed by thermogravimetric analysis. The TGA steps of the prepared P(2-ABT) are shown in Fig. 8. From the Figure, the loss of (water and doped anions) in the temperature range between 25 and 426.67 °C is clear. After that the polymer begins to decompose, it is suggested that P(2-ABT) is thermally stable where it starts to decompose after 426.67 and at 600 °C about 41% is still found.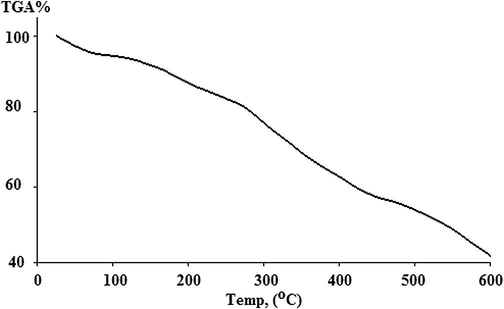
TGA of poly (2-ABT).
The 1H NMR spectrum of the prepared P(2-ABT) was shown in Fig. 9. From the Figure, the solvent signal appeared at δ = 2.17 ppm and δ = 3.41 ppm. The C–NH2 protons signal appear at δ = 4.11 ppm. The protons of benzene ring in the polymeric structure appear in the region from δ = 7.32 to δ = 7.87 ppm. The signal which appears at δ = 8.675 ppm may be attributed to OH protons of water molecules or/and C–NH protons which disappeared when deuterated water was added to the investigated sample (Sayyah et al., 2009, 2010).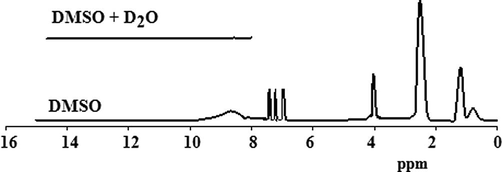
1H NMR spectra of the prepared P(2-ABT).
The FTIR spectra of 2-ABT and P(2-ABT) are shown in Fig. 10. From which, the number of absorption peaks appear in case of P(2-ABT) is much less that of 2-ABT. This is a general feature for polymerization of monomers (Kong and Mu, 2002). The IR spectra are very complicated. We will briefly assign some main peaks.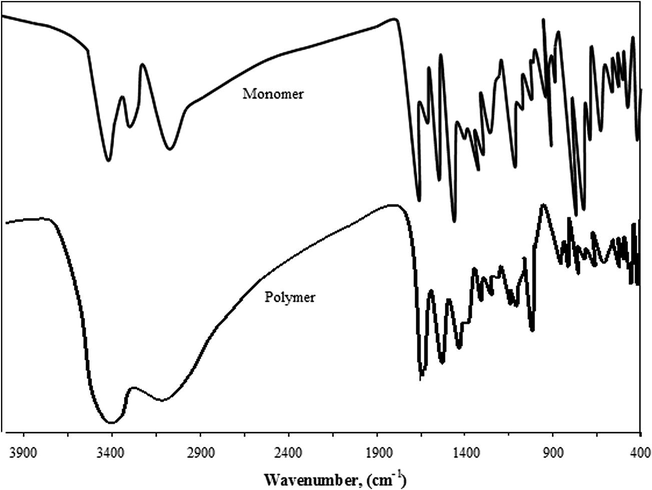
IR- spectra of 2-ABT and P(2ABT).
A large broad absorption peak is observed from 3700 to 1800 cm−1 in the spectrum of P(2-ABT) due to electronic transitions from valence band to conduction band in the polymer film (Sayyah et al., 2011). A medium absorption band appearing at 3227.8 cm−1 and a strong absorption band appearing at 3394.5 cm−1 in case of monomer, appears as a broad absorption band at 3402.1 cm−1 in case of polymer which could be attributed to NH2 stretching vibration of aromatic amine and/or OH strong hydrogen bonded group in H2O molecules of hydration in polymer. This indicates the polymerization is formed via NH2 (c.f. Scheme 1). The dopant absorption bands in P(2-ABT) appearing at 1143 cm−1(weak) and at 1171 cm-1 (weak) could be attributed to and Cl− incorporation in the polymeric chain repetitively. Accordingly both and Cl− anions are doped in the polymeric chain (Buzarovska et al., 2001; Sayyah et al., 2009, 2010; Nakanishi and Solomon, 1977; Athawale et al., 1999). But no evidence for the formation of new bonds between the polymer chain and the doped anions was observed which means that the anions doped in the polymeric chains exist in the ionic form (Athawale et al., 1999) as shown in Scheme 1. The weak absorption band at 760 cm−1 confirms the excess C⚌N groups in quinonoid form of P(2-ABT), where the normal C⚌N bands in both 2-ABT and P(2-ABT) appear in the normal range from 1530 to1630 cm−1 in both cases. The medium absorption band appearing at 626.8 cm−1 in case of 2-ABT appears at 618 cm−1 in case of P(2-ABT) which could be attributed to C–S symmetric stretching vibration. Two strong absorption bands appearing at 718.3 and 741.4 cm−1 in case of monomer appears as two weak absorption bands at 721.2 and 760 cm−1 in case of polymer which could be attributed to the asymmetric stretching vibration of C–S bond. A medium absorption band appearing at 3055 cm−1 in case of monomer, appears as a broad absorption band at 3066.3 cm−1 in case of polymer which could be attributed to C-H stretching vibration of benzene ring.
The UV–vis spectra of 2-ABT monomer and its homopolymer are represented in Fig. 11. The spectra show the following absorption bands:
-
In case of 2-ABT, four absorption bands appear at λmax = 209–329 nm, which may be attributed to π–π∗ transition (E2 band) of the benzene ring and the β-band (A1g to B2u).
-
In case of P(2-ABT) Sayyah et al., 2011, four absorption bands appear at λmax = 207–315 nm which may be attributed to π–π∗ transition. Also an absorption band appears in the visible region at λmax = 463 nm, which may be due to the high conjugation of the benzene and thiazole rings in the polymeric chains and confirm the formation of the quinonoid structure.
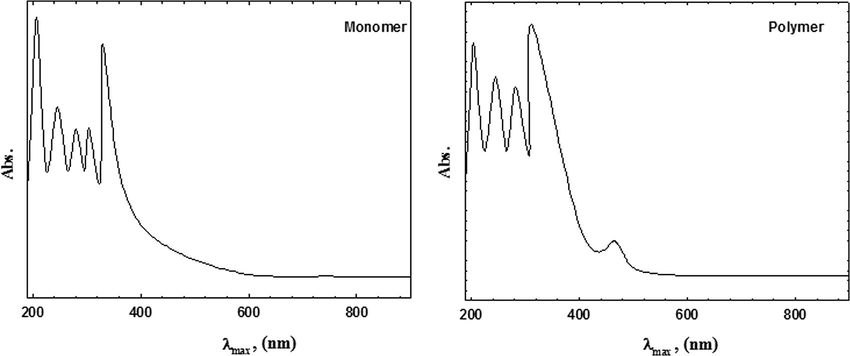
- UV–vis spectra of 2-ABT monomer and the prepared polymer.
The specific conductivity of the P(2-ABT) was measured on a compressed pellet made by compressing the powder polymer. The conductivity was measured with direct current from 5 to 25 V –in this range the sample showed Ohmic behavior– and was found to be 2.8 × 10⁻⁷ S cm−1.
3.4 Surface morphology
X-ray diffraction (XRD) analysis was carried out to determine the occurrence of complexation and whether the polymer is amorphous or crystalline (Athawale et al., 1999). To substantiate these results, Scanning electron microscopy SEM was performed. SEM is the most versatile and widely used tools for the study of surface morphology (Sivakumar et al., 2006). The surface morphology will be correlated with results from X-ray diffraction.
In most conditions (Sayyah et al., 2011), homogeneous, smooth, brown and well adhering P(2-ABT) films were electrodeposited on platinum electrode surface. The surface is composed of tubular or fibrillar elongated crystals with crystalline structure. The crystalline structure contributes to the peaks in the XRD pattern of polymer at 2θ angle equal to 18.88 and 21.26 (Yahya et al., 2006; Ritthidej et al., 2002). The pattern of polymer is shown in Fig. 12A and B.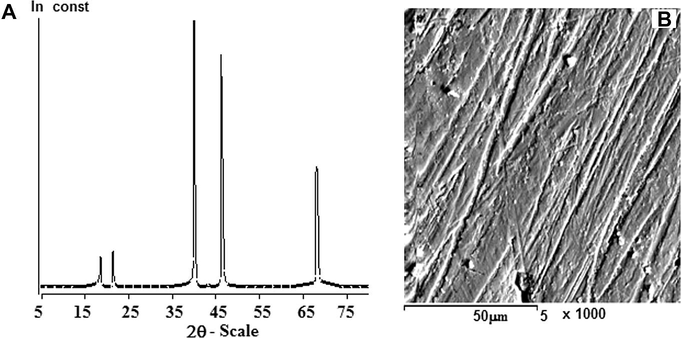
(A) X-ray diffraction pattern of poly (2-ABT). (B) The picture of scanning electron microscope of poly (2-ABT).
The film thickness is measured using the cross sectional SEM images process as shown in Fig. 13. The film deposited on Pt using one to four cycles is not good for measuring thickness (irregular and not uniform shape). Using five cycles the amount of polymer increase and thickness is measured easily. From Fig. 12, the shape looks like the bundle of the chemical fibers or tubular structure as found also in Fig 10. The thickness is small ∼4 μm.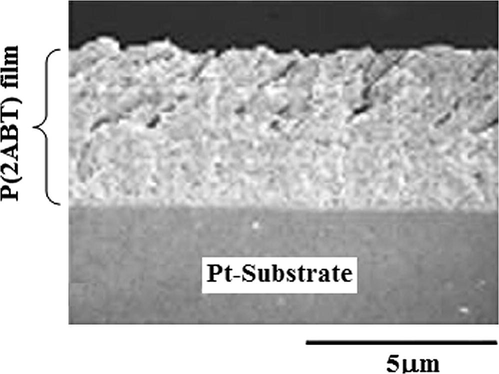
Cross sectional SEM image of P(2ABT) film formed at Pt-substrate at optimum condition of preparation (no. of cycles 5).
4 Conclusion
In conclusion the above data reveals the following:
-
The initial rate of electropolymerization reaction of 2-ABT on platinum electrode is relatively low. The fraction of the dissolved product may be strongly dependent on temperature and monomer or HCl concentrations.
-
The orders of the electropolymerization reaction of 2-ABT on platinum electrode are 1.32, 1.19, and 1.08 with respect to HCl, monomer, and electrolyte concentration respectively.
-
The apparent activation energy is found to be 82.91 kJ mol−1.
-
The prepared P(2-ABT) shows a smooth surface, well adhered on Pt surface with uniform thickness and crystalline in nature with small thickness ∼4 μm.
-
From cyclic voltammetry studies, it is clear that the cyclic voltammogram consists of two irreversible anodic peaks at +90 and +1320 mV vs. SCE, and one reactive peak on reversing the potential beyond +500 mV vs. SCE.
-
The electrodepositing of the polymer film on platinum electrode may be described partially by a diffusion-controlled process with diffusion coefficient 2.68 × 10⁻¹⁰ m2 s−1.
-
The suggested mechanism confirms with the experiments results and analysis and could be used for the electrosynthesis of P(2-ABT) at Pt electrode using the same mentioned parameters.
References
- Photoemission and conductivity measurement of poly(N-methyl aniline) and poly(N-ethyl aniline) films. J. Appl. Polym. Sci.. 1999;74(5):1286-1292.
- [Google Scholar]
- Aquatic environmental chemistry of 2-(thiocyanomethylthio) benzothiazole and related benzothiazoles. Environ. Toxicol. Chem.. 1992;11:1153-1168.
- [Google Scholar]
- Anti-candida activity of four antifungal benzothiazoles. FEMS Microbiol. Lett.. 1993;112:329-334.
- [Google Scholar]
- Electrochemical synthesis of poly(2-methyl aniline): electrochemical and spectroscopic characterization. J. Serb. Chem. Soc.. 2001;66(1):27-37.
- [Google Scholar]
- Characterization of bacteria capable of degrading soil-sorbed biphenyl. Bull. Environ. Contam. Toxicol.. 2003;70:775-868.
- [Google Scholar]
- Solid phase combinatorial synthesis of benzothiazoles and evaluation of topoisomerase II inhibitory activity. Bioorg. Med. Chem.. 2006;14:1229-1235.
- [Google Scholar]
- 2-(4-Aminophenyl) benzothiazole: a potent and selective pharmacophore with novel mechanistic action towards various tumour cell lines. Mini-Rev. Med. Chem.. 2006;6(6):633-637.
- [Google Scholar]
- Hartley, D., Kidd, H. The Agrochemical Handbook, The Royal Society of Chemistry, Nottingham, 1987.
- Occurrence of benzothiazoles in municipal wastewater their fate in biological. Water Sci. Technol.. 2003;50(5):203-208.
- [Google Scholar]
- Determination of benzothiazoles from complex aqueous samples by liquid chromatography–mass spectrometry following solid-phase extraction. J. Chromatogr. A. 2004;1058(1–2):81-88.
- [Google Scholar]
- Occurrence sources and fate of benzothiazoles in municipal wastewater treatment plants. Environ. Sci. Technol.. 2005;39(10):3792-3798.
- [Google Scholar]
- Synthesis of polycatecol with electrochemical activity and its properties. Chin. J. Polym. Sci.. 2002;20(6):517-524.
- [Google Scholar]
- The effect of chloride on the electrooxidation of adsorbed CO on polycrystalline platinum electrodes. J. Electroanaly. Chem.. 2003;548(22):109-119.
- [Google Scholar]
- Electrocatalytic determination of hydrazine using glassy carbon electrode with calmagates. Anal. Bioanal. Electrochem.. 2009;1(3):224-338.
- [Google Scholar]
- The kinetic behavior for the electrochemical polymerization of aniline in aqueous solution. Synth. Met.. 1997;88(3):249-254.
- [Google Scholar]
- Nakanishi, K., Solomon, P.H. Infrared Absorption Spectroscopy, Holden – Day, San Francisco, 1977.
- Theory and application of cyclic voltammetry for measurement of electrode reaction kinetics. Anal. Chem.. 1965;37(11):1351-1355.
- [Google Scholar]
- Effect of chloride ions on the electrooxidation at low potentials of dissolved carbon monoxide on platinum. J. Electroanal. Chem.. 2001;511(2–1):39-45.
- [Google Scholar]
- A cathode ray polarograph. II The current voltage curves. Trans. Faraday Soc.. 1948;44:327-338.
- [Google Scholar]
- Polar pollutants entry into the water cycle by municipal wastewater: a European perspective. Environ. Sci. Technol.. 2006;40(17):5451-5458.
- [Google Scholar]
- Electrochemistry. New York: John Wiley & Sons; 1985.
- Moist heat treatment on physicochemical change of chitosan salt films. Int. J. Pharm.. 2002;232(1–2):1-22.
- [Google Scholar]
- Electropolymerization of pyrrole and characterization of the obtained polymer films. J. Appl. Polym. Sci.. 2003;90(7):783-1792.
- [Google Scholar]
- Electropolymerization of 2-amino-4-phenylthiazole and characterization of the obtained polymer films. Int. J. Polym. Mater.. 2004;53(11):941-958.
- [Google Scholar]
- Kinetic studies on the electrochemical polymerization of 3-chloroaniline and characterization of the obtained polymer films. J. Appl. Polym. Sci.. 2004;94(3):941-953.
- [Google Scholar]
- electrocopolymerization kinetics of a binary mixture of 3-chloroaniline 2-amino-4-phenylthiazole and characterization of the obtained block copolymer films. J. Appl. Polym. Sci.. 2005;97(5):2076-2087.
- [Google Scholar]
- Electrochemical polymerization of 3-methoxyaniline and characterization of the obtained polymer. Int. J. Polym. Mater.. 2006;55(5):339-357.
- [Google Scholar]
- Electropolymerization of o-aminobenzoic acid and characterization of the obtained polymer films. Int. J. Polym. Mater.. 2006;55(1):37-63.
- [Google Scholar]
- Electrochemical polymerization of 2-amino-4-(4-methoxyphenyl)thiazole and characterization of the obtained polymer. Int. J. Polym. Mater.. 2006;55(2):9-101.
- [Google Scholar]
- Electropolymerization kinetics of o-aminophenol and characterization of the obtained polymer films. J. Appl. Polym. Sci.. 2006;99(6):3093-3109.
- [Google Scholar]
- Electrocopolymerization of a binary mixture of 2-chloroaniline and 2-amino-4-(4-methoxyphenyl) thiazole. Int. J. Polym. Mater. Sci.. 2007;56(7):663-686.
- [Google Scholar]
- Electrocopolymerization of a binary mixture of pyrrole and 2-amino-4-phenylthiazole: Kinetic studies, copolymer structure, and applications as corrosion protection for mild steel in acid medium. J. Appl. Polym. Sci.. 2007;103(6):4047-4058.
- [Google Scholar]
- Electropolymerization of o-phenylenediamine on Pt-electrode from aqueous acidic solution: kinetic, mechanism electrochemical studies and characterization of the polymer obtained. J. Appl. Polym. Sci.. 2009;112(6):3406-3695.
- [Google Scholar]
- Electropolymerization of p-phenylenediamine on Ptelectrode from aqueous acidic solution: Kinetics mechanism electrochemical studies and characterization of the polymer obtained. J. Appl. Polym. Sci.. 2010;117(2):943-952.
- [Google Scholar]
- Electropolymerization of a binary mixture of o-phenylenediamine and 2-aminobenzothiazole on Pt-electrode from aqueous acidic solution: kinetic, mechanism, electrochemical studies and characterization of the polymer obtained. J. Appl. Polym. Sci.. 2011;119(1):252-264.
- [Google Scholar]
- Oscillographic polarography with periodical triangular voltage. Collect. Czech. Chem. Commun.. 1948;13:349-377.
- [Google Scholar]
- Electrochemical studies on [(1−x)PVA–xPMMA] solid polymer blend electrolytes complexed with LiBF4. Mater. Chem. Phys.. 2006;97(2–3):330-336.
- [Google Scholar]
- The effect of halide ion impurities and Nafion on electrooxidation of CO on platinum. Solid State Ionics. 2005;176(19–22):1759-1763.
- [Google Scholar]
- Electrooxidation of 2,4-dichlorophenol and other polychlorinated phenols at a glassy carbon electrode. Electrochim. Acta. 2002;47(15):2399.
- [Google Scholar]
- Determination of benzotriazole corrosion inhibitors from aqueous environmental samples by liquid chromatography–electrospray ionization-tandem mass spectrometry. Anal. Chem.. 2005;77(22):7415-7420.
- [Google Scholar]
- Comparison of sulfonated and other micropollutants removal in membrane bioreactor and conventional wastewater treatment. Water Res.. 2007;41(4):935-945.
- [Google Scholar]
- XRD and surface morphology studies on chitosan-based film electrolytes. J. Appl. Sci.. 2006;6(15):3150-3154.
- [Google Scholar]


