

Translate this page into:
Development, validation and comparison of two stability-indicating RP-LC methods using charged aerosol and UV detectors for analysis of lisdexamfetamine dimesylate in capsules
⁎Corresponding author. Tel./fax: +55 51 33085313. gracielacarlos@ig.com.br (Graciela Carlos)
-
Received: ,
Accepted: ,
This article was originally published by Elsevier and was migrated to Scientific Scholar after the change of Publisher.
Peer review under responsibility of King Saud University.
Abstract
Two new stability-indicating liquid chromatographic methods using two detectors, an ultraviolet (UV) and a charged aerosol detector (CAD) simultaneously connected in series were validated for the assessment of lisdexamfetamine dimesylate (LDX) in capsule. The method was optimized and the influence of individual parameters on UV and CAD response and sensitivity was studied. Chromatography was performed on a Zorbax CN column (250 mm × 4.6 mm, 5 μm) in an isocratic elution mode, using acetonitrile and 20 mM ammonium formate at pH 4.0 (50:50, v/v) as mobile phase and UV detection at 207 nm. The developed method was validated according to ICH guidelines and the parameters’ specificity, limit of detection, limit of quantitation, linearity, accuracy, precision and robustness were evaluated. CAD is designated to be a non-linear detector in a wide dynamic range, however, the method was linear over the concentration range of 70–130 μg mL−1 in both detectors. The method was precise and accurate. Robustness study was performed by a Plackett–Burman design, delivering results within the acceptable range. Neither the excipients nor the degradation products showed interference in the method after studies of specificity as well as under stress conditions. The results of the LC-UV and LC-CAD methods were statistically compared through ANOVA and showed no significant difference (p > 0.05). Both proposed methods could be considered interchangeable and stability-indicating, and can be applied as an appropriate quality control tool for routine analysis of LDX in capsule.
Keywords
Lisdexamfetamine dimesylate
Stability-indicating
Liquid chromatography
Charged aerosol detector
Stress testing
Plackett–Burman

1 Introduction
Attention-deficit/hyperactivity disorder (ADHD) is the most prevalent neurobehavioral disorder in childhood (American Academy of Pediatrics, 2000) and it is characterized by symptoms such as inattention, impulsivity and hyperactivity that can impact on many aspects of behavior and performance at school and at home (American Psychiatric Association, 1994). The prevalence of the disorder has been investigated worldwide. Different prevalence rates reflect methodological differences (population sampled, study design, source of information, age, diagnostic criteria used, or how they are applied) more than cultural differences in diagnosis of the disorder. Using criteria of DSM-IV, the ADHD affects 3–6% of children around the globe (Faraone et al., 2003; Rohde et al., 1999).
Stimulants are generally considered as first-line medication for the treatment of ADHD (Banaschewski et al., 2004). Nevertheless, short-acting stimulants need of multiple daily dosing and concerns about their abuse potential have led to the development of alternative agents (Pliszka and The AACAP Work Group on Quality Issues, 2007). Lisdexamfetamine dimesylate (LDX) (Fig. 1), the first member of a new class of prodrug stimulants, was developed with the objective to obtain long term action for the treatment of ADHD in children and adults, improving adherence and lowering abuse potential (Jasinski and Krishnan, 2009; Mickle et al., 2006). LDX consists of d-amphetamine covalently bound to the essential amino acid l-lysine. After oral administration, the pharmacologically active d-amphetamine is released when the covalent bond is cleaved during metabolism (Mickle et al., 2006).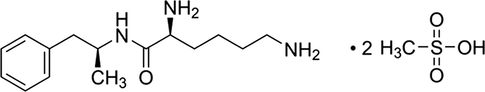
Chemical structure of lisdexamfetamine dimesylate.
Quality, safety and effectiveness are the most important attributes of pharmaceutical products. Therefore, the development of analytical methodology to quality control has a fundamental role since it provides an evaluation of the drug regarding its identity, strength, purity and stability during shelf life (Jain and Basniwal, 2013).
High-performance liquid chromatography (HPLC) is the technique most commonly used for the quantitation of drugs in formulation. Many detector types are usually combined with a preliminary separation by HPLC (Watson, 2005). Ultraviolet (UV) detection is the most widely used detection method for HPLC due to its high sensitivity, broad linear range, easy operation, relatively low cost and other advantages, as well as its compatibility with the most mobile phase solvents in both isocratic and gradient elution modes (Shaodong et al., 2010; Vervoort et al., 2008). The charged aerosol detector (CAD) was introduced by Dixon and Peterson (Dixon and Peterson, 2002) and it belongs to the group of universal detectors, which operate independently of the physicochemical and spectral properties of non-volatile analytes and many semivolatile analytes. This includes those without chromophores and those that do not ionize, which can be detected routinely with charged aerosol detector, thus providing a consistent response (Dixon and Peterson, 2002; Nováková et al., 2009). CAD system has also other positive characteristics such as a broad dynamic response range with high sensitivity, good precision for a wide range of analytes, and a simple and reliable operation (Gamache et al., 2005). Gas inlet pressure and the signal output range are the few controllable parameters that CAD merely requires (Vehovec and Obreza, 2010).
There are not at the moment in the reviewed literature analytical methods available for the quantitative analysis of LDX for raw material and pharmaceutical products. There are some studies describing the determination of LDX and its metabolite in biological fluids using a HPLC coupled to tandem mass spectrometry (LC–MS–MS) (Biederman et al., 2007; Boellner et al., 2010; Ermer et al., 2012, 2011a, 2011b, 2010; Jasinski and Krishnan, 2009; Krishnan and Moncrief, 2007; Krishnan and Zhang, 2008; Krishnan et al., 2008; Pennick, 2009, 2010). However, LC–MS–MS require more expensive equipment making it less suitable for routine analysis of LDX capsules.
As a way of contributing to its improved quality control and ensuring therapeutic efficacy of LDX, this study aims for the development and validation of two new stability-indicating liquid chromatographic methods for the determination of LDX in capsules using UV and CAD detectors. The results generated were compared.
Forced degradation studies provide data to support the identification of possible degradants, degradation pathways and intrinsic stability of the drug molecule and validation of stability indicating analytical procedures (ICH, 2003). As CAD is a universal detector, it was used to verify whether CAD could have advantages over UV detector for the control of LDX degradation products.
2 Materials and methods
2.1 HPLC instrumentation
Assays were carried out using a Shimadzu LC system (Kyoto, Japan), equipped with a LC-20AT pump, DGU-14A degasser, CTO-10A column oven, SPD-10A UV detector and Corona CAD detector from ESA Bioscience, Inc. (Chelmsford, MA, USA), were connected in series.
Peak purity was assessed using a Shimadzu chromatographic system (Kyoto, Japan) equipped with LC-20AT pump, SPD-M10A VP – diode array detector, DGU-20A3 degasser, CTO-10A column oven, and a Rheodyne 7725i manual injector were used.
2.2 Materials
LDX standard was obtained in our laboratory. Modified crystallization technique was used to extract LDX standard from capsules. LDX standard was identified by infrared spectroscopy, 1H NMR, 13C NMR and LC-ESI-QTOF and its purity was determined by mass balance (99.56%). The purity found can be considered satisfactory according to WHO (2006). The capsules (Venvanse™) labeled to contain 70 mg of the LDX were purchased at the local market. HPLC-grade acetonitrile (R1) was obtained from Tedia (Fairfield, OH, USA). All chemicals used were of pharmaceutical or special analytical grade.
2.3 Chromatographic conditions
The chromatography was performed using a Zorbax CN column, 250 mm × 4.6 mm, 5 μm (Agilent Technologies, USA) in the isocratic elution mode constituted of the acetonitrile and 20 mM ammonium formate at pH 4.0, adjusted with 2 M formic acid (50:50, v/v). The flow rate was 1.0 mL min−1 and the column temperature, 25 °C. The buffer was filtered through a 0.45 μm membrane filter (Millipore, Bedford, MA, USA). The injection volume was 20 μL for both standard and samples. Detection was performed using a CAD at a gas pressure of 35 psi in the 100 pA detection range and the UV detector was set at 207 nm. The output signal was processed using Chromeleon 6.8 (Dionex Corporation) software.
2.4 Preparation of reference solution
The stock solution of LDX was prepared by dissolving the respective standard substance in methanol to obtain a concentration of 0.5 mg mL−1. The stock solution was stored under refrigeration (5 °C), protected from light, and daily diluted to an appropriate concentration in the mobile phase to yield final concentrations of 70, 80, 90, 100, 110, 120 and 130 μg mL−1.
2.5 Preparation of sample solutions
To prepare the sample solution, twenty capsules containing 70 mg of LDX were opened and the contents were mixed. An appropriate amount was transferred into an individual 50 mL volumetric flask, diluted to volume with methanol, and filtered through a 0.45 mm membrane filter (Millipore, Bedford, MA, USA), obtaining the final concentration of 0.5 mg mL−1 of the active pharmaceutical ingredient. This solution was diluted to the final concentration of 100 μg mL−1 in mobile phase.
2.6 Validation
The methods using UV and CAD detectors were validated for linearity, specificity, precision, accuracy, and robustness following the International Conference on Harmonization (ICH) requirements (ICH, 2005). The robustness study was performed by a Plackett–Burman design.
2.6.1 Linearity
Linearity was determined by constructing three analytical curves, in three different days, each one with seven reference concentrations of LDX in the range of 70–130 μg mL−1 prepared by the dilution of appropriate amounts of standard stock solution with mobile phase. To verify the reproducibility of the detector response, triplicate 20 μL injections were made for the standard solution at each concentration level. The peak areas were plotted against the respective concentrations to obtain the analytical curve. The results were tested by analysis of variance (ANOVA) and the goodness of regression model was evaluated by correlation coefficient regression significance, lack-of-fit and residuals analysis. Residuals were examined to verify normality, no autocorrelation and homoscedasticity (equality or homogeneity of variance).
2.6.2 Specificity
The method specificity was assessed through the influence of excipients by comparing the chromatograms obtained from LDX and the blank composed by excipients mixture (microcrystalline cellulose, croscarmellose and magnesium stearate) present in capsule formulation, without the drug.
To assess the stability-indicating capability of the method by UV and CAD detectors, LDX standard and drug product solutions (500 μg mL−1) were subjected to stress testing the same manner. Acidic, basic, thermal, oxidative, and photolytic conditions were evaluated.
Hydrolytic studies: Acidic conditions were obtained by treating the solutions with 1 M formic acid at room temperature (20 ± 2 °C) for 24 h and under reflux, in silicone bath at 100 °C for 3 h. The studies in alkaline conditions were done similarly using ammonium hydroxide.
Oxidative studies: Oxidative conditions were obtained by treating the solutions with 3%, 5% and 8% hydrogen peroxide at room temperature for 24 h and 8.0% hydrogen peroxide, under reflux, in silicone bath at 100 °C for 3 h.
Photolytic studies: Solutions were submitted to photodegradation in a UV light chamber (1.0 × 0.17 × 0.17 m) at long wave ultraviolet light (352 nm) for 24 h and short wave ultraviolet light (254 nm) for 8 h at room temperature. The chamber wall was covered with mirrors, in order to distribute the light uniformly and equipped with a UV-A lamp (Blacklight blue lamp – Orion, 30 W, 130 V– 352 nm) and UV-C lamp (Light express LE UV, 30 W–254 nm).
Thermal studies: Thermal degradation was evaluated subjecting the solutions to 60 °C for 24 h and to 100 °C for 6 h, under reflux and protected from light.
In every case control solutions without the stressing agents were evaluated.
Before the solutions were assessed in HPLC, they were diluted with mobile phase to 100 μg mL−1 and pH was adjusted to 4.0 with ammonium hydroxide and formic acid on samples subjected to acid and alkaline conditions, respectively.
Peak purity was assessed using HPLC with diode array detector. Equipment and chromatographic conditions used were described in Sections 2.1 and 2.3.
2.6.3 Precision
The determination of repeatability of the method (intraday) and intermediate precision (interday) were evaluated. Repeatability was calculated by carrying out six independent samples containing 100 μg mL−1 of LDX, prepared as described in Section 2.5, during the same day, under the same experimental conditions. Intermediate precision was studied by performing the same procedure on 3 different days. The relative standard deviations (RSD) of the peaks were calculated.
2.6.4 Accuracy
The accuracy of the method was performed by adding known amounts of reference standard solution in the sample solution and it was determined at three concentrations (80, 100 and 120 μg mL−1) corresponding to 80%, 100%, and 120% of the nominal analytical concentration. Each level was made in triplicate. Accuracy was calculated as the percentage of the reference standard recovered.
2.6.5 Limit of detection and limit of quantitation
Limit of detection (LOD) and limit of quantitation (LOQ) for LDX were evaluated using the mean values of three independent analytical curves. Detection and quantitation limits were determined by a linear regression model, using the following equations: LOD = (3.3 × σ)/S; LOQ = (10 × σ)/S, where 3.3 and 10 correspond to the factors of detection and quantitation limit, respectively; σ is the standard deviation of the intercept and S is the slope obtained in the linearity study of the method (ICH, 2005).
2.6.6 Robustness
ICH described robustness of an analytical procedure as a measure of its capacity to remain unaffected by small, but deliberate variations in method parameters and provides an indication of its reliability during normal usage [28]. The ability of methods LC-CAD and LC-UV to perform effectively was measured employing a Plackett–Burman design to show their robustness. Plackett–Burman design is the so-called two-level screening design which allows screening a relatively large number of factors in a relatively small number of experiments (Vander Heyden et al., 2001). The factors investigated were buffer concentration and pH (ammonium formate), temperature of column oven, organic phase concentration (acetonitrile) and flow rate. Each factor consists of one high and one low levels. The factors’ levels investigated in robustness evaluation are reported in Table 1. The factors combinations were calculated through software Minitab® (v.16) in 12 experiments and the results were assessed using the same software. The methods were evaluated through assay of LDX capsule, using standard solution in the same experimental condition. In a manner to lessen the effects of extraneous or uncontrollable conditions that can impact the results of an experiment, the design was randomized regarding the order in which experimental runs were performed.
Factors
Levels
Optimal
Low
High
Flow (mL min−1)
1
0.9
1.1
Organic concentration (%)
50
47
53
Ammonium formate (mM)
20
18
22
pH
4.0
3.8
4.2
Temperature (°C)
25
20
30
2.7 Comparison of methods
Method comparison experiment should be considered when one wants to evaluate the equivalence of different methods that are used for the same intent. According to USP, the comparison of two methods determines whether their average results or their variability differs by an amount that is deemed important. Method equivalence could be assessed by the analysis of precision, whether the two methods have “comparable” precision (United States Pharmacopoeia, 2011).
Then, UV and CAD RP-LC methods were compared with each other by applying paired Student’s t test for comparing averages and significant differences were evaluated at the 95% confidence level. According to Borman et al. (2009), the results are paired if the same sample is analyzed in different methods and they are independent if different samples are prepared for each method. Thereby, our data were considered paired because we used the same sample for UV and CAD detectors since they are connected in series.
3 Results and discussion
3.1 Optimization of chromatographic conditions
Chromatographic conditions were optimized to provide two simple, rapid and reliable HPLC methods to analyze LDX in capsules using UV and charged aerosol detectors. Various experiments were carried out aiming to optimize both the stationary and mobile phases. Three kinds of stationary phases were evaluated, C18, C8 and CN. The best resolution for LDX peak was obtained with a Zorbax CN column (250 mm × 4.6 mm, 5 μm). This is probably due to the fact that LDX is a small polar amine drug and it was not satisfactory retained in the C8 and C18 columns because of their nonpolar characteristics. The CN column is a polar bonded-phase column packing used for normal or reversed-phase chromatography.
During the optimization of the mobile phase, we started from the following premise about CAD detector which could influence its response: Volatile components and greater organic content are required. This means that CAD is dependent on the mobile-phase composition choice (Górecki et al., 2006; Vervoort et al., 2008). Thus, an increase in the organic content of the mobile phase leads to an increase in the transport efficiency of the nebulizer resulting in an increase of analyte amount delivered for detection and consequently higher response is observed (Almeling et al., 2012; Cobb et al., 2001; Cohen et al., 2012; Górecki et al., 2006; Vervoort et al., 2008). According to this premise, several mobile phases were tried using various proportions of different aqueous phases and organic modifiers. The volatile salts, ammonium formate and ammonium acetate were tested (5, 10, 20, 25 and 40 mM), but ammonium formate showed to be more adequate because of the improved detector UV sensitivity. LDX is an ionizable drug, then to avoid more than one ionizable form, the mobile phase was used at pH 4.0. The evaluated temperatures (25 °C, 30 °C and 35 °C) did not show differences in the method. The mobile phase consisting of a mixture of 20 mM ammonium formate at pH 4.0 (adjusted with formic acid) – acetonitrile (50:50, v/v) was chosen because it allowed an adequate run time, provided sufficient selectivity and sensitivity, and LDX was properly analyzed in the presence of its major degradation products. The peak of LDX was well resolved with retention time of 4.6 min.
3.2 Method validation
3.2.1 Specificity
Excipients present in LDX capsules did not interfere in the analysis using both charged aerosol and UV detectors, as shown in Fig. 2.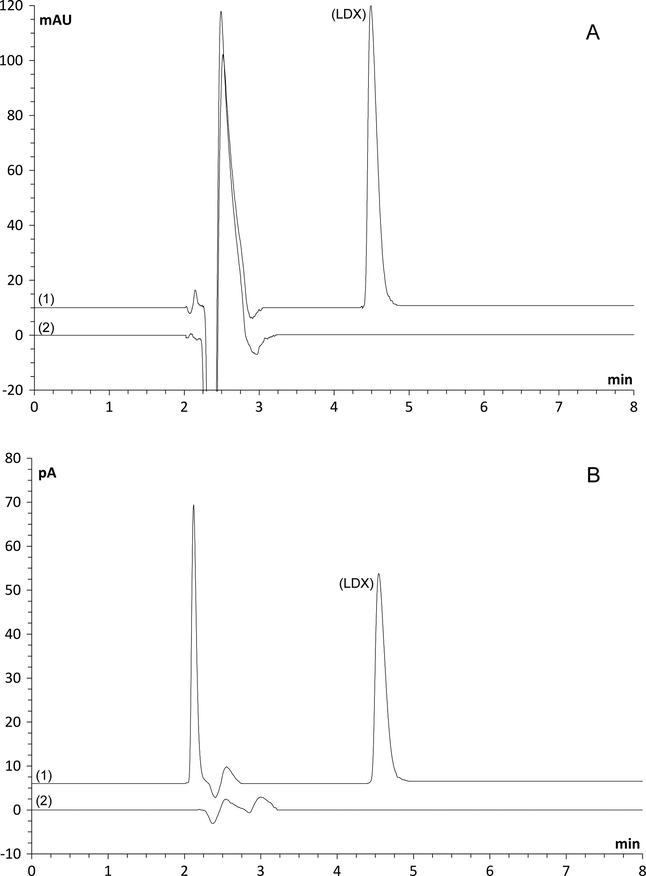
Influence of excipients: Chromatograms of ultraviolet (A) and charged aerosol (B) detectors. (1) Lisdexamfetamine dimesylate reference solution 100 μg mL−1; (2) placebo.
The specificity of the method was also determined by subjecting standard and sample solutions to forced degradation studies by acid and alkaline hydrolysis, oxidative, photolytic and thermal conditions. Stress testing carried out with pharmaceutical product gave the same results of LDX standard.
When LDX was subjected to heat, UV 352 nm, and 3%, 5% and 8% hydrogen peroxide at room temperature no additional peaks were observed nor a decrease of the area of LDX. After acid and alkaline conditions, no degradation peaks were detected but the area of LDX decreased when formic acid and ammonium hydroxide (1 M, reflux, silicone bath at 100 °C, 3 h) were used. For acid conditions a degradation extent of 5.5% for both CAD and UV was observed and alkaline conditions showed a degradation extent of 5.3% and 5.2%, for UV and CAD, respectively. Under oxidative conditions (8% H2O2, reflux, silicone bath at 100 °C, 3 h), the decrease in LDX peak area was noticed (about 30%) and two additional peaks were observed (3.8 and 4.0 min) in UV and charged aerosol detectors as shown in Fig. 3. Under photolytic conditions (254 nm, 8 h), three secondary peaks at retention times 3.2, 3.32 and 3.46 min were shown with UV detector (Fig. 4A) and three peaks at retention times 3.38, 3.47 and 3.56 min were observed with CAD (Fig. 4B). Peaks 1, 2 and 3 in Fig. 4A and B could be considered the same, because the detectors are connected in series. The decrease in LDX peak area was about 22% in both detectors.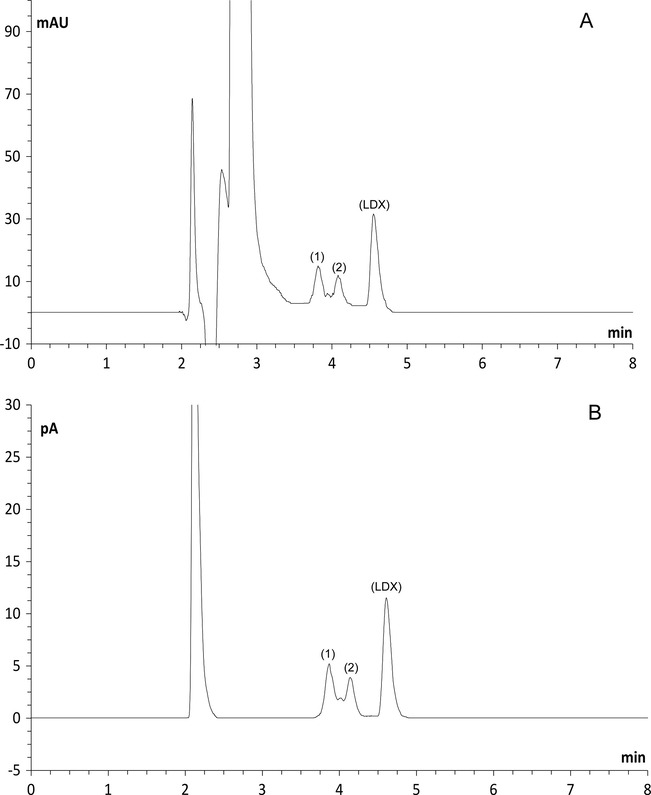
Chromatograms obtained after oxidation (8% H2O2, reflux, silicone bath at 100 °C, 4 h): (A) ultraviolet and (B) charged aerosol detectors. Peaks (1) and (2) are degraded forms and peak (LDX) is lisdexamfetamine dimesylate.
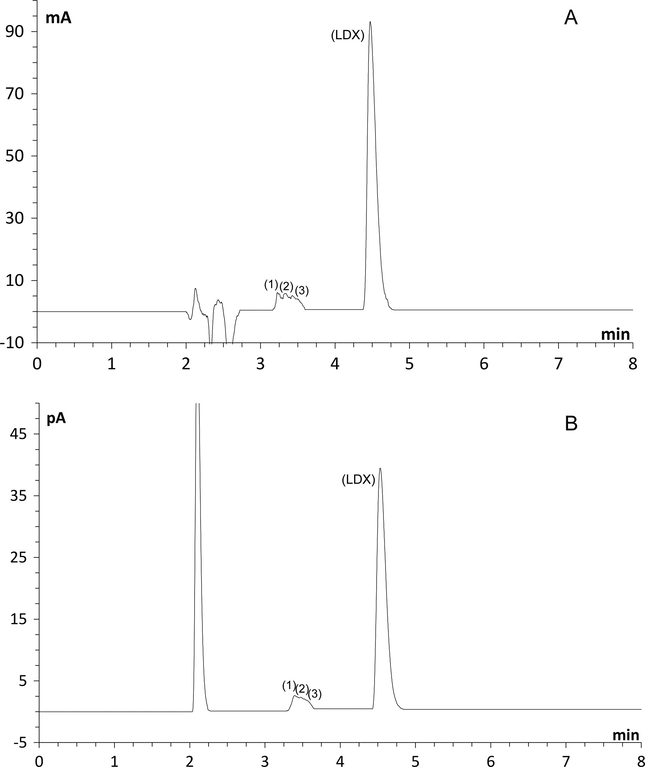
Chromatograms after exposure to UV light – 254 nm, 8 h: (A) ultraviolet detector (B) Charged aerosol detector. Peaks (1), (2) and (3) are photodegraded forms, peak (LDX) corresponds to lisdexamfetamine dimesylate.
Considering that LDX was degraded only under strong stress conditions, it can be considered as being very stable under normal storage conditions.
LDX peak purity (standard solution) after stress conditions was evaluated using a DAD detector and the same chromatographic conditions. As shown in Table 2, no interference from the impurities was observed at the detection wavelength (207 nm). The active ingredient could be accurately measured without interference, therefore the methods could be considered specifics and stability-indicating.
Stress condition
Peak Purity
Control sample
0.9999
Acid hydrolysis (1.0 M, reflux, silicone bath at 100 °C, 3 h)
0.9999
Alkaline hydrolysis (1.0 M, reflux, silicone bath at 100 °C, 3 h)
0.9999
Photolytic degradation (254 nm, 8 h)
1.0000
Oxidation (8% H2O2, reflux, silicone bath at 100 °C, 3 h)
0.9999
3.2.2 Linearity, LOD and LOQ
The calibration curves for LDX for UV and CAD were constructed by plotting the peak areas versus concentration. A linear correlation between the concentration and the detector response was found in the 70–130 μg mL−1 range for both detectors. Although CAD is a concentration-dependent detector, the relationship between the amount of analyte and signal could not be directly linear over a wide concentration range (Dixon and Peterson, 2002; Górecki et al., 2006; Vehovec and Obreza, 2010). However, there are reports in the literature describing that the response over a narrow range is linear (Bernardi et al., 2013; Holzgrabe et al., 2011; Stypulkowska et al., 2013), corroborating the linearity found in our narrow range. ANOVA was used to confirm the linearity. The correlation coefficient was 0.9999 for UV and 0.9997 for CAD and the representative linear regression equation was y = 0.3758x − 2.1089 for UV and y = 0.1339x − 2.1802 for CAD. ANOVA results demonstrated significant linear regression (p < 0.05) and the value of Fcalculated > Fcritical (95% confidence interval) for both detectors demonstrates the significance of the regression and confirms the linearity over the working range studied.
Residuals were evaluated with respect to the normality (Kolmogorov–Smirnov and Anderson–Darling tests), no autocorrelation in regression residuals (Durbin–Watson statistic test) and the homogeneity (Bartlett’s test). Residual results showed that calibration curves of LDX for CAD and UV followed a normal distribution, were independent and homoscedastic (Table 3).
Parameter
Statistical test
Calculated value
LC-CAD
LC-UV
Regression
ANOVA
p-value1
4.72E−20
1.09E−24
ANOVA
F2
69,670.66
1,817,672.37
Lack-of-fit
ANOVA
p-value3
0.678
0.7
Autocorrelation
DW (Durbin–Watson)
D-value4
2.24
1.56
Homoscedasticity
Bartlett
p-value3
0.931
0.185
Normality test
Kolmogorov–Smirnov
p-value
>0.150
>0.150
Anderson–Darling
p-value
0.316
0.250
Limit of detection (LOD) and quantification (LOQ) were calculated using the linear equations presented above. LOD calculated was 0.24 and 1.89 μg mL−1, respectively, for UV and CAD, and the LOQ calculated was 0.78 and 6.3 μg mL−1, respectively, for UV and CAD which indicates the adequate sensitivity of the methods.
3.2.3 Precision and accuracy
The results for repeatability (intraday) and intermediate precision (interday) of methods are presented in Table 4. They were found to be much smaller than recommended by ICH for both CAD and UV (value ⩽2.0%) (ICH, 2005).
Sample
CAD
UV
% Label claim
% Label claim
Day 1
Day 2
Day 3
Day 1
Day 2
Day 3
1
100.34
99.99
99.83
99.73
100.37
99.94
2
100.36
100.39
99.27
100.78
100.19
99.56
3
99.87
99.85
99.81
100.87
100.18
100.25
4
99.72
100.13
99.62
100.41
100.68
99.58
5
99.58
100.46
99.44
99.63
99.88
100.33
6
101.30
99.81
99.32
100.24
100.33
100.22
Mean (6)a
100.20
100.11
99.55
100.28
100.27
99.98
% RSDb
0.63
0.27
0.24
0.52
0.26
0.31
Mean (18)c
99.95
100.18
% RSDb
0.47
0.39
The results obtained for accuracy are presented in Table 5. LDX mean recovery for the three levels was 100.39 ± 0.39 for UV and 100.50% ± 0.93 for CAD. Based on these findings the methods showed to be precise and accurate.
Nominal
Level
% Recoverya
% Meanb
%RSDc
% RSDc
CAD
80
101.59 ± 0.21
100.50 ± 0.93
100
100.29 ± 0.91
120
99.63 ± 0.18
UV
80
100.11 ± 0.40
100.39 ± 0.39
100
100.22 ± 0.47
120
100.85 ± 0.11
3.2.4 Robustness
Robustness response is showed through a Pareto chart of the effects that determine the magnitude and the importance of each effect. The chart displays in the bars the absolute value of the effects and draws a vertical line on the chart that represents the critical t-value for an α of 0.05. The effect is not significant when its bar not overtakes the vertical line. As shown in Fig. 5, none of the factors studied has a significant effect (α = 0.05) on the determination of the LDX with UV and CAD. Analysis of Pareto chart allowed us to observe the robustness of the method, since the factors did not present significant effect on the quantification of LDX in all the experimental conditions in both methods. The assay for LDX was 99.97% ± 0.50 for LC-CAD and it was 100.07% ± 0.41 for LC-UV as shown in Table 6.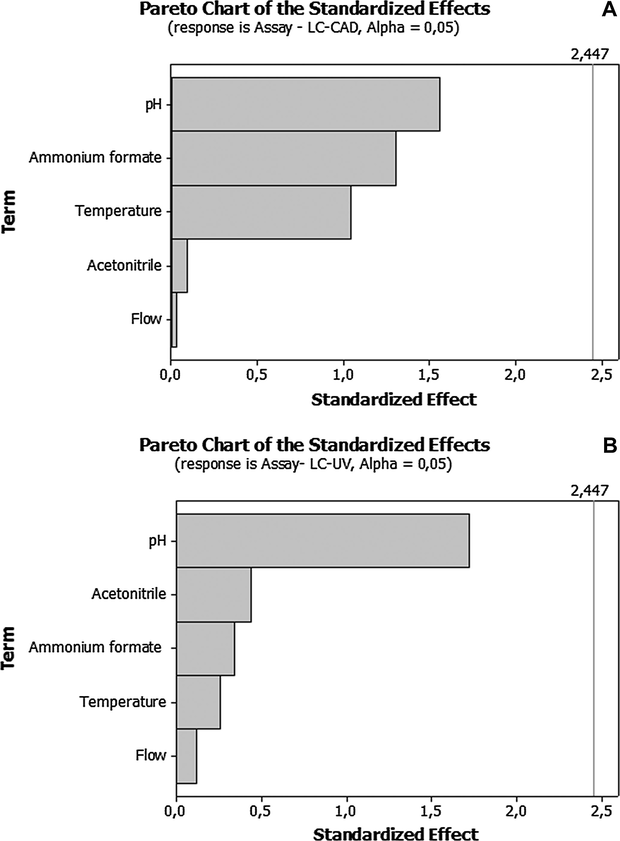
Pareto chart (Minitab® 16) obtained for robustness assay of LDX capsule for the charged aerosol (A) and ultraviolet (B) detectors.
Experiments
% Label claim
UV
CAD
1
100.56
99.76
2
100.21
99.53
3
100.15
100.77
4
99.49
99.93
5
99.93
99.84
6
100.11
100.55
7
100.84
100.06
8
99.70
99.39
9
99.47
99.53
10
100.24
100.68
11
100.29
100.27
12
99.91
99.32
Mean (12)a
100.07
99.97
% RSDb
0.41
0.50
3.3 Comparison of methods
The statistical method of comparison uses the mean of precision of each method. Through the Table 7, it can be seen that the results of both methods, UV and CAD, show a non-significant difference (p > 0.05).
4 Conclusions
HPLC methods using charged aerosol and UV detectors provided good results in terms of linearity, accuracy, precision, limit of detection and quantification, robustness and specificity, without any interference from excipients as well as degradation products. Both methods were adequately validated and provide an appropriate quality control tool for routine analysis and stability assays of LDX in capsule dosage forms. The results show that the UV and CAD methods developed and validated are interchangeable with each other over the concentration range studied.
Acknowledgment
We thank CAPES (Coordenação de Aperfeiçoamento de Pessoal de Nível Superior) for the support.
References
- Charged aerosol detection in pharmaceutical analysis. J. Pharm. Biomed. Anal.. 2012;69:50-63.
- [CrossRef] [Google Scholar]
- Clinical practice guideline: diagnosis and evaluation of the child with attention-deficit/hyperactivity disorder. Pediatrics. 2000;105:1158-1170.
- [Google Scholar]
- Diagnostic and Statistical Manual of Mental Disorders (fourth ed.). Washington, DC: American Psychiatric Association; 1994.
- Non-stimulant medications in the treatment of ADHD. Eur. Child Adolesc. Psychiatry. 2004;13(Suppl. 1) (I102-16)
- [CrossRef] [Google Scholar]
- A comparative study on the analytical performance of a charged aerosol detector and an ultraviolet detector for the RP-LC analysis of dabigatran etexilate in capsules. Anal. Methods. 2013;5:4777.
- [CrossRef] [Google Scholar]
- Lisdexamfetamine dimesylate and mixed amphetamine salts extended-release in children with ADHD: a double-blind, placebo-controlled, crossover analog classroom study. Biol. Psychiatry. 2007;62:970-976.
- [CrossRef] [Google Scholar]
- Pharmacokinetics of lisdexamfetamine dimesylate and its active metabolite, d-amphetamine, with increasing oral doses of lisdexamfetamine dimesylate in children with pharmacokinetics of lisdexamfetamine dimesylate and its active metabolite, d-amphetamine. Clin. Ther.. 2010;32:252-264.
- [CrossRef] [Google Scholar]
- Evaporative light-scattering detection coupled to microcolumn liquid chromatography for the analysis of underivatized amino acids : sensitivity, linearity of response and comparisons with UV absorbance detection. J. Microcolumn Separat.. 2001;13:169-175.
- [Google Scholar]
- Analysis of volatile bases by high performance liquid chromatography with aerosol-based detection. J. Chromatogr. A. 2012;1229:172-179.
- [CrossRef] [Google Scholar]
- Development and testing of a detection method for liquid chromatography based on aerosol charging. Anal. Chem.. 2002;74:2930-2937.
- [Google Scholar]
- P.7.c.002 Low variability in exposure to d-amphetamine in children and adults after administration of lisdexamfetamine dimesylate. Eur. Neuropsychopharmacol.. 2011;21:S605.
- [CrossRef] [Google Scholar]
- Intranasal versus oral administration of lisdexamfetamine dimesylate. Clin. Drug Invest.. 2011;31:357-370.
- [Google Scholar]
- Pharmacokinetics of lisdexamfetamine dimesylate after targeted gastrointestinal release or oral administration in healthy adults. Drug Metab. Dispos.. 2012;40:290-297.
- [Google Scholar]
- Lisdexamfetamine dimesylate: linear dose-proportionality, low intersubject and intrasubject variability, and safety in an open-label single-dose pharmacokinetic study in healthy adult volunteers. J. Clin. Pharmacol.. 2010;50:1001-1010.
- [CrossRef] [Google Scholar]
- The worldwide prevalence of ADHD: is it an American condition? World Psychiatry Off. J. World Psych. Assoc. (WPA). 2003;2:104-113.
- [Google Scholar]
- HPLC analysis of nonvolatile analytes using charged aerosol detection. LCGC North Am.. 2005;23:151-161.
- [Google Scholar]
- Identification and control of impurities in streptomycin sulfate by high-performance liquid chromatography coupled with mass detection and corona charged-aerosol detection. J. Pharm. Biomed. Anal.. 2011;56:271-279.
- [CrossRef] [Google Scholar]
- ICH, 2003. International Conference on Harmonisation of Stability Testing of New Drug Substances and Products Q1A(R2). Geneva.
- ICH, 2005. International Conference on Harmonisation of Validation of Analytical Procedure: Text and Methodology Q2 (R1). Switzerland.
- Forced degradation and impurity profiling: recent trends in analytical perspectives. J. Pharm. Biomed. Anal.. 2013;86:11-35.
- [CrossRef] [Google Scholar]
- Human pharmacology of intravenous lisdexamfetamine dimesylate: abuse liability in adult stimulant abusers. J. Psychopharm. (Oxford, England). 2009;23:410-418. 10.1177/0269881108093841
- [Google Scholar]
- An evaluation of the cytochrome P450 inhibition potential of lisdexamfetamine in human liver microsomes. Drug Metab. Dispos.. 2007;35:180-184.
- [CrossRef] [Google Scholar]
- Relative bioavailability of lisdexamfetamine 70-mg capsules in fasted and fed healthy adult volunteers and in solution: a single-dose, crossover pharmacokinetic study. J. Clin. Pharmacol.. 2008;48:293-302.
- [CrossRef] [Google Scholar]
- Metabolism, distribution and elimination of lisdexamfetamine dimesylate: open-label, single-centre, phase i study in healthy adult volunteers. Clin. Drug Invest.. 2008;28:745-755.
- [Google Scholar]
- Mickle, T., Krishnan, S., Bishop, B., Lauderback, C., Moncrief, J.S., Oberlender, R., Piccariello, T., 2006. US 7, 105, 486 B2.
- Comparison of UV and charged aerosol detection approach in pharmaceutical analysis of statins ˇ. Talanta. 2009;78:834-839.
- [CrossRef] [Google Scholar]
- Absorption and hydrolysis of lisdexamfetamine dimesylate to form the active moiety, D-amphetamine. J. Child Adolescent Psychopharm.. 2009;19:786.
- [Google Scholar]
- Absorption of lisdexamfetamine dimesylate and its enzymatic conversion to d-amphetamine. Neuropsychiatric Dis. Treat.. 2010;6:317-327.
- [Google Scholar]
- Practice parameter for the assessment and treatment of children and adolescents with attention-deficit/hyperactivity disorder. J. Am. Acad. Child Adolesc. Psychiatry. 2007;46:894-921.
- [CrossRef] [Google Scholar]
- ADHD in a school sample of Brazilian adolescents: a study of prevalence, comorbid conditions, and impairments. J. Am. Acad. Child Adolesc. Psychiatry. 1999;38:716-722.
- [CrossRef] [Google Scholar]
- Comparison of ultraviolet detection, evaporative light scattering detection and charged aerosol detection methods for liquid-chromatographic determination of anti-diabetic drugs. J. Pharm. Biomed. Anal.. 2010;51:973-978.
- [CrossRef] [Google Scholar]
- Determination of neomycin and related substances in pharmaceutical preparations by reversed-phase high performance liquid chromatography with mass spectrometry and charged aerosol detection. J. Pharm. Biomed. Anal.. 2013;76:207-214.
- [CrossRef] [Google Scholar]
- United States Pharmacopoeia, 2011. 34th ed. The USP Convention Inc., Rockville, MD.
- Guidance for robustness/ruggedness tests in method validation. J. Pharm. Biomed. Anal.. 2001;24:723-753.
- [CrossRef] [Google Scholar]
- Review of operating principle and applications of the charged aerosol detector. J. Chromatogr. A. 2010;1217:1549-1556.
- [CrossRef] [Google Scholar]
- Performance evaluation of evaporative light scattering detection and charged aerosol detection in reversed phase liquid chromatography. J. Chromatogr. A. 2008;1189:92-100.
- [CrossRef] [Google Scholar]
- Pharmaceutical Analysis – A Textbook for Pharmacy Students and Pharmaceutical Chemists (second ed.). Edinburgh: Elsevier Churchill Livingstone; 2005.
- WHO, 2006. General Guidelines for the Establishment, Maintenance and Distribution of Chemical Reference Substances. WHO Technical Report Series, No. 943, Part A.


