

Translate this page into:
Removal of ionic liquids and ibuprofen by adsorption on a microporous activated carbon: Kinetics, isotherms, and pore sites
⁎Corresponding author at: Univ. Savoie Mont-Blanc, LCME, F-73000 Chambéry, France. guedidihanen@yahoo.fr (Hanen Guedidi)
-
Received: ,
Accepted: ,
This article was originally published by Elsevier and was migrated to Scientific Scholar after the change of Publisher.
Peer review under responsibility of King Saud University.
Abstract
Ionic liquids (ILs) are considered as emergent pollutants as their synthesis and further use at a large scale might generate environmental problems. The adsorption on activated carbons represents one of the most effective methods to remove ionic liquids and other micropollutants from wastewater. In this work, the adsorption properties on an activated carbon cloth of two pyridinium ionic liquids (4-tert-butyl-1-propylpyridinium bromide (IL1) and 4-tert-butyl-1-(2-carboxyethyl)pyridinium bromide (IL2)) newly synthesized, were compared with the ones of ibuprofen. The adsorption kinetics and isotherms were studied at pH 3 and 7.5. The adsorption thermodynamic parameters calculated from the isotherms indicate an exothermic process, typical of physisorption. The adsorption kinetics of a mixture of the molecules show a competition between ibuprofen and IL2. The location of each adsorbed ionic liquid and ibuprofen into the porosity of the activated carbon cloth was determined from N2 (at 77 K) and CO2 adsorption isotherms (at 273 K). The purification process of an effluent containing the ionic liquids and the ibuprofen in mixture or in single solute could be workable by adsorption on an activated cloth.
Keywords
Adsorption
Kinetics
Isotherms
Activated carbon cloth
Ibuprofen
Ionic liquid

1 Introduction
Emerging Organic Contaminants (EOCs) are defined as organic substances present in very small amount in the environment (at concentration levels of nanograms to micrograms per liter), and they are persistent and have potential health effects on organisms or other adverse ecological effects (Stuart and Lapworth, 2013; Mostofa et al., 2012; De la Cruz et al., 2012). Many of them are produced industrially and are dispersed in the environment through domestic, commercial or industrial uses, leading to surface-water, soil and groundwater contamination. EOCs include different families of organic compounds such as pharmaceuticals, personal care products, endocrine-disrupting compounds, steroids and hormones, perfluorinated compounds or ionic liquids (Mostofa et al., 2012). Ibuprofen is one of the pharmaceuticals frequently detected in effluents from sewage-treatment plants at significant concentration, i.e. up to ∼25 mg L−1 (Miege et al., 2008). Many studies were devoted to the removal of this molecule from aqueous solutions, as for example by adsorption on activated carbons (Mestre et al., 2007; Baccar et al., 2012). Previous studies pointed out that the presence of carbonyl, lactonic and carboxylic groups on the surface of a microporous-mesoporous activated carbon enhanced its adsorption capacities of ibuprofen whereas the presence of phenolic groups decreased it (Guedidi et al., 2013, 2017). Very recently, Mukoko et al. have prepared an activated carbon from rice hull and proved its efficiency for the removal aspirin, paracetamol and ibuprofen contained in hospital effluents (Mukoko et al., 2015). The studies showed that these contaminants can be removed from wastewater using activated carbon.
Ionic liquids (ILs) constitute a very recent class of EOCs. These organic salts having a large number of molecular structures possess low melting points (below 373 K) and negligible vapor pressure. Since many of them are water soluble and poorly biodegradable, their increasing use might have a harmful impact on the environment (Pham et al., 2010). Even so, their excellent physical properties make them useful in synthesis and catalysis (Liu et al., 2009; Welton, 2004), electrochemistry (Stepniak et al., 2014), solar cells (Xu et al., 2013) or depollution. Various methods, such as thermal degradation (Awad et al., 2004), advanced oxidation processes (Stepnowski and Zaleska, 2005) or biological treatments (Romero et al., 2008) were recently used to remove ILs from wastewater. These techniques are however destructive and do not allow the recovery of the ionic liquids.
An alternative for their uptake is the adsorption onto solids. Several previous studies have concerned the adsorption of ionic liquids from aqueous solutions on activated carbons having various oxygenated surface groups (Farooq et al., 2012; Hassan et al., 2014; Palomar et al., 2009). Palomar et al. (2009) studied the adsorption of imidazolium-based ILs by a commercial microporous activated carbon whose surface was oxidized by various chemical treatments. They demonstrated that the adsorption of hydrophilic ILs was enhanced after oxidation, due to an increase in the amount of oxygenated surface groups promoting hydrogen-bonding interactions between the IL and the adsorbent. In another study, Lemus et al. (2012) showed that activated carbons with low concentration of polar surface groups (obtained by heating treatments at 900 °C under N2) were good adsorbents for hydrophobic ILs and that both the cation and the anion of the IL influenced the adsorption process. They showed that the adsorption was governed by Van der Waals interactions between the alkyl chain linked to the aromatic IL cation and the graphene layers of the activated carbon.
The treatment of pharmaceuticals in wastewater from hospital effluents is also of great concern as some studies indicate that biological treatments are not able to completely remove the micropollutants (Chonova et al., 2016). An additional treatment is thus necessary. The adsorption on activated carbons is one of the most frequently methods used to remove the remaining micropollutants due to a satisfying efficiency compared to other methods for example ozonation (Margot et al., 2013). Compared to granular and powdered activated carbons, activated carbon cloths exhibit rapid adsorption kinetics (Masson et al., 2016; Brasquet et al., 1996; Leyva-Ramos et al., 2012) and high adsorption capacities due to their slit micropores appropriate for the adsorption of small organic molecules (Guedidi et al., 2013, 2017).
To the best of our knowledge, no work about the removal of ionic liquids from wastewater was published, probably because these compounds are not industrially used yet. However, in future time, effluents containing both pharmaceutical and ionic liquids might be produced and efficient treatments will be required to prevent their release in the environment.
The aim of this study was to evaluate the adsorption properties of an activated carbon cloth toward ibuprofen and two novel ionic liquids: the 4-tert-butyl-1-propylpyridinium bromide and the 4-tert-butyl-1-(2-carboxyethyl)pyridinium bromide. These ionic liquids were chosen because of their quite similar molecular size than ibuprofen, and also because of the presence of a carboxylic group for one of them, like for ibuprofen. The adsorption kinetics were studied at 298 K and correlated with the adsorbate’s characteristics. Thermodynamic parameters of adsorption were determined from the adsorption isotherms of each molecule studied at different temperatures. Adsorption kinetics of a mixture of the three molecules was also investigated.
2 Experimental
2.1 Adsorbate molecules
4-Tert-butyl-1-propylpyridinium bromide (named IL1, Fig. 1a) and 4-tert-butyl-1-(2-carboxyethyl)pyridinium bromide (named IL2, Fig. 1b) were synthesized in our laboratory by conventional methods. Stoichiometric amounts of 4-tert-butylpyridine (96%, Aldrich) and 1-bromopropane (99%, Aldrich) or 3-bromopropionic acid (>99%, Aldrich) were mixed under stirring (24 h, room temperature) in order to get about 25 g of IL1 or IL2, respectively. Reaction products were washed 5 times with ethyl acetate (>99.7%, Aldrich) and further dried under vacuum at 10−3 mbar. The final white powders obtained were stored in stoppered flasks under an argon atmosphere placed in a desiccator containing silica gel.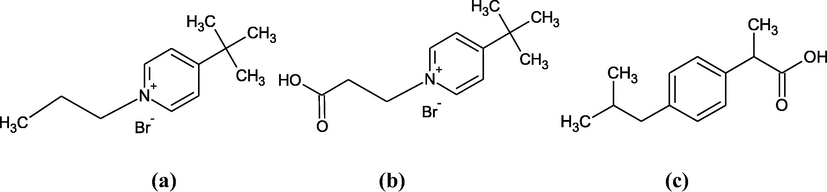
Developed formulas of (a): 4-tert-butyl-1-propylpyridinium bromide (IL1), (b): 4-tert-butyl-1-(2-carboxyethyl)pyridinium bromide (IL2) and (c): ibuprofen.
The purities of the synthesized ILs were examined by 1H and 13C NMR spectroscopy using a Bruker 400 MHz spectrometer after dissolution in CDCl3. Chemical shifts were reported to internal TMS and set at 0 ppm. A pKa of 4.1 was determined for IL2 by volumetric titration.
2-[4-(2-methylpropyl) phenyl]propanoic acid, also named ibuprofen (IBP, Fig. 1c), was purchased from Sigma-Aldrich (>98% purity, pKa = 4.91). As IBP is very slightly soluble in pure water (∼21 mg L−1) (Yalkowsky and Dannenfelser, 1992), it was dissolved in a KH2PO4/Na2HPO4 buffer (pH = 7.5). A solubility of 300 mg L−1 was determined in this buffered solution. To measure it, an excess of IBP was added to the buffer solution and stirred until dissolution equilibrium was reached. After filtration of the residual undissolved IBP, the concentration of the solution was determined by UV–visible absorption (λ = 220 nm) using a calibration curve obtained from IBP solutions prepared in a 10v/90v methanol/water solvent (Garzon and Martinez, 2004).
The molecular volumes of the adsorbates, determined using Turbomole software (Ahlrichs et al., 1989), were of 0.53 nm3 for IBP, 2.02 nm3 for IL1 and 2.27 nm3 for IL2.
The octanol/water partition coefficient values of IBP, IL1 and IL2 calculated by using Chemsketch software and model of ref. (Viswanadhan et al., 1989) are 3.72, −1.84 and −2.7, respectively. Thus, IL1 and IL2 are hydrophilic whereas IBP is hydrophobic. Owing to the presence of carboxylic group on IL2, it is more hydrophilic than IL1.
2.2 Activated carbon
The raw activated carbon cloth (ref. 900–20) referred to T0 was provided by Kuraray Chemical Co. Ltd. (Japan). Before adsorption experiments, it was washed with a 0.1 mol L−1 hydrochloric acid solution under stirring for 24 h, in order to remove the metal salt impurities. After filtration, it was rinsed with distilled water (∼200 mL per g) until reaching a constant pH of the filtrate and dried (383 K, 24 h).
2.3 Textural characterization of the activated carbon cloth before and after adsorption
The porosities of T0 samples prior to and after adsorption were characterized by N2 adsorption–desorption at 77 K and CO2 adsorption at 273 K using an ASAP 2020 sorptometer (Micromeritics). The analyzed samples, recovered from the ILs or IBP adsorption isotherm studies, correspond to T0 loaded with the following adsorbate content: 56.7 mg g−1 for IBP (Guedidi et al., 2017), 163.82 mg g−1 for IL1 and 212.15 mg g−1 for IL2. Loaded samples were respectively named T0(IBP), T0(IL1) and T0(IL2). Prior to N2 or CO2 adsorption, samples were outgassed for 4 days under vacuum (10−3 mmHg) at 323 K. In such conditions, the decomposition of the adsorbed molecules is avoided (Lerdkanchanaporn and Dollimore, 2000).
The specific surface areas of the activated carbons were calculated using the Brunauer–Emmett–Teller (BET) equation, assuming the area of the N2 molecule to be 0.162 nm2. The micropore and mesopore volumes were calculated from the pore size distributions (PSD) of the activated carbons determined using NLDFT (nonlocal density functional theory) models applied on both the adsorption isotherms of N2 at 77 K and CO2 at 273 K. For that, infinite slit pores were assumed for CO2 adsorption (pore diameters from 0.35 to 0.8 nm), while finite slit pores having a diameter-to-width aspect ratio of 12 were used for N2 adsorption simulations (pore diameters from ∼0.45 to 25 nm) (Jagiello and Olivier, 2009). N2 adsorption data at P/P0 < 0.01 were obtained using incremental fixed doses of 10 cm3 g−1 (STP), setting the equilibration interval at 300 s. CO2 adsorption data were obtained at P/P0 ranging from 4 × 10⁻⁴ to 3.5 × 10⁻², using 45 s equilibration interval (Jagiello and Thommes, 2004).
2.4 Adsorption kinetics and isotherms
The adsorption kinetics of the ILs were studied at room temperature at pH 3 and 7.5. The pH of 3 was adjusted by adding 0.1 mol L−1 HCl to the ILs solutions prepared at 0.75 mmol L−1 in Ultra High Quality water (UHQ, 18.2 MΩ). Experiments at pH 7.5 were performed by dissolving ILs in a phosphate buffer (prepared by dissolving 1.1796 g of KH2PO4 and 4.304 g of Na2HPO4 in 1L of UHQ water) (Weast et al., 1990).
Samples of activated carbon cloth (10 mg) were cut off and immerged in flasks containing 10 mL of acidified UHQ water (pH 3) or the buffer solution (pH 7.5). Closed flasks were stirred for at least one hour at 250 rpm in an orbital shaker (New Brunswick Scientific, Innova 40) in order to assure complete wetting of the adsorbent. After this preliminary step, 20 mL of the 0.75 mmol L−1 IL solution was added to each flask to obtain an initial concentration of 0.50 mmol L−1. For the kinetics the contact time was set between 2 min and 72 h.
The adsorption isotherms of both ILs and IBP were performed at pH 3 and 7.5 at three different temperatures (286 K, 298 K, and 313 K). 10 mg of the activated carbon cloth was previously impregnated with the solvent as described above. Solutions of given concentrations (from 0.05 to 0.5 mmol L−1), derived from the mother solutions by dilution (with UHQ water for pH 3 or phosphate buffer for pH 7.5) were then added to the flasks and kept under stirring for 24 h.
The adsorption kinetics of a mixture of IBP, IL1 and IL2 were also studied on T0. A disk of T0 (10 mg) was placed in a phosphate buffered aqueous solution (pH 7.5, 298 K, 250 rpm) containing 0.4 mmol L−1 of each adsorbate.
All the initial and residual adsorbent concentrations were measured by high performance liquid chromatography (HPLC) using a Waters chromatograph equipped with a high pressure pump (Waters 515), a photodiode array detector (Waters 996) and a Sunfire C18 column (5 µm, 4.6 × 250 mm). For IBP analysis, a methanol/UHQ water solution (80/20, v/v), containing 0.1 vol.% of concentrated phosphoric acid (H3PO4, 95 wt.%) in isocratic mode at a flow rate of 1 mL min−1 was used as mobile phase. The ILs were analyzed in the same mode using a mobile phase composed either of 88 vol.% of acidified UHQ water and 12 vol.% of methanol for IL1 (1 vol.% of 95 wt.% H3PO4 added to the total volume), or of 85 vol.% of acidified UHQ water and 15 vol.% of methanol for IL2. Detection was operated at 220 nm for the IBP and 222 nm for the ILs.
The equilibrium uptake of each molecule Qads (mg g−1) was calculated from equation: where V is the solution volume (L), Ci and Ce are respectively the initial and equilibrium concentrations of the adsorbent (mmol L−1) and m is the mass of the dry activated carbon cloth (mg).
3 Results and discussion
3.1 Characterization of the activated carbon cloth
The surface chemistry of the activated carbon cloth T0 was characterized by Boehm titration and the determination of pH and pHpzc. The result of Boehm titrations obtained in a previous study (Guedidi et al., 2017) revealed that T0 was mainly acidic with a pH (measured in boiled UHQ water) of 6.05. The basic value of pHpzc (point of zero charge) 8.40 might be assigned to the presence of high content of carbonyl groups (3.45 × 10⁻⁴) on its surface, as confirmed by Boehm titration (Table 1) (Guedidi et al., 2017). The porosity of the activated carbon cloth T0 was characterized by N2 adsorption–desorption at 77 K and CO2 adsorption at 273 K. As described in a previous study (Guedidi et al., 2017), the nitrogen adsorption isotherm is of type I and typical of microporous materials according to IUPAC classification (Fig. 2). The isotherm profile is characteristic of narrow microporous sample. As negative unrealistic C factors were obtained by applying the BET model in the 0.05–0.3 relative pressure range, the BET specific surface areas were then preferentially computed in the 0.01–0.05 relative pressure range, as for microporous materials. It is equal to 1910 m2 g−1. The pore size distribution (PSD) of T0 obtained by using a simulation method by NLDFT (Nonlocal density functional theory) model applied on the N2 adsorption isotherm of T0 at 77 K (Fig. 7) confirms that T0 is mainly microporous in nature: the microporous volume is equal to 0.75 cm3 g−1 whereas the mesoporous volume is only of ∼0.04 cm3 g−1. As shown in our previous study, T0 contains two kinds of microporous: The amounts of ultramicropores (∅ < 0.7 nm) and supermicropores (0.7 < ∅ < 2 nm) determined by CO2 and N2 adsorption respectively (Guedidi et al., 2017) are roughly the same, i.e. of ∼0.31 cm3 g−1.
Carboxylic groups
Lactonic groups
Phenolic groups
Carbonyl groups
Total oxygenated groups
Total basic groups
pH
pHPZC
0.21
0.62
0.1
3.45
4.39
2.25
6.05
8.40
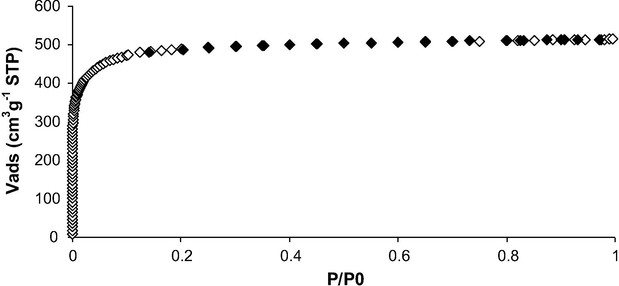
N2 adsorption-desorption isotherms at 77 K of T0 (♢: adsorption, ♦: desorption).
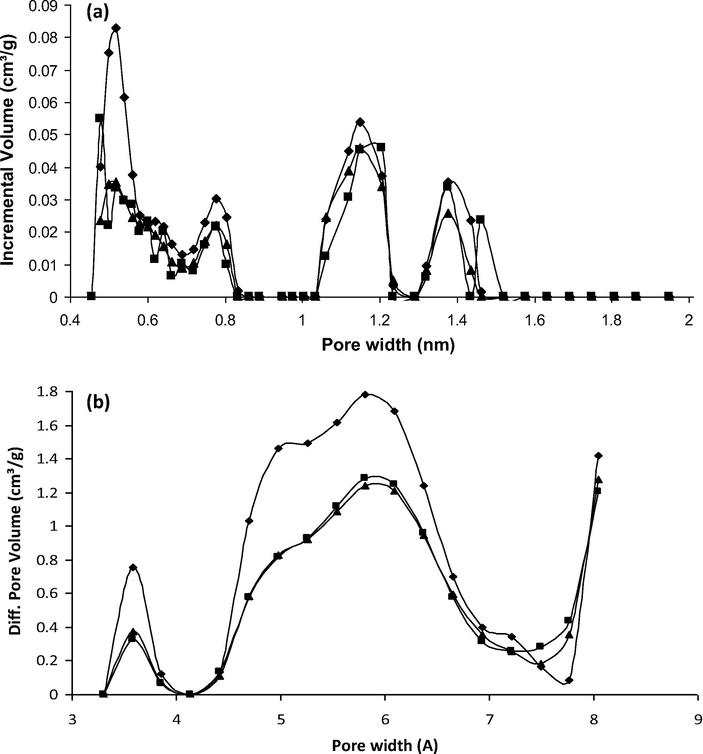
Pore size distributions of T0 (♦), T0(IL1) (▴) and T0(IL2) (■) from DFT simulations by slit-pore models of N2 (a) and CO2 (b) isotherms.
3.2 Chemical characterization of the ionic liquids
The 1H NMR spectrum of IL1 exhibited peaks at the following chemical shift values from the TMS signal: 9.6 ppm (d, 2H, J = 7.6 Hz), 8.0 ppm (d, 2H, J = 7.2 Hz), 4.9 ppm (t, 2H, J = 7.4 Hz), 2.1 ppm (m, 2H), 1.4 ppm (m, 9H), 1.0 ppm (t, 3H, J = 6 Hz). A peak of very low intensity observed at 7.23 ppm was assigned to the presence of residual traces of CHCl3 present in CDCl3 (Gerothanassis et al., 2002). The 13C NMR spectrum of IL1 showed as expected 8 signals at the following chemical shifts: 145 ppm (2CH), 171.4 ppm (C), 124.7 ppm (2CH), 60.3 ppm (CH2), 34.2 ppm (C), 25.6 ppm (CH2), 31.3 ppm (3CH3) and 11.1 ppm (CH3).
The 1H NMR spectrum of IL2 showed peaks at the following chemical shift values from the TMS signal: 9.4 ppm (d, 2H, J = 6.8 Hz), 8.0 ppm (d, 2H, J = 7.2 Hz), 5.1 ppm (t, 2H, J = 6.4 Hz), 3.3 ppm (t, 2H, J = 6.4 Hz), 1.4 ppm (m, 9H). A very low intensity signal at 7.23 ppm attributed to CHCl3 was also observed on the IL2 spectrum. The absence of the expected singlet at ∼11 ppm that would confirm the presence of the carboxylic group can be explained by a quick exchange between the acidic proton and a deuterium from the CDCl3 solvent. The 13C NMR spectrum of IL2 exhibited 8 peaks at the following chemical shifts: 171.9 ppm (C), 171,4 ppm (C), 145 ppm (2CH), 124.7 ppm (2CH), 50.3 ppm (C), 34.4 ppm (CH2), 34.2 ppm (C) and 31.3 ppm (3CH3).
The 1H NMR and 13C NMR analyses have confirmed the structures and the sufficient purities of IL1 and IL2 (Williams and Fleming, 2007).
3.3 Adsorption kinetics of IL1 and IL2 on T0: effect of pH
The adsorption kinetic of IL1 is faster at pH 3 than at pH 7.5 (Fig. 3). Indeed, the time to reach equilibrium is of about 600 min and 900 min at pH 3 and pH 7.5 respectively. Moreover, the IL1 uptake is increased as the pH increases: it is of about 0.37 mmol g−1 at pH 3 compared to 0.65 mmol g−1 at pH 7.5. The adsorption decrease at acidic pH could be explained by a positively charged activated carbon surface (pH < pHPZC) repelling the ionic liquid cation. The adsorption of the IL1 cation at low pH has been only promoted by dispersive interactions. As the pH of the solution has increased, the surface charges of the adsorbent have been neutralized and the adsorption of the ionic cation has consequently increased due to the reduction in the repulsive interaction.![Adsorption kinetics of IL1, IL2 on T0 at pH 3 and 7.5 (298 K, [IL] = 0.5 mmol L−1, mT0 = 10 mg, V = 30 mL, 250 rpm).](/content/184/2020/13/1/img/10.1016_j.arabjc.2017.04.006-fig4.png)
Adsorption kinetics of IL1, IL2 on T0 at pH 3 and 7.5 (298 K, [IL] = 0.5 mmol L−1, mT0 = 10 mg, V = 30 mL, 250 rpm).
For the IL2 adsorption, the time required to reach adsorption equilibrium is significantly the same at pH 3 and 7.5, i.e. about 900 min (Fig. 3). As for IL1, the activated carbon cloth adsorbed a greater amount of IL2 at pH 7.5 than at pH 3 (∼0.5 mmol g−1 and 0.7 mmol g−1 were adsorbed at pH 3 and 7.5 respectively). The lowest adsorption at acidic pH could be explained by repulsive interactions between the positively charged adsorbent and adsorbate (pKa IL2 = 4.1; pH < pKa IL2 < pHPZC). On the other hand, at pH 7.5, the surface of T0 remained positively charged (pH < pHPZC) but IL2 was present under a zwitterionic form due to the deprotonation of the carboxylic acid function. At this pH, the higher adsorption capacity of the activated carbon could be explained by both the electrostatic attractions (between the carboxylate function of IL2 and the positive charges present on the carbon surface) and some π – π dispersive interactions (between the pyridinium ion and the aromatic layers of T0). In a previous study on the adsorption of IBP in a methanol/water (10%v/90%v) solution by the T0 activated carbon cloth, a decrease in the IBP adsorption was observed as increasing pH (Guedidi et al., 2017). Maximum uptakes are about 2.4 mmol g−1 and 0.87 mmol g−1 at pH 3 and 7, respectively (for IBP initial concentration of 100 ppm) and higher than for ILs. Times to reach IBP adsorption equilibrium are of the same order as for the ILs, i.e., about 600 min at pH 3 and 1400 min at pH 7. In comparison with the ILs, the IBP adsorption is promoted at acidic pH because of its strongest hydrophobic nature in relation to its highest Kow (octanol/water partition coefficient) value compared to IL1 and IL2 (Section 2.1). This suggests that at acidic pH, IBP adsorption is mainly governed by hydrophobe-hydrophobe and dispersive interactions between the non-dissociated molecule and the positively charged activated carbon, whereas at pH 7, the hydrophobe-hydrophobe interaction decreases as IBP is dissociated and it is dominant with respect to the electrostatic attractions.
The kinetics of adsorption of the two ionic liquids by T0 was investigated by four models, namely the Lagergren pseudo-first-order model, the pseudo-second-order model and the Elovich model. Table 5 in the Appendix shows the adsorption kinetic parameters calculated from the kinetic models. For both ILs, whatever the pH value, the Elovich model (Table 5 in Appendix) was not in good agreement with the experimental kinetics. For IL1, the best fits of adsorption kinetics at pH 3 and 7.5 (R2 = 0.954 and 0.978 respectively) were obtained using the pseudo-second-order model. The IL1 uptake increased while the pH increased from 3 to 7.5. The pseudo-second-order constant k2 obtained at pH = 3 is higher than at pH = 7.5. As a consequence, adsorption kinetics of IL1 is quicker when pH decreases. On the other hand, the pseudo first order model was the best one for fitting IL2 adsorption at pH 3 and 7.5 (R2 = 0.989 and 0.995 respectively). The pseudo first order constant k1 founded at pH 3 is higher than at pH 7.5 indicating that the adsorption kinetics of IL2 adsorption is quicker when pH decreases.
3.4 Adsorption isotherms
3.4.1 Effect of temperature
Whatever the initial pH value and for both ionic liquids, the adsorption capacity of T0 has decreased as increasing the temperature from 286 K to 313 K (Fig. 4a and b), indicating an exothermic phenomenon. The maximum IL1 uptake is reduced from 0.30 to 0.18 mmol g−1 at pH 3 and from 0.65 to 0.60 mmol.g−1 at pH 7.5 (Fig. 4a). A similar temperature variation is brought out for the adsorption of IL2 decreasing from 0.60 to 0.42 mmol g−1 and from 0.73 to 0.63 mmol g−1 at pH 3 and 7.5, respectively. However, the adsorption has been less influenced by the temperature at pH 7.5 than at pH 3 (Fig. 4a and b), maybe because it has been favored at pH 7.5 compared to pH 3. Indeed, the ILs’ uptakes were about two times higher at pH 7.5 than at acidic pH.
Experimental adsorption isotherms of IL1 (a), IL2 (b) and IBP (c) on T0 at 286 K (♦, ♢), 298 K (■, □) and 313 K (▴, △) fitted by the Langmuir-Freundlich model (lines). Full and empty symbols correspond to isotherms at pH 7.5 and 3, respectively.
The adsorption of IBP on T0 in the buffer solution (pH 7.5) has been also an exothermic phenomenon (Fig. 4c) as the IBP uptake has decreased from ∼2.30 mmol g−1 at 286 K to ∼2.02 mmol g−1 at 313 K. Exothermal phenomena were also evidenced for the adsorption of IBP from a methanol/water (10%v/90%v) solution on the same activated carbon cloth (T0) (Guedidi et al., 2017) as well as on a microporous-mesoporous granular activated carbon (Guedidi et al., 2013). The exothermic nature of the adsorption phenomenon remains consistent with the solute distribution between the aqueous phase and the activated carbon as the ILs and IBP solubilities increase together with the temperature. All the adsorption isotherms were tentatively reproduced with the Langmuir (Zhu et al., 2009), Freundlich, Langmuir-Freundlich (Yao, 2000) and Redlich-Peterson (Kumar and Porkodi, 2007) models, using an iterative procedure based on a nonlinear least-squares algorithm (with MATLAB® software).
Whatever the adsorbate and the working pH (Fig. 4), the experimental data were best fitted by the Langmuir-Freundlich model with R2 ≥ 0.95 correlation coefficients (in Appendix Tables 6 and 7).
3.4.2 Thermodynamic parameters
Langmuir-Freundlich simulations were used to determine the thermodynamic parameters of adsorption. The Gibbs free energy (ΔG°), enthalpy (ΔH°) and entropy (ΔS°) variations were calculated according to the following equations:
The ΔH° and ΔS° values were calculated from the slope and intercept of the plot of ln Kd versus 1/T. Thermodynamic parameters of adsorption of the two ILs were calculated at 298 K, at a constant adsorption uptake value equal to 0.14 mmol g−1 at pH 3 and 0.6 mmol g−1 at pH 7.5 (Table 2). As uptakes were much higher for IBP, the thermodynamic parameters of adsorption of this latter molecule on T0 at 298 K were calculated at an uptake of 1.21 mmol g–1.
Adsorbate
IL1
IL1
IL2
IL2
IBP
pH
3
7.5
3
7.5
7.5
Qads (mmol g−1)
0.14
0.60
0.14
0.60
1.21
ΔG° (kJ mol−1)
−0.11
−0.20
−3.61
−1.10
−7.06
ΔH° (kJ mol−1)
−37.14
−12.19
−11.45
−17.35
−4.06
ΔS° (J K−1 mol−1)
−124.30
−40.85
−26.32
−59.31
10.04
The ΔG° values are negative for all adsorption experiments, implying a spontaneous adsorption of ILs and IBP on T0. Among the two ILs, whatever the pH, the adsorption of IL2 (i.e., 4-tert-butyl-1-(2-carboxyethyl)pyridinium bromide) is the more spontaneous. Thus, the presence of the carboxylic group on IL2 could favor energetically its adsorption with respect to IL1 through hydrogen bonding additional contribution as reported previously by modelizations (Sellaoui et al., 2016) (Table 3). The most negative ΔG° value obtained for the adsorption of IBP (calculated at Qads = 1.2 mmol g−1) is attributed to its hydrophobic character. For all the studied systems, the ΔG° values were lower than ∼40 kJ mol−1 in agreement with a physisorption process (Yu et al., 2004). These results are in agreement with studies of Farooq et al. (2012) and Hassan et al. (2014) (Table 3) who showed that adsorption of pyridinium ionic liquid onto fabric activated carbon, whatever the pH, was spontaneous and typical of physisorption.
AC
ILS
Results
References
AC cloth T0
IL1
IL2– Adsorption of ILS onto T0 was an exothermic process
This study
ΔH° (kJ mol−1) = −37.14 (Qads (mmol g−1) = 0.14 at pH = 3 (IL1)
ΔH° (kJ mol−1) = −12.19 (Qads (mmol g−1) = 0.60 at pH = 7.5 (IL1)
ΔH° (kJ mol−1) = −11.45 (Qads (mmol g−1) = 0.14 at pH = 3 (IL2)
ΔH° (kJ mol−1) = −17.35 (Qads (mmol g−1) = 0.60 at pH = 7.5 (IL2)
– ΔG° values are consistent with a physisorption mechanism
ΔG° (kJ mol−1) = −0.11 (Qads (mmol g−1) = 0.14 at pH = 3 (IL1)
ΔG° (kJ mol−1) = −0.20 (Qads (mmol g−1) = 0.60 at pH = 7.5 (IL1)
ΔG° (kJ mol−1) = −3.61 (Qads (mmol g−1) = 0.14 at pH = 3 (IL2)
ΔG° (kJ mol−1) = −1.10 (Qads (mmol g−1) = 0.60 at pH = 7.5 (IL2)
– ΔS° values indicate an increase in order (Arrangement of ILS)
ΔS° (J K−1 mol−1) = −124.30 (Qads (mmol g−1) = 0.14 at pH = 3 (IL1)
ΔS° (J K−1 mol−1) = −40.85 (Qads (mmol g−1) = 0.60 at pH = 7.5 (IL1)
ΔS° (J K−1 mol−1) = −26.32 (Qads (mmol g−1) = 0.14 at pH = 3 (IL2)
ΔS° (J K−1 mol−1) = −59.31 (Qads (mmol g−1) = 0.60 at pH = 7.5 (IL2)
A physisorption mechanism
AC cloth T0
IL1
IL2ΔE = −9.07 kJ mol−1 (IL1)
Sellaoui et al. (2016)
ΔE = −10.90 kJ mol−1 (IL2)
The adsorption energy values are typical of
Fabric AC
BPyBr
ΔH° (kJ mol−1) = −28
Hassan et al. (2014)
ΔG° (kJ mol−1) = −1.3
ΔS° (J K−1 mol−1) = −40.85
(Qads (mmol g−1) = 0.15 at pH = 7
– Adsorption of ionic liquids onto ACs was exothermic and was typical of physisorption
– The entropy value confirmed an increase in order after adsorption due to the local organization of molecule inside the pores
Microporous-mesoporous AC fabric
OPyBr
(Qads (mmol g−1) = 0.5 at pH = 7
Farooq et al. (2012)
ΔH° (kJ mol−1) = −29.4
ΔG° (kJ mol−1) = −2.8
ΔS° (J K−1 mol−1) = −89
(Qads (mmol g−1) = 0.5 at pH = 9
ΔH° (kJ mol−1) = 12.7
ΔG° (kJ mol−1) = -5.2
ΔS° (J K−1 mol−1) = 60
– Adsorption tended to be more spontaneous and was found to be less exothermic as the pH increases from 7 to 9
– Adsorption was entropically favored at basic pH
The negative ΔH° values obtained for the ILs and IBP adsorptions (Table 2) are consistent with the decrease in the adsorption capacities as increasing the temperature (Fig. 4a–c) and confirmed that the adsorption is an exothermic process. The lowest ΔH° value is obtained for the uptake of IL1 at pH 3 (−37.14 kJ mol−1), and the adsorption process of IL1 on T0 at this pH is therefore the most exothermic and the most energetic. This can be justified by the less spontaneous character of the adsorption of IL1 on T0, thus requiring more energy for this molecule to be adsorbed. Farooq et al. (2012) showed that adsorption of OPyBr by fabric activated carbon tended to be more spontaneous and was found to be less exothermic as the pH increases from 7 to 9 (Table 3).
The negative ΔS° values determined for both ILs at all studied pHs suggest that the adsorption on T0 is accompanied by a disorder decrease: during adsorption, the molecules order themselves on the surface of the activated carbon cloth. The smallest ΔS° value was obtained for the adsorption of IL1 at pH 3 (Table 2, −124.30 J K−1 mol−1). This result indicates a more ordered arrangement of IL1 on the surface of T0 compared to the other molecules and it corroborates the most energetic adsorption phenomenon determined for IL1 at pH 3 (see above). It is in agreement with the study published by Farooq et al. (2012) on the adsorption of pyridinium ionic liquids on microporous activated carbons. These authors explained the entropy decrease by the formation of an ordered octylpyridinium monolayer at the surface of the adsorbents (Table 3). Contrary to what is observed for ILs, the ΔS° value for the IBP adsorption on T0 is positive, indicating an increase in disorder. This positive value could indicate a competition between IBP and the molecules from the solvent (phosphate buffered water) to occupy the adsorption sites that would not occur for ILs adsorption.
3.5 Ternary mixture adsorption kinetics of IBP, IL1 and IL2
The kinetic curves of the IBP and ILs mixture (pH 7.5, Fig. 5) display that the adsorption equilibrium is achieved much quicker for IL1 and IL2 (∼3000 min) than that for ibuprofen (∼7000 min). Times to reach equilibrium for each molecule of the ternary system are much longer than those previously determined for single adsorption (i.e., ∼900 min for IL1 and IL2). This difference indicates a competitive adsorption between the two ionic liquids and ibuprofen. However, T0 has had a higher affinity for ibuprofen than for both ILs due to its highest hydrophobicity as almost the whole initial amount of IBP has been adsorbed from the ternary mixture against only 60% and 10% of IL1 and IL2, respectively. This is also in agreement with the single-compound experiments for which the maximum adsorption uptakes at pH 7.5 are of about 2.20 mmol g−1 for IBP (Fig. 4c) and only around 0.65 mmol g−1 for both ILs (Fig. 4a and b). Adsorption behaviors of IL1 and IL2 in the ternary mixture have been quite different. Whereas a continuous decrease in C/C0 was observed for IL1 until the plateau has been reached, IL2 was firstly adsorbed (during the first 500 min) and further desorbed to reach a plateau after about 3000 min. While IL2 was desorbed, IBP and IL1 continued diffusing toward the activated carbon adsorption sites (Fig. 5). This phenomenon might be related to the adsorbates’ molecular sizes which govern their ability to diffuse in the porous network of T0. Ibuprofen, which is the smallest molecule (0.53 nm3), could diffuse much faster in the porosity of T0, which is mainly microporous (Fig. 6), compared to the bulkiest IL1 (2.02 nm3) and IL2 (2.27 nm3) molecules. In addition, the lowest affinities of ILs for T0 at pH 7.5 can be explained by the electrostatic repulsions between the positive charge of the ILs cations and the positive surface of T0 (pHPZC ∼ 8.4) on the one hand, and on the other by the hydrophilic nature of the ILs toward the hydrophobic T0 carbon surface. The presence of a carboxylate group on the IL2 molecule (pKa = 4.1) does not favor its adsorption at equilibrium suggesting that steric dimensions are key parameters for the adsorption. On the contrary, the highest IBP uptake could be justified by both the main contribution of hydrophobic-hydrophobic interactions and the one of the electrostatic attraction between this negatively charged adsorbate (pKa = 4.91) and the positive T0 surface. A recent study (Sellaoui et al., 2016) has demonstrated using the COSMO-RS model that the highest interaction energy of IL2 or IBP with the carbon surface is due to an additional contribution of hydrogen bonds and to the presence of a carboxyl group on these adsorbate molecules. Thus, IL2 and IBP could be adsorbed on similar sites having oxygen surfaces groups through a contribution of hydrogen bonding. This could explain that these adsorbates compete together and that IL2 was desorbed in the ternary kinetics study and mainly replaced by IBP. The strongest hydrophobicity of IBP might be the driving force that has promoted its substitution with IL2 (Fig. 5).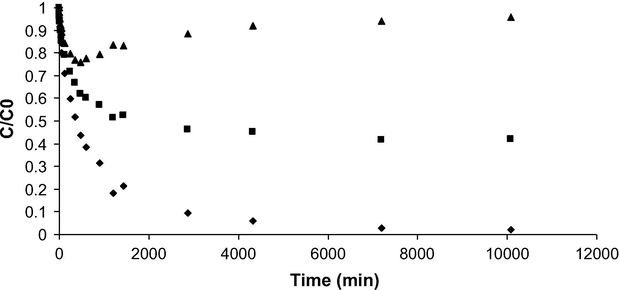
Adsorption kinetics of IL1 (■), IL2 (▴) and IBP (♦) from a ternary mixture on T0 (pH 7.5, 298 K, initial concentration of 0.4 mmol L−1 for each molecule, mT0 = 10 mg, V = 30 mL, 250 rpm).
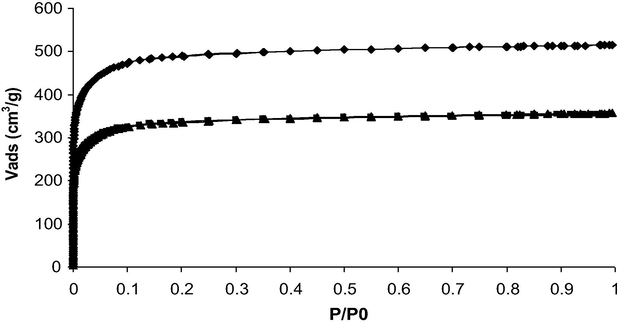
N2 adsorption-desorption isotherms at 77 K of T0 (♦), T0 (IL1) (▴) and T0(IL2) (■). Curves of T0(IL1) and T0(IL2) are quite superimposed.
3.6 Pore size required for ILs adsorption
A previous study has demonstrated that the IBP adsorption occurs in both the large ultramicropores and the supermicropores of the T0 activated carbon cloth (Guedidi et al., 2017). Indeed, gas adsorption experiments have suggested that the ultramicropore volume (0.190 cm3 g−1, representing ∼61 vol.%) and supermicropores (0.070 cm3 g−1, representing ∼21 vol.%) have been occupied by the IBP molecule (Table 4). Moreover, the occupied volumes deduced from the gas (N2 and CO2) adsorption isotherms and the IBP adsorption isotherm at pH 7.5 are quite similar (0.260 cm3 g−1 and 0.200 cm3 g−1, respectively, Table 3). The locations of the ILs molecules in the T0 porous network were investigated by comparing the porous volumes from the N2 and CO2 adsorption isotherms of T0 with the volumes occupied by ILs obtained from the loading content (Qads = 0.63 mmol g−1 for IL1 and 0.73 mmol g−1 for IL2). The N2 adsorption-desorption isotherms of T0, T0(IL1) and T0(IL2) are all of type I, and typical of microporous materials according to the IUPAC classification (Fig. 6). The N2-isotherms of the ILs loaded samples match the one of T0 but are shifted toward the lower adsorption volumes. Similar observation can be made for the CO2 adsorption isotherms (not shown). The measured BET surface area decreased from 1910 m2 g−1 for T0 to ∼1320 m2 g−1 for T0(IL1) or T0(IL2), confirming the presence of the organic molecules in the porosity. A decrease in the total microporous volume from 0.75 cm3 g−1 to ∼0.50 cm3 g−1 was also measured after ILs adsorption (Table 4, Figs. 6 and 7a). The comparison of the ultra and supermicropore volumes before and after ILs’ adsorption has allowed calculating the volumes occupied by each IL in the porosity. They were roughly the same for IL1 and IL2 and represented about 0.125 cm3 g−1 of the ultramicropores and 0.07 cm3 g−1 of the supermicropores (Table 4). These values suggest that about 67% and 28% of the ultramicropore and supermicropore volume respectively, are occupied by the ILs (Fig. 7). However, for the two ILs, their occupied volumes calculated from their adsorption isotherms (at pH 7.5) were much higher (0.790 cm3 g−1 for IL1 and 0.950 cm3 g−1 for IL2) than the microporous occupied volumes determined by gas adsorption (0.514 cm3 g−1 for IL1 and 0.503 cm3 g−1 for IL2). This difference suggests that the micropores are not completely accessible by these large molecules. Another reason to explain these discrepancies is that the volumes determined for the ILs (2.02 nm3 for IL1 and 2.27 nm3 for IL2) were overestimated. ILs might have another configuration inside the pores due to electrostatic and dispersive interactions with the pore walls than the one taken for the calculation of their volume by modelization of the isolated molecules.
Sample
T0
T0(IBP)
T0(IL1)
T0(IL2)
SBET (m2 g−1)a
1910
1244
1313
1328
Micropore volume (cm3 g−1)b
0.750
0.470
0.514
0.503
Ultramicropore volume (cm3 g−1)c
0.310
0.120
0.185
0.185
Supermicropore volume (cm3 g−1)b
0.320
0.250
0.250
0.253
Ultramicropore vol. occupied (cm3 g−1)d
0.190
0.125
0.125
Supermicropore vol. occupied (cm3 g−1)d
0.070
0.070
0.068
Occupied volume from isotherms (cm3 g−1)e
0.200
0.790
0.950
4 Conclusion
The adsorption kinetics of two ionic liquids: the 4-tert-butyl-1-propylpyridinium bromide and the 4-tert-butyl-1-(2-carboxyethyl)pyridinium bromide are faster than the adsorption kinetic of ibuprofen on the microporous activated carbon cloth T0 (at initial concentration of 0.5 mmol L−1). Time to reach equilibrium is about 1440 min for ibuprofen and ranges between 600 min and 900 min for both ionic liquids. The thermodynamic parameters calculated from adsorption isotherms at three different temperatures allow concluding to a spontaneous and exothermic adsorption mechanism for both ionic liquids. As for the adsorption of ibuprofen, ΔG° values are consistent with a physisorption mechanism (−7.06 < ΔG° < −0.11 kJ mol−1). The negative ΔS° values indicate an increase in order due to the arrangement of the molecules while they are adsorbed inside the pores of the activated carbon. The study of the adsorption sites by pore size distribution analyses on loaded samples indicates that all the adsorbates are accommodated in the micropores and mainly in the ultramicropores.
The adsorption of the ionic liquids is strongly dependent on the pH of the solution: the adsorption uptake increases as the pH increases from 3 to 7.5 due to the rise in electrostatic attraction. Adsorption of the ILs could be governed either by dispersive interactions between the aromatic cycle of the ionic liquids and the aromatic layers of T0 (π-π interactions) or by the electrostatic interaction between the organic cation and the carbon surface.
In case of ibuprofen, the main contribution to adsorption is due to hydrophobic repulsions from the solvent which decreases as increase in pH. Hydrogen bonding can additionally contribute to adsorption for the 4-tert-butyl-1-(2-carboxyethyl)pyridinium bromide and ibuprofen.
The adsorption kinetics of a mixture of the three adsorbates at pH 7.5 highlighted a higher affinity of the adsorbent for ibuprofen. This might be directly correlated with the smallest volume of this molecule and to its hydrophobic nature. Indeed, as ibuprofen is the smallest molecule, it can diffuse at higher uptake into the porous network. Moreover, it is the only one negatively charged at pH 7.5 and also the most insoluble and hydrophobic. These properties favor its transfer toward the surface of the positively charged activated carbon cloth and justify its higher uptake compared to the ionic liquids. The 4-tert-butyl-1-(2-carboxyethyl)pyridinium bromide is assumed to be adsorbed on the same site as ibuprofen owing to the presence of the carboxylate function. The competition of these two molecules during the kinetics of the mixture has yielded to the release of this ionic liquid replaced by ibuprofen.
The adsorption of both ionic liquids and ibuprofen is efficient on a microporous activated carbon cloth. The removal of the mixture of ionic liquid and ibuprofen in an effluent purification process will be workable at trace concentrations as no competition is expected to occur between the micropollutants at these concentrations.
Acknowledgments
The ‘‘Région Rhône-Alpes’’ (France) is thankfully acknowledged for the generous MIRA grant attributed to H. Guedidi.
References
- Electronic-structure calculations on workstation computers - the program system TURBOMOLE. Chem. Phys. Lett.. 1989;162:165-169.
- [Google Scholar]
- Thermal degradation studies of alkyl-imidazoliumsalts and their application in nanocomposites. Thermochim. Acta. 2004;409:3-11.
- [Google Scholar]
- Removal of pharmaceutical compounds by activated carbon prepared from agricultural by-product. Chem. Eng. J.. 2012;211–212:310-317.
- [Google Scholar]
- Separate treatment of hospital and urban wastewaters: a real scale comparison of effluents and their effect on microbial communities. Sci. Total Environ.. 2016;542:965-975.
- [Google Scholar]
- Degradation of 32 emergent contaminants by UV and neutral photo-Fenton in domestic wastewater effluent previously treated by activated sludge. Water Res.. 2012;46:1947-1957.
- [Google Scholar]
- Adsorption of ionic liquids onto activated carbons: effect of pH and temperature. Micropor. Mesopor. Mater.. 2012;158:55-63.
- [Google Scholar]
- Temperature dependence of solubility for ibuprofen in some organic and aqueous solvents. J. Solut. Chem.. 2004;33:1379-1395.
- [Google Scholar]
- Nuclear Magnetic Resonance (NMR) spectroscopy: basic principles and phenomena, and their applications to chemistry, biology and medicine. Chem. Educ. Res. Pract. Eur.. 2002;3:229-252.
- [Google Scholar]
- The effect of the surface oxidation of activated carbon, the solution pH and the temperature on adsorption of ibuprofen. Carbon. 2013;54:432-443.
- [Google Scholar]
- Adsorption of ibuprofen from aqueous solution on chemically surface-modified activated carbon cloths. Arab. J. Chem.. 2017;10:S3584-S3594.
- [Google Scholar]
- Effect of cation type, alkyl chain length, adsorbate size on adsorption kinetics and isotherms of bromide ionic liquids from aqueous solutions onto microporous fabric and granulated activated carbons. J. Environ. Manage.. 2014;144:108-117.
- [Google Scholar]
- Comparison of DFT characterization methods based on N2, Ar, CO2, and H2 adsorption applied to carbons with various pore size distributions. Carbon. 2004;42:1227-1232.
- [Google Scholar]
- A simple two-dimensional NLDFT model of gas adsorption in finite carbon pores. Application to pore structure analysis. J. Phys. Chem. C.. 2009;113:19382-19385.
- [Google Scholar]
- Comments on “adsorption of 4-chlorophenol from aqueous solutions by xad-4 resin: isotherm, kinetic, and thermodynamic analysis”. J. Hazard. Mater.. 2007;143:598-599.
- [Google Scholar]
- Developing criteria for the recovery of ionic liquids from aqueous phase by adsorption with activated carbon. Sep. Purif. Technol.. 2012;97:11-19.
- [Google Scholar]
- The evaporation of Ibuprofen from Ibuprofen sarch mixtures using simultaneous TG-DTA. Thermochim. Acta. 2000;357–358:71-78.
- [Google Scholar]
- External mass transfer and hindered diffusion of organic compounds in the adsorption on activated carbon cloth. Chem. Eng. J.. 2012;183:141-151.
- [Google Scholar]
- Synthesis, properties and catalysis of novel methyl- or ethyl-sulfate-anion-based acidic ionic liquids. Catal. Commun.. 2009;10:799-802.
- [Google Scholar]
- Treatment of micropollutants in municipal wastewater: ozone or powdered activated carbon? Sci. Total Environ.. 2013;461–462:480-498.
- [Google Scholar]
- Thermodynamic study of seven micropollutants adsorption onto an activated carbon cloth: Van’t Hoff method, calorimetry, and COSMO-RS simulations. Environ. Sci. Pollut. Res. 2016
- [CrossRef] [Google Scholar]
- Removal efficiency of pharmaceuticals and personal care products with varying wastewater treatment processes and operating conditions – conception of a database and first results. Water. Sci. Technol.. 2008;51:49-56.
- [Google Scholar]
- Mostofa, K.M.G., Liu, C.Q., Minakata, D., Wu, F., Vione, D., Mottaleb, A., Yoshioka, T., Sakugawa H., 2012. In: Mostofa, K.M.G., Yoshioka, T., Mottaleb, A., Vione, D. (Eds.), Photobiogeochemistry of Organic Matter: Principles and Practices in Water Environments, Springer Science & Business Media, pp. 273–364.
- Preparation of rice hull activated carbon for the removal of selected pharmaceutical waste compounds in hospital effluent. J. Environ. Anal. Toxicol.. 2015;S7
- [CrossRef] [Google Scholar]
- Adsorption of ionic liquids from aqueous effluents by activated carbon. Carbon. 2009;47:1846-1856.
- [Google Scholar]
- Environmental fate and toxicity of ionic liquids: a review. Water Res.. 2010;44:352-372.
- [Google Scholar]
- Toxicity and biodegradability of imidazolium ionic liquids. J. Hazard. Mater.. 2008;151:268-273.
- [Google Scholar]
- Steric and energetic interpretations of the equilibrium adsorption of two new pyridinium ionic liquids and ibuprofen on a microporous activated carbon cloth: statistical and COSMO-RS models. Fluid Phase Equilibr.. 2016;414:156-163.
- [Google Scholar]
- Characterization and application of N-ethyl-N-propylpiperidiniumbis(trifluoromethanesulfonyl)imide ionic liquid–based gel polymer electrolyte prepared in situ by photopolymerization method in lithium ion batteries. Electrochim. Acta. 2014;121:27-33.
- [Google Scholar]
- Comparison of different advanced oxidation processes for the degradation of room temperature ionic liquids. J. Photochem. Photobiol. A: Chem.. 2005;170:45-50.
- [Google Scholar]
- Stuart, M., Lapworth, D., 2013. Emerging Organic Contaminants in Groundwater. British geological survey, Wallingford, pp. 259–284.
- Atomic physicochemical parameters for three dimensional structure directed quantitative structure-activity relationships. 4. Additional parameters for hydrophobic and dispersive interactions and their application for an automated superposition of certain naturally occurring nucleoside antibiotics. J. Chem. Inf. Comput. Sci.. 1989;29:163-172.
- [Google Scholar]
- Weast, R.C., Lide, D.R., Astle, M.J., Beyer, W.H., 1990, Handbook of Chemistry and Physics, CRC Press, Boca Raton, Floride, pp. D-144–D-146.
- Williams, D.H., Fleming, I., 2007. Spectroscopic Methods in Organic Chemistry, sixth ed., McGraw-Hill, pp. 304.
- Performance enhancement for high performance dye-sensitized solar cells via using pyridinyl-functionalized ionic liquid type additive. Electrochim. Acta. 2013;106:181-186.
- [Google Scholar]
- Yalkowsky, S.H., Dannenfelser, R.M., 1992. Aquasol Database of Aqueous Solubility. Version 5, College of Pharmacy, University of Arizona; Tuscon, AZ.
- Extended and improved Langmuir equation for correlating adsorption equilibrium data. Sep. Purif. Technol.. 2000;19:237-242.
- [Google Scholar]
- Adsorption of water-soluble dyes onto modified resin. Chemosphere. 2004;54:425-430.
- [Google Scholar]
- Poly(N, N-dimethylaminoethyl methacrylate) modification of activated carbon for copper ions removal. Mater. Chem. Phys.. 2009;113:784-789.
- [Google Scholar]
Appendix A
See Tables 5–7.
Kinetic model
Parameters
IL1
IL2
pH = 3
pH = 7.5
pH = 3
pH = 7.5
Pseudo-first-order
qe (mmol g−1)
0.371
0.621
0.508
0.705
k1 (min−1)
0.034
0.013
0.067
0.012
R2
0.925
0.975
0.989
0.995
Pseudo-second-order
qe (mmol g−1)
0.394
0.686
0.578
0.780
k2 (mmol g−1 min−1)
0.056
0.011
0.006
0.009
R2
0.954
0.978
0.985
0.990
Elovich
α (mmol g−1 min−1)
0.062
0.144
9.487 × 10⁴
9.575 × 10⁵
β (g mmol−1)
19.290
8.331
73
50.140
R2
0.940
0.938
0.331
0.373
Model
Parameters
IL1
IL2
Langmuir
Qm (mmol g−1)
0.257
0.581
kL (L mmol−1)
37.970
21.460
R2
0.970
0.983
Freundlich
kF (mmol1−1/n L1/n g−1)
0.315
0.805
n
4.438
2.896
R2
0.984
0.994
Langmuir-Freundlich
Qm (mmol g−1)
0.369
0.983
KLF (L mmol−1)
3.313
2.190
n
0.480
0.550
R2
0.990
0.998
Redlich-Peterson
KR (L g−1)
31.97
36.32
aR (L mmol−1)
106.50
48.98
b
0.834
0.750
R2
0.988
0.997
Model
Parameters
IL1
IL2
IBP
Langmuir
Qm (mmol g−1)
0.667
0.737
2.207
kL (L mmol−1)
39.480
41.300
176.530
R2
0.990
0.994
0.926
Freundlich
kF (mmol1−1/n L1/n g−1)
0.979
1.095
1.180
n
3.306
3.333
5.754
R2
0.984
0.974
0.953
Langmuir-Freundlich
Qm (mmol g−1)
0.820
0.829
3.337
KLF (L mmol−1)
8.018
13.820
105.068
n
0.675
0.768
0.371
R2
0.998
0.998
0.957
Redlich-Peterson
KR (L g−1)
47.830
42.620
1649
aR (L mmol−1)
58.480
50.460
1227.485
b
0.845
0.900
0.861
R2
0.996
0.995
0.956


