

Translate this page into:
Composition and biological activity of the Algerian plant Rosa canina L. by HPLC-UV-MS
⁎Corresponding authors. bertella.nabil@gmail.com (Nabil Bertella), ouahab.am@gmail.com (Ammar Ouahab)
-
Received: ,
Accepted: ,
This article was originally published by Elsevier and was migrated to Scientific Scholar after the change of Publisher.
Peer review under responsibility of King Saud University.
Abstract
The present study was carried out in order to identify and characterize the compounds of Rosa canina fruits by HPLC-UV-MS. The total phenolic determiner by a new Fast Blue method (FBBB), which detects phenolic directly, reported an average total phenolic concentration of 1.7 folds greater than Folin-Ciocalteu (F-C), which indicates that an indirect detection method of total phenolic should be replaced in future studies by the FBBB method. TPC of the ethanolic extract was positively correlated with 1,1-diphenyl-2-picryl-hydrazyl (DPPH) free radical scavenging effect. The DPPH activity of R. canina extract which is higher than the IC50 of the ascorbic acid and Butylated Hydroxytoluene (BHT), but lower than the IC50 of quercetin and trolox. The determination of intracellular reactive oxygen species (ROS) proved the antioxidant effect of the extract on HepG2 and SH-SY5Y cells. A concentration of 1.63 μg/ml on HepG2 cells had an oxidizing effect instead of the antioxidant effect, which is due to the existence of a tert-butyl group in sesquiterpene identified by HPLC-UV-MS method. These results indicate that the fruits of R. canina can be used as a natural source of antioxidants against oxidative stress and some types of cancer.
Keywords
Ethanolic extract
HPLC-UV-MS
Antioxidant activity
Oxidant effect
Bilobalide A

1 Introduction
R. canina belongs to the family of Rosaceae and genus Rosa, with about 200 species spread in the temperate zone and subtropics of the Northern hemisphere, R. canina pseudo-fruit was traditionally used in preventive therapy and for the preparation of some foods such as jam, beverages and probiotic drinks (Montazeri et al., 2011).
Natural substances and plants in general, are an immense source of chemiodiversity, often with very original structures that are usually impossible to synthesize (structural complexity, stereospecificity …). Flavonoids, tannins and terpenoids are the most essential bioactive polyphenols identified in R. canina fruits by HPLC–UV–MS method. They are a wide range of secondary compounds distributed in various plants and play an important role in normal growth and defence. They display various structures and a broad range of biological activities (Naczk and Shahidi, 2004).
Most qualitative and quantitative analyses of phenolics are usually traditional methods such as HPLC-UV for qualitative analysis and Folin-Ciocalteu method (F-C), which is the only procedure used to measure total phenolics through the reduction capacity of the components of the extract. Whereas, the novel total phenolic method utilizing Fast Blue BB diazonium salt is based on the coupling of phenolic compounds with the diazonium. The coupling mostly occurs para to the phenolic activating group, unless the position is already occupied. For R. canina extract, the Fast Blue (FBBB) method had higher gallic acid equivalents (GAE) values than the standard Folin–Ciocalteu in the dosage of total phenolic (Maria et al., 2017; Medina, 2011a,b).
There are many analytical methods available to assess the antioxidant capacity such as DPPH scavenger effect, which is the method used to evaluate the antioxidant activity in vitro. Cellular antioxidant activity by determination of intracellular reactive oxygen species (ROS) is an approach used to evaluate the antioxidant activity based on cells (Yin et al., 2019). The phenolic compounds present in R. canina made it one of the preferred plants in phyto-therapy and in the pharmaceutical sector. R. canina presents a cytotoxic effect following an MTT test. This effect prevented from cancer by several mechanisms. They decrease both cell proliferation and oxidative stress, block cell cycles, and induce apoptosis (Ren et al., 2003).
The aim of the present study is to identify and characterize the main antioxidants in the ethanolic extract of R. canina fruits using HPLC–UV–MS. Additionally, the antioxidant and cytotoxic effects of R. canina extract are also explored.
2 Materials and methods
2.1 Samples
The fruits of R. canina were harvested from the region of Batna, Algeria, in October 2016. The samples were washed, then dried at room temperature and ground before storing at −20 °C.
2.2 Standards and reagents
All chemicals and reagents used in this study were of analytical grade and were obtained from Sigma-Aldrich chemistry (Madrid, Spain). HPLC grade solvents were purchased from Merck Darmstadt, Germany). The HPLC grade water was prepared using a Milli-Q system (Millipore Lab., Bedford, MA, USA).
2.3 Preparation of the phenolic extracts
The extraction of the polyphenols is carried out three times by mixing 50 ml of ethanol/water (70:30; v/v)/plant powder 50 mg. The extract was left in the ultrasonic bath (FALC Instruments, Italy) for 30 min after centrifugation at 5000 rpm for 20 min at 10 °C and the ethanol was removed in vacuum using a rotary evaporator Temperature below 40 °C. In order to remove the apolar molecules contained in the extract, a second extraction was performed by using 4 ml of the hexane/water mixture at a ratio of 50:50; v/v, and then mixed with the resulting ethanolic extract of the first extraction. The operation was repeated three times, and then the extract was dried under vacuum by heat applied in the Savant Speed VacThermo Scientific Concentrator SPD131DDA for 4 h. The resulting extract was lyophilized in a laboratory lyophilizer (BETA 2-8 LD plus - Martin Christ) for 24 h.
Extraction yield (%) = weight of extract obtained × 100/weight taken of the material vegetal (Baghdikian et al., 2016).
2.4 Determination of total phenols contents by Folin-Ciocalteu (F-C) and Fast Blue BB (FBBB) methods
The total phenolic content was evaluated by F-C method (Khanam et al., 2012). The ethanolic extracts were prepared at a concentration of 0.5 mg/ml. Briefly, 10 μl of the sample was transferred into a well in a 96-well plate and 150 μL of 6% Folin–Ciocalteu reagent was added and mixed, after 3 min, add 50 μl/well of saturated sodium bicarbonate solution (0.6 M) was added and mixed gently. Incubate the plate for 2 h at room temperature and in the dark and read the absorbance at 725 nm by the BioTek Synergy HT multi-mode microplate reader (BioTek Instruments Inc., Vermont, USA) and the data was acquired and processed using BioTek's Gen5TM software (BioTek Instruments Inc.).
The total phenolic content was determined by FBBB method (Lester et al., 2012). The ethanolic extracts were prepared at a concentration of 0.25 mg/ml. The reaction started by adding 150 µl/well of sample in the 96-well plate, and then mixed with 15 μl/well of Fast Blue (0.01% v/v H2O) and 15 μl/well of NaOH (5% v/v H2O). After incubating the plate for 120 min at room temperature, the absorbance was read at 420 nm with a BioTek Synergy HT multi-mode microplate reader (BioTek Instruments Inc., Vermont, USA), and data was acquired and processed using BioTek's Gen5TM software (BioTek Instruments Inc.).
A calibration curve was established for the two methods using a standard solution of gallic acid (0.6–0.025 mg/ml) and expressed as μg of gallic acid equivalents (GAE)/mg of dry weight (dw). For F-C method, y = 1.2943x + 0.0877; R = 0.997, and for FBBB method, y = 1.1869 + 0.0267; R = 0.999.
Where x is the total phenolic content of ethanolic extract. A control was carried out with water, which followed the same treatment as the extract.
2.5 Preparation of sample the HPLC-UV-MS analysis
50 mg of the dried paste was mixed with 10 ml of water/methanol-0.5% HCl (80:20; v/v). The mixture was placed in the ultrasonic bath for 30 min (FALC Instruments, Italy), then the extract was centrifuged at 5000 rpm for 20 min at 10 °C. The operation was repeated three times and the three successive acidified methanolic supernatants were evaporated to dryness under vacuum without heat applied to the SPV131DDA Thermo Scientific SPD131DDA Concentrator for 3 h. The samples were reconstituted with 200 μl of formic acid 0.1%, where the sample was centrifuged for 10 min at 9000 rpm, and then the supernatant was filtered and diluted (1:10) and finally stored in a flask at −20 °C until analysis (Mraihi et al., 2015).
2.6 Preparation of standard solution for HPLC-UV analysis
For the preparation of the standard calibration curves, the stock solutions of phloroglucinol, gallic acid, protocatechuic acid, chlorogenic acid, caffeic acid, p-coumaric acid, ferulic acid, catechin, epicatechin, quercetin, quercetin-3-glucoside, apigenin, resveratrol and kaempferol were prepared informic acid 0.1% at a concentration of 1 mg/ml. The concentrated solutions were then diluted with 0.1% formic acid to obtain 1, 3, 6, 12, 25, 50 and 100 μg/ml. All solutions were filtered through a 0.2 μm sartolon polyamide membrane filter.
2.7 Analysis of polyphenols by HPLC-UV
20 μl of the sample was placed in an Agilent 1200 Series HPLC for analysis. The Ultrabase column (C18.5 μm, 150 × 4.6 mm) was used at a flow rate of 0.5 ml/min coupled to a diode array detector (DAD) and a quaternary pump. The temperature of the column was set at 25 °C and the stopping time was 55 min. The solvents used for the analysis were formic acid 0.1% (A), acetonitrile with formic acid 0.1% (B), ultrapure water (C) and acetonitrile (D) (Pallaufa et al., 2008).
2.8 HPLC–MS analysis
In order to identify and characterize the phenolic compounds, a sample of 10 μL of extract was analyzed using HPLC with mass spectrometry detection Agilent 1200 Series liquid chromatography equipped with an electrospray atmospheric pressure (ESI) and employing an ESI (electrospray ionization), phenomenex Luna C18 (150 × 4.6 m 3 μm) was used with a flow rate of 0.5 ml/min. The capillary tension was 3 V, and the capillary temperature was 180 °C. Mobile Phase A was 0.1% Formic Acid in water, while Mobile Phase B was 0.1% Formic Acid in Acetonitrile (% B: 0 min = 10%, 30 min = 30%, 35 min = 35%, 40 min = 45%, 50 min = 10%). The spectra were recorded in negative ion mode and the MS detector was programmed to perform a consecutive scan series: extended dynamic range, low 1700 m/z (Pallaufa et al., 2008).
2.9 DPPH radical-scavenging activity
Antioxidant activity was determined by DPPH free radical scavenging effect by using quercetin, ascorbic acid, trolox and BHT as positive control, Crude extract was prepared with a range of concentrations (10–600 μg/ml). 290 μL of methanolic DPPH solution (1 × 10⁵ M) was added and the mixture was incubated for 30 min at room temperature. The absorbance was read at 517 nm and the data were acquired and processed using BioTek’s Gen5TM software (BioTek Instruments Inc.). Free radical scavenging activity was determined according to the equation % Antioxidant Activity (AA) = 100-[{(Abssample-Absblank) × 100}/Abscontrol] published previously (Nwaehujor et al., 2014).
2.10 Cell culture and extract treatments
HepG2 human hepatoma cells, SH-Sy5y human neuroblastoma were seeded and cultured regularly in DMEM medium and 10% fetal bovine serum, but they were changed to serum-free medium 24 h prior to testing. Cells were treated with different concentrations of ethanolic extract (0.01–250 μg/ml) within 24 h.
2.11 Determination of ROS
Cellular oxidative stress was quantified by the dichlorofluorescence test (DCFH). DCFH becomes dichlorofluorescein (DCF) after being oxidized by intracellular oxidants, and emits fluorescence. By quantifying the fluorescence at an excitation wavelength of 485 nm and an emission wavelength of 530 nm, a fair estimate of the overall oxygen species generated under the various conditions was obtained by using fluorescent probe (DCFHDA) after incubation in CO2 at 37 °C for 30 min (Granado-Serrano et al., 2006).
2.12 Statistical analysis
The data were expressed as mean ± DS. Significant differences were calculated by testing linear trends using single-factor analysis (ANOVA), using Dunnett's multiple comparison test. The data used for the IC50 determination were examined using a nonlinear regression sigmoid fit using the GraphPad Prism. Differences with P < .05 were considered significant. The SPSS version 20.0 program was used.
3 Results and discussion
3.1 Total phenolic contents (TPC) in R. canina fruits
Our results indicate that the FBBB test provides a higher and more accurate estimate of total phenolic due to its direct reaction with phenolic compounds in R. canina fruits as well as the FBBB reaction with gallic acid substrate was highly linear (R = 0.999). Accordingly, the F-C assay had a positive linear response to gallic acid (R = 0.997) Fig. 1. Although the total phenol concentration of F-C expressed as the value (354.46 ± 0.05 μg GAE/mg DM), these values were lower in the same fruit than in the total phenolics analyzed by FBBB assay (598.25 ± 0.49 μg GAE/mg DM). Results are presented in Table 1. The FBBB test, which detects phenolics directly, reported an average 1.7 fold higher concentration of total phenolics than F-C. Previous studies of strawberry fruit using the F-C assay have greatly underestimated the total phenolic concentration, and this assay should be replaced in future studies by the Fast Blue BB assay (Medina, 2011a,b). Data expressed in μg equivalent of gallic acid (GAE) to 1 mg of methanolic extract of Rosa fruits.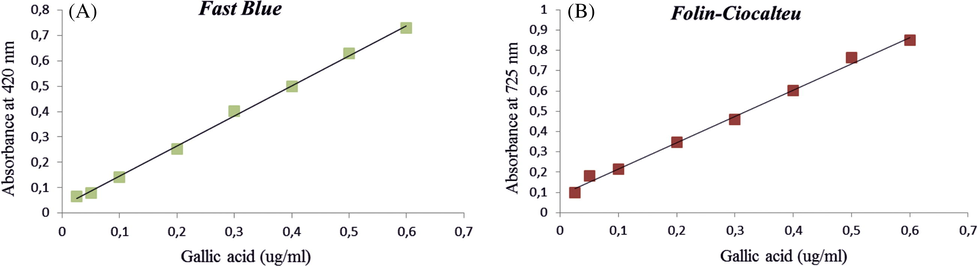
Calibration curve of total phenolic content (TPC) of ethanolic extract of Rosa canina fruits using fast blue method (1A), and Folin-Ciocalteu (1B).
Content (μg/mg DM) Total phenols
FBBB
F-C
Extraction yield (%)
30% ethanol
598.25 ± 0.49
354.46 ± 0.05
20
3.2 HPLC-UV analysis
Qualitative analysis of the ethanolic extract of R. canina fruits was tested by using HPLC-UV analysis and their chromatographic profile was compared with the retention times and absorption spectrum of reference standards (phloroglucinol, gallic acid, protocatechuic acid, chlorogenic acid, caffeic acid, p-coumaric acid, ferulic acid, catechin, epicatechin, quercetin, quercetin-3-glucoside, apigenin, resveratrol and kaempferol). From the HPLC-UV profile it was observed that the ethanolic extract showed the presence of four big peaks at 280 nm. The peaks were identified as gallic acid, chlorogenic acid, caffeic acid and ferulic acid with Rt between 4.886 and 20.809 min. Phloroglucinol, protocatechuic acid, p-coumaric acid, Catechin, epicatechin, quercetin-3-glucoside and resveratrol were identified at 280 nm with Rt between 5.887 and 31.299 min, and traces of quercétine, apigenin and kaempferol Figs. 2 and 3 (Table 2). This analysis gives an idea on the composition of polyphenols presented in the fruits of R. canina (Jafri et al., 2017).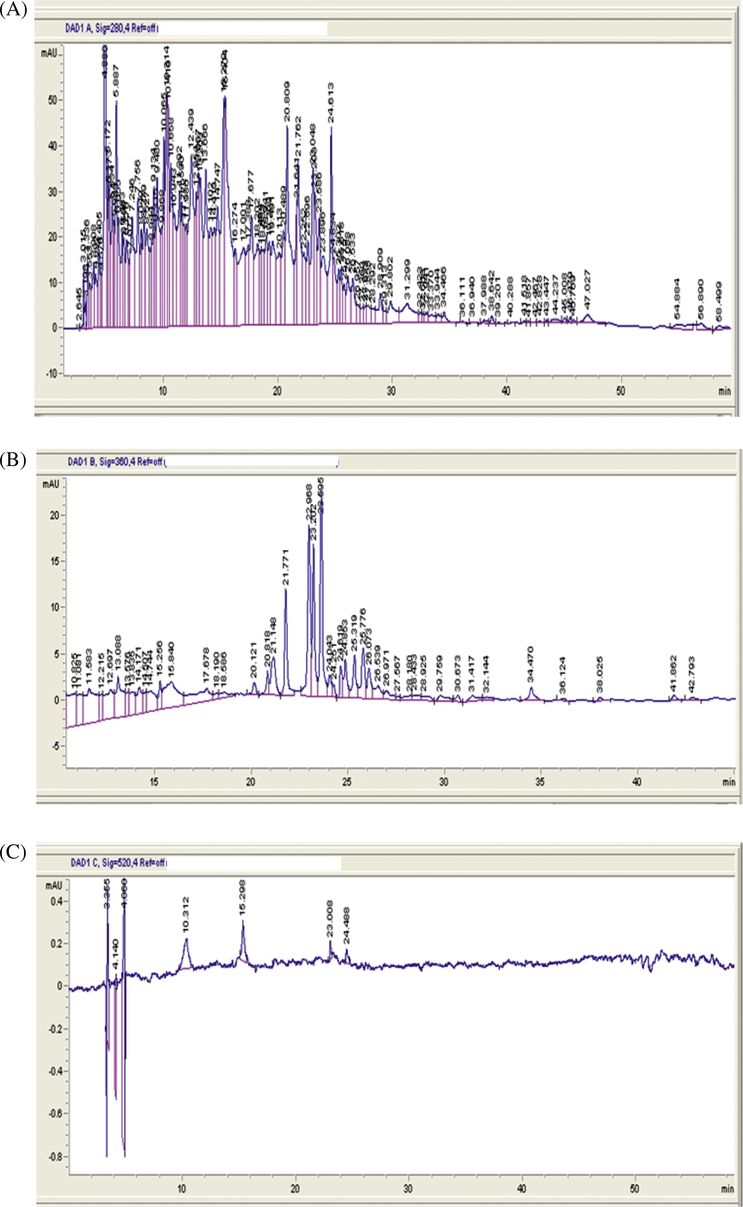
HPLC-UV-DAD chromatograms of extract of Rosa canina fruits.
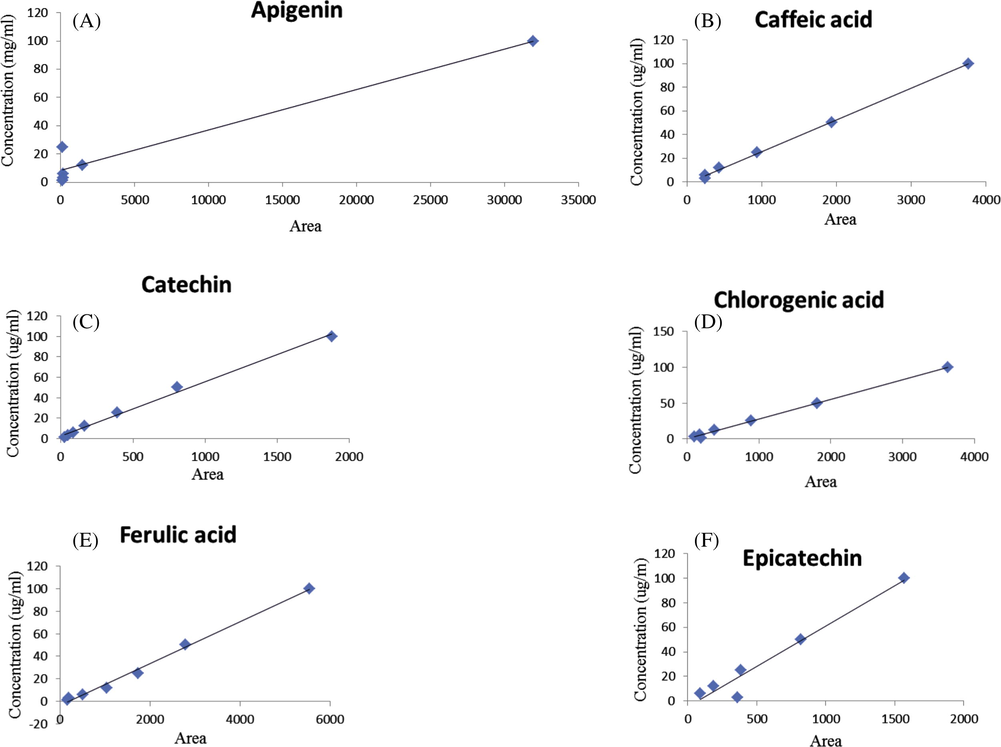
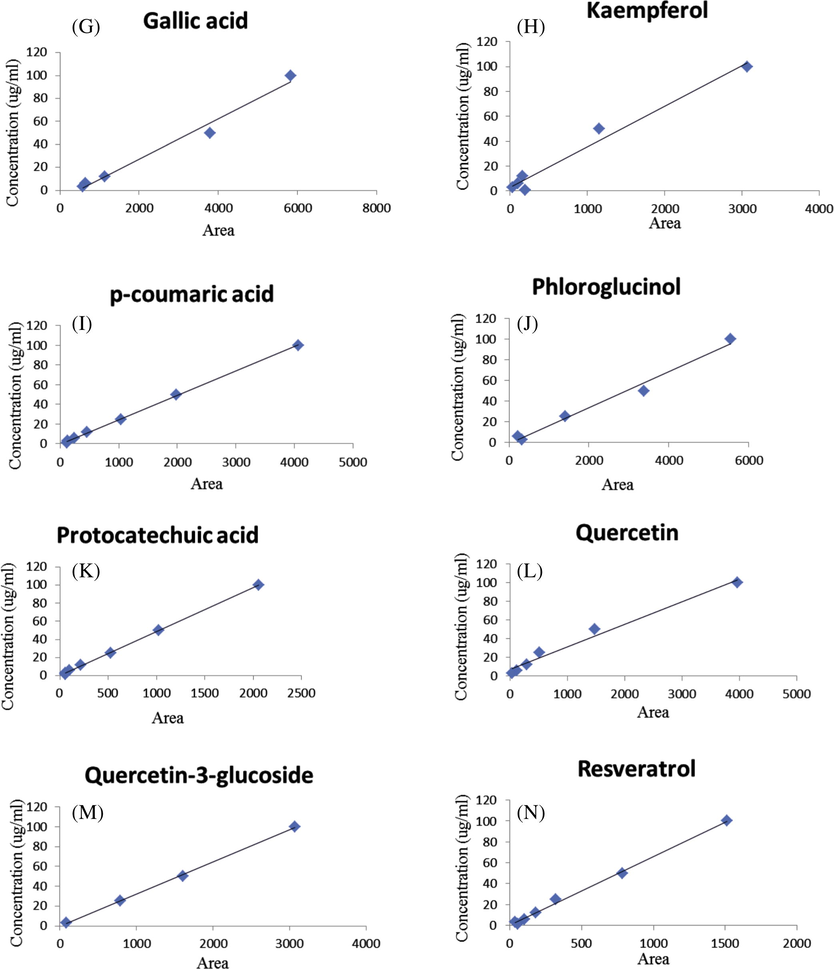
HPLC-UV-DAD calibration curves of phenolic standards, Apigenin (3A), Cafeic acid (3B), Catechin (3C), Chlorogenic acid (3D), Ferulic acid (3E), Epicatechin (3F), Gallic acid (3G), Kaempferol (3H), p-coumaric acid (3I), Phloroglucinol (3J), Protocatechuic acid (3K), Quercetin (3L), Quercetin-3-glucoside (3M), Resveratrol (3N).
HPLC-UV-DAD calibration curves of phenolic standards, Apigenin (3A), Cafeic acid (3B), Catechin (3C), Chlorogenic acid (3D), Ferulic acid (3E), Epicatechin (3F), Gallic acid (3G), Kaempferol (3H), p-coumaric acid (3I), Phloroglucinol (3J), Protocatechuic acid (3K), Quercetin (3L), Quercetin-3-glucoside (3M), Resveratrol (3N).
Compounds
Concentration (μg/ml)
λmax
Rt (min)
Area
Equation
Coefficient R
Phloroglucinol
100
280
5.887
505.37
y = 0.0175x − 1.2643
0.992
Gallic acid
50
280
4.886
2239.65
y = 0.0176x − 8.1344
0.992
Protocatechuic acid
50
280
10.658
546.69
y = 0.0486x + 0.1167
1.000
Chlorogenic acid
50
280
12.392
1117.06
y = 0.0277x − 0.3489
0.999
Caffeic acid
50
280
15.404
1399.72
y = 0.0268x − 1.1533
0.999
p-coumaric acid
50
280
21.762
649.97
y = 0.0248x − 0.2303
1.000
Ferulic acid
50
280
20.809
1002.28
y = 0.0185x − 3.4214
0.997
Catechin
100
280
11.392
518.73
y = 0.0533 + 2.3051
0.997
Epicatechin
100
280
13.666
716.76
y = 0.0659x − 4.7479
0.976
Quercetin
100
280
33.37
57.78
y = 0.0243 + 6.862
0.990
Quercetin-3-glucoside
100
280
19.491
508.84
y = 0.0326x − 0.7688
1.000
Apigenin
100
330
38.642
25.37
y = 0.0029 + 8.2269
0.974
Resveratrol
15
360
31.299
305.4
y = 0.0661x − 0.0455
0.998
Kaempferol
100
360
44.44
44.237
y = 0.0326 + 2.9976
0.988
3.3 HPLC-MS analysis of phenolic compounds and peaks identification
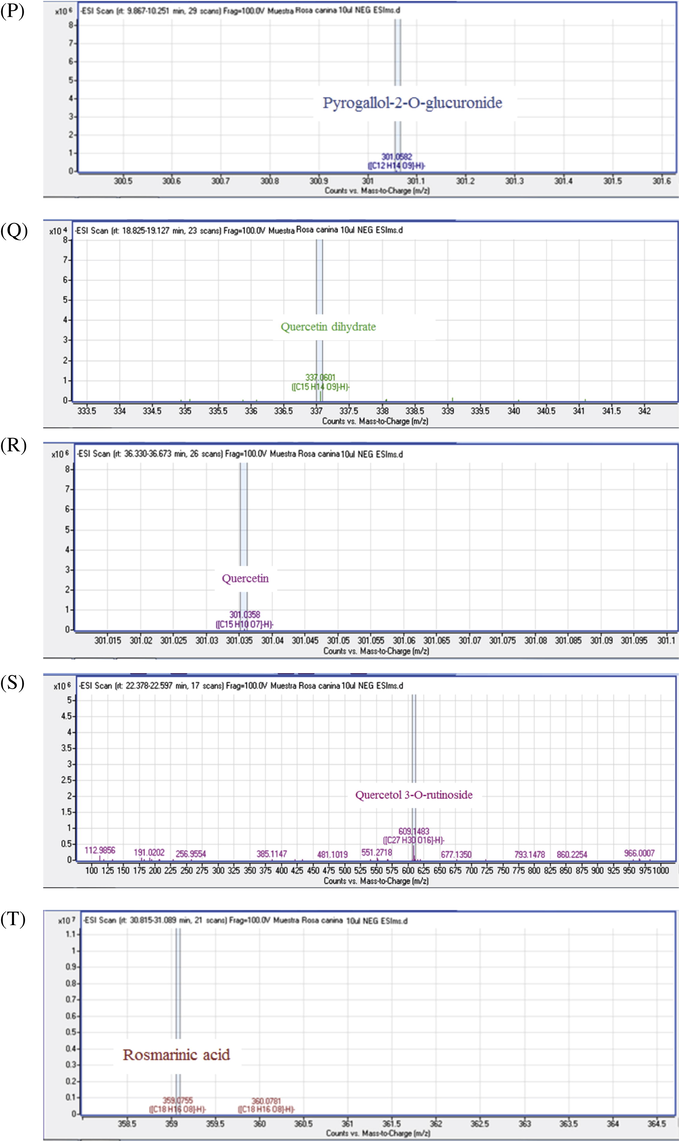
25 phenolic compounds belonging to a variety of classes of natural products were detected in R. canina by HPLC-UV-MS/MS analysis using negative ionization modes, results are shown in Fig. 4, the identities, retention times (Rt min), chemical formula, pseudomolecular ions [M-H]−, peak purity (%) and fragment ions MS/MS (m/z) for individual compounds were reported in Fig. 5 (Table 3). nd: not detected.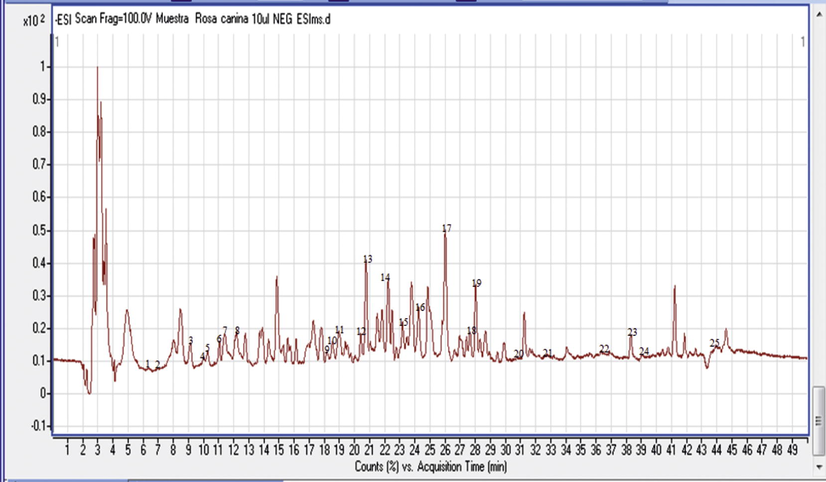
HPLC-MS-DAD chromatograms of extract of Rosa canina fruits at-ESI mode.
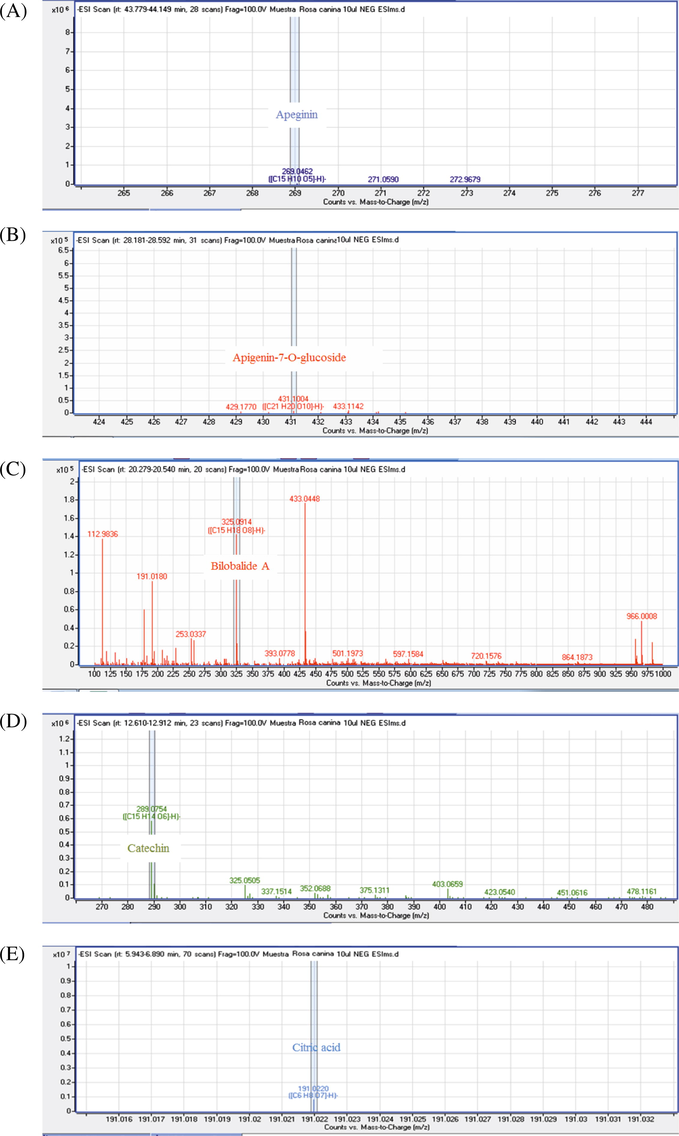
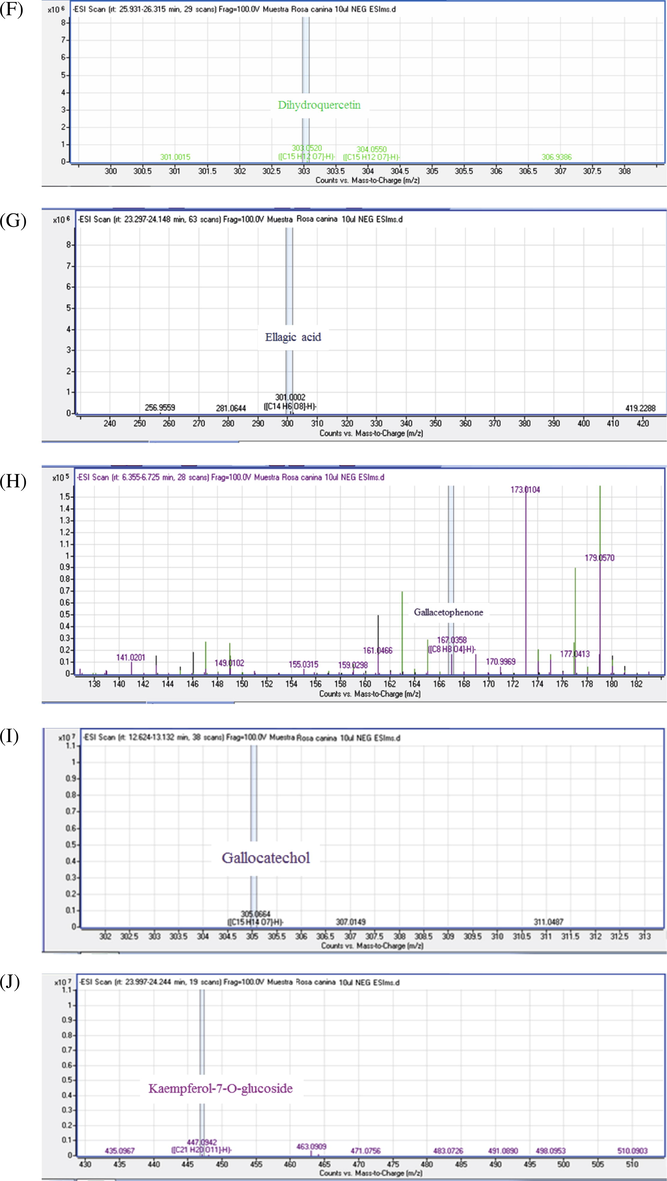
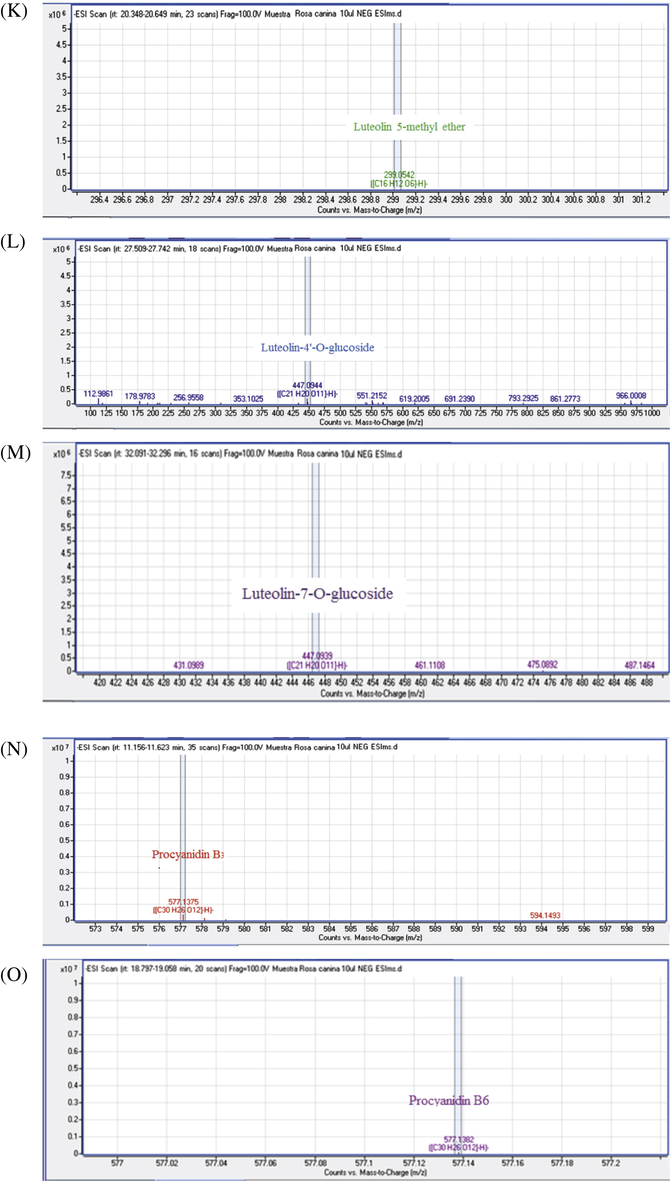
MS/MS spectra of chemical compounds of extract of Rosa canina. Apigenin (5A), Cafeic acid (3B), Apigenin-7-O-glucoside (5B), Bilobalide A (5C), Catechin (5D), Citric acid (5E), Dihydroquercetin (5F), Ellagic acid (5G), Gallacetophenone (5H), Gallocatechol (5I), Kaempferol-7-O-glucoside (5J), Luteolin 5-methyl ether (5K), Luteolin-4′-O-glucoside (5L), Luteolin-7-O-glucoside (5M), Procyanidin B3 (5N), Procyanidin B6 (5O), Pyrogallol-2-O-glucuronide (5P), Quercetin dehydrate (5Q), Quercetin (5R), Quercetol 3-O-rutinoside (5S), Rosmarinic acid (5T).
MS/MS spectra of chemical compounds of extract of Rosa canina. Apigenin (5A), Cafeic acid (3B), Apigenin-7-O-glucoside (5B), Bilobalide A (5C), Catechin (5D), Citric acid (5E), Dihydroquercetin (5F), Ellagic acid (5G), Gallacetophenone (5H), Gallocatechol (5I), Kaempferol-7-O-glucoside (5J), Luteolin 5-methyl ether (5K), Luteolin-4′-O-glucoside (5L), Luteolin-7-O-glucoside (5M), Procyanidin B3 (5N), Procyanidin B6 (5O), Pyrogallol-2-O-glucuronide (5P), Quercetin dehydrate (5Q), Quercetin (5R), Quercetol 3-O-rutinoside (5S), Rosmarinic acid (5T).
MS/MS spectra of chemical compounds of extract of Rosa canina. Apigenin (5A), Cafeic acid (3B), Apigenin-7-O-glucoside (5B), Bilobalide A (5C), Catechin (5D), Citric acid (5E), Dihydroquercetin (5F), Ellagic acid (5G), Gallacetophenone (5H), Gallocatechol (5I), Kaempferol-7-O-glucoside (5J), Luteolin 5-methyl ether (5K), Luteolin-4′-O-glucoside (5L), Luteolin-7-O-glucoside (5M), Procyanidin B3 (5N), Procyanidin B6 (5O), Pyrogallol-2-O-glucuronide (5P), Quercetin dehydrate (5Q), Quercetin (5R), Quercetol 3-O-rutinoside (5S), Rosmarinic acid (5T).
MS/MS spectra of chemical compounds of extract of Rosa canina. Apigenin (5A), Cafeic acid (3B), Apigenin-7-O-glucoside (5B), Bilobalide A (5C), Catechin (5D), Citric acid (5E), Dihydroquercetin (5F), Ellagic acid (5G), Gallacetophenone (5H), Gallocatechol (5I), Kaempferol-7-O-glucoside (5J), Luteolin 5-methyl ether (5K), Luteolin-4′-O-glucoside (5L), Luteolin-7-O-glucoside (5M), Procyanidin B3 (5N), Procyanidin B6 (5O), Pyrogallol-2-O-glucuronide (5P), Quercetin dehydrate (5Q), Quercetin (5R), Quercetol 3-O-rutinoside (5S), Rosmarinic acid (5T).
No
Proposed compound
Rt (min)
Accurate mass [M-H]−
MS/MS (m/z)
Peak purity (%)
Molecular formula
Nature of compound
01
Citric acid
6.41
191.022
191
79.71
C6H8O7
Tricarboxylic acid
02
Gallacetophenone
6.56
167.0358
125, 167
77.41
C8H8O4
Hydrolysable tannin
03
Procyanidin B2
9.13
577.1375
425, 407, 289. 287
91.66
C30H26O12
Proanthocyanidin
04
2,3-Digalloylglucose
9.26
483.0815
483, 125
55.19
C20H20O14
Hydrolysable tannin glucoside
05
Pyrogallol-2-O-glucuronide
10.06
301.0582
301, 125
81.95
C12H14O9
Hydrolysable tannin glucoside
06
Procyanidin B3
11.39
577.1375
425, 407, 289, 287
91.66
C30H26O12
Proanthocyanidin
07
Catechin
12.76
289.0754
289
68.36
C15H14O6
Flavan-3-ol
08
Gallocatechol
13.02
305.0664
305, 289
71.21
C15H14O7
Flavan-3-ol
09
Quercetin 3,7-diglucoside
18.43
625.1462
625, 463, 301
47.89
C27H30O17
Flavonol glucoside
10
Procyanidin B6
18.93
577.1382
425, 407, 289, 287
87.09
C30H26O12
Proanthocyanidin
11
Quercetin dihydrate
18.97
337.0601
337, 301
nd
C15H14O9
Flavonol
12
Bilobalide A
20.48
325.0914
325
91.1
C15H18O8
Sesquiterpene
13
Luteolin 5-methyl ether
20.50
299.0542
299, 285
67.16
C16H12O6
Flavone
14
Quercetol 3-O-rutinoside
22.47
609.1483
609, 463, 301
93.23
C27H30O16
Flavonol glucoside
15
Ellagic acid
23.46
301.0002
301
95.34
C14H6O8
Hydrolysable tannin
16
Kaempferol-7-O-glucoside
24.11
447.0942
447, 285
67.18
C21H20O11
Flavonol glucoside
17
Dihydroquercetin
26.16
303.0520
303
96.65
C15H12O7
Flavonol
18
Luteolin-4′-O-glucoside
27.63
447.0944
447, 285
96.92
C21H20O11
Flavone glucoside
19
Apigenin-7-O-glucoside
28.40
431.1004
431, 269
68.94
C21H20O10
Flavone glucoside
20
Rosmarinic acid
30.94
359.0755
359
82.78
C18H16O8
Hydroxycinnamic acid
21
Luteolin-7-O-glucoside
32.19
447.0939
447, 285
85.61
C21H20O11
Flavone glucoside
22
Quercetin
36.48
301.0358
301
95.14
C15H10O7
Flavonol
23
Kaempferol-3-Glucoside-2″-p-coumaroyl
38.31
593.1311
593, 463, 285, 163
98.27
C30H26O13
Flavonol glucoside
24
Kaempferol
39.13
285.0411
285
97.12
C15H10O6
Flavonol
25
Apigenin
43.88
269.0462
269
83.54
C15H10O5
Flavone
The phenolic acids with its types (Hydroxycinnamic acid and Tricarboxylic acid) were represented by peaks 1 and 18 in the chromatogram, and they were identified as citric acid and rosmarinic acid, respectively.
Citric acid was identified at Rt 6.41 min and m/z 191.022, the important role of this acid in the Krebs cycle has drawn the attention of a number of research groups, especially for use in diagnosis and targeting of cancer. Rosmarinic acid, which is the print of Rosaceae family, corresponded to Rt 30.94 min and m/z 359.0755 as shown in (Table 3) (Mcdunn et al., 2013; Tohma et al., 2016).
Flavan-3-ol peaks were represented by peaks 6 and 7at Rt 12.76, 13.02, and m/z 289.0754, 305.0664 respectively, which corresponded to catechin and gallogatechol. Proanthocyanidin B-type isomers were detected in three peaks (2, 5 and 9) at 9.13, 11.39 and 18.93 min and the signal at m/z 577 indicated that the dimers are mixed; two units of catechin and/or epicatechin. The obtained MS/MS (m/z) fragments of the condensed tannins were 425, 407, 289 and 287 (Friedrich and Eberhardt, 2000). The fragmentation pathway by Retro Diels-Alder in the T-unit of procyanidin B3 was the important mechanism that allowed its detection in the ions m/z 425 and 407. Hydrolysable tannins (gallotannin and ellagitannin; gallacetophenone and ellagic acid respectively) were reported by two peaks (2 and 15). Hydrolysable tannin glucosides were assigned to peaks 3 and4, which corresponded to 2,3-Digalloylglucose and Pyrogallol-2-O-glucuronide; they were identified at 6.56, 9.26, 10.06 and 23.46 min with m/z 167.0358, 483.0815, 301.0582 and 301.0002 respectively (Table 3) (Kassim et al., 2010; Ridder et al., 2012).
The chromatogram peak 11 reflected the different types of terpenoids such asbilobalide A. These compounds were identified at Rt 20.48 min and m/z 325.0914 with high peak purity 91.1% (Table 3) (Rana et al., 2014; Wang et al., 2013).
The principal subclasses of flavonoids were the abundant compounds present in R. canina (Table 3), in the structure portrayal, we initially judged if the flavonoid glycoside is a C-glycosylated. The carbon-carbon obligation of C-glycosyl flavonoids is impervious to burst and in C-glycosides for the most part the fracture of the sugar unit is watched. Fracture pathway of O-glycosylated flavonoids begins with the cleavage of the glycosidic bonds and disposal of the sugar moieties with charge maintenance on aglycone. In mixes containing at least two sugars to the same aglycone carbon, particles emerging from the cleavage of the glycosidic bonds between sugar units are feeble. Despite the fact that the aglycone and the glycane were altogether recognized, the exact structure of the flavonoids glycoside couldn't be constantly decided on the grounds that personality and the site of association of monosaccharide can't be controlled by LC-MS. The structures of mixes were at last distinguished by correlation with bibliographical studies (Ana Plazonić et al., 2009).
The C-glycosylated flavones were additionally found in R. canina fruits. Peaks 18 and 21 corresponded to two isomers, namely, luteolin-4′-O-glucoside and luteolin-7-O-glucoside (Table 3). Their identities were based on their pseudomolecular ion [M-H]− at m/z 447 and MS/MS spectra. They gave out fragments assigned to the losses of a hexosyl (glucose = −162 μma) to obtain the luteolin aglycone at m/z 285 and luteolin 5-methyl ether at m/z 299, and from an apigenin-7-O-glucoside at m/z 431 giving an apigenin aglycon at m/z 269 (Fernandes et al., 2017).
Flavonols are the principal compounds present in R. canina fruits; they differed in the number and position of phenolic hydroxyl —OH. Flavonols were frequently found in the form of heteroside in plants are potent antioxidants that serve to protect the plant from reactive oxygen species (ROS) (Nakabayashi et al., 2014), MS/MS spectra discharging fragments relating to the misfortunes of sucre, the glycosidic bond was cleaved about the mechanism of fragmentation of O-glycosylated flavonols. The releasing of monosaccharide residue is shown by the loss of sugar (Mraihi et al., 2015).
The MS/MS fragmentation mechanism of flavonolsaglycone based on cleavage of two C—C bonds of the C-ring releasing two fragment ions which give informations about the number and type of substituents (Cuyckens and Claeys, 2004), the pseudomolecular ions [M-H]− of flavonolsaglycone identified in R. canina at m/z 625, 609, 593, 447 and 463. Furthermore, Therefore the product ions, [aglycon–H]-, were reported at m/z 285 (Table 3), were shown fragmentations of flavonols peaks 16 and 23 (same pseudomolecular ion [M-H]− at m/z 447 and 593, respectively) corresponding to kaempferol-7-O-glucoside, kaempferol-3-Glucoside-2″-p-coumaroyl. The releasing fragments of the peaks 9 and 14 corresponded to the loss of dihexosyl (glucose and/or galactose = −162 μma) and rhamnosyl hexosyl (−146 to 162 μma) to obtain the quercetin aglycon, dihydroquercetin and quercetin dehydrate at m/z 301.303 and 337 respectively. These disaccharide should be either a diglucoside = Glc-Glc (m/z 324) or a Gal-Gal (m/z 324) and a rutinoside = Glc-Rha (m/z 308) or a Gal-Rha (m/z 308) respectively linked to the quercetin aglycone by either Glc or Gal sugar. So these peaks corresponded to quercetin 3,7-diglucoside and quercetol 3-O-rutinoside at m/z 625 and 609, respectively.
3.4 DPPH radical-scavenging activity
The antioxidant activity of the phenolic compounds depends on their chemical composition and structural conformation. These antioxidants react with DPPH, diminishing a number of DPPH molecules equivalent to the quantity of accessible hydroxyl groups (Chaouche et al., 2014; Shimada et al., 1992). The ethanolic extract and the standards (trolox, quercetin, BHT and ascorbic acid) were tested and expressed in percentage of reduction of DPPH radicals in a dose-dependent manner. For instance, At 600 and 400 μg/ml the ethanolic extract resulted in 77.22 and 68.33% reduction, respectively. Meanwhile, ascorbic acid at concentrations ranging between 600 and 400 μg/ml resulted in 91.61 and 91.49% reduction. Quercetin on the other hand displayed 88.78 and 85.39% reduction. BHT resulted in 88.44 and 88.19% reduction. While trolox displayed 90.99 and 89.80% reduction. Results are shown in Fig. 6. This extract had a high activity compared with each of the standards because it was rich in phenolic compounds such as methyl 4-O-galloylchlorogenate that showed high antioxidant activity in the DPPH free-radical assay. The high antioxidant capacity of this compound suggested that this plant was a good protection against oxidative damage (Ma et al., 2003). The genkwanin and hydroxygenkwanin exhibited significant anti-oxidative effect on DPPH (Ren et al., 2013). The DPPH radical scavenging effect was measured for some terpenoids and derivates of glycerol (Talla et al., 2016). The antioxidant activities displayed as IC50 values are illustrated in (Table 4). The IC50 value of ethanolic extract was higher than that of the ascorbic acid and BHT, but lower than that of quercetin and trolox. This difference was due to the richness of the extract in flavones (isoorientin and wogonin), glycosylated derivatives of isoflavone glucoside (daidzein and caviunin), and tannins that were detected by HPLC-MS. The important properties of the abundant antioxidants in R. canina fruits conferred dismutation of free radical DPPH. The mechanism by which some hydroxyl groups were connected with hydrogen atoms of phenolic compounds to become stable diamagnetic molecules (Boutennoun et al., 2017; Yang et al., 2016). Positive controls and Rosa extract were done in triplicate (n = 3).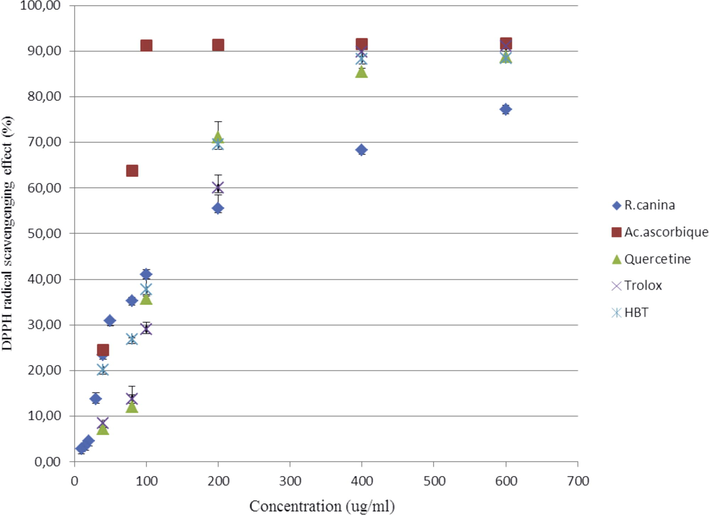
Reduction indexes of the DPPH scavenging effect (%) versus concentration, each value in the graph is shown as means ± SD.
Samples
Rosa extract
Ascorbic acid
Quercetin
BHT
Trolox
DPPH scavenging activity (IC50 μg/ml)
156.74 ± 0.56
46.74 ± 1.14
157.45 ± 2.11
132.22 ± 0.64
163.55 ± 1.25
In the present study, the positive correlation between the quantity of antioxidants in R. canina and the DPPH free radical activity (R = 0.9962) was proved (Aksoy et al., 2013; Tchouya and Barhe, 2016).
3.5 Determination of intracellular ROS levels
HepG2 and SH-SY5Y cells are the very useful model for studying the effect of oxidative stress, it is demonstrated that the cytotoxic effect of tert-butyl-induced exogenous oxidative stress (t-BOOH) trigger deleterious effects on cell growth resulting both from a rapid inflow of the free radical generator into the cell. As a result the induction of transient increases in cytosolic Ca2+ to regulate the cellular process by transcription factors that regulates the expression of genes in response to oxidative stress and kept cell survival. The correlation is reversed between the high concentration of tert-butyl with the amount of cytosolic Ca2+ obtained during the shock oxidation and when the excessive or unregulated levels of Ca2+ in the cytosol can lead to cell death (Popa et al., 2010). Antioxidant scavengers of R. canina modulated and reduced the oxidative stress of ROS to cells (HepG2 and SH-SY5Y).
Three concentrations of ethanolic extract (7, 3.6 and 1.63 μg/ml) containing t-BOOH similar to the control positive and without t-BOOH being lower to the negative control were added for both cell types respectively. Results showed a reduction in the production of ROS in all concentrations of extract used in this test compared to positive and negative controls for SH-SY5Y cells Fig. 7 (Jiménez et al., 2016). Moreover, the concentrations of 7 and 3.6 μg/ml showed high reduction in ROS in HepG2 compared to controls. Nevertheless, a concentration of 1.63 μg/ml with tert-butyl resulted in lower reduction of ROS compared to the positive control. It is noteworthy to mention that this oxidative effect of R. canina has never been mentioned before. The presence of sesquiterpene (bilobalide A) confers on the one hand neuroprotective effects and, on the other hand, the presence of such a tert-butyl group remains exceptional for such a natural compound. This tert-butyl group was the major cause of the oxidative effect of R. canina at this concentration.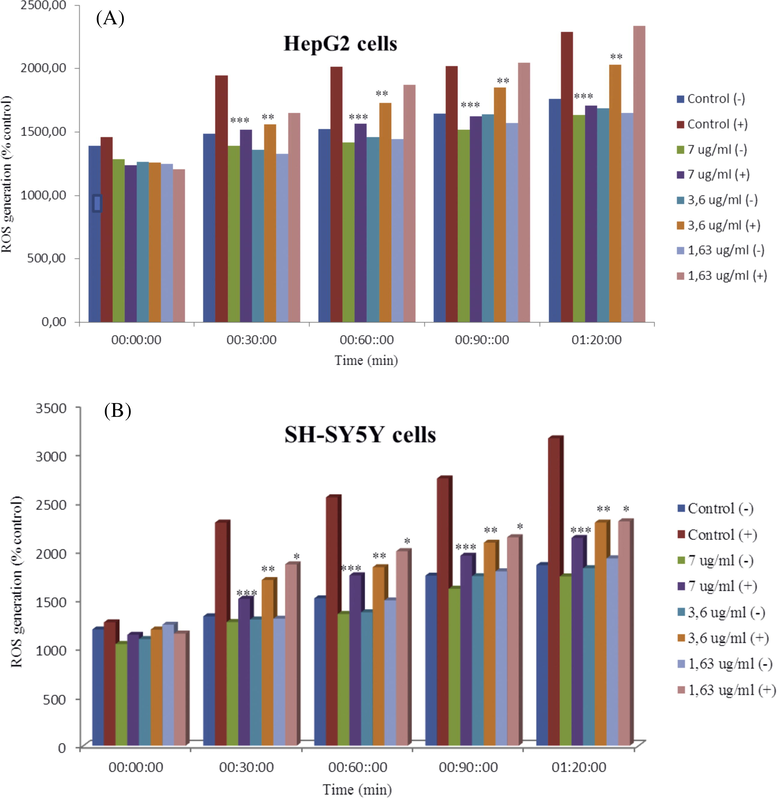
Effect of ethanolic extract on intracellular ROS levels in HepG2 (7A), and SH-SY5Y cells (7B). *P < .05, ***P < .001 significantly different from negative control cells and positive control cells.
There are an association of ROS and free radicals in the pathogenesis of certain human sicknesses, including cancer, is ending progressively, in this study, the antioxidants of R. canina fruits were modulated the ROS in order to reduce the oxidative stress in HepG2 and SH-SY5Y cells and as a result reduced the danger of risk in injury of cancer (Al-Gubory et al., 2010; Serrano et al., 2007; Trachootham et al., 2009).
4 Conclusions
In the present study, a number of analysis using HPLC-UV-MS method were carried out to reveal the composition of R. canina. Afterwards, in situ essays on HepG2 and SH-SY5Y cells were carried out to further explore the antioxidative and cytotoxic effects of R. canina. Results indicated that the antioxidant and antiproliferative effects of R. canina fruits were due to the presence of flavonoids, tannins, terpenoids, xanthonoids and glycerol glucoside. The phytochemicals of R. canina fruits made the plant a rich source of antioxidants. The high antioxidant capacity of R. canina extract suggested that this plant could be used as an additive in the food industry; providing good protection against oxidative damage. It can also be used as an effective natural treatment to control several types of cancer. The beneficial effects of R. canina fruits can lead to its usage in diets with nutritional and healthy advantages.
References
- Free radical scavenging activity, total phenolic content, total antioxidant status, and total oxidant status of endemic Thermopsis turcica. Saudi J. Biol. Sci.. 2013;20:235-239.
- [Google Scholar]
- The roles of cellular reactive oxygen species, oxidative stress and antioxidants in pregnancy outcomes. Int. J. Biochem. Cell Biol.. 2010;42:1634-1650.
- [Google Scholar]
- Extraction by solvent using microwave and ultrasound-assisted techniques followed by HPLC analysis of Harpagoside from Harpagophytum procumbens and comparison with conventional solvent extraction methods. Comptes Rendus Chim. 2016;19:692-698.
- [Google Scholar]
- In vitro cytotoxic and antioxidant activities of phenolic components of Algerian Achilleaodorata leaves. Arab. J. Chem.. 2017;10:403-409.
- [Google Scholar]
- Evaluation of antioxidant activity of hydromethanolic extracts of some medicinal species from South Algeria. J. Chinese Med. Assoc.. 2014;77:302-307.
- [Google Scholar]
- Mass spectrometry in the structural analysis of flavonoids. J. Mass Spectrom.. 2004;39:1-15.
- [Google Scholar]
- The chemical composition on fingerprint of Glandoradiffusa and its biological properties. Arab. J. Chem.. 2017;10:583-595.
- [Google Scholar]
- Investigation of proanthocyanidins by HPLC with electrospray ionization mass spectrometry. Eur. Food Res. Technol. 2000:56-64.
- [Google Scholar]
- Quercetin induces apoptosis via caspase activation, regulation of Bcl-2, and inhibition of PI-3-kinase/Akt and ERK pathways in a human hepatoma cell line (HepG2) J. Nutr.. 2006;136:2715-2721.
- [Google Scholar]
- In vitro assessment of antioxidant potential and determination of polyphenolic compounds of Hederanepalensis K. Koch. Arab. J. Chem.. 2017;10:S3699-S3706.
- [Google Scholar]
- Rosa canina extracts have antiproliferative and antioxidant effects on caco-2 human colon cancer. PLoS One. 2016;11:1-14.
- [Google Scholar]
- Ellagic acid, phenolic acids, and flavonoids in Malaysian honey extracts demonstrate in vitro anti-inflammatory activity. Nutr. Res.. 2010;30:650-659.
- [Google Scholar]
- Phenolic acids, flavonoids and total antioxidant capacity of selected leafy vegetables. J. Funct. Foods. 2012;4:979-987.
- [Google Scholar]
- Comparative analysis of strawberry total phenolics via Fast Blue BB vs. Folin-Ciocalteu: Assay interference by ascorbic acid. J. Food Compos. Anal.. 2012;27:102-107.
- [Google Scholar]
- Bioactive novel polyphenols from the fruit of Manilkara zapota (Sapodilla) J. Nat. Prod. 2003:983-986.
- [Google Scholar]
- Preliminary phytochemical screening, total phenolic content and antibacterial activity of thirteen native species from Guayas province Ecuador. J. King Saud Univ. – Sci. 2017
- [Google Scholar]
- Simple and rapid method for the analysis of phenolic compounds in beverages and grains. J. Agric. Food Chem.. 2011;59:1565-1571.
- [Google Scholar]
- Determination of the total phenolics in juices and superfruits by a novel chemical method. J. Funct. Foods. 2011;3:79-87.
- [Google Scholar]
- Phytochemical contents and biological activities of Rosa canina fruit from Iran. J. Med. Plants Res.. 2011;5:4584-4589.
- [Google Scholar]
- Wild grown red and yellow hawthorn fruits from Tunisia as source of antioxidants. Arab. J. Chem.. 2015;8:570-578.
- [CrossRef] [Google Scholar]
- Anti-inflammatory and anti-oxidant activities of Mallotus oppositifolius (Geisel) methanol leaf extracts. Arab. J. Chem.. 2014;7:805-810.
- [Google Scholar]
- Characterization of the antioxidant composition of strawberry tree (Arbutus unedo L.) fruits. J. Food Composition Anal.. 2008;21:273-281.
- [Google Scholar]
- Identification and quantification of flavonoids and phenolic acids in burr parsley (caucalisplatycarpos L.), using high-performance liquid chromatography with diode array detection and electrospray ionization mass spectrometry. Molecules. 2009;14:2466-2490.
- [Google Scholar]
- Exogenous oxidative stress induces Ca2+ release in the yeast Saccharomyces cerevisiae. FEBS J.. 2010;277:4027-4038.
- [Google Scholar]
- Comparative studies for screening of bioactive constituents from various parts of Incarvillea emodi. Nat. Prod. Res.: Formerly Nat. Prod. Lett. 2014:37-41.
- [Google Scholar]
- Antioxidative activity of five flavones glycosides from corn silk (Stigma maydis) Czech J. Food Sci.. 2013;31:148-155.
- [Google Scholar]
- Substructure-based annotation of high-resolution multistage MSn spectral trees. Rapid. Commun. Mass Spectrom.. 2012;26:2461-2471.
- [Google Scholar]
- Antioxidative properties of xanthan on the autoxidation of soybean oil in cyclodextrin emulsion. J. Agric. Food Chem.. 1992;40:945-948.
- [Google Scholar]
- Food antioxidant capacity determined by chemical methods may underestimate the physiological antioxidant capacity. Food Res. Int.. 2007;40:15-21.
- [Google Scholar]
- New mono-ether of glycerol and triterpenes with DPPH radical scavenging activity from Cameroonian propolis. Nat. Prod. Res.. 2016;6419:1-11.
- [Google Scholar]
- Comparative study of the anti-oxidant activity of the total polyphenols extracted from Hibiscus Sabdariffa L ., Glycine max L. Merr., yellow tea and red wine through reaction with DPPH free radicals. Arab. J. Chem. 2016:1-8.
- [Google Scholar]
- RP-HPLC/MS/MS analysis of the phenolic compounds, antioxidant and antimicrobial activities of Salvia L Species. Antioxidants. 2016;5:38.
- [Google Scholar]
- Targeting cancer cells by ROS-mediated mechanisms: a radical therapeutic approach? Nat. Rev. Drug Discov.. 2009;8:579-591.
- [Google Scholar]
- Five new phenolic glycosides from Hedyotis scandens. Bioorg. Med. Chem. Lett.. 2013;23:1379-1382.
- [Google Scholar]
- The plant resources, structure characteristics, biological activities and synthesis of pyranoflavonoids. Curr. Med. Chem. 2016
- [Google Scholar]
- Bioactive components and antioxidant activities of oak cup crude extract and its four partially purified fractions by HPD-100 macroporous resin chromatography. Arab. J. Chem.. 2019;12:249-261.
- [Google Scholar]


