

Translate this page into:
Integration of a hybrid scan approach and in-house high-resolution MS2 spectral database for charactering the multicomponents of Xuebijing Injection
⁎Corresponding author at: State Key Laboratory of Component-based Chinese Medicine, Tianjin University of Traditional Chinese Medicine, 10 Poyanghu Road, Jinghai, Tianjin 301617, China. wzyang0504@tjutcm.edu.cn (Wenzhi Yang)
-
Received: ,
Accepted: ,
This article was originally published by Elsevier and was migrated to Scientific Scholar after the change of Publisher.
Peer review under responsibility of King Saud University.
Abstract
Abstract
Xuebijing (XBJ) Injection is a reputable patent Chinese medicine widely used to cure sepsis, among the Chinese ″Three Medicines and Three Prescriptions″ solution to fight against COVID-19. We were aimed to achieve the comprehensive multicomponent characterization from the single drugs to traditional Chinese medicine (TCM) formula, by integrating powerful data acquisition and the in-house MS2 spectral database searching. By ultra-high performance liquid chromatography/ion mobility-quadrupole time-of-flight mass spectrometry (UHPLC/IM-QTOF-MS), a hybrid scan approach (HDMSE-HDDDA) was developed, while the HDMSE data for five component drugs and 56 reference compounds were acquired and processed to establish an in-house MS2 spectral database of XBJ. Good resolution of the XBJ components was accomplished on a Zorbax Eclipse Plus C18 column within 24 min, while a fit-for-purpose HDMSE-HDDDA approach was elaborated in two ionization modes for enhanced MS2 data acquisition. XBJ MS2 spectral library was thus established on the UNIFITM platform involving rich structure-related information for the chemicals from five component drugs. We could identify or tentatively characterize 294 components from XBJ, involving 81 flavonoids, 51 terpenoids, 42 phthalides, 40 organic acids, 13 phenylpropanoids, seven phenanthrenequinones, six alkaloids, and 54 others. In contrast to the application of conventional MS1 library, this newly established strategy could demonstrate superiority in the accuracy of identification results and the characterization of isomers, due to the more restricted filtering/matching criteria. Conclusively, the integration of the HDMSE-HDDDA hybrid scan approach and the in-house MS2 spectral database can favor the efficient and more reliable multicomponent characterization from single drugs to the TCM formula.
Keywords
Xuebijing Injection
UHPLC/IM-QTOF-MS
HDMSE-HDDDA
MS2 spectral database
Multicomponent characterization

1 Introduction
As one of the most active branches in systems biology, metabolomics has been covering a wide range of application and broad development in many research fields, including the natural product research and quality control of traditional Chinese medicine (TCM) (Jacob et al., 2019; Li et al., 2022). Metabolomics can involve the untargeted and targeted modes, of which the former is used for the primary discovery of potential metabolite markers, while the latter can enable more accurate comparison of different groups from the quantitative aspect focusing on the metabolites of interest (Hu et al., 2020; Nöst et al., 2021). Mass spectrometry in hyphenation with different mechanisms of chromatography, involving liquid chromatography-mass spectrometry (LC-MS), gas chromatography-mass spectrometry (GC–MS), and capillary electrophoresis-mass spectrometry (CE-MS), is commonly utilized for the metabolite information acquisition because of the high sensitivity and rich structural fragments facilitated by the modern MS technology (Liu et al., 2014; Lu et al., 2021; Tian, et al., 2016). By contrast, LC-MS receives the most extensive application due to the high coverage on the metabolome with wide polarity distribution (Chen et al., 2021; Li et al., 2021b).
The ongoing advancements in MS instrumentation have enabled diverse and personalized scan strategies greatly supporting the comprehensive metabolites characterization. In essence, the acquisition of the MSn information by MS can be performed by data-independent acquisition (DIA) or data-dependent acquisition (DDA). DIA can record the MS/MS fragmentation information of all the precursor ions by once fragmentation (e.g., MSE, high-definition MSE/HDMSE, and all ion fragmentation/AIF) or mass range windowed sequential fragmentation (sequential window acquisition of all theoretical fragments/SWATH) (Wang et al., 2019), which has the highest coverage on the parent ions, in theory. However, spectral deconvolution by matching between the precursors and product ions is the prerequisite to interpret the DIA data, and several in-house developed algorithms or commercial software are currently available for this purpose (Alygizakis et al., 2019; Barkovits et al., 2020). DDA can automatically trigger the MS/MS or MSn fragmentation of the most intense ions screened by the full-scan MS1, generating the definite product ions (Defossez et al., 2021). But the coverage of DDA is often very low especially when facing the complex matrix, and this shortcoming can be overcome by adding the precursor ions list (PIL) containing the target masses or including the exclusion list (EL) (Pan et al., 2019; Wang et al., 2021). The new trend that integrating DIA and DDA within a duty circle in once injection analysis has been newly attracting the attention, which can combine the high coverage of DIA and high reliability facilitated by DDA (Guan et al., 2020; Wang et al., 2022). Ion mobility mass spectrometry (IM-MS) can separate the gas-phase ions depending on their size, shape, and charge state, which thus enables an additional separation dimension and provides collision cross section (CCS) (Belova, et al. 2021). When IM-MS is combined with UHPLC, four-dimensional information for each compound (including tR, CCS, MS1, and MS2) can be obtained, greatly driving more reliable identification of the metabolites (Hernandez-Mesa et al., 2018; Zhang et al., 2019).
Among the metabolomics workflows, metabolites identification is a key segment, which can link the experimental data with the elucidation of physiological function and biological mechanism (Gomez-Gomez et al., 2022; Xie et al., 2022). However, due to the relatively large size of MS data and most of the metabolites detected are unknown, the metabolites identification is still one major bottleneck encountered in the metabolomics studies. Currently, various databases can be utilized to identify the metabolites, such as the databases containing the reference spectra (e.g., METLIN, MassBank, NIST, GMD, LipidBlast, mzCloud, Respect, GNPS, COCONUT, and EMBL-MCF), the databases containing the compounds and species-specific metabolite profiles (e.g., HMDB, CSFMetabolome, DrugBank, LMSD, and PubChem), the databases containing the information of metabolic pathways (e.g., KEGG, BioCyc, MetaCyc, HumanCyc, and Reactome), and the databases containing the metabolomic laboratory information management system (LIMS) (e.g., SetupX, Sesame LIMS, MetaboLIMS) (Du et al., 2021; Go, 2010; Phapale et al., 2021; Sorokina and Steinbeck, 2020; Vinaixa et al., 2016; Xue et al., 2020). Given the high stability and ″between-laboratory″ reproducibility, databases that include the information of CCS have been constructed through machine learning-based large-scale prediction, including ALLCCS, MetCCS, LipidCCS, DeepCCS, ISiCLE, DarkChem, and CCSBase, which promote more accurate identification of endogenous metabolites and natural products, to some degree (Qian et al., 2022; Zuo, et al., 2020; Zhu et al., 2021). As a very important research field, metabolites identification in natural product research has attracted the widespread attention. In numerous metabolomic databases, COCONUT, METLIN, MassBank, HMDB, NIST, GMD, and GNPS, have more comprehensive information and are used relatively more (Misra, 2021; Wolfender et al., 2019). Apart from the databases mentioned above, there are also some proprietary databases that can be obtained by the commercial data analysis software, such as UNIFI and MassHunter (Huang et al., 2021; Wu et al., 2012; Zhu et al., 2020). Researchers can construct the in-house libraries to overcome the lack of specific database for the study objective, such as a TCM of interest (Wang et al., 2022; Zhang et al., 2019).
Xuebijing (XBJ) Injection has been approved as a State Category II New Drug in China, in 2004, for the treatment of sepsis, which is composed by Carthamus tinctorius L. (Hong-Hua; Carthami Flos, CF), Paeonia lactiflora Pall. (Chi-Shao; Paeoniae Radix Rubra, PRR), Ligusticum chuanxiong Hort. (Chuan-Xiong; Chuanxiong Rhizoma, CR), Salvia miltiorrhiza Bge. (Dan-Shen; Salviae Miltiorrhizae Radix et Rhizoma, SMRR), and Angelica sinensis (Oliv.) Diels (Dang-Gui; Angelicae Sinensis Radix, ASR). XBJ Injection shows diverse pharmacological effects, such as the anti-inflammatory, anti-coagulant, immunomodulation, and anti-oxidative stress functions, etc. (Li et al., 2021a). Notably, XBJ Injection is among the Chinese ″Three Medicines and Three Prescriptions″ solution used to fight against COVID-19 (He et al., 2021). Various chromatography and chromatography-mass spectrometry hyphenation techniques have been developed to qualitatively and quantitatively assay its complex chemical components, thus to achieve the purpose of quality control (Chen et al., 2010; Huang et al., 2011). A UHPLC/Q-Orbitrap-MS approach could characterize 162 components (including 19 phenanthrenequinones, 33 lactones, 28 flavonoids, 12 phenolic acids, and 51 others) from XBJ, and quantitatively assay 38 thereof among 10 batches of XBJ samples (Sun et al., 2017). Another interesting work, conforming to the Q-marker concept, was performed by quantifying nine markers from the five component drugs, to realize the quality evaluation of 33 batches of XBJ samples (Yu et al., 2022). In spite of these currently available reports, few research focuses on the characterization of those minor components in XBJ Injection, which necessitates the development of more potent analytical strategy, particularly more powerful MS scan strategy and highly efficient data processing solution.
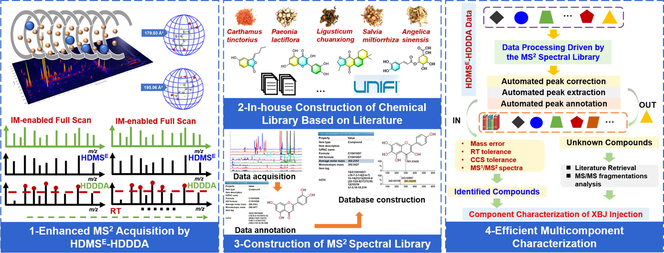
In this work, using XBJ Injection as the template, we were aimed to validate the feasibility of a strategy ″applying in-house MS2 database to achieve the efficient multicomponent characterization of TCM formula″, by utilizing the VionTM IM-QTOF high-resolution LC-MS platform (Fig. 1). In particular, a hybrid MS2 scan approach, HDMSE-HDDDA (high-definition MSE/high-definition DDA), was developed targeting the multiple classes of bioactive ingredients of XBJ. Because of the enabling of IM separation, it integrated high-definition MS1, and the alternate data-independent acquisition (DIA)-MS2 (HDMSE) and data-dependent acquisition (DDA)-MS2 (HDDDA) within a duty circle (Qian et al, 2022; Wang et al, 2022). Moreover, the method development involved the detailed optimization of the UHPLC and Vion IM-QTOF conditions in both the negative and positive modes. Relying on the analysis of five individual component drugs (CF, PRR, CR, SMRR, and ASR) of XBJ, a high-definition MS2 library was elaborated by the use of UNIFI software (Waters), recording the multidimensional structure information for each characterized component (e.g., neutral molecular mass, molecular formula, adducts, m/z, tR, mass error, drift time, CCS value, and the MS2 spectrum). Automated peak annotation workflows were established on UNIFI, and the retrieval of the XBJ in-house MS2 database could enable the efficient multicomponent characterization of XBJ. Superiority by applying this strategy over the conventional data process was discussed, as well.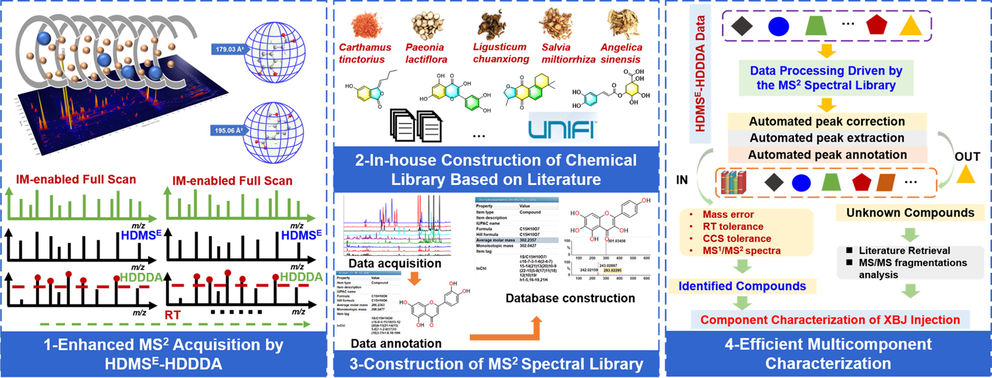
An overall technical roadmap for the analysis strategy enabling the comprehensive characterization of the multicomponents in XBJ Injection by integrating a hybrid scan approach and intelligent peak annotation workflows facilitated by UNIFI and an in-house MS2 spectral library.
2 Materials and methods
2.1 Chemicals and reagents
A total of 56 reference compounds (Fig. 2 and Table S1), involving 21 organic acids (1–21), four phenanthrenequinones (22–25), 21 flavonoids (26–46), three terpenoids (47–49), five phthalides (50–54), and two nucleosides (55, 56), were purchased from Shanghai Standard Biotech. Co., ltd. (Shanghai, China) and Desite Biotechnology Co., ltd. (Chengdu, China). HPLC-grade acetonitrile, methanol (Fisher, Fair Lawn, NJ, USA), formic acid (Sigma-Aldrich, MO, Switzerland), and ultra-pure water in-house prepared using a Milli-Q Integral 5 water purification system (Millipore, Bedford, MA, USA), were used. The five TCMs in XBJ were purchased from Beijing Tongrentang Pharmacy (CF, CR, SMRR, ASR) and Anhui Shimao Co., ltd. (PRR). XBJ Injection (batch number: 1911291), provided by Tianjin Hongri Pharmaceutical Co., ltd., was analyzed in this work.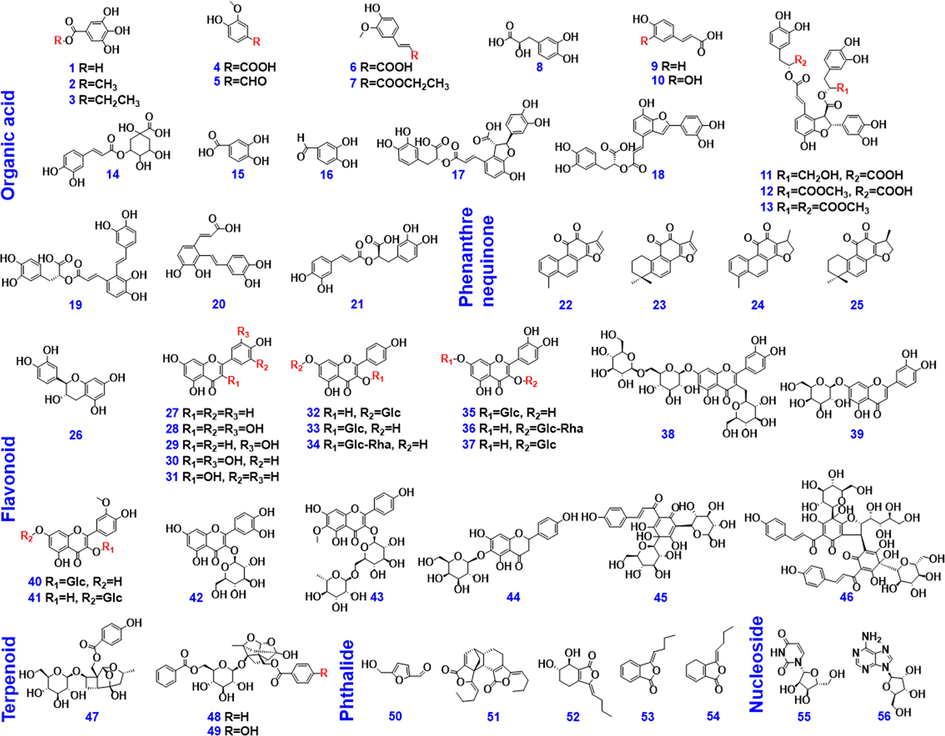
Chemical structures for the 56 reference compounds used in the current work.
2.2 Preparation of the test solutions
XBJ Injection, filtered through a 0.22-µm microporous membrane, was used as the test solution. For preparing the samples of five component drugs (CF, PRR, CR, SMRR, and ASR), each powder (500 mg) was dissolved in 10 mL 20 % methanol (v/v). After being vortexed for 2 min, each sample was extracted with the aid of ultrasound (power: 400 W; frequency: 40 kHz) at 40 °C for 30 min. After centrifugation at 11,481 g (14,000 rpm) for 10 min, the supernatant was taken and further filtered through a 0.22-μm microporous membrane, yielding the final test solution (equivalent to 50 mg/mL of the drug material).
2.3 Uhplc/Im-Qtof-Ms
The ACQUITY UPLC I-Class/ Vion™ IM-QTOF system (Waters, Milford, MA, USA) was used to collect the MS data of reference compounds, component drugs, and the XBJ sample. The Zorbax Eclipse Plus C18 column (2.1 × 100 mm, 1.8 µm) maintained at 40 °C was selected for chromatographic separation. A binary mobile phase, containing 0.1 % formic acid in water (A) and acetonitrile (B), ran according to an optimal gradient program as follows: 0–3 min, 1–5 % (B); 3–4 min, 5 %–15 % (B); 4–7 min, 15 %–15 % (B); 7–12 min, 15 %–20 % (B); 12–16 min, 20 %–21 % (B); 16–17 min, 21 %–55 % (B); 17–20 min, 55 %–70 % (B); 20–22 min, 70 %–80 % (B); 22–24 min, 80 %–95 % (B). A flow rate of 0.3 mL/min was set, and the injection volume was 5 µL.
The Vion IM-QTOF mass spectrometer was used to acquire high-accuracy MS data in both the positive and negative ion modes by the hybrid HDMSE-HDDDA scan method. Parameters for the LockSpray ion source were as follows: capillary voltage, +1.0 kV (ESI + )/–1.0 kV (ESI–); cone voltage: 60 V (ESI + )/80 V (ESI–); source offset, 80 V; source temperature, 120 °C; desolvation gas temperature (N2), 500 °C; desolvation gas flow (N2), 800 L/h; and cone gas flow (N2), 50 L/h. Default parameters for the traveling wave IM separation were defined, and the calibration of CCS was conducted according to the manufacturer's guideline using a mixture of calibrants (Paglia et al., 2015). The QTOF analyzer scanned over a mass range of m/z 50–1500 at a low collision energy of 6 eV in both two ESI modes by HDMSE at 0.3 s per scan (MS1) and HDDDA at 0.15 s per scan (MS1). The ramp collision energy (RCE) of 20–70 eV (ESI + )/30–70 eV (ESI–) was set in HDMSE. MS/MS fragmentation of three most intense precursors was automatedly triggered by HDDDA when the intensity exceeded 200 detector counts under mass-dependent ramp collision energy (MDRCE) of 20–40 eV (ESI + )/20–50 eV (ESI–) in low mass ramp settings and 30–50 eV (ESI + )/30–80 eV (ESI–) in high mass ramp settings. The MS/MS acquisition stopped until time exceeded 0.5 s. MS data calibration was conducted by constantly infusing the leucine enkephalin solution (Sigma-Aldrich, St. Louis, MO, USA; 200 ng/mL) at a flow rate of 10 µL/min.
2.4 Establishment of the high-resolution MS2 spectral database for XBJ
The MS2 spectral library for XBJ was in-house established by two steps: 1) creation of the literature-based compounds information library for each of five component drugs (CF/PRR/CR/SMRR/ASR); 2) use of the UNIFI workflows to characterize the contained compounds, and establishment of the MS2 spectral database based on the characterized ones (Fig. 1). Elaboration of the component drug databases could be illustrated using CF as a case: 1) the literature on CF phytochemistry was retrieved from Web of Science (https://www.webofknowledge.com), CNKI ( www.cnki.net), ChemSpider (https://www.chemspider.com), PubChem ( http://pubchem.ncbi.nlm.nih), Chemicalbook (https://www.chemicalbook.com), and other databases, and those reported compounds were summarized (with NMR data) and classified according to their structure types; 2) by drawing the chemical structure for each known component using ChemDraw, each structure was saved in the ″.mol″ format; 3) after importing the structural data into the UNIFI platform, the CF in-house library was established. The spectral library for five component drugs finally constituted the in-house MS2 spectral library for XBJ.
The LC-MS conditions for data acquisition of five component drugs and the mixed reference standard solutions were the same as those described in 2.3. UHPLC/IM-QTOF-MS, but the MS scan method was HDMSE. The resultant HDMSE data (ESI + and ESI–) were imported into UNIFI for automatic data processing, by which the tR, CCS, and MS2 fragments of each compound could be obtained (major parameters were detailed in the following). The next step of characterization results checking could finally obtain the in-house MS2 spectral database for five component drugs, which could be searched by UNIFI to automatedly identify the multicomponents from XBJ.
The UNIFI 1.9.3.0 (Waters) performed the data correction, peak picking, and peak annotation, to process the uncorrected HDMSE of five component drugs. In the parameter of ″Find 4D Peaks″, high-energy intensity threshold at 100.0 counts and low-energy intensity threshold at 200.0 counts were set. For the setting of ″Target by mass″, target match tolerance at 10.0 ppm was used, and the functions of ″Screen on all isotopes in a candidate″, ″Generate predicted fragments from structure″, and ″Look for in-source fragments″, were enabled. The fragment match tolerance was 10.0 mDa. Adducts: positive adducts including + H, +Na, and + K; Lock mass: combine width, 3 scans; mass window, 0.5 m/z; reference mass, 556.2766; reference charge, +1; negative adducts including + HCOO and –H; Lock Mass: combine width, 3 scans; mass window, 0.5 m/z; reference mass, 554.2620; reference charge, –1.
2.5 Automated annotation of the HDMSE & HDDDA data by searching the in-house MS2 spectral library achieving the multicomponent characterization of XBJ
By using the UNIFI platform and automatic searching of the in-house MS2 spectral library, the HDMSE and HDDDA data (in both the ESI + and ESI– modes), obtained using the established hybrid scan strategy, were efficiently processed enabling the multicomponent characterization of XBJ. For processing the HDDDA data, the established MS2 spectral library of XBJ in the positive and negative ion mode were called in the ″expected component list″. A list of the ″identified components″ was obtained involving diverse information (e.g., detected m/z, formula, mass error and adducts, expected RT (referring to the value recorded in the MS2 spectral library), observed RT, observed drift, expected CCS, observed CCS, and CCS Delta, etc.). In addition to the ″identified components″ list, the compounds in the ″unknown components″ list were further characterized by comparison with the literature and MS2 data analysis, aimed to identify more potential targeted compounds. Processing of the HDMSE data of XBJ was consistent with the approach depicted for the HDDDA data. The parameters set for ″Find 4D Peaks″, ″Target by mass″, ″Adducts″, and ″Lock Mass″, were the same as those set in processing the HDMSE data of five component drugs. The additional parameters included: Find DDA masses (in HDDDA): MS ion intensity threshold, 200.0 counts; MSMS ion intensity threshold, 100.0 counts. Target by retention time: absolute retention time identification tolerance, 0.1 min. Target by collision cross section: collision cross section tolerance, 2.0 %.
3 Results and discussion
3.1 Optimization of a reversed-phase UHPLC/IM-QTOF-MS approach targeting the multiple classes of components from XBJ Injection
We were aimed to develop a reversed-phase UHPLC/IM-QTOF-MS approach to resolve more minor components from XBJ Injection with the enhanced sensitivity in detection. Given the rather complex chemical composition of XBJ (Sun et al., 2017), key parameters affecting both the UHPLC separation and Vion IM-QTOF mass spectrometer were optimized in sequence.
Selectivity of the stationary phase can determine the resolution in the UHPLC separation. Ten reversed-phase C18 column (Table S2) with different silica gel cores and bonding technologies (purchased from Agilent, Waters, and Phenomenex) were compared, by comprehensively evaluating the resolution and the number of resolved peaks (according to the positive-mode MSE data processed by UNIFI; Fig. S1). As a result, Zorbax Eclipse Plus C18 (the number of resolvable peaks: 2601), Zorbax SB-C18 (3348), Zorbax Extend C18 (3382), Zorbax SB-Aq (2945), and BEH C18 (3136), could resolve more peaks than the other five columns from XBJ. Moreover, Zorbax Eclipse Plus C18 enabled relatively good response for the major components in the BPI chromatogram, and better peak shape than the others. What’s more, filled with high-performance particulate C18, Zorbax Eclipse Plus C18 is advantageous for the analysis of the acidic and neutral samples, and especially the basic components that show poor peak shape on the other columns (pH tolerance: 2–9). The column temperature varying between 25 and 40 °C was examined to test its influence on the resolution of XBJ components by using the selected Zorbax Eclipse Plus C18 column (Fig. S2). Comparatively, higher level of temperature could lead to better resolution in whole, and at 40 °C (8006) the largest amount of peaks were resolved. We further slightly adjusted the gradient elution program, and the satisfactory performance in chromatography was enabled, ultimately.
To enhance the sensitivity of detection and produce rich fragments beneficial to characterizing more minor components from XBJ Injection, two key ion source parameters (capillary voltage and cone voltage) together with the collision energy (RCE for HDMSE and MDRCE for HDDDA), on the VionTM IM-QTOF mass spectrometer, were optimized by comparing the ion response (integrated peak area through three injections in parallel) of the reference compounds and the abundance of MS2 fragments in both the positive and negative modes. Influences by the variation of capillary voltage (0.5–3.0 kV) were tested using HSYA, rutin, 9-methyl lithospermate B, oxypaeoniflorin, and benzoylpaeoniflorin in the negative ion mode, while kaempferol, quercetin, benzoyloxypaeoniflorin, salvianolic acid C, and tanshinone I in the positive mode, as the index components (Fig. S1). It could be found that the peak areas of HSYA, rutin, and oxypaeoniflorin (ESI–) gradually decreased when increasing the voltage from 0.5 to 3.0 kV, but the response of 9-methyllithospermate B and benzoylpaeoniflorin showed no significant alternation. Moreover, the reproducibility of three parallel analyses at 0.5 kV was worse than those at 1.0 kV, and accordingly, the capillary voltage of 1.0 kV in ESI– was set. In the positive mode, most of the index compounds (except salvianolic acid C) showed the downward trend with the increase of voltage value, and thus the same level of capillary voltage at 1.0 kV was selected in the positive mode. In the case of cone voltage (20–120 V), five index components showed inconsistent variation trends (the best ion response obtained at 80 V for HSYA and oxypaeoniflorin, 100 V for rutin, 20 V for 9-methyl lithospermate B, and 40 V for benzoylpaeoniflorin) in the negative mode, and we finally selected 80 V. Differently, in the positive mode, benzoyloxypaeoniflorin and tanshinone I showed the best ion response at 60 V, while kaempferol, quercetin, and salvianolic acid C, gave the strongest signals at 80 V, 100 V, and 20 V, respectively. The cone voltage at 60 V in the positive ion mode was selected. The collision energy was optimized by observing the fragmentation degree of the index compounds. For RCE in HDMSE (Fig. S3), four different levels (including 20–60 eV, 30–70 eV, 40–80 eV, and 60–100 eV) were examined in the negative mode, taking HSYA, rutin, oxypaeoniflorin, and salvianolic acid C, as the index compounds. We could infer that the higher level of collision energy could induce more fragmentation, and the condition of 30–70 eV was considered as satisfactory, under which most of these index compounds generated the rich and diversified fragments useful for the structural elucidation. Similarly, among the four levels (including 20–70 eV, 30–90 eV, 40–80 eV, and 60–100 eV) examined in the positive mode using kaempferol, quercetin, isocryptotanshione II, and adenosine as the index compounds, 20–70 eV was a good choice. Mass-dependent RCE (MDRCE) in HDDDA can apply customized collision energy ramp on the selected precursors by separately setting the collision energy ramp at two ends (low mass and high mass) of the predefined scan range (Wang et al., 2022). For MDRCE in ESI– (Fig. S4), four different levels, involving low mass: 10–30 eV/high mass: 20–50 eV, 20–50 eV/30–80 eV, 30–50 eV/40–80 eV and 30–60 eV/40–90 eV, had been compared, while 10–30 eV/20–40 eV, 10–40 eV/20–60 eV, 20–40 eV/30–50 eV, and 30–50 eV/40–60 eV, were examined in the positive mode. Taking into account of the richness of the product ions for most index compounds, the MDRCE of 20–50 eV/30–80 eV in the negative ion mode and 20–40 eV/30–50 eV in the positive mode were selected.
The Vion IM-QTOF LC-MS platform, utilized in this work, can enable versatile high-definition MS and MS2 scan methods because of the IM separation of all precursor ions (according to the charge state, size, and shape), among which HDMSE-MS/MS represents a hybrid scan approach facilitating the alternate DIA and DDA in once injection analysis (Qian et al., 2022; Wang et al., 2022). The IM separation was found powerful in separating the co-eluted and isomeric components. For instance, the co-eluting components at 4.97, 6.61, 10.37, and 17.74 min, were separated into two independent peaks with different CCS values (Fig. S5A). Taking the co-eluting compounds at 4.97 min as the example, the two compounds showed the deprotonated precursors ([M−H]–) at m/z 771.1970 (compound 46#, C33H40O21) and m/z 787.1942 (compound 47#, C33H40O22). For 46#, the product ions at m/z 609.1461 ([M−H−Rha]–), 463.0873 ([M−H−Rha−Glc]–), and 301.0342 ([M−H−Rha−2Glc]–), were observed, which, by searching the in–house library, was characterized as 6-hydroxykaempferol-3-O-rutinoside-6-O-glucoside or its isomer. For 47#, with the elimination of attached sugars, the fragments at m/z 625.1407 ([M−H−Glc]–) and 463.0874 ([M−H−2Glc]–) were found. By the aid of reference compound comparison, this compound was identified as quercetin-3-O-β-d-glucose-7-O-β-d-gentiobioside. The isomers at m/z 313.07, 577.15, 611.16, 787.19, and 1043.26 were separated by IM, generating two remarkable peaks for each (Fig. S5B). Taking the isomers at m/z 313.07 as an example, based on the molecular formula (C17H14O6) searching in the in–house library, salvianolic acid F was a possible hit. The MS2 fragments for compound A1 were detected at m/z 269.0806 ([M−H−CO2]–) and 255.0662 ([M−H−C2O2H2]–), which could be consistent with the structure of salvianolic acid F. Compound A2 was thus deduced as an isomer of salvianolic acid F (Fig. S5C).
3.2 Establishment of an in-house high-resolution MS2 spectral database and its superiority in rapid characterization of the multicomponents from XBJ Injection
Given the fact that specific MS database useful for the multicomponent characterization of XBJ was rare, in this work, we developed an in-house high-resolution MS2 spectral database, and applied it to characterize the multiple classes of components from XBJ Injection based on the CID-MS2 (collision-induced dissociation) data obtained using the established HDMSE-HDDDA hybrid scan approach. The established MS2 spectral library for XBJ consisted of 293 components of Carthami Flos (ESI + 96, ESI– 197), 182 ones of Paeoniae Radix Rubra (ESI + 62, ESI– 120), 216 of Chuanxiong Rhizoma (ESI + 100, ESI– 116), 257 of Salviae Miltiorrhizae Radix et Rhizoma (ESI + 111, ESI– 146), and 141 of Angelicae Sinensis Radix (ESI + 68, ESI– 73).
The in-house MS2 spectral library, as a spectral library, recorded diverse structure-related information, and could greatly improve the accuracy of the identification results. This spectral library had recorded the tR, CCS, and the MS2 spectrum for each component (Fig. 3A). The identification results obtained by invoking the in-house MS2 spectral library presented not only the seven major items of information inherent in UNIFI for the MS1 library, but also the additional information like the expected RT, expected CCS, and CCS delta (ΔCCS) (Fig. 3B). Because of the absolute tR identification tolerance (<0.1 min) and ΔCCS (<2%) filtering and MS2 fragments comparison, the accuracy in the identification results was improved, compared with the application of the traditional MS1 library. Firstly, it enabled more accurate identification, taking compound 54# (tR 5.15 min, CCS: 238.59 Å2) as an example. Its MS2 spectra gave rich product ions involving m/z 611.1611, 491.1186, 325.0705, 119.0494, and the others. By searching the in-house MS2 spectral library, it was identified as HSYA, which could be confirmed by comparison with the reference standard (tR, CCS, MS1, and MS2). However, by applying the MS1 library (recording 814 known compounds ever reported for the five component drugs of XBJ), compound 54# was incorrectly identified as (2S)-4′,5-dihydroxyl-6,7-di-O-β-d-glucopyranosyl flavanone. Secondly, improved characterization was enabled for the isomers. For instance, an isomer of HSYA (tR 6.47 min) could be identified based on the characteristic DPIs similar to HSYA, even if the signal interference was remarkable (possibly dissociated from the co-eluted isomers) (Fig. 3C). Those failing to give the DPIs of HSYA were not characterized as the HSYA isomer, such as a component eluted at 7.66 min. What’s more, the in-house MS2 spectral library could differentiate the isomers, such as between compounds 144# (m/z 609.1457, tR 8.56 min, CCS 233.03 Å2) and 159# (m/z 609.1469, tR 10.01 min, CCS 234.10 Å2). Because of the filtering by both tR and CCS facilitated by the in-house MS2 spectral library, compound 144# (ΔCCS: 1.51 %) was identified as rutin, and compound 159# (ΔCCS: 1.33 %) as an isomer of rutin. Similar cases could include compounds 216#/228# (salvianolic acid B/isomer) and 219#/226# (benzoyloxypaeoniflorin/isomer).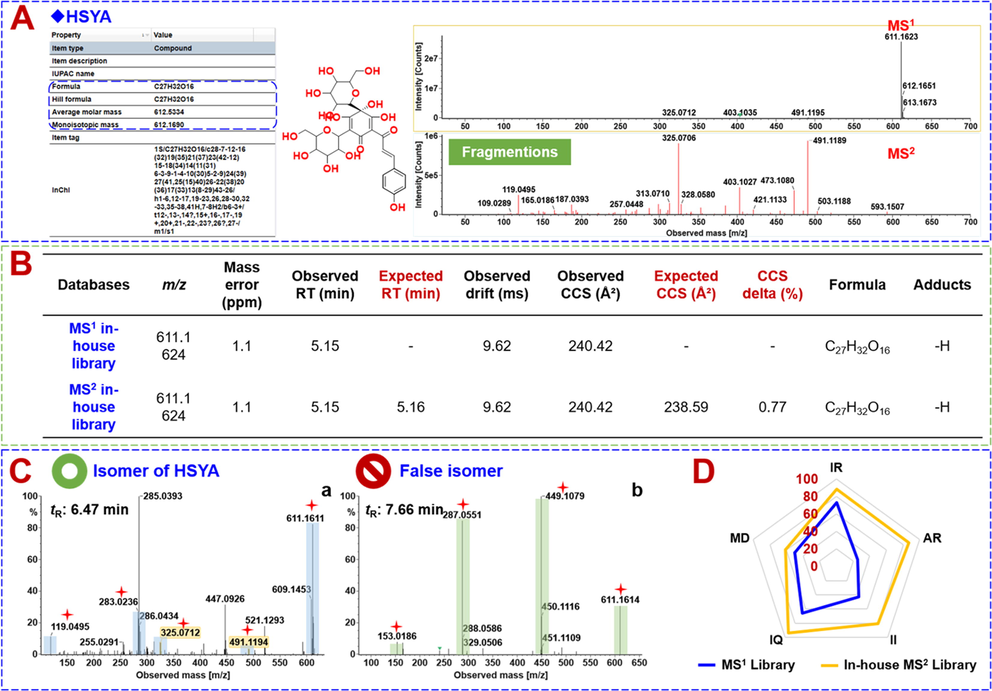
Illustration for the advantages of the in-house MS2 spectral library. A-Detailed information involved in the in-house MS2 spectral library of UNIFI using HSYA as the case; B-comparison of the processing results obtained between the in-house MS2 spectral library and the MS1 library; C-comparison of the identification of HSYA isomers by searching the in-house MS2 spectral library (a) and the MS1 library (b); D-a radar chart showing the differentiated performance between the in-house MS2 spectral library and the MS1 library (IR: Identification Rate; AR: Accuracy Rate; II: Identification of Isomers; IQ: Information Quantity; MD: Matching Degree).
Using the characterization of the Carthami Flos (CF) components as the case, we further compared the identification results for XBJ by the in-house established MS2 spectral library and the MS1 library. The results could be interpreted from the following five aspects: Identification Rate (IR), the ratio of the number for finally confirmed identifications to a constant; Accuracy Rate (AR), the ratio of the number of finally confirmed identifications to the number of primary ″Identified Components″; Identification of Isomers (II), the ratio of the number of isomers to a constant; Information Quantity (IQ), the ratio of the information quantity (items) provided by two different libraries to a constant; Matching Degree for the known compounds of XBJ (MD), the ratio of the total finally confirmed identifications to the number of components the MS1 library of CF contained. As shown in Fig. 3D by a radar chart, the in-house MS2 spectral library showed superiority over the MS1 library in all five aspects, especially in AR and II. Therefore, the established UNIFI workflows by searching the in-house MS2 spectral library could demonstrate a potent tool for the multicomponent characterization of herbal medicines, proving the improved efficiency and accuracy, in contrast to the conventional MS1 library.
3.3 Characterization of the multicomponents from XBJ Injection based on the streamlined workflows facilitated by UNIFI and the retrieval of the in-house MS2 spectral database
Comprehensive multicomponent characterization of XBJ Injection was performed by applying the hybrid scan method of HDMSE-HDDDA for data acquisition and interpreting the resultant MS2 data based on the intelligent peak annotation workflows of UNIFI and the retrieval of the established in-house MS2 spectral database (Fig. 4). The obtained HDMSE and HDDDA data of XBJ separately in the negative and the positive modes were efficiently processed (automatic data correction, peak extraction, and peak annotation) by the UNIFI workflows (Qian et al., 2022; Wang et al., 2022; Zhang et al., 2019; Zuo et al., 2019; Zuo et al., 2020), yielding a list of identified components. The primarily characterized components suffered from re-confirmation, while those listed as unknown components were re-analyzed to enrich the identification. As a result, a total of 294 compounds were characterized from XBJ, and 28 thereof were identified by comparison with the reference compounds. Detailed information regarding these characterized components is given in Table S3. Moreover, the typical neutral loss (NL) and diagnostic product ions (DPIs) encountered in the multicomponent characterization of XBJ are summarized in Fig. 4. The known NL forms included 162.05 Da for a hexose (Glc), 146.06 Da for Rha, 30.02 Da for CH2O, 43.99 Da for CO2, 27.99 Da for CO, and 18.01 Da for H2O, while the characteristic DPI, such as m/z 119.05 (C8H7O5) for characterizing a quinochalcone (Si et al., 2016), m/z 271.02 (C14H7O6) and 301.03 (C15H9O7) representative of the flavonoid aglycones (Lu et al., 2019a). In this work, we used the typical characterization cases of flavonoids, terpenoids, organic acids, phenylpropanoids, and phthalides, to illustrate the comprehensive multicomponent characterization of XBJ Injection.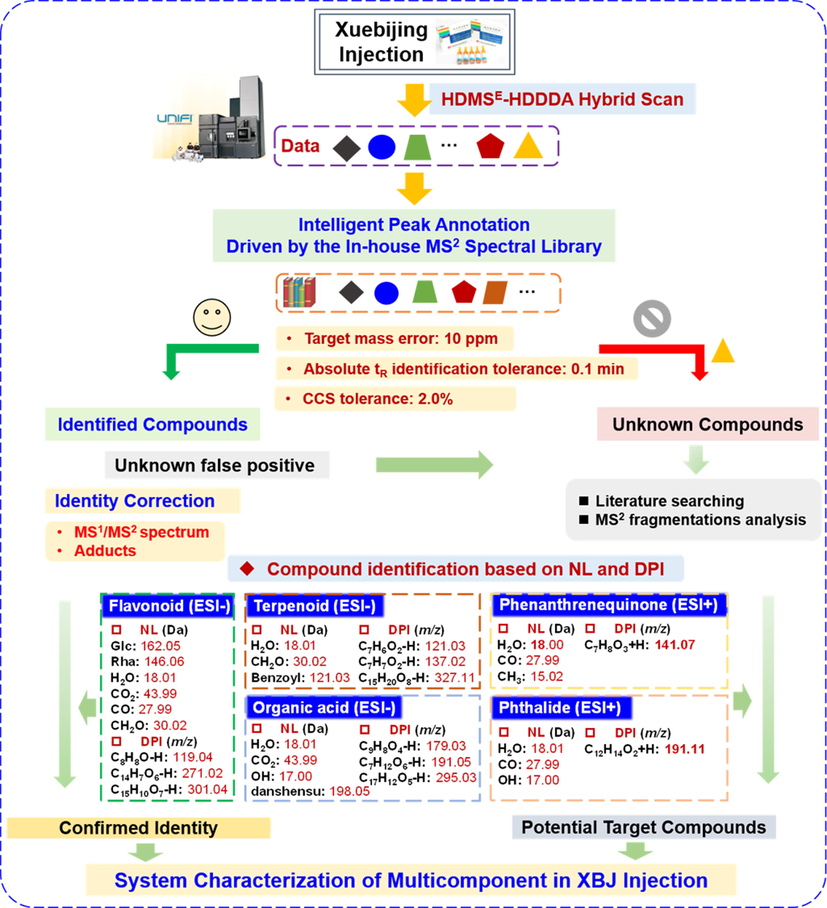
The overall compound characterization workflows based on the UNIFI informatics platform and the in-house MS2 spectral library, showing the typical neutral loss (NL) and diagnostic product ions (DPI) useful for the rapid structural elucidation of the components from XBJ Injection.
3.3.1 Characterization of flavonoids
Flavonoids, including the quinochalcones and flavonoid O-glycosides, are one class of main bioactive ingredients for XBJ, which mostly originated from the component drug, Carthami Flos (Li et al., 2021a). A total of 81 flavonoids were identified from XBJ Injection (accounting for 27.6 % of the total amount of the characterized components), and eleven thereof (47#/54#/63#/144#/151#/155#/165#/183#/227#/248#/251#) got confirmatively identified with the aid of reference compounds comparison. Compound 54# (tR 5.15 min), giving the deprotonated precursor ion ([M−H]–) at m/z 611.1611 (C27H32O16), was unambiguously identified as HSYA by comparison with the reference standard. In its MS/MS spectrum, the fragment ion at m/z 491.1186 ([M−H−C4H8O4]–, C23H23O12) could result from the 0,2X cleavage of the C-glycoside moiety (Fig. 5). It could be further fragmented into the product ion of m/z 325.0705 (C18H13O6) by the combined cleavage of CO + H2O + C4H8O4, and the ion of m/z 283.0596 (C15H11O5) was obtained because of the additional C2H2O eliminated. The DPI for quinochalcone was observed at m/z 119.0494 (C8H7O), which corresponded to the remaining moiety of ring B (p-hydroxystyrene). These data were consistent with our previous reports (Lu et al., 2019a; Si et al., 2016). Compound 203# (tR 13.86 min) showed the [M−H]– ion at m/z 613.1556, suggesting the molecular formula C30H30O14. Similarly, the combined elimination of H2O + CO2 occurring to the 3-(4-hydroxyphenyl) propanoic acid moiety generated the fragment at m/z 551.1553 (C29H27O11). What’s more, some product ions at the medium intensity, such as m/z 361.1073 (C22H17O5), 241.0495 (C14H9O4), and the characteristic ion for quinochalcone at m/z 119.0494 (C8H7O), were observed. By searching the literature, these fragments could assist to tentatively characterize compound 203# as isosafflomin C or its isomer (Yang et al., 2016). Compounds 57# (tR 5.21 min), 120# (tR 7.22 min), 144# (tR 8.56 min), and 159# (tR = 10.01 min), were characterized as the isomeric flavonoid O-glycosides (C27H30O16) based on their high-resolution MS data, amongst them 144# was identified as rutin by comparison with the reference standard. The [M−H]– ions at m/z 609.15 for compounds 144# and 159# could eliminate all the attached sugars yielding the fragment ion of the free flavone moiety at m/z 301.03 ([M−H−Glc−Rha]–; C15H9O7), which was further fragmented into the ion at m/z 271.02 by losing CH2O, one characteristic NL form for 3-O-flavonol (Yang et al., 2014). Accordingly, compound 159# was identified as the isomer of rutin.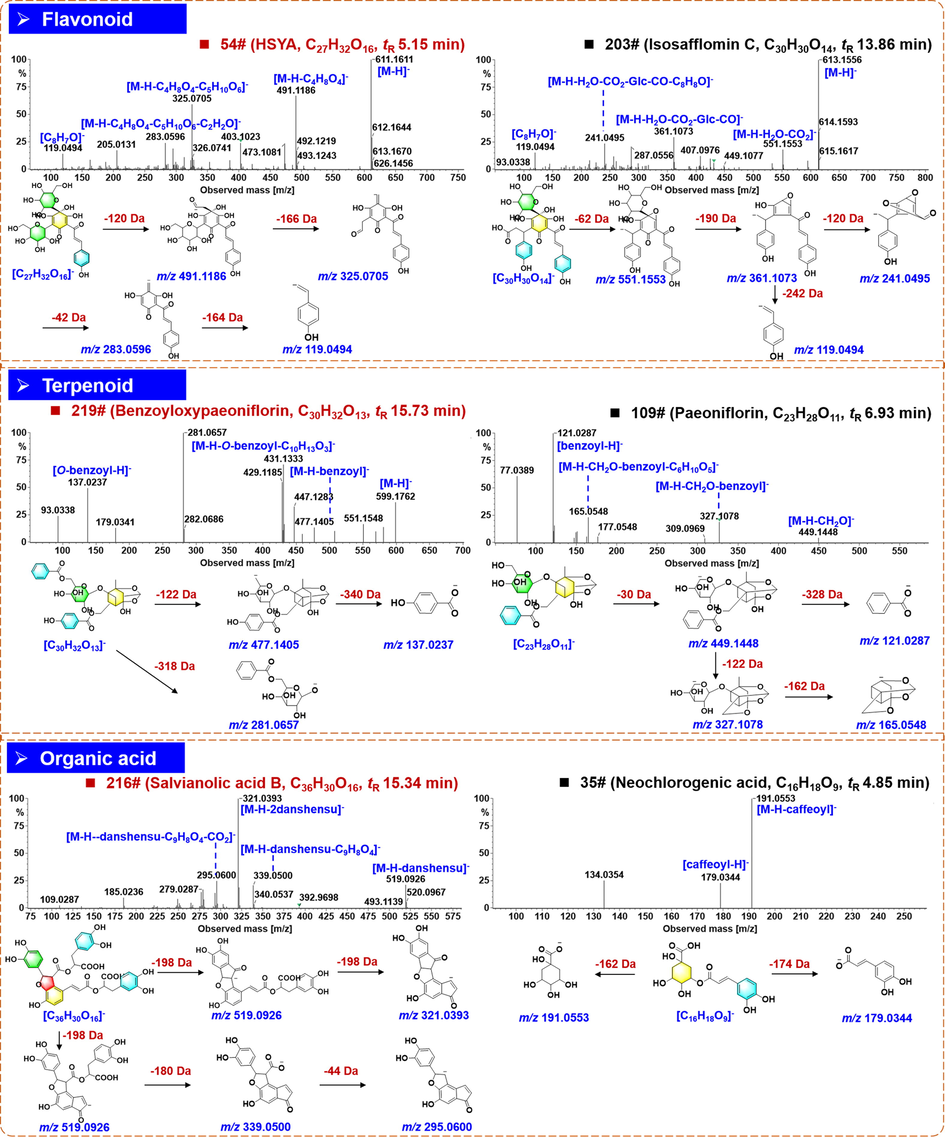
Annotation of the negative CID-MS2 spectra and proposed fragmentation pathways for the representative compounds of flavonoids, terpenoids, and organic acids from XBJ Injection.
3.3.2 Characterization of terpenoids
Terpenoids in XBJ Injection were mainly from Paeoniae Radix Rubra (Li et al., 2021c), and 51 compounds of this type were detected and characterized (17.3 % of the total amount), and three thereof (59#/219#/243#) got confirmatively identified with the aid of reference compounds comparison. Compound 219# (tR 15.73 min), corresponding to the reference compound benzoyloxypaeoniflorin (C30H32O13), which gave an abundant deprotonated precursor ion at m/z 599.1762 ([M−H]–), and upon the CID-MS2 fragmentation (Fig. 5), the fragments at m/z 477.1405 (C23H25O11), 281.0657 (C13H13O7), and m/z 137.0237 (C7H5O3), were observed corresponding to [M−H−benzoyl]–, [M—H—O—benzoyl–C10H13O3]–, and [O-benzoyl]–, respectively. These evidences were consistent with the presence of O-benzoyl group, benzoyl group, and the hexose moiety. Compound 109# (tR 6.93 min) gave the [M−H]– precursor ion at m/z 479.1555, based on which its molecular formula was inferred to be C23H28O11. Because of the NL of CH2O, the fragment at m/z 449.1448 (C22H25O10) was produced. Moreover, a typical fragment ion at m/z 121.0287 (C7H5O2) was generated due to the loss of a pinane unit and the hexose part, which could indicate the presence of benzoic acid. In addition, the low-abundance fragments m/z 327.1078 (C15H19O8) assigned as [M−H−CH2O−benzoyl]– and 165.0548 (C9H9O3) as [M−H−CH2O−benzoyl−C6H10O5]– were dissociated from the ion of m/z 449.1448. Accordingly, compound 109# was characterized as paeoniflorin or its isomer (Liu et al., 2009; Lu et al., 2019b). Information for the other terpenoid compounds characterized from XBJ is given in Table S3.
3.3.3 Characterization of organic acids
Organic acids are the common components for diverse herbal medicines, and a total of 40 compounds of this class were characterized from XBJ Injection. Twelve thereof (29#/66#/70#/78#/125#/141#/190#/201#/215#/216#/234#/235#) got identified with the aid of reference compounds comparison. Compound 216# (tR 15.34 min), consistent with salvianolic acid B (C36H30O16), showed the deprotonated precursor ion at m/z 717.1454. The product ion at m/z 519.0926 (C27H19O11) was acquired by the loss of danshensu (C9H10O5) from the precursor ion. The fragments at m/z 339.0500 (C18H11O7) for [M−H−danshensu−C9H8O4]– and m/z 295.0600 (C17H11O5) for [M−H−danshensu−C9H8O4−CO2]– were observed, as well, which lost caffeic acid (C9H8O4) and CO2 compared with the ion at m/z 519.09 (Fig. 5). In addition, the precursor ion could eliminate two molecules of danshensu (C9H10O5) generating the high-abundance fragment at m/z 321.0393 (C18H9O6) (Yang et al., 2015). Compound 35# showed the [M−H]– ion at m/z 353.0873, which assist to identify its molecular formula as C16H18O9. The product ion at m/z 191.0553 (C7H11O6) was consistent with deprotonated quinic acid by NL of caffeoyl. The ion at m/z 179.0344 (C9H7O4) was the caffeic acid fragment (Fig. 5). By comparison with the literature, compound 35# was characterized as neochlorogenic acid or its isomer (Makita et al., 2017).
3.3.4 Characterization of phthalides
Phthalides are the main bioactive compounds for Chuanxiong Rhizoma, which include both the monomers and dimers (Yang et al., 2021). We could characterize 42 phthalide compounds from XBJ Injection, and most of them were in the monomer form. Notably, the hydroxyl phthalides had different numbers of hydroxyl substituents, which could have the typical protonated precursor ions ([M + H]+) at m/z 205.09, 207.10, 209.12, 225.11, and 279.16, while H2O, CO, and CO2, were the characteristic NL forms. Compound 196# (tR 12.94 min) showed the [M + H]+ precursor ion at m/z 207.1017, and accordingly we could characterize its molecular formula as C12H14O3. By the MS/MS fragmentation, the characteristic fragment ion at m/z 189.0908 (C12H13O2) of senkyunolide F could be observed after NL of H2O. Another product ion at m/z 161.0953 (C11H13O) could be generated by the combined loss of H2O + CO (Fig. 6). By searching the literature, compound 196# was characterized as senkyunolide F or its isomer (Sun et al., 2017). Compound 277# (tR 18.57 min) showed the [M + H]+ parent ion at m/z 279.1593, consistent with the molecular formula of C16H22O4. The product ion at m/z 233.1556 (C15H21O2) could be obtained due to the integrated cleavage of H2O + CO. Another product ion [M + H–C4H8O2]+ at m/z 191.1070 (C12H15O2) could indicate the existence of the hydroxyl and 1-oxobutyl substituent. By comparing this information with the database, compound 277# was characterized as senkyunolide M or its isomer (Zhang et al., 2017).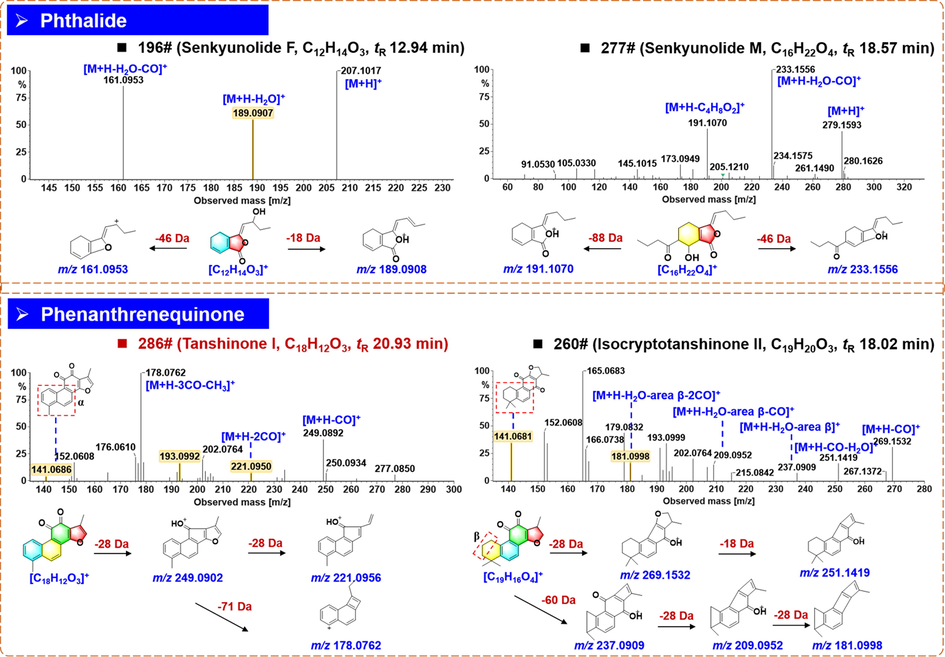
Annotation of the positive CID-MS2 spectra and proposed fragmentation pathways for the representative compounds of phthalides and phenanthrenequinones from XBJ Injection.
3.3.5 Characterization of phenanthrenequinones
Phenanthrenequinones characterized from XBJ were mainly from Salviae Miltiorrhizae Radix et Rhizoma (Pang et al., 2016), which included seven compounds. Compound 286# (tR 20.93 min; C18H12O3) was a phenanthrenequinone compound identified as tanshinone I by comparison with the reference standard. The protonated precursor ion was detected at m/z 277.0947, which, upon CID-MS2 fragmentation, could be dissociated into the fragment ion at m/z 249.0902 (C17H13O2) by losing CO, at m/z 221.0956 (C16H13O) by losing 2 × CO, and at m/z 178.0762 (C14H10) by losing 3CO + CH3. Besides, a fragment ion at m/z 141.0686 could result from the RDA cleavage with the whole α region eliminated (Fig. 6). Compound 260# (tR 18.02 min) showed an abundant [M + H]+ ion at m/z 297.1475, based on which its formula was speculated as C19H20O3. By the eliminations of CO and CO + H2O, the product ions at m/z 269.1532 and 251.1419 were generated. A series of fragments associated with the ring cleavages at area β were observed, including the ion at m/z 237.0909 ([M + H–H2O–area β]+), 209.0952 ([M + H–H2O–area β–CO]+), and 181.0998 ([M + H–H2O–area β–2CO]+). Also, the fragment at m/z 141.0681 could inform the similar substructure as that of tanshinone I. By searching the literature, the fragmentation information mentioned above could be used to characterize compound 260# as isocryptotanshinone II or its isomer (Liu et al., 2013; Wang et al., 2022; Wu et al., 2007).
In addition to the structure subtypes mentioned above, other classes, involving 13 phenylpropanoids, six alkaloids, and 54 others, got characterized from XBJ Injection, as well, and their information was detailed in Table S3.
3.4 Chemical composition analysis for XBJ Injection
According to the identification results, the chemical composition features of XBJ Injection were analyzed. A total of 294 ingredients were identified or preliminary characterized, including 81 flavonoids (27.6 %), 51 terpenoids (17.3 %), 42 phthalides (14.3 %), 40 organic acids (13.6 %), 13 phenylpropanoids (4.4 %), seven phenanthrenequinones (2.4 %), six alkaloids (2.0 %), and 54 others (18.4 %). Based on the identification results of the in-house MS2 spectral library, the components characterized from XBJ could be assigned to their botanical sources. By ranking according to the percentage proportion, they followed this order: CF (31 %), PRR (22 %), CR (20 %), SMRR (18 %), and ASR (9 %), which, in general, conformed to the compatibility rule of ″Monarch, Minister, and Assistant″ in the theory of TCM. In the prescription, CF acts as the monarch drug, PRR and CR are the minister components, and SMRR and ASR serve as the adjuvant drugs (Yu et al., 2022).
4 Conclusion
In this work, an integrated approach was developed, by establishing IM separation enabled, DIA and DDA alternating hybrid scan (HDMSE-HDDDA) on the advanced VionTM IM-QTOF LC-MS platform and the in-house MS2 spectral library, which was validated by the comprehensive multicomponent characterization of XBJ Injection. This hybrid scan method combined both DIA (HDMSE) and DDA (HDDDA) to acquire the MS2 data, which could merge the merits of each mode achieving the balance between wide coverage and high spectral quality. Moreover, the development and application of the in-house MS2 spectral library could greatly improve the accuracy of the identification results, largely reduce the generation of false positives, and improve the analysis efficiency. As a consequence, 294 components were identified or tentatively characterized from XBJ Injection by comparatively analyzing both the negative and positive CID-MS2 data. By this work, we expect to expand the establishment of in-house MS2 spectral library, and our goal is to create a multidimensional information database in support of reliable compounds identification in natural product research.
Acknowledgments
This work was supported by Tianjin Committee of Science and Technology of China (Grant No. 21ZYJDJC00080), National Natural Science Foundation of China (Grant No. 81872996), and Innovation Team and Talents Cultivation Program of National Administration of Traditional Chinese Medicine (Grant No. ZYYCXTD-C-202009).
Declaration of Competing Interest
The authors declare that they have no known competing financial interests or personal relationships that could have appeared to influence the work reported in this paper.
References
- Untargeted time-pattern analysis of LC-HRMS data to detect spills and compounds with high fluctuation in influent wastewater. J. Hazard. Mater.. 2019;361:19-29.
- [CrossRef] [Google Scholar]
- Reproducibility, specificity and accuracy of relative quantification using spectral library-based data independent acquisition. Mol. Cell. Proteomics. 2020;19(1):181-197.
- [CrossRef] [Google Scholar]
- Ion mobility-high-resolution mass spectrometry (IM-HRMS) for the analysis of contaminants of emerging concern (CECs): Database compilation and application to urine samples. Anal. Chem.. 2021;93(16):6428-6436.
- [CrossRef] [Google Scholar]
- Development and validation of a HPLC method for the determination of five bioactive compounds in the “Xuebijing” injection. Anal. Lett.. 2010;43(15):2456-2464.
- [CrossRef] [Google Scholar]
- Identification of phenolic compounds in Australian grown dragon fruits by LC-ESI-QTOF-MS/MS and determination of their antioxidant potential. Arab. J. Chem.. 2021;14(6):103151
- [CrossRef] [Google Scholar]
- Eight key rules for successful data-dependent acquisition in mass spectrometry-based metabolomics. Mass Spectrom. Rev.. 2021;1–13
- [CrossRef] [Google Scholar]
- Core outcome set for stable angina pectoris in traditional Chinese medicine (COS-SAP-TCM) Acupunct. Herb. Med.. 2021;1(1):39-48.
- [CrossRef] [Google Scholar]
- Database resources in metabolomics: An overview. J. Neuroimmune Pharmacol.. 2010;5(1):18-30.
- [CrossRef] [Google Scholar]
- Untargeted detection of the carbonyl metabolome by chemical derivatization and liquid chromatography-tandem mass spectrometry in precursor ion scan mode: Elucidation of COVID-19 severity biomarkers. Anal. Chim. Acta. 2022;1196:339405
- [CrossRef] [Google Scholar]
- Data dependent–independent acquisition (DDIA) proteomics. J. Proteome Res.. 2020;19(8):3230-3237.
- [CrossRef] [Google Scholar]
- Network pharmacology and RNA-sequencing reveal the molecular mechanism of Xuebijing injection on COVID-19-induced cardiac dysfunction. Comput. Biol. Med.. 2021;131:104293
- [CrossRef] [Google Scholar]
- Collision cross section (CCS) database: An additional measure to characterize steroids. Anal. Chem.. 2018;90(7):4616-4625.
- [CrossRef] [Google Scholar]
- Functional metabolomics decipher biochemical functions and associated mechanisms underline small-molecule metabolism. Mass Spectrom. Rev.. 2020;39(5–6):417-433.
- [CrossRef] [Google Scholar]
- Identification of the major constituents in Xuebijing Injection by HPLC-ESI-MS. Phytochem. Anal.. 2011;22(4):330-338.
- [CrossRef] [Google Scholar]
- Comprehensive profiling of Lingzhihuang capsule by liquid chromatography coupled with mass spectrometry-based molecular net-working and target prediction. Acupunct. Herb. Med.. 2021;2(1):58-67.
- [CrossRef] [Google Scholar]
- Metabolomics toward personalized medicine. Mass Spectrom. Rev.. 2019;38(3):221-238.
- [CrossRef] [Google Scholar]
- Qualitative and quantitative analysis of Arnebiae Radix and Dictamni Cortex and efficacy study of herbal extracts on allergic contact dermatitis using 3D human reconstructed epidermis. Chin. Herb. Med.. 2021;13(4):556-564.
- [CrossRef] [Google Scholar]
- Advances and challenges in Ginseng research from 2011 to 2020: the phytochemistry, quality control, metabolism, and biosynthesis. Nat. Prod. Rep.. 2022;39(4):875-909.
- [CrossRef] [Google Scholar]
- Genus Paeonia: A comprehensive review on traditional uses, phytochemistry, pharmacological activities, clinical application, and toxicology. J. Ethnopharmacol.. 2021;269:113708
- [CrossRef] [Google Scholar]
- The current evidence for the treatment of sepsis with Xuebijing injection: Bioactive constituents, findings of clinical studies and potential mechanisms. J. Ethnopharmacol.. 2021;265:113301
- [CrossRef] [Google Scholar]
- Screening and determination of potential xanthine oxidase inhibitors from Radix Salviae Miltiorrhizae using ultrafiltration liquid chromatography–mass spectrometry. J. Chromatogr. B. 2013;923–924:48-53.
- [CrossRef] [Google Scholar]
- Rapid separation and identification of 54 major constituents in Buyang Huanwu decoction by ultra-fast HPLC system coupled with DAD-TOF/MS. Biomed. Chromatogr.. 2009;23(8):828-842.
- [CrossRef] [Google Scholar]
- Differential detection of Rhizoma coptidis by capillary electrophoresis electrospray ionization mass spectrometry with a nanospray interface. Electrophoresis. 2014;35(21–22):3258-3263.
- [CrossRef] [Google Scholar]
- Comparative chemical profiling of three TCM drugs in the Paeoniaceae family by UPLC-MS/MS combined with chemometric methods. Biochem. Syst. Ecol.. 2019;83:121-129.
- [CrossRef] [Google Scholar]
- Rapid differentiation of Aconiti Kusnezoffii Radix from different geographic origins using ultra-performance liquid chromatography coupled with time-of-flight mass spectrometry. World J. Tradit. Chin. Med.. 2021;7(1):71-77.
- [CrossRef] [Google Scholar]
- Application of multiple chemical and biological approaches for quality assessment of Carthamus tinctorius L. (safflower) by determining both the primary and secondary metabolites. Phytomedicine. 2019;58:152826
- [CrossRef] [Google Scholar]
- UPLC-qTOF-MS profiling of pharmacologically important chlorogenic acids and associated glycosides in Moringa ovalifolia leaf extracts. S. Afr. J. Bot.. 2017;108:193-199.
- [CrossRef] [Google Scholar]
- New software tools, databases, and resources in metabolomics: Updates from 2020. Metabolomics. 2021;17(5):5.
- [CrossRef] [Google Scholar]
- Comprehensive metabolic profiling of modified Gegen Qinlian decoction by ultra-high-performance liquid chromatography-diode array detection-Q-Exactive-orbitrap-electrospray ionization-mass spectrometry/mass spectrometry and application of high-performance thin-layer chromatography for its fingerprint analysis. World J. Tradit. Chin. Med.. 2021;7(1):11-32.
- [CrossRef] [Google Scholar]
- Ion mobility-derived collision cross section as an additional measure for lipid fingerprinting and identification. Anal. Chem.. 2015;87(2):1137-1144.
- [CrossRef] [Google Scholar]
- An integrated approach for global profiling of multi-type constituents: Comprehensive chemical characterization of Lonicerae Japonicae Flos as a case study. J. Chromatogr. A. 2019;1613:460674
- [CrossRef] [Google Scholar]
- Chemical analysis of the herbal medicine Salviae Miltiorrhizae Radix et Rhizoma (Danshen) Molecules. 2016;21(1):51.
- [CrossRef] [Google Scholar]
- Public LC-Orbitrap tandem mass spectral library for metabolite identification. J. Proteome Res.. 2021;20(4):2089-2097.
- [CrossRef] [Google Scholar]
- An ion mobility-enabled and high-efficiency hybrid scan approach in combination with ultra-high performance liquid chromatography enabling the comprehensive characterization of the multicomponents from Carthamus tinctorius. J. Chromatogr. A. 2022;1667:462904
- [CrossRef] [Google Scholar]
- Selective ion monitoring of quinochalcone C-glycoside markers for the simultaneous identification of Carthamus tinctorius L. in eleven Chinese patent medicines by UHPLC/QTOF MS. J. Pharm. Biomed. Anal.. 2016;117:510-521.
- [CrossRef] [Google Scholar]
- Review on natural products databases: where to find data in 2020. J. Cheminform.. 2020;12(1):20.
- [CrossRef] [Google Scholar]
- Chemical profiling and quantification of XueBiJing injection, a systematic quality control strategy using UHPLC-Q Exactive hybrid quadrupole-orbitrap high-resolution mass spectrometry. Sci. Rep.. 2017;7(1):16921.
- [CrossRef] [Google Scholar]
- A GC–MS urinary quantitative metabolomics analysis in depressed patients treated with TCM formula of Xiaoyaosan. J. Chromatogr. B. 2016;1026:227-235.
- [CrossRef] [Google Scholar]
- Mass spectral databases for LC/MS and GC/MS-based metabolomics: State of the field and future prospects. Trac-Trends Anal. Chem.. 2016;78:23-35.
- [CrossRef] [Google Scholar]
- In-depth profiling, characterization, and comparison of the ginsenosides among three different parts (the root, stem leaf, and flower bud) of Panax quinquefolius L. by ultra-high performance liquid chromatography/quadrupole-orbitrap mass spectrometry. Anal. Bioanal. Chem.. 2019;411(29):7817-7829.
- [CrossRef] [Google Scholar]
- A novel ion mobility separation-enabled and precursor ions list-included high-definition data-dependent acquisition (HDDDA) approach: method development and its application to the comprehensive multicomponent characterization of Fangji Huangqi Decoction. Arab. J. Chem.. 2021;14(4):103087
- [CrossRef] [Google Scholar]
- A novel hybrid scan approach enabling the ion-mobility separation and the alternate data-dependent and data-independent acquisitions (HDDIDDA): Its combination with off-line two-dimensional liquid chromatography for comprehensively characterizing the multicomponents from Compound Danshen Dripping Pill. Anal. Chim. Acta. 2022;1193:339320
- [CrossRef] [Google Scholar]
- Accelerating metabolite identification in natural product research: Toward an ideal combination of liquid chromatography-high-resolution tandem mass spectrometry and NMR profiling, in Silico databases, and chemometrics. Anal. Chem.. 2019;91(1):704-742.
- [CrossRef] [Google Scholar]
- Employment of tandem mass spectrometry for the accurate and specific identification of oligosaccharide structures. Anal. Chem.. 2012;84(17):7456-7462.
- [CrossRef] [Google Scholar]
- One single LC–MS/MS analysis for both phenolic components and tanshinones in Radix Salviae Miltiorrihizae and its medicinal products. Talanta. 2007;73(4):656-661.
- [CrossRef] [Google Scholar]
- Untargeted metabolomics analysis to unveil the chemical markers for the differentiation among three Gleditsia sinensis-derived herbal medicines by ultra-high performance liquid chromatography/quadrupole time-of-flight mass spectrometry. Arab. J. Chem.. 2022;15(5):103762
- [CrossRef] [Google Scholar]
- METLIN MS2 molecular standards database: a broad chemical and biological resource. Nat. Methods. 2020;17(10):953-954.
- [CrossRef] [Google Scholar]
- Low energy induced homolytic fragmentation of flavonol 3-O-glycosides by negative electrospray ionization tandem mass spectrometry. Rapid Commun. Mass Spectrom.. 2014;28(4):385-395.
- [CrossRef] [Google Scholar]
- The combination of two natural medicines, Chuanxiong and Asarum: A review of the chemical constituents and pharmacological activities. J. Chem. Res. 2021;45(11–12):957-976.
- [CrossRef] [Google Scholar]
- Selective and comprehensive characterization of the quinochalcone C-glycoside homologs in Carthamus tinctorius L. by offline comprehensive two-dimensional liquid chromatography/LTQ-Orbitrap MS coupled with versatile data mining strategies. RSC Adv.. 2016;6(1):495.
- [CrossRef] [Google Scholar]
- UPLC/Q-TOF-MS Analysis for identification of hydrophilic phenolics and lipophilic diterpenoids from Radix Salviae Miltiorrhizae. Acta Chromatogr.. 2015;27:711-728.
- [CrossRef] [Google Scholar]
- Novel assays for quality evaluation of XueBiJing: Quality variability of a Chinese herbal injection for sepsis management. J. Pharm. Anal. 2022
- [CrossRef] [Google Scholar]
- Characterization of the potential new phthalides in Ligusticum chuanxiong Hort. using ultra-performance liquid chromatography coupled with quadrupole time of flight tandem mass spectrometry. J. Sep. Sci.. 2017;40(10):2123-2130.
- [CrossRef] [Google Scholar]
- Integration of data-dependent acquisition (DDA) and data-independent high-definition MSE (HDMSE) for the comprehensive profiling and characterization of multicomponents from Panax japonicus by UHPLC/IM-QTOF-MS. Molecules. 2019;24(15):2708.
- [CrossRef] [Google Scholar]
- Rapid detection and structural characterization of verapamil metabolites in rats by UPLC–MSE and UNIFI platform. Biomed. Chromatogr.. 2020;34(1):e4702.
- [Google Scholar]
- A five-dimensional data collection strategy for multicomponent discovery and characterization in Traditional Chinese Medicine: Gastrodia Rhizoma as a case study. J. Chromatogr. A. 2021;1653:462405
- [CrossRef] [Google Scholar]
- Data-dependent acquisition and database-driven efficient peak annotation for the comprehensive profiling and characterization of the multicomponents from Compound Xueshuantong Capsule by UHPLC/IM-QTOF-MS. Molecules. 2019;24(19):3431.
- [CrossRef] [Google Scholar]
- Offline two-dimensional liquid chromatography coupled with ion mobility-quadrupole time-of-flight mass spectrometry enabling four-dimensional separation and characterization of the multicomponents from white ginseng and red ginseng. J. Pharm. Anal.. 2020;10(6):597-609.
- [CrossRef] [Google Scholar]
Appendix A
Supplementary material
Supplementary data to this article can be found online at https://doi.org/10.1016/j.arabjc.2022.104519.
Appendix A
Supplementary material
The following are the Supplementary data to this article:Supplementary data 1
Supplementary data 1


