

Translate this page into:
Extraction of biosilica from date palm biomass ash and its application in photocatalysis
⁎Corresponding author. selanthikkal@iau.edu.sa (Silviya Elanthikkal)
-
Received: ,
Accepted: ,
This article was originally published by Elsevier and was migrated to Scientific Scholar after the change of Publisher.
Peer review under responsibility of King Saud University.
Abstract
There is an emerging trend in the valorization of biomass waste for the development of value-added products. Date palm biomass is an extensively available bioresource in Saudi Arabia. In date palm farms, the biomass residues are usually burnt, and a lot of ash is generated. Biomass ash is rich in silica, which is a valuable material used in a wide range of applications. This study explores the extraction of pure silica nanoparticles from date palm biomass ash (DPBA) and its application in photocatalysis. A chemical sol–gel method or thermal combustion method was employed for the extraction of silica. The extracted silica nanoparticles were characterized by EDX, FT-IR, XRD, SEM, BET, and TGA. FT-IR spectra of extracted biosilica samples displayed only the characteristic peaks corresponding to the silica functional groups. The chemically synthesized biosilica sample exhibited higher purity (98 %) and higher surface area (376 m2/g) compared to the thermally prepared biosilica samples. The SEM analysis revealed the presence of spherical-shaped silica particles of an average diameter of 93 nm in chemically extracted biosilica and 208 nm in thermally extracted biosilica. The newly extracted biosilica samples were tested for the photodegradation of the bromophenol blue dye in water. The dye degradation efficiency of chemically prepared biosilica sample was 82 % and that of thermally prepared biosilica sample was 74 %. The relatively higher degradation efficiency of BS-chemical could be due to its higher surface area and smaller particle size, and also due to the presence of lots of surface defects in this fully amorphous biosilica.
Keywords
Biomass
Biosilica
Date palm biomass ash
Photocatalysis
Waste Management

1 Introduction
There is an emerging trend in the utilization of renewable and sustainable resources for the isolation of nanoparticles. Biomass resource has attracted great interest because of their renewability, low cost, and environmental friendliness. Biomass agriculture residues mainly contain 60–80 % organic components such as cellulose, lignin, and hemicellulose and 13–29 % inorganic components such as silica, alkali metals, and other trace elements (Traoré, 2018). Silicon is accumulated within the different intracellular and extracellular structures of plants mainly in the form of phytoliths. Silica present in the cell wall of plants provides stiffness, mechanical strength, heat tolerance, improves water and minerals uptake, and provides resistance against several biotic and abiotic stresses (Frew et al., 2018; Sato et al., 2017). The enormous biomass waste generated in agricultural lands can be used as an environmentally and economically favourable resource to produce valuable materials like silica, which otherwise end up in landfill, burnt, or used as animal feed (Prabha et al., 2021; Sarkar et al., 2021). Therefore, the reutilization of biomass waste could minimize the waste disposal problem and reduce environmental pollution.
Silica is a value-added material being used in a wide range of applications viz. catalysis, wastewater treatment, cosmetics, pharmaceutics, drug delivery, biomedical implants, sensors, battery and energy, and as fillers in polymer composites because of its unique textural and morphological features, easy to functionalize surface chemistry, high thermal stability and mechanical strength, and low toxicity and biocompatibility (Prabha et al., 2021). The production of silica nanoparticles from various biomass residues has been reported in the literature (Prabha et al., 2021; Setiawan and Chiang, 2021). Although different approaches for the extraction of silica can be seen in the literature, most researchers have followed the thermal combustion method and the chemical sol–gel method because of their simplicity (Abdul razak et al., 2022; Bageru and Srivastava, 2017; Dizaji et al., 2019; Singh et al., 2020). In the combustion method, the biomass is thermally degraded at very high temperatures during which the combustible contents get removed leaving behind the thermally stable silica. In the chemical sol–gel process, silica in the biomass reacts with NaOH to form sodium silicate solution, and when the pH of sodium silicate solution is lowered by the addition of any acid, pure silica nanoparticles get precipitated.
Extraction of silica from residual biomass like rice husk, wheat husk, corn waste, sugarcane bagasse waste, and bamboo leaves has been investigated extensively (Alves et al., 2017; Fernandes et al., 2017; Irzaman et al., 2018, 2020; Shen, 2017; Singh et al., 2020; Terzioğlu et al., 2019). Alves et al (2017) extracted biosilica from sugarcane waste ash through an alkaline extraction step followed by an acid precipitation step and obtained amorphous silica with high purity (99.1 %) and a large surface area (265 m2/g). Bakar et al (2016) studied the production of amorphous silica by combustion of unleached or acid (HCl or H2SO4) leached rice husk at 500 °C, 600 °C, 700 °C, 800 °C, or 900 °C. Authors reported that high-purity silica (99 %) having a larger surface area (218 m2/g) could be produced from rice husk by the controlled combustion of acid-leached rice husk at a temperature of 600 °C. Bageru and Srivastava (2017) extracted amorphous silica with purity 85 %, 91.2 %, and 91.82 %, by combustion of HCl pretreated teff straw at ashing temperatures of 500 °C, 700 °C, and 900 °C, respectively. For the isolation of silica from rice husk ash, Fernandes et al (2017) employed three methods (i) combustion at 700 °C or 800 °C (ii) acid pretreatment followed by combustion at 800 °C (iii) chemical method (alkaline extraction followed by precipitation). It was found that silica obtained by the chemical method showed the highest purity (99.6 %) and surface area (290.03 m2/g). Singh et al. (2022) studied the production of biosilica from rice straw by combustion followed by chemical treatment. Rice straw ash obtained by combustion at 600 °C was amorphous, whereas the ash obtained by combustion at 900 °C was crystalline. The structural and textural features of silica particles can be controlled by fine-tuning the preparation conditions (Abdul razak et al., 2022; Chun and Lee, 2020; Dizaji et al., 2019).
Saudi Arabia is the second largest producer of dates, making up 17 % of world production (Hussain et al., 2014). This cultivation produces a large amount of biomass waste every year. The biomass from the trimmed branches of palm trees amount to more than 200,000 tons/year (Hussain et al., 2014). This date palm biomass is discarded or burnt in local farms and is underutilized. Some authors have reported the utilization of date palm ash in concrete cement composites and in the treatment of pollutants (Alrshoudi and Alshannag, 2020; Tahir et al., 2020). The date palm biomass burnt ash contains a reasonable amount of silica. Despite the numerous approaches to producing silica from various agricultural residues, date palm biomass ash is virtually not used for this purpose (Abdul razak et al., 2022; Prabha et al., 2021; Setiawan and Chiang, 2021). The efficient utilization of this zero-cost resource as a potential silica precursor is very interesting from an industrial perspective. Preparing commercially important silica from this sustainable biomass waste will reduce production costs and protect the environment.
This study attempts to extract biosilica from the date palm biomass ash (DPBA) collected from a local date palm farm by applying a thermal combustion method or a chemical sol–gel method. The characteristics of the obtained biosilica samples were analyzed by EDX, FT-IR, XRD, SEM, BET, and TGA. The potential application of DPBA-derived biosilica for the photocatalytic degradation of Bromophenol Blue, as a model dye, is also tested.
2 Materials and methods
2.1 Materials
Date palm biomass ash was collected from a farm in Al-Ahsa, Eastern region of Saudi Arabia, where trimmed date palm branches, rachis, leaves, and empty fruit bunch are burned in open spaces. The procured ash was sieved, the powder was dispersed in water and the dispersion was filtered carefully to collect only the ash, while the sand-contaminated portion settled at the bottom was discarded. The ash was dried and stored in air-tight plastic bags till further use. Hydrochloric acid and sodium hydroxide used in the chemical treatment were of analytical purity. Bromophenol Blue was purchased from BDH Chemicals Ltd. England.
2.2 Extraction of biosilica from DPBA
2.2.1 Extraction of Biosilica by chemical sol–gel method
At first the DPBA was treated with 1.5 M HCl at 85 °C for 3 h (Liang et al., 2020). During this treatment, the metallic impurities present in the DPBA get removed. The acid treated DPBA was filtered, and the black residue was washed repeatedly with hot deionized water and dried. The acid-leached DPBA was treated with 2 M NaOH solution for 2 h at 90 °C under continuous stirring (Cui et al., 2015). During this step, silica present in the ash reacts with NaOH to produce soluble sodium silicate salts as shown in Eq. (1). The next step involved the precipitation of silica from the sodium silicate solution by the dropwise addition of 2 M HCl (Eq. (2)). Precipitate started to appear below pH 10 and the HCl addition continued till the pH become nearly neutral. The obtained white suspension was kept overnight to complete the precipitation of biosilica. The biosilica suspension was centrifuged, the clear layer was discarded, and the obtained silica gel was washed and centrifuged repeatedly (4 times). The minerals free silica gel was collected into a petri dish, dried in the oven at 70 °C for 24 h. Finally, the white dried powder was finely ground using a mortar and stored in glass bottle. This sample is named as BS-Chemical.
2.2.2 Extraction of biosilica by thermal combustion method
The acid leached DPBA was taken in porcelain crucible and placed in a muffle furnace, programmed with a heating rate of 5°/min to reach the required temperature i.e., 600 °C or 800 °C, and maintained at this temperature for another 4 h, in order to decompose the combustible matter present in the ash. The resulted biosilica samples were finely ground and stored in glass stoppered bottles and named as BS-600 and BS-800. The combustion temperatures were selected based on the literature data (Bakar et al., 2016; Liang et al., 2020; Setiawan and Chiang, 2021; Singh et al., 2022). A schematic flow-diagram for the preparation of biosilica from DPBA by chemical sol–gel method or thermal combustion method is shown in Fig. 1.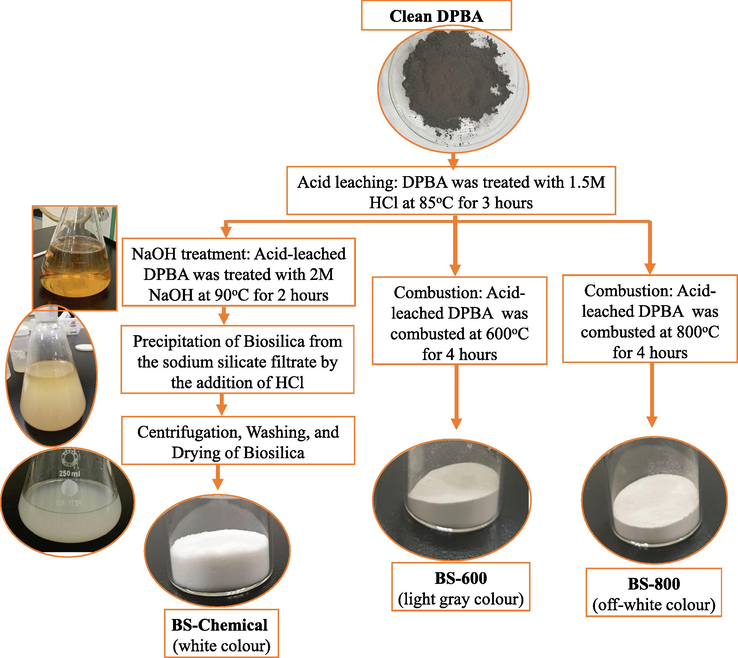
Flow-diagram for the preparation of biosilica from DPBA by chemical sol–gel method or thermal combustion method.
2.3 Characterization
The physicochemical properties of DPBA and biosilica samples were analyzed by various characterization techniques. The elemental composition of the samples was determined using an Energy Dispersive X-ray Fluorescence Spectrometer EDX-8000, SHIMADZU. FT-IR measurements were recorded on IR AFFINITY-1 spectrometer, Shimadzu within the wavenumber range of 4000–400 cm−1, with resolution 8 cm−1 and 16 number of scans, by spreading the samples directly on ATR crystal and correcting against the ambient air as background. The thermal degradation characteristics of DPBA and biosilica samples were analyzed using Thermogravimetric Analyzer DTG −60H, Shimadzu in nitrogen atmosphere, flow rate 20 ml/min, heating rate 5 °C/min, temperature range 25-1000° C. X-ray Diffraction analysis was carried out on XRD-7000 Shimadzu X-ray diffractometer, in the 2-theta range of 10° to 70° using Cu-Kα radiation, with scanning speed 2°/min, and voltage 40 kV and 40 mA. The surface morphologies of the samples were examined with VEGA 3 TESCAN scanning electron microscope (Tescan, Czech Republic) and the surface elemental analysis was done on the same apparatus by Energy Dispersive X-ray Spectroscopy (EDS). Pore size and surface area of biosilica samples were analyzed using Automated Surface Area Analyzer - Nova1200e, QUANTACHROME by nitrogen adsorption–desorption measurement at 77 K. UV–vis absorption measurements of dye were recorded on a UV–vis Spectrophotometer UV1900, Shimadzu (range 200–900 nm). UV–vis diffuse reflectance measurements were performed on a SolidSpec-3700 instrument from 200 to 900 nm.
2.4 Application of biosilica in Photocatalysis
The synthesized biosilica samples were tested as photocatalysts for the photodegradation of Bromophenol Blue dye as a model organic contaminant. For testing the photocatalytic activity, 1 g/L of the photocatalyst (biosilica) was ultrasonically dispersed in pure water for 20 min. Then 20 mg/L of the dye solution was mixed with the suspension of the catalyst. The catalyst/dye mixture was stirred for 30 min in the dark to reach the adsorption–desorption equilibrium. Then the mixture was transferred to a cylindrical photo-reactor with immersed UV lamp (300 W) and photo-irradiation was performed for 2.15 h, at room temperature under air bubbling and stirring. Aliquot samples were taken out at every 15 min and centrifuged to separate the suspended catalyst. The dye concentration in the centrifuged aqueous solution was analysed using UV–vis measurement at λmax 591 nm during and before photo-irradiation (Mohamed and Besisa, 2022).
The percentage of photocatalytic degradation of dye was estimated using the following equation:
The kinetics of the photocatalytic degradation is determined by plotting
versus time yielding a straight-line slope of the apparent first-order rate constant k according to the following equation:
3 Results and discussion
3.1 Elemental composition by energy Dispersive X-ray Fluorescence (EDX) analysis
The elemental composition data of DPBA, acid leached DPBA and the extracted biosilica samples determined by EDX analysis is presented in Table 1. The DPBA mainly contained Si (48.99 %) and Ca (39.54 %). A small percentage of Fe, K, Al and trace amounts (<1%) of some transition elements like Ti, Mn, Cu, Zn were also present in the DPBA. In the acid leached DPBA, the amount of Si increased to 85.37 % and the amount of Ca and other metals decreased, indicating the effective removal of most of the metals by the applied acid leaching step. In the acid leaching step, the metal oxides present in DPBA react with HCl and form soluble chloride salts (Chindaprasirt & Rattanasak, 2020). The BS-Chemical, the sample prepared by the precipitation of silica from the sodium silicate solution, was found to contain higher percent of Si (97.86 %), compared to the biosilica samples BS-600 (87.41 % Si) and BS-800 (87.99 % Si) prepared by thermal combustion. Similar observations can be seen in the literature. Fernandes et al (2017) reported that the silica derived from rice husk ash (RHA) by chemical treatment contained 99.61 % silica, whereas RHA treated at 700 °C and 800 °C contained 98.68 % and 98.99 % of silica, respectively. Bageru and Srivastava (2017) reported a purity of 85 %, 91.2 %, and 91.82 %, respectively for the biosilica samples prepared by combustion of HCl pretreated teff straw at ashing temperatures of 500 °C, 700 °C, and 900 °C.
Elements
DPBA
Acid leached DPBA
BS-Chemical
BS-600
BS-800
Si
48.995 %
85.370 %
97.860 %
87.410 %
87.992 %
Ca
39.542 %
6.075 %
0.255 %
4.675 %
4.607 %
Fe
3.298 %
2.132 %
0.069 %
1.593 %
1.602 %
K
3.169 %
3.556 %
0.385 %
4.045 %
3.623 %
S
2.410 %
0.465 %
–
–
–
Al
1.708 %
1.538 %
1.334 %
1.704 %
1.631 %
3.2 FT-IR spectroscopic analysis
FT-IR spectra of the DPBA, chemically extracted biosilica, and thermally prepared biosilica are shown in Fig. 2. For all samples, characteristic peaks corresponding to the silica functional groups were observed around 1050–1070 cm−1, 790 cm−1 and 450 cm−1. According to the literature, the strong intense peak at 1050–1070 cm−1 is attributed to the asymmetric stretching vibration of the siloxane group (Si-O-Si), the sharp peak at 790 cm−1 is due to the symmetric stretching vibration of the siloxane group (Si—O—Si) and the sharp intense peak at 450 cm−1 is assigned to the Si—O—Si bending vibrations (Alves et al., 2017; Bageru and Srivastava, 2017; Ullah et al., 2019). The additional bands around 1450 cm−1 and 875 cm−1 that appeared in the spectrum of DPBA are assigned to the C—O stretching vibration and C—O bending vibration of carbonate groups in calcite (Liang et al., 2020; Rajak et al., 2021), which is in consistence with the elemental analysis results of DPBA (Ca − 39.5 %). The absorption peak at 950 cm−1 observed in the spectrum of chemically prepared biosilica is assigned to the silanol stretching vibrations (Si—OH) showing the presence of hydrated silica (Chundawat et al., 2022; Indrasti et al., 2020). This silanol band is not detected in the spectra of BS-600 and BS-800. This could be due to the condensation of silanol groups during combustion. Zemnukhova et al (2015) made a similar observation. A band at 958 cm−1 corresponding to silanol Si—OH was observed in the spectra of silica sample derived from rice straw/husk via a chemical method, whereas this band was completely absent in the spectra of thermally prepared silica. The appearance of small band around 3300–3600 cm−1 in the spectra of chemically synthesized biosilica sample indicates the presence of physically absorbed water (Bageru and Srivastava, 2017).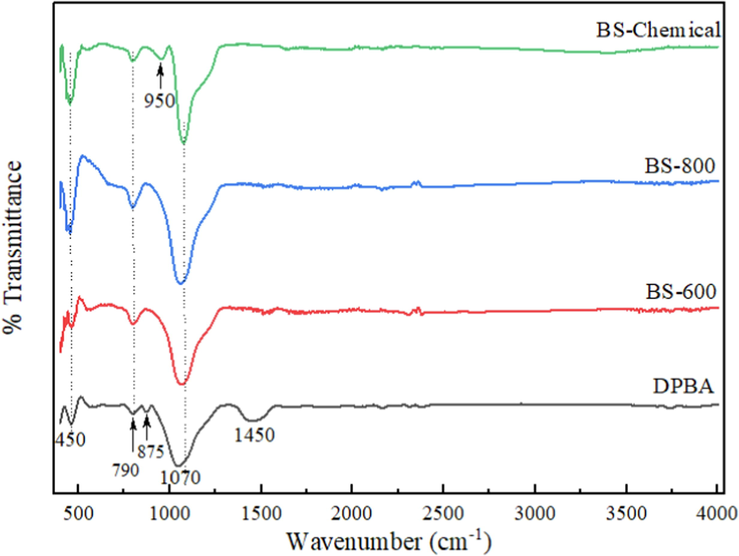
FT-IR spectra of DPBA, chemically extracted biosilica and thermally prepared biosilica samples.
3.3 Thermogravimetric analysis (TGA)
Thermograms of DPBA, chemically extracted biosilica, and thermally prepared biosilica are depicted in Fig. 3. In the thermogram of DPBA, a small weight loss was observed below 130 °C due to the evapouration of physisorbed water, degradation of residual organic matters occurs in the temperature range of 140–440 °C, carbonates and residual carbon degrades between 450 and 660 °C (Liang et al., 2020). The thermogram of the BS-chemical sample showed an initial weight loss below 130 °C corresponds to the evaporation of the absorbed water (Chundawat et al., 2022). The small weight loss between 130 and 400 °C is due to the removal of chemically absorbed water and the surface dehydroxylation of silanol groups (Alves et al., 2017; Liang et al., 2020). No significant weight loss was observed above 400 °C, demonstrating the presence of thermally stable pure silica in the extracted biosilica sample. In the thermally prepared samples, BS-600 showed small weight loss below 150 °C and between 750 and 800 °C range, whereas the sample BS-800 showed no weight loss indicating the complete removal of combustible matter during the applied combustion process itself. Compared to DPBA and thermally prepared biosilica samples, chemically prepared biosilica sample contained higher moisture content.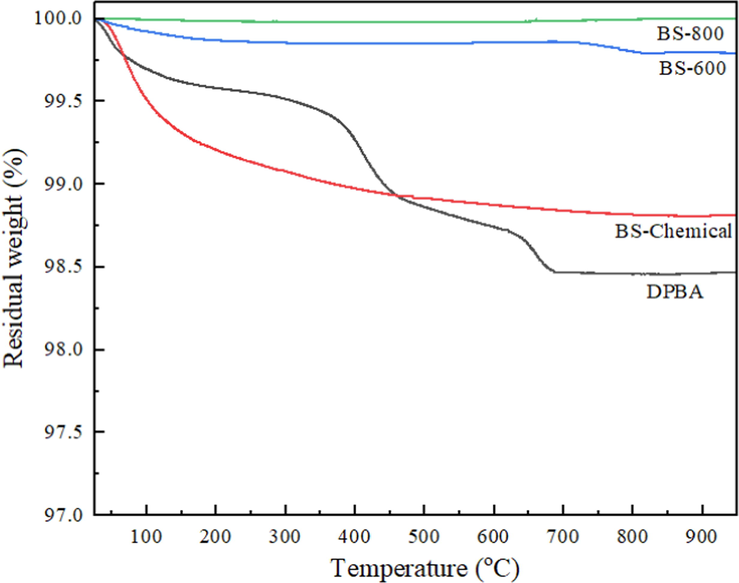
Thermograms of DPBA, chemically extracted biosilica, and thermally prepared biosilica samples.
3.4 X-ray diffraction (XRD) analysis
Fig. 4 shows the XRD diffraction patterns of DPBA, chemically extracted biosilica and thermally prepared biosilica samples. An intense broad band centered at 2θ = 22° typical for amorphous silica is observed in all the samples (Cui et al., 2015). The chemically synthesized biosilica sample did not exhibit any sharp crystalline peaks and was fully amorphous. The amorphous nature of BS-Chemical sample is quite expected as only the amorphous silica gets solubilized during the NaOH treatment, which is subsequently precipitated in the gelation step (Fernandes et al., 2017). The thermally prepared biosilica samples also showed a dominant amorphous band, however, an additional sharp peak at 2θ = 26.6° (related to quartz silica) was also observed in the XRD patterns of BS-600 and BS-800 (Chindaprasirt and Rattanasak, 2020; Liang et al., 2020). Setiawan and Chiang (2021) reports that at higher temperatures the alkali metal impurities in the ash may react with silica to form ternary oxides which promote silica crystallization. Prempeh et al. (2021) extracted biogenic silica from cassava peel, yam peel, corncob, coconut husk and cornhusk by thermal combustion of acid-leached samples at 600 °C. They observed that corn husk and corn cob derived silica were amorphous as they contained a low percent of impurities, whereas silica derived from other sources showed crystalline peaks due to the higher percentage of impurities in them. The XRD pattern of DPBA showed several peaks. This could be the diffraction patterns due to the presence of impurities, calcite or the crystalline quartz form of silica (Alrshoudi and Alshannag, 2020; Shim et al., 2015).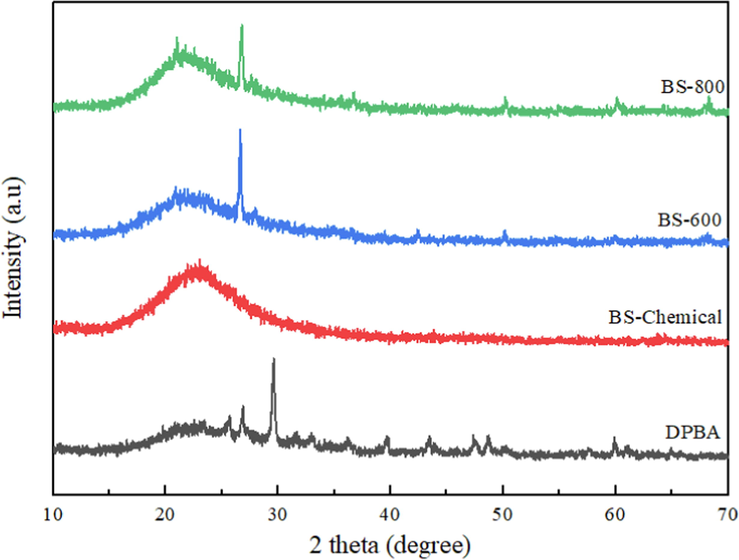
X-ray diffraction patterns of DPBA, chemically extracted biosilica and thermally prepared biosilica samples.
3.5 Morphology analysis by Scanning Electron Microscopy (SEM)
Fig. 5 displays the SEM images of DPBA, chemically extracted biosilica sample and thermally prepared biosilica samples. Different textures including fibers can be seen in the SEM image of DPBA. The chemically synthesized biosilica sample (BS-chemical) contained agglomerates of nanostructured silica particles, demonstrated the presence of spherical particles of various sizes with average diameter of 93 nm (61 to 145 nm). Thermally extracted biosilica samples contained spherical particles of comparatively higher size, BS-800 contained particles of average diameter 208 nm (158 to 248 nm), whereas BS-600 contained particles of average diameter 371 nm (186 to 484 nm). Similar spherical morphologies have been observed by other authors (Chun and Lee, 2020; Rajan et al., 2020). To verify the purity of biosilica samples, SEM-EDS elemental mapping analysis was performed, and the results are presented in the supplementary file Fig. S1. It can be seen that the silica peak predominates in the SEM-EDS spectra.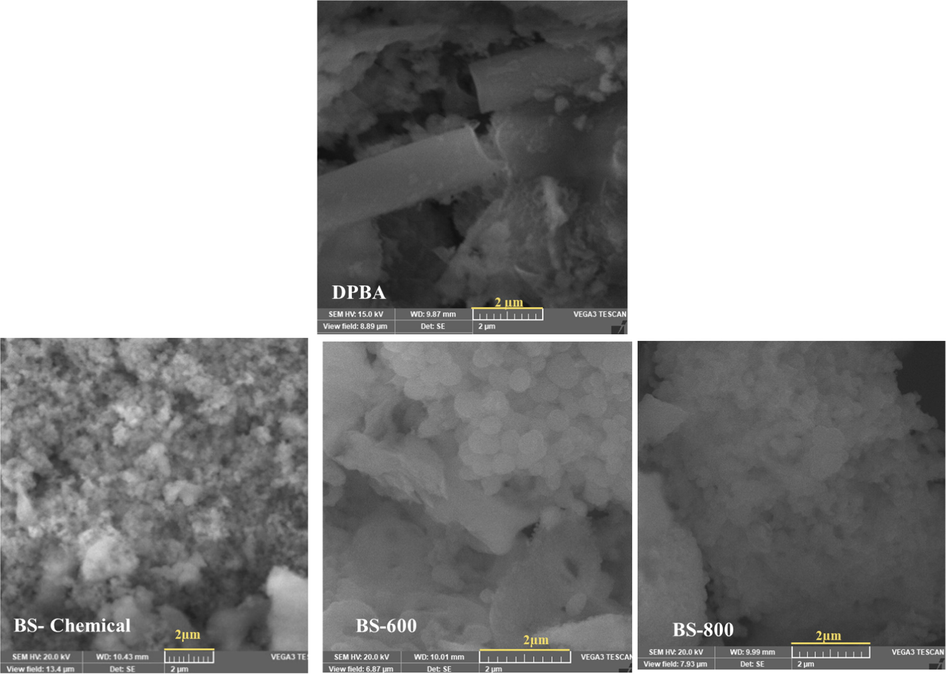
SEM images of DPBA, chemically extracted biosilica sample and thermally prepared biosilica samples.
3.6 Surface area analysis
The nitrogen adsorption–desorption isotherms and the pore size distribution of chemically synthesized biosilica (BS-Chemical) and thermally prepared biosilica samples (BS-600 and BS-800) are shown in Fig. 6. Biosilica samples exhibited typical type IV isotherms with H3 hysteresis loop illustrating the presence of mesoporous silica nanoparticles (Dhaneswara et al., 2020; Prempeh et al., 2021; Zulkifli et al., 2013). Hysteresis loops with a steep increase in N2 adsorption at higher relative pressures indicate typical multilayer adsorption followed by capillary condensation of mesopores at higher pressures (Rajan et al., 2020). The isotherm of the BS-800 sample displayed no hysteresis loop implying a smaller porosity. All biosilica samples showed a heterogenous pore distribution (Fig. 6 (b)) within the size range of 2–16 nm, which falls in the pore dimension range of mesoporous particles (Sing et al., 1995).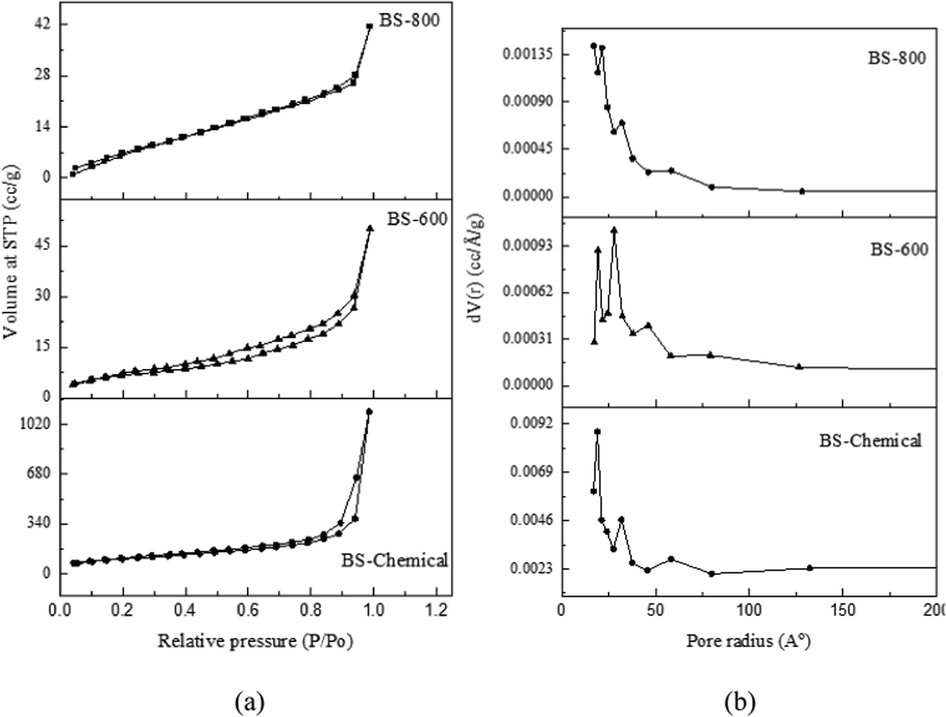
(a) Nitrogen adsorption–desorption isotherms (b) pore size distribution of biosilica samples: BS-Chemical, BS-600 and BS-800.
The Brunauer-Emmet-Teller (BET) surface area and Barrett-Joyner-Halenda (BJH) pore parameters of biosilica samples are summarized in Table 2. Among the three biosilica samples, the chemically synthesized biosilica sample possessed higher surface area and porosity. Similarly prepared silica particles were found to exhibit a surface area of 100 to 400 m2/g and an average pore diameter of 2 to 25 nm (Setiawan and Chiang, 2021). The total pore volume of BS-Chemical (0.2134 cm3/g) falls in the pore volume range (0.195–0.220 cm3/g) of commercial silica (Rajan et al.,2020). According to Schneider et al (2020), the removal of metals and other impurities from the ash results in an increase in porosity and surface area due to the pore-blocking effects of the impurities. Other contributing factors to the higher surface area of BS-Chemical could be its fully amorphous nature and smaller particle size (Singh et al., 2022). The surface areas of thermally prepared biosilica samples were comparable to the results reported in the literature. The BET surface area of biosilica samples that were thermally prepared from different agro-wastes (pre-treated with 5 % citric acid) varied between 26–91 m2/g (Prempeh et al., 2021). The BET surface area of biosilica samples prepared from teff straw ash by combustion at 500 °C, 600 °C, and 700 °C were 52 m2 /g, 61 m2 /g, and 81 m2 /g, respectively (Bageru and Srivastava, 2017).
Samples
BET Surface area (m2/g)
Average pore diameter (nm)
Total Pore volume (cm3/g)
BS-Chemical
376
2.274
0.2134
BS-600
26
3.466
0.02221
BS-800
49
2.006
0.02483
3.7 Diffuse reflectance measurements
Fig. 7 represents the UV–vis diffuse reflectance spectra (DRS) of biosilica samples from chemical and thermal treatments in the spectral range between 200 and 900 nm. The DRS of biosilica samples show absorption band edge at 250–350 nm due to the presence of surface defects (Romolini et al., 2021). The band around 205 is assigned to near band absorption of silica. The peak at 330 nm for BS-chemical sample is attributed to defect states in silica or centers such as oxygen vacancies (Abbass et al., 2015; Koao et al., 2011). The results assent to the absorption of the prepared biosilica materials in the UV region.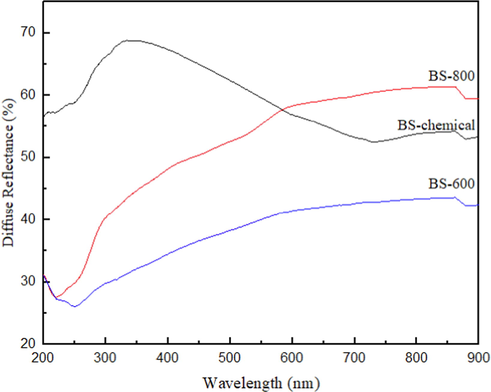
Diffuse reflectance spectra of biosilica samples from chemical and thermal treatment.
The energy band gaps of all the silica samples were calculated from the Kubella-Munk relation (Kubelka, 1948). The energy band gaps evaluated from the plots [F(R)hν]1/2 vs photon energy is demonstrated in Fig. 8. It is observed that the band gap energy estimated from the tangents of the plots are 4.28 eV, 4.24 eV, and 4.09 eV, respectively for BS 600, BS 800 and BS chemical.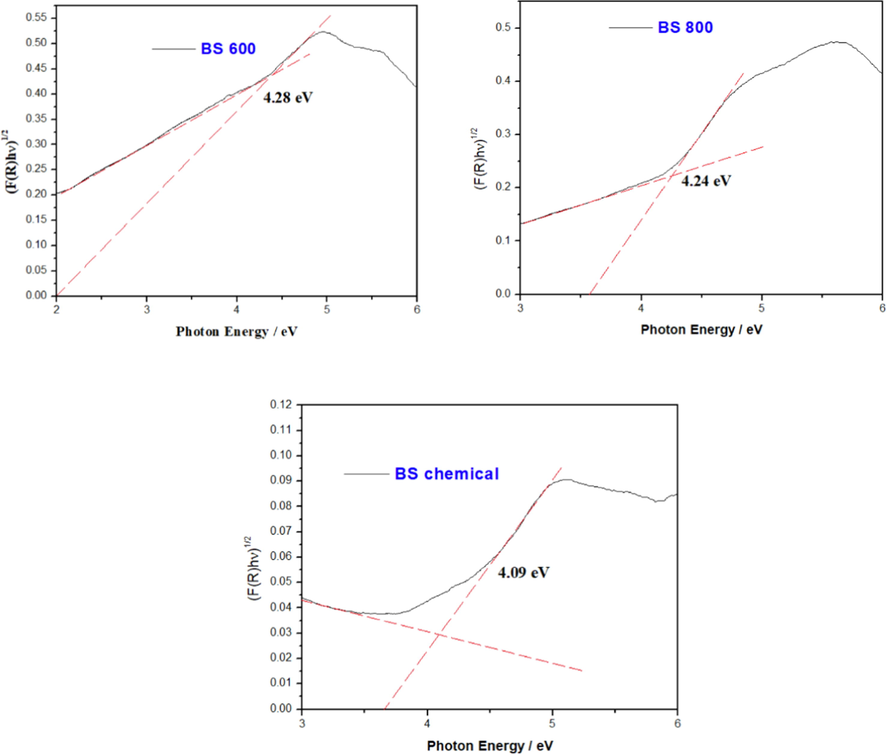
Kubelka-Munk plots of biosilica samples from thermal and chemical treatment.
3.8 Photocatalytic activity of biosilica samples
Photocatalysis is an efficient and inexpensive technique for waste-water treatment and removal of dyes and pollutants. Reports on the use of silica nanoparticles for the photodegradation of toxic dyes in water can be seen in the literature (Aly and Abd-Elhamid, 2018; Singh et al., 2022, Vinoda et al., 2015). In the present study, the chemically synthesized biosilica (BS-Chemical) and thermally extracted biosilica sample (BS-800) were tested as a photocatalyst for the photocatalytic degradation of bromophenol blue dye in aqueous solution. Fig. 9 shows the UV–Visible absorbance spectra of bromophenol blue photodegraded by biosilica catalyst, where maximum absorbance was observed at 591 nm. The intensity of this peak gradually decreased with an increase in the UV irradiation time indicating that the presence of biosilica promotes the photocatalytic degradation of dye and thus the concentration of the dye decreases in the medium.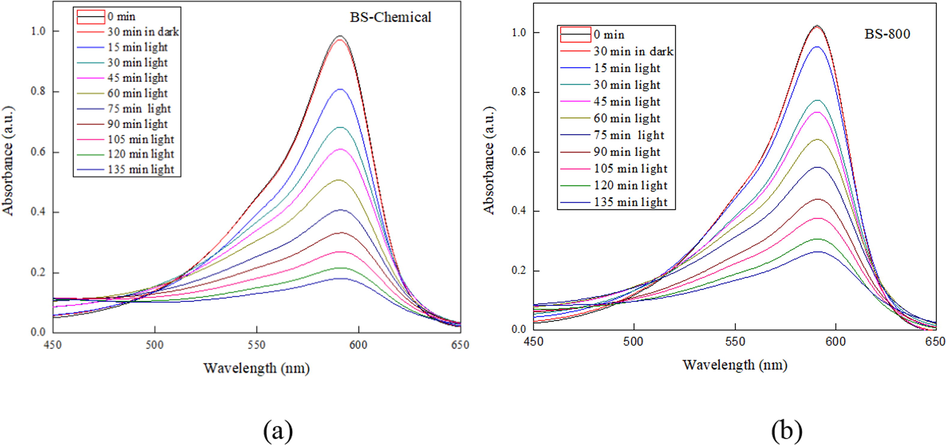
UV–Visible absorbance spectra of bromophenol blue photodegraded by (a) BS-chemical and (b) BS-800, under UV irradiation.
The comparison of the photocatalytic degradation efficiencies of BS-Chemical and BS-800 catalysts, with respect to UV irradiation time, is illustrated in Fig. 10(a). The percentage degradation was found to increase with irradiation time in both the catalysts, however, BS-Chemical exhibited relatively higher degradation efficiency probably due to its higher surface area. The dye photodegradation was negligible in the absence of the catalyst demonstrating the stability of dye under UV irradiation. Degradation kinetics was determined from the Langmuir-Hinshelwood kinetics plots by plotting −ln(Ct/Co) as a function of irradiation time as shown in Fig. 10(b). The lines indicate linear fit with higher correlation co-efficient suggesting that photocatalytic process follows pseudo-first order kinetic model. The mechanism of photocatalytic degradation of Bromophenol Blue dye using biosilica catalysts is schematically illustrated in Fig. 10(c). A detailed mechanism of photodegradation of organic dye using silica nanoparticles can be seen in the literature (Singh et al., 2022).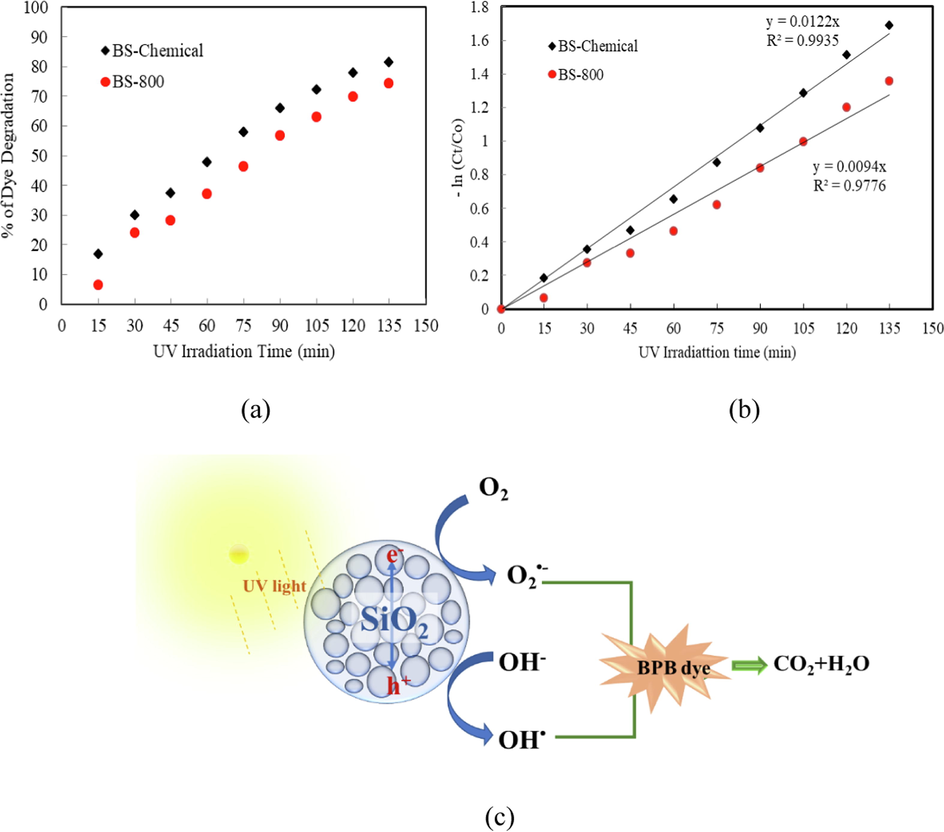
(a) Effect of irradiation time on the photodegradation of bromophenol blue in presence of biosilica catalysts, (b) Kinetics plots for the photodegradation of bromophenol blue in presence of biosilica catalysts, (c) Schematic illustration of photocatalytic degradation of Bomophenol Blue by biosilica catalyst.
The kinetic data of photocatalytic degradation and the degradation efficiencies of biosilica catalysts are summarized in Table 3. The BS-Chemical catalyst exhibited 1.3 times higher degradation rate compared to the thermally prepared sample (BS-800). The results can be clearly related to the higher surface area of BS-Chemical sample (376 m2/g) compared to 49 m2/g for BS-800 sample (Singh et al., 2022). BS-Chemical which composed of only amorphous silica possessed better activity than BS-800 which composed of partially crystalline silica, due to the presence of a large number of surface defects in amorphous silica. It has been reported that the defects in amorphous silica become photoactivable under UV irradiation and supports the photocatalytic activity. Aly and Abd-Elhamid (2018) reports that silica nanoparticles derived from natural sand degraded 85 % of 100 ppm of methylene blue dye in 90 s. In the photocatalytic degradation of methylene blue using rice-straw derived silica nanoparticles, 66.26 % of the dye was degraded in the first 10 min (Singh et al., 2022). For comparison, the photocatalytic degradation of Bromophenol Blue dye using different photocatalysts is illustrated in Table 4.
Catalyst
Photocatalytic Degradation Efficiency (%)
Rate constant, k (min−1)
R2
BS-Chemical
82
0.0122
0.994
BS-800
74
0.0094
0.978
Catalyst
Rate constant, k (min−1)
Light source
Reference
Fe2O3
0.0120
Solar
Mohamed & Besisa, 2022
TiFe2O3
0.0261
Solar
Pure TiO2
0.022
Solar
Mohamed & Youssef, 2022
Pt/TiO2
0.041
Solar
Au/TiO2
0.083
Solar
Natural clay MC1
0.0165
UV
Mohamed et al., 2022
Natural clay MC2
0.0246
UV
Natural clay MC3
0.0067
UV
Natural clay MC4
0.0054
UV
Natural clay MC4
0.0069
UV
BS-Chemical
0.0122
UV
This study
BS-800
0.0094
UV
This study
4 Conclusions
In this study, date palm biomass waste ash has been explored as a potential source for the extraction of biosilica nanoparticles. The biosilica particles were extracted by chemical sol–gel method or thermal combustion method and the characteristics of samples prepared by these two routes were compared. FT-IR spectra showed the characteristic peaks of silica and EDX results confirmed the purity of silica. Biosilica generated by chemical sol–gel method showed better performance in terms of colour, purity (98 % Si content) and surface area (376 m2/g). XRD diffraction pattern revealed the amorphous nature of silica. The extracted biosilica samples were tested as catalyst for the photocatalytic degradation of bromophenol blue dye in aqueous solution, under UV irradiation. The BS-Chemical catalyst exhibited relatively higher degradation efficiency compared to BS-800 (thermally prepared). This could be due to the higher specific surface area and the fully amorphous nature of BS-Chemical. The findings of this study indicate that date palm biomass ash can be exploited as a reliable source for the isolation of highly pure amorphous silica nanoparticles having large surface area to be applied in catalysis, drug delivery, water treatment etc. Compared to the thermal method, the chemical method of biosilica extraction would be cost-effective too as it consumes less energy. Further research can be focused on optimizing the chemical synthesis route, using eco-friendly yet inexpensive chemicals, to yield engineered biosilica particles from this sustainable, affordable green resource for the large-scale production and commercialization of biosilica.
Acknowledgments
This research was funded by Deanship of Scientific Research at Imam Abdulrahman Bin Faisal University under the grant no. 2020-060-DSR. The authors acknowledge Basic & Applied Science Research Center (BASRC) for providing the research facilities.
Declaration of Competing Interest
The authors declare that they have no known competing financial interests or personal relationships that could have appeared to influence the work reported in this paper.
References
- White luminescence from sol–gel silica doped with silver. J. Sol-Gel Sci. Technol.. 2015;76:708-714.
- [CrossRef] [Google Scholar]
- Agricultural and industrial waste-derived mesoporous silica nanoparticles: a review on chemical synthesis route. J. Environ. Chem. Eng.. 2022;10(2):107322
- [CrossRef] [Google Scholar]
- Suitability of palm frond waste ash as a supplementary cementitious material. Arab. J. Sci. Eng.. 2020;45:7967-7974.
- [CrossRef] [Google Scholar]
- Green synthesis and characterization of biosilica produced from sugarcane waste ash. J. Chem.. 2017;2017
- [CrossRef] [Google Scholar]
- Photocatalytic degradation of methylene blue dye using silica oxide nanoparticles as a catalyst. Water. Environ. Res.. 2018;90(9):807-817.
- [CrossRef] [Google Scholar]
- Preparation and characterisation of biosilica from teff (eragrostis tef) straw by thermal method. Mater. Lett.. 2017;206:13-17.
- [CrossRef] [Google Scholar]
- Production of high purity amorphous silica from rice husk. Procedia Chem.. 2016;19:189-195.
- [CrossRef] [Google Scholar]
- Eco-production of silica from sugarcane bagasse ash for use as a photochromic pigment filler. Sci. Rep.. 2020;10:9890.
- [CrossRef] [Google Scholar]
- Recent progress on the development of engineered silica particles derived from rice husk. Sustainability. 2020;12(24):10683.
- [CrossRef] [Google Scholar]
- Rice husk silica as a sustainable filler in the tire industry. Arab. J. Chem.. 2022;15(9):104086
- [CrossRef] [Google Scholar]
- Preparation of low surface area SiO2 microsphere from wheat husk ash with a facile precipitation process. Mater. Lett.. 2015;156:42-45.
- [CrossRef] [Google Scholar]
- Synthesis of amorphous silica from rice husk ash: comparing HCl and CH3COOH acidification methods and various alkaline concentrations. Int. J. Tech.. 2020;11(1):200-208.
- [CrossRef] [Google Scholar]
- Generation of high quality biogenic silica by combustion of rice husk and rice straw combined with pre- and post-treatment strategies—A review. Appl. Sci.. 2019;9(6):1083.
- [CrossRef] [Google Scholar]
- Characterization of silica produced from rice husk ash: Comparison of purification and processing methods. Mat. Res.. 2017;20(Suppl 2):512-518.
- [CrossRef] [Google Scholar]
- The role of silicon in plant biology: a paradigm shift in research approach. Ann Bot.. 2018;121(7):1265-1273.
- [CrossRef] [Google Scholar]
- Pyrolysis of Saudi Arabian date palm waste: a viable option for converting waste into wealth. Life Sci J.. 2014;11(12):667-671.
- [Google Scholar]
- Synthesis of nano-silica from boiler ash in the sugar cane industry using the precipitation method. Int. J. Technol.. 2020;11(2):422-435.
- [CrossRef] [Google Scholar]
- Biosilica properties from rice husk using various HCl concentrations and frequency sources. Egypt. J. Chem.. 2020;63:363-371.
- [CrossRef] [Google Scholar]
- Ampel Bamboo leaves Silicon Dioxide (SiO2) extraction. IOP Conf. Ser.: Earth Environ. Sci.. 2018;141:012014
- [CrossRef] [Google Scholar]
- Synthesis and characterization of Ce3 doped silica (SiO2) nanoparticles. J. Lumin.. 2011;131:1249-1254.
- [CrossRef] [Google Scholar]
- New contributions to the optics of intensely light-scattering materials. J. Opt. Soc. Am.. 1948;38(5):448-457.
- [CrossRef] [Google Scholar]
- Production of biosilica nanoparticles from biomass power plant fly ash. Waste Manage.. 2020;105:8-17.
- [CrossRef] [Google Scholar]
- Eco-friendly and solar light-active Ti-Fe2O3 ellipsoidal capsules’ nanostructure for removal of herbicides and organic dyes. Environ. Sci. Pollut. Res. 2022
- [CrossRef] [Google Scholar]
- Natural clay minerals as heterojunctions of multi-metal oxides for superior photocatalytic activity. Mater. Sci. Eng. B.. 2022;286:116077
- [CrossRef] [Google Scholar]
- Enhanced solar light photocatalytic and antimicrobial activity of green noble metal/TiO2 nanorods. Can. J. Chem.. 2022;100(9):712-719.
- [CrossRef] [Google Scholar]
- Plant-derived silica nanoparticles and composites for biosensors, bioimaging, drug delivery and supercapacitors: a review. Environ. Chem. Lett.. 2021;19:1667-1691.
- [CrossRef] [Google Scholar]
- Extraction and characterization of biogenic silica obtained from selected agro-waste in Africa. Appl. Sci.. 2021;11:10363.
- [CrossRef] [Google Scholar]
- The effects of nanosized-palm oil fuel ash on early age hydration of hardened cement paste: the microstructure studies. J. Adv. Res. Fluid Mech. Therm. Sc.. 2021;82:87-95.
- [CrossRef] [Google Scholar]
- Robust synthesis of mono-dispersed spherical silica nanoparticle from rice husk for high definition latent fingermark development. Arab. J. Chem.. 2020;13:8119-8132.
- [CrossRef] [Google Scholar]
- Photocatalytic activity of silica and silica-silver nanocolloids based on photo-induced formation of reactive oxygen species. Photochem. Photobiol. Sci.. 2021;20:1161-1172.
- [CrossRef] [Google Scholar]
- Synthesis of nanosilica from agricultural wastes and its multifaceted applications: a review. Biocatal. Agric. Biotechnol.. 2021;37:102175
- [CrossRef] [Google Scholar]
- Effects of nanostructured biosilica on rice plant mechanics. RSC Adv.. 2017;7:13065.
- [CrossRef] [Google Scholar]
- Generalized procedure for the production of high-grade, porous Biogenic Silica. Waste Biomass Valorization.. 2020;11:1-15.
- [CrossRef] [Google Scholar]
- Crop Residues as potential sustainable precursors for developing silica materials: a review. Waste Biomass Valorization.. 2021;12:2207-2236.
- [CrossRef] [Google Scholar]
- Rice husk silica derived nanomaterials for sustainable applications. Renew. Sustain. Energy Rev.. 2017;80:453-466.
- [CrossRef] [Google Scholar]
- Extraction and physical characterization of amorphous silica made from corn cob ash at variable pH conditions via sol gel processing. J. Ind. Eng. Chem.. 2015;30:249-253.
- [CrossRef] [Google Scholar]
- Reporting physisorption data for gas/solid systems with special reference to the determination of surface area and porosity (Recommendations 1984) Pur Appl. Chem.. 1995;57
- [Google Scholar]
- Utilization of secondary agricultural products for the preparation of value added silica materials and their important applications: a review. J. Sol-Gel Sci. Technol.. 2020;96:15-33.
- [CrossRef] [Google Scholar]
- Biogenic nanosilica synthesis employing agro-waste rice straw and its application study in photocatalytic degradation of cationic dye. Sustainability. 2022;14:539.
- [CrossRef] [Google Scholar]
- Biochar from date palm waste, production, characteristics and use in the treatment of pollutants: a review. IOP Conf. Ser.: Mater. Sci. Eng.. 2020;737:012171
- [CrossRef] [Google Scholar]
- Review on a novel biosilica source for production of advanced silica-based materials: Wheat husk. Asia-Pac. J. Chem. Eng.. 2019;14(1):e2262.
- [CrossRef] [Google Scholar]
- Preparation of silicon from rice husk as renewable energy resource by the use of microwave ashing and acid digestion. Int. J. Energy Eng.. 2018;8(2):25-29.
- [CrossRef] [Google Scholar]
- Extraction of valuable chemicals from sustainable rice husk waste using ultrasonic assisted ionic liquids technology. J. Clean. Prod.. 2019;220:620-629.
- [CrossRef] [Google Scholar]
- Photocatalytic degradation of toxic methyl red dye using silica nanoparticles synthesized from rice husk ash. Environ. Anal. Toxicol.. 2015;5:6.
- [CrossRef] [Google Scholar]
- Biomass derived silica containing products for removal of microorganisms from water. Int. J. Environ. Sci. Technol.. 2015;2015(12):1495-1502.
- [CrossRef] [Google Scholar]
- A green sol–gel route for the synthesis of structurally controlled silica particles from rice husk for dental composite filler. Ceram. Int.. 2013;39:4559-4567.
- [CrossRef] [Google Scholar]
Appendix A
Supplementary material
Supplementary data to this article can be found online at https://doi.org/10.1016/j.arabjc.2022.104522.
Appendix A
Supplementary material
The following are the Supplementary data to this article:Supplementary data 1
Supplementary data 1


