

Translate this page into:
In vivo biodistribution, antioxidant and hemolysis tendency of superparamagnetic iron oxide nanoparticles – Potential anticancer agents
⁎Corresponding authors. shahzad.cssp@pu.edu.pk (Shahzad Naseem), saira.cssp@pu.edu.pk (Saira Riaz)
-
Received: ,
Accepted: ,
This article was originally published by Elsevier and was migrated to Scientific Scholar after the change of Publisher.
Peer review under responsibility of King Saud University.
Abstract
Abstract
Ferromagnetic and superparamagnetic oxide nanoparticles are of particular attention because of their possible use in various fields ranging from bio-nanotechnology to spintronics. Detailed magnetic, dielectric and impedance investigations are crucial for the above-mentioned applications. This study deals with the exploration of various iron oxide phases under as-synthesized conditions by sol–gel method. pH of the sols is varied in the range of 1 to 11. X-ray diffraction (XRD) analysis indicate amorphous behavior for nanoparticles synthesized using pH 1 and 3. Nanoparticles synthesized using pH 2 and 4–6 exhibit hematite phase of iron oxide. Whereas structural transition to maghemite phase is observed for pH 7–8. Nanoparticles synthesized using high pH values, i.e. 9–11, exhibit structural transition towards magnetite phase of iron oxide. Hematite nanoparticles exhibit superparamagnetic and ferromagnetic hysteresis curves with saturation magnetization of ∼ 24 emu/g and ∼ 13–17 emu/g at pH 2 and pH 4–6, respectively. Maghemite nanoparticles exhibit superparamagnetic (pH 7) and ferromagnetic (pH 8) response with saturation magnetization of ∼ 69 and ∼ 42 emu/g, respectively. Fe3O4 nanoparticles exhibit superparamagnetic (pH 9–10) and ferromagnetic (pH 11) behavior with saturation magnetization of ∼ 88, 87 and 52 emu/g, respectively. High grain boundary resistance contributed towards high dielectric constant of ∼ 99, 109 and 154 (log f = 5.0) at pH 2, 7 and 9. Detailed impedance values indicate dominant role of grain boundaries in the conductivity of iron oxide nanoparticles. Superparamagnetic iron oxide (pH 9) exhibits strong antioxidant activity along with a very weak hemolytic response. The findings of cell lysis reveal that synthesized nanoparticles have a potential to combat dangerous cancer cells. Drug efficacy results show that after 120 min the encapsulation efficacy reaches a peak of ∼ 83 % using curcumin, a naturally existing drug. In vivo biodistribution of nanoparticles was studied in Rabbit model. Synthesized nanoparticles are labelled using Technetium-99 m. Whereas, labeling efficacy and stability was examined using =nstant thin layer chromatography (ITLC) process. In vitro and in vivo results suggest potential anti-cancer applications of as-synthesized superparamagnetic nanoparticles.
Keywords
Sol–gel
Iron oxide
pH
Magnetic
Antioxidant
Hemolysis

1 Introduction
In the recent research age, synthesis of nanoparticles (NPs) is attracting the attention of scientific community owing to enormous applications in science and technology. Small size along with large surface area make them excellent choice in enhancing structural, magnetic, dielectric and electrical properties (Sundar et al., 2020; Saira et al., 2014; Dadfar et al., 2020). Ability to tune magnetic and dielectric properties makes nanoparticles useful for applications ranging from biomedical field to electronic and spintronic applications.
Magnetic nanoparticles (MNPs) belong to a class of high-tech materials that have a potential to be used in variety of applications such as actuator, sensor, molecular imaging and drug delivery. Coating of magnetic nanoparticles with suitable bio-compatible material is essential for the therapeutic and drug release purposes. However, cytotoxic effects of core materials cannot be ignored. Researchers have been trying to not only control/tune the properties of nanomaterials but at the same time they are exploring methods / materials to minimize the toxic effects of synthesized material (Xu et al., 2021).
Amongst various materials of interest, iron oxide due to its different phases with amazing properties has attracted world’s attention. Magnetic iron oxide NPs can be used in a variety of applications in bio-related fields such as hyperthermia cancer treatments, drug delivery, target cells etc. (Dadfar et al., 2020; Lee et al., 2020; Vangijzegem et al., 2019; Yusefi et al., 2020; Mirza et al., 2020). Moreover, iron oxide nanoparticles, as a carrier or antioxidant, were found to be effective for enhancement in antioxidant studies (Khalil et al., 2020). Basically, reactive oxygen species (ROS) may react and result in damage to cell membranes, proteins, organs, DNA, lipids etc., resulting in apoptosis, mutations. As a result, antioxidants have gained much attention because of their ability to minimize ROS stress in inflammatory cells and may be a key factor in the treatment of inflammatory diseases (Amani et al., 2017; Wu et al., 2018; Moghadam et al., 2022; Rad et al., 2021; Marjani et al., 2022; Feizabadi et al., 2021; Sadeghzadeh et al., 2020; Dareini et al., 2020; Movahed et al., 2011; Chamani and Moosavi-Movahedi, 2006). Furthermore, interaction of NPs with blood constituents wants particular consideration. Therefore, finding the blood compatibility of NPs is important for its use in applications where nanoparticles are going to be delivered. However, NPs injected into blood may cause bad effects such as clotting of blood and hemolysis. Hemolysis is breakdown of Red Blood Cells (RBC) due to the cell membrane’ deformation. Electrostatic interactions between NPs and positively charged RBC membranes via their negatively charged surface can result in hemolysis (Yildirim et al., 2013).
Magnetically, magnetite (Fe3O4), hematite (α-Fe2O3), and maghemite (γ-Fe2O3) are those phases of iron oxide that are of utmost importance (Riaz et al., 2013; Riaz et al., 2014; Riaz et al., 2014; Akbar et al., 2014; Akbar et al., 2014; Akbar et al., 2019). Maghemite and magnetite have cubic crystallographic structure and possess ferrimagnetic behavior (Tc= ∼ 863–945 K and ∼ 850 K respectively) (Riaz et al., 2014; Akbar et al., 2014; Akbar et al., 2019). In magnetite, octahedral and tetrahedral sites are taken by Fe2+. Fe3+ ions can take position on octahedral sites (Riaz et al., 2014; Akbar et al., 2014). In crystal structure of maghemite, only Fe3+ ions are present, and vacancies are created by the absence of Fe2+ ions. Hematite has different crystal structure i.e. hexagonal. Oxygen anions are arranged in hcp pattern, whereas iron cations are spread on the octahedral sites (Akbar et al., 2014; Riaz et al., 2014). Hematite is antiferromagnetic in nature, but it shows a transition to ferromagnetic above Morin temperature (∼260 K) (Akbar et al., 2014; Han et al., 2020).
Physical and chemical properties of different phases of nanoparticles depend upon their morphology, structure, distribution and synthesis route (Bhavani et al., 2017). These parameters play a critical role towards the efficient clinical diagnostics and treatment. Thus, bio active nanoparticles designed carefully may have a significant effect on not only the early diagnosis but also on the effective treatment of various fatal diseases especially cancer. These targets can only be achieved by controlling the physical as well as the chemical properties of nanoparticles including, shape, size, hydrophobicity, agglomeration etc. (Xu et al., 2021; Kumar et al., 2018; Sivakumar et al., 2018; Reddy et al., 2020).
To date, several chemical based methods including wet chemical reduction (Chaki et al., 2015), hydrothermal (Ghosh et al., 2020), co-precipitation pyrolysis (Mirza et al., 2015), sol–gel (Zeb et al., 2017), etc., have been employed for preparing iron oxide nanoparticles. Furthermore, the phase, shape, and dimensions of nanoparticles are strongly influenced by changes in pH, temperature, ionic strength, agitation, surfactants, and the salts used during chemical synthesis (nitrates, sulphates, and chlorides) (Blanco-Andujar et al., 2012). The ionic strength and acidity of the precipitation agent are main factors on which the mean size of magnetic nanoparticles depends. Narrow particle size distribution and small particle size can be attained under elevated ionic strength (Sharma, 2017). The size of the ferric (Fe3+) and ferrous (Fe2+) precursor ions and the ionic strength affect the mean size of the magnetite nanoparticles. The mean size decreases as the anion size of the precursor salt increases. Besides, the higher the ionic strength, the smaller is the particle size (Hussain, 2021; Hosseinzadeh et al., 2019; Moosavi-Movahedi et al., 2004; Chamani et al., 2005; Maheri et al., 2022).
However, all of the synthesis methods, reported so far, have used high temperature pre / post treatments along with use of complex reagents (Chaki et al., 2015; Ghosh et al., 2020; Mirza et al., 2015; Zeb et al., 2017). Sol-gel synthesis was performed for the present work to prepare iron oxide nanoparticles. In this technique, sol, i.e. colloidal suspension, is obtained by the hydroxylation and condensation of precursors. A gel is obtained by condensation and polymerization process (Owens et al., 2016). This technique has i) good control of synthesis process, ii) high temperatures are not required to get the stable phase and iii) molecular level mixing of precursors in liquid results in homogeneous product under optimized conditions (Mohapatra and Anand, 2010). pH of the solution, during sol–gel synthesis, is a crucial parameter that directly influences the properties of nanostructures (Ramaprasad et al., 2018). Morphology of nanoparticles is strongly dependent on H+ and OH– ions in the sol that controls polymerization in metal and oxygen bonding (Mohapatra and Anand, 2010). The degree of agglomeration of nanoparticles is highly dependent on pH variation (Meng et al., 2016).
Zhou et al. (Zhou et al., 2001) studied pH range of 8.5–13.5 and obtained magnetite phase at pH 13.5, while mixed phases of FeOOH and magnetite were obtained at pH 8.5 and 10.5. Abedini et al. (Abedini et al., 2014) studied the effect of pH 5, 12 and 14 for gamma radiolytic synthesized iron oxide nanoparticles. Acidic pH resulted in the creation of various complexes with multiphase magnetic properties. pH 12 resulted in formation of superparamagnetic phase and pH 14 showed tendency towards formation of paramagnetic iron (III) oxy-hydroxide. Yusoff et al. (Yusoff et al., 2017) studied pH from 11.33 to 12.25 using co-precipitation method for magnetite nanoparticles. They obtained small sized magnetite nanoparticles for pH 11.33 to 12.15 while large grain size was obtained for >12.15. Faiyas et al. (Faiyas et al., 2010) studied pH 6, 9 and 11 for iron oxide nanoparticles. They obtained ɛ-Fe2O3 phase for pH 6 and 9 and magnetite phase for pH 11. Mitra et al. (Mitra et al., 2007) studied pH of 13.0, 13.7 and 14.2 and obtained hematite phase with weak ferromagnetic behavior. Zhou et al. (Zhou et al., 2012) obtained hematite with pH 10.01 and magnetite phase with pH 12.95. Thus, as per literature, the extensive study of pH, i.e. covering the whole pH spectrum, and effect of changes in pH on dielectric and impedance properties of magnetic iron oxide nanoparticles is hard to find in literature.
Present research work was designed to check the in vitro and in vivo bio activity, including biocompatibility and biodistribution, of iron oxide nanoparticles. In-vivo activity was performed using rabbit model by injecting labelled nanoparticles in bloodstream. Effect of varying synthesis conditions is corelated with the changes observed in physical as well as bio-activity of nanoparticles.
2 Experimental details
2.1 Chemicals required
Iron nitrate nanohydrate (Fe(NO3)3·9H2O), ammonia (NH3·H2O) and ethylene glycol (C2H6O2) were purchased from Sigma Aldrich.
2.2 Synthesis of iron oxide nanoparticles
For the synthesis of iron oxide nanoparticles, Fe(NO3)3·9H2O was selected as precursor. 10 mL of deionized water (DI) was dissolved in 2 g of iron nitrate with stirring for 10 min. Reddish orange solution was obtained by the addition of ethylene glycol (C2H6O2, 30 mL) to above solution. DI water and C2H6O2 ratio was kept at 1:3. Iron oxide sol was attained by heating the resultant reddish orange solution on hot plate at 80˚C for 6 h. This heating changes the color of sol to reddish black. Iron oxide sol was then heated at 100˚C to obtain nanoparticles. pH of iron oxide sol was the variable parameter. pH variation was done by ammonia (NH3·H2O). Schematic protocol for pH varied iron oxide nanoparticles is presented in Fig. 1.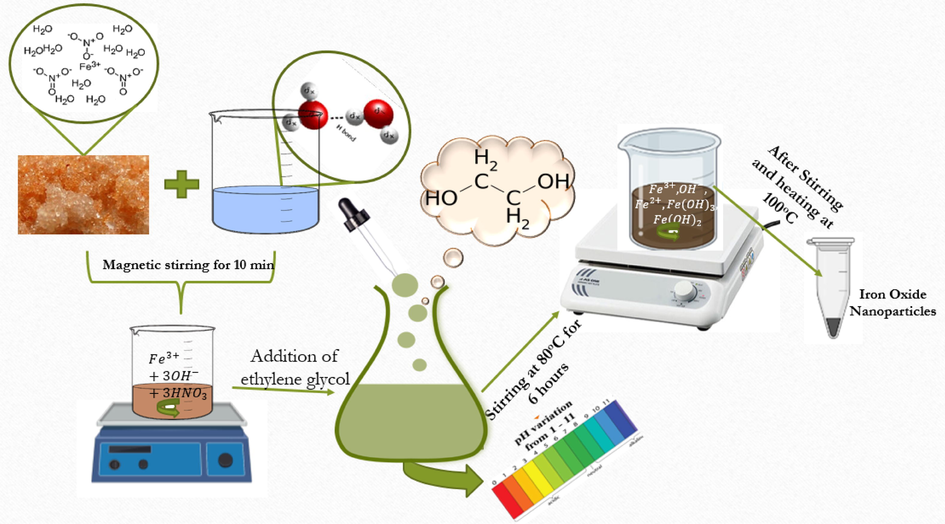
Schematic for sol–gel synthesis of iron oxide nanoparticles.
2.3 Drug loading
An ethanol solution of curcumin (200 µg/mL at pH 7) was prepared to examine the drug (curcumin) loading efficiency of iron oxide nanoparticles. The solution was then added to the optimized sample of iron oxide, and the mixture was agitated in the absence of light for 2 h at room temperature (±25 oC). After stirring, drug-loaded nanoparticles were obtained using centrifugation. The nanoparticles were then washed with ethanol three or four times to remove the unbound substance i.e. curcumin. Following washing, curcumin-loaded iron oxide nanoparticles were produced by a 5-hour post-heat treatment at 50 °C. The efficacy of drug loading encapsulation using iron oxide nanoparticles was determined spectrophotometrically by measuring absorbance at 420 nm using Eq. (1) (Gooneh-Farahani et al., 2020).
Where Tc and Sc are used to determine total curcumin and curcumin in the supernatant, respectively.
2.4 Solubility and stability of curcumin-loaded nanoparticles
Equal amounts of bare curcumin and iron oxide nanoparticles loaded with curcumin were dissolved into 0.01 M phosphate buffered saline, having pH 7.4, to check the aqueous solubility of drug loaded nanoparticles. Furthermore, high performance liquid chromatography (HPLC) method was utilized to check the stability of bare curcumin as well as curcumin-loaded nanoparticles in PBS solution (0.01 M with pH of 7.4) (Mohanty and Sahoo, 2010). A fixed concentration ∼ 40 μg/mL (stock solution of 10 mL) for both bare curcumin and curcumin-loaded nanoparticles was prepared using PBS solution and then these working solutions were further incubated at 37 °C in a shaker having 150 rpm for a time period of 6 h. At various time intervals, equal amount, i.e. 100 μL, of solution was removed form bare and iron oxide loaded curcumin to check the stability in PBS by using HPLC method.
2.5 Cell viability assay
The cytotoxic effect of iron oxide NPs was tested on cancer cell lines HCT-116. The cytotoxicity of as-synthesized nanoparticles was evaluated against these cell lines. Cancer cell lines (HCT-116) were cultured in 96 well plate in DMEM (Dulbecco's Modified Eagle's Medium) supplemented with antibiotics (penicillin) and 10 % heat-inactivated FBS (fetal bovine serum). The culture was further incubated at 37 °C in the presence of 5 % CO2 vapour. To assess the effect of nanoparticles on the viability of HCT-116 cells, these cultured cells were exposed to various nanoparticle concentrations (Ali et al., 2018). The MTT (3- (4, 5-dimethylthiazol-2-yl)-2, 5-diphenyl tetrazolium bromide) test was performed to determine viability of the optimized sample. In this experiment, cells were cultivated for 24 h at 37 °C before being exposed to nanoparticles. Following a 24-hour incubation period, various nanoparticle concentrations were introduced to the well plates at 37 °C in the presence of 5 % CO2 and 95 % air. The experiment was carried out three times, with untreated cells (HCT-116) serving as a positive control. Under the same circumstances, MTT was applied to the microplates and was incubated for 4 h. The media was then expelled using a micro pipit. To dissolve the formazan crystals formed by MTT, dimethyl sulfoxide (DMSO) was added to the plates, which was vigorously agitated. A microplate reader was used to detect absorbance at 570 nm. The method was used to calculate the percentage of cell inhibition using equation (2) (Hayashi et al., 2012).
As represents absorbance of the sample, whereas Ao represents the absorbance of the control, i.e. untreated cancer cells.
2.6 Preparation of 99mTc- iron oxide nanoparticles
Technetium-99 m (a diagnostic radionuclide) was eluted from PAKGEN 99Mo/99mTc generator, which is a locally fabricated fission-based generator. All chemicals used in this research work were of analytical grade. Animal experiments were performed after getting approval from the Animal Ethical Committee of the Institute. 50–200 μg of the iron oxide NPs were used for radiolabeling with 99mTc, while 5–20 μg of SnCl2·2H2O was used as a reducing agent. The pH of the reaction mixture was varied between 3 and 7 using 0.1 M NaOH or 0.1 M HCl. Maximum radiolabeling yield was attained by adding 200 μg of nanoparticles in 200 μL of water, in the presence of 20 μg of reducing agent at pH 3. To perform radiolabeling, approximately 173 MBq of 99mTcO4- in saline was added into the reaction mixture vial and the whole formulation was incubated for 30 min at room temperature, i.e. 25 ± 2 °C.
2.7 Radiolabeling conditions
Formulation of 99mTc- iron oxide nanoparticles is based on several parameters, e.g. the labelling efficacy, radiochemical purity and stability at room temperature. All these parameters were evaluated by using Whatman grade 3 chromatographic paper as the stationary phase and acetone as mobile phase. In this system, the free 99mTcO4- moved along with the solvent front (Rf = 1) and the radio-conjugate remained at the origin. The estimation of colloid content was done by passing the radiotracer through 0.22 µm filter. Afterwards, the filtrate along with filter was measured for radioactivity in dose calibrator. The radioactivity measurement data did not prove presence of any colloid content in the final composition.
2.8 Quality control of 99mTc- iron oxide nanoparticles
Ascending chromatography was used to assess the content of radiochemical yield of 99mTc-iron oxide nanoparticles. For this purpose, Whatman grade 3 chromatographic paper was used as the stationary phase and acetone as a mobile phase. In this chromatographic set-up, the amount of free 99mTcO4- moved with solvent front and the radiolabeled iron oxide nanoparticles remained settled at the origin. In order to evaluate the distribution of radiolabeled and free 99mTcO4- on the chromatographic strip, the strip was cut into 1 cm segments and counted in a gamma-counter (SCALER TIMER ST7). The stability of 99mTc- iron oxide nanoparticles was studied for 24 h at room temperature.
2.9 Evaluation of stability of 99mTc- iron oxide nanoparticles
After attaining optimization of the radiolabeling conditions, the stability of the radiolabeled complex (99mTc- iron oxide nanoparticles) was evaluated at room temperature by ascending chromatography till 24 h, at discrete intervals of time, i.e. 2 h, 4 h and 24 h. The quality control was carried out at each incubation time by keeping all of the above-mentioned parameters fixed.
2.10 Lipophilicity analysis of 99mTc – Iron oxide nanoparticles and protein binding
In order to assess the lipophilicity behavior of the radio-complex, the partition coefficient “p” between organic and aqueous layers was measured. As an experimental procedure, 100 µL of the radiolabeled complex was mixed with 200 µL of phosphate buffer at varying pH values, e.g. 6.6, 7.0 and 7.6 in separate vials. After this, 200 µL of n-octanol was added in each vial. All three vials were well shaken and kept undisturbed so that both layers could be separated. The two layers were separated after about 10–15 min, and the radioactivity was measured in a well-shaped gamma counter (Sanaullah et al., 2021).
The protein binding study was assessed by using human blood plasma as an in vitro procedure. For this purpose, 3 mL of blood plasma was mixed with 1 mL of radiolabeled complex. The resultant formulation was incubated at 37 °C for one hour. After completing incubation, the separation of serum and blood cells was done by centrifuging the mixture at 3000 rpm for 10 min, followed by mixing the supernatant with an equal volume of trichloroacetic acid and centrifuging again at 3000 rpm for 10 min. The residue and supernatant were then separated, and amount of radioactivity was counted in both layers in a well-shaped gamma counter. Each experiment was performed in triplicate.
2.11 Stability of 99mTc- iron oxide nanoparticles in human serum
Fresh human blood samples of a healthy volunteer without any specific pathologies were preserved in vacutainer tubes coated with EDTA so that coagulation could be prevented. In order to evaluate the stability in normal human serum, dilution was prepared using 0.8 mL of serum added in 175 µL of 99mTc-labeled iron oxide -nanoparticles. The resultant radio-mixture was incubated at 37 °C. Samples were withdrawn during incubation at various discrete time intervals up to 24 h and the radiolabeling efficacy was determined by paper chromatography. Any reduction in the labeling yield was considered to be due to degradation of the radiolabeled complex (Imran et al., 2021).
2.12 Scintigraphy with 99mTc – Iron oxide nanoparticles on gamma camera in rabbit
In order to evaluate the feasibility of novel nano-radio conjugate as a radiopharmaceutical drug, we injected it intravenously (in rear ear vein) in rabbit animal models and developed the images using a single-headed gamma camera. Camera was interfaced with high resolution parallel-hole collimator and further connected to an online computer (containing a Macintosh operating system 7.5 coupled to an ICON™ Workstation).
The animal model used for in-vivo experiments was rabbit. Healthy local Lahore breed rabbits (aged 12–16 weak; 900 ± 50 g) were used. Rabbits were kept in animal house of INMOL according to their natural habitat. They have created their own homes by tunneling into the ground called warrens. Since rabbits are herbivores and eat a diet of grass and leafy weeds, so free access to natural food and drinking water was provided to them. The number of experiments performed was 3, and the number of rabbits used per each time point was also 3. After required biodistribution tests rabbits were send back to their house (in INMOL) and were observed periodically for any physical change. Even after a time of 1 year, rabbits were found healthy.
As an experimental procedure, the animal was fixed on a flat, hard surface in such a position that both hind legs were spread out and fixed with surgical tape. No euthanasia or animal sacrifice was involved in this study. The general anesthesia was induced by intra-muscularly injecting 2 mL Diazepam into the left thigh. The radioactive drug to be tested, e.g. 173 MBq (in 400 µL) of 99mTc- iron oxide nanoparticles was injected through an intravenous route into marginal ear vein of the animal. To study the biodistribution of tracer in animal, images were acquired for 10 min in dynamic view followed by static images at 15 min, 1 h, 2 h, 4 h and 24 h post injection.
2.13 Statistical analysis
Data is plotted as mean ± SD, for n = 3, and analyzed by one-way and two-way ANOVA to detect the significant effects of the variables and judged at a significance threshold level of P < 0.05. One-way and two-way analyses of variance (ANOVAs) were performed to detect significant effects of the variables. Values of p < 0.05 were considered as significant differences while p < 0.005 value was considered as highly significant difference. P > 0.05 is considered as not significant difference.
2.14 Characterizations
Structural investigation was obtained using X-ray Diffractometer (XRD) using CuKα radiations (λ = 1.5405 Å). XRD analysis was performed for 2θ˚=15-80˚. Magnetic investigation was completed at room temperature for applied field varying from −15000Oe to + 15000Oe using 7407 Vibrating Sample Magnetometer by LakeShore. Impedance investigation was performed using 6500B Precision Impedance Analyzer by Wayne Kerr under parallel plate arrangement. The frequency of applied electric field was varied in the range of log f = 1.3 to 7.3. Contribution of grains and grain boundaries towards the dielectric and conduction process was evaluated in detail using Zview software. Presently, Zview fitting of Cole-Cole plots is done with different electrical components to obtain the separate effect of grain and grain boundaries. The best fitted results were obtained using three elements-based circuit, i.e. a low resistance to represent grains attached in series with parallel group of a high resistance and a capacitor that was used to represent grain boundaries. Surface morphology of nanoparticles was studied using scanning electron microscope (SEM). DPPH (2, 2, diphenyl-1-picryl hydrazyl) assay was used for evaluating antioxidant nature of iron oxide nanoparticles. Whereas absorption intensity was measured using Shimadzu UV-1800 UV–visible spectrophotometer. Hemolytic activity was performed on healthy human blood. Biodistribution of nanoparticles in animal (rabbit) was examined using single-headed Siemens integrated ORBITER gamma camera.
3 Results and discussion
3.1 Structural analysis
XRD results of as-synthesized iron oxide nanoparticles with varying pH of sols from pH 1 to pH 11 are depicted in Fig. 2. Nanoparticles synthesized using pH 1 and pH 3 show amorphous behavior while rest of the nanoparticles show crystalline nature. Sol-gel process is based on solvolysis of iron nitrate in the solution. It is followed by the hydrolysis reaction that leads to initially the formation of iron hydroxide. In the next step polymerization process takes place that leads to bridging of Fe2+, Fe3+ and O2– ions. It can be predicted that concentration of OH– at low pH values is not sufficient to trigger the growth of iron oxide phase because of the deficiency of Fe3+–OH– groups. As pH increases concentration of hydroxyl ions in the sol increases that acts as the first step for crystallization and phase formation of nanoparticles (Riaz and Naseem, 2015). At pH 2 hematite (α-Fe2O3) phase of iron oxide was observed. All the planes of (0 1 2), (1 0 4), (1 1 0), (0 2 4), (3 0 0) and (2 1 7) are well matched with the JCPDS card no. 87–1165 exhibiting hematite phase. The broad peak corresponding to plane (0 1 2) indicates small size of crystallites. These small crystallites further undergo a recrystallization process at pH 3 resulting in amorphous nature of nanoparticles. Further increase in the pH to 4 resulted in growth of the crystallites of hematite resulting in relatively sharper diffraction peaks. From pH 4 to 6 the growth of these crystallites takes place resulting in increased crystallinity of nanoparticles as specified by increased intensity of plane (0 1 2) in XRD peaks. At pH 7 increased number of hydroxyl ions results in phase transition from hematite (α-Fe2O3) to maghemite (γ-Fe2O3). All the planes of (1 1 1), (2 1 0), (2 2 1), (3 1 1), (3 2 0), (3 2 1), (4 0 0), (3 3 0), (4 2 2), (5 1 0), (5 1 1), (5 2 1), (4 4 0), (4 4 2) and (6 2 2) are well matched with the JCPDS card no. 39–1346 exhibiting maghemite phase of iron oxide nanoparticles. This phase evolution process is associated with breaking of larger crystallites to smaller crystallites resulting in broad diffraction peak as can be seen in Fig. 2 (c). These crystallites then further colligate resulting in growth and strengthening of γ-Fe2O3 phase at pH 8. The structural changeover from maghemite (γ-Fe2O3) to magnetite (Fe3O4) was observed with further increase in pH values up to 9 and 10 as can be seen in Fig. 2 (d). All the planes of (1 1 1), (3 1 1), (4 0 0), (3 3 1), (4 2 2), (5 1 1) and (4 4 0) are well matched with the JCPDS card no. 72–2303. This phase conversion is associated with breaking of larger crystallites to smaller crystallites. Higher pH of 11 resulted in growth of these crystallites along with phase stability and strengthening of magnetite (Fe3O4) phase. It is important to point here, according to the best of author’s information, that such transitions among different phases of iron oxide, under as-synthesized conditions, is one of its kind studies.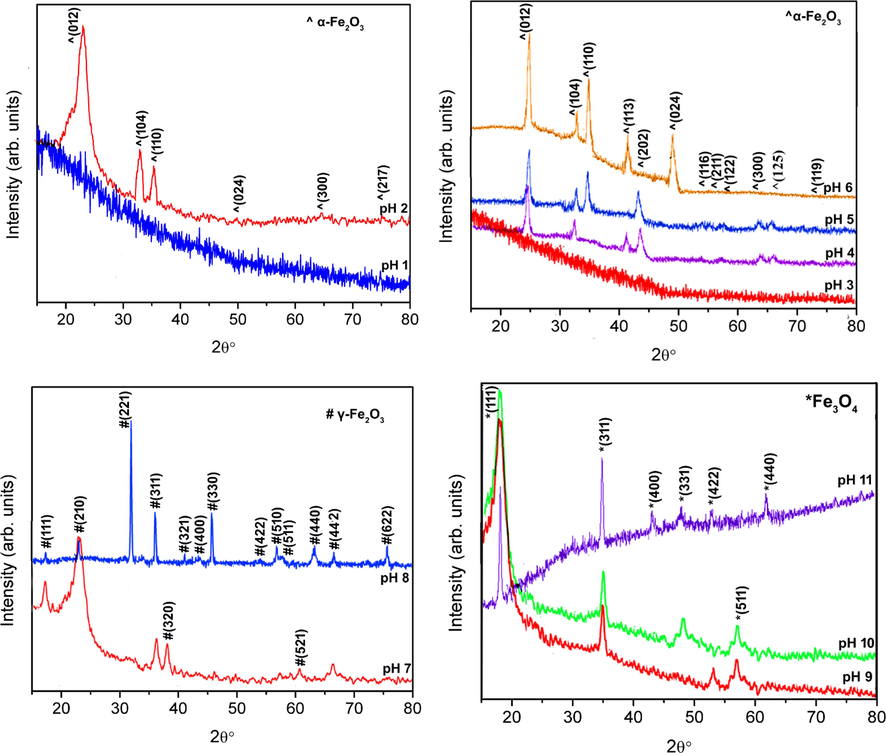
XRD patterns for iron oxide nanoparticles synthesized with different pH values.
Use of de-ionized water during synthesis, as explained in experimental details, results in increased dissociation of precursor in water to produce Fe3+ and OH– increasing the number of building material required for growth and phase formation of iron oxide (Eq. (3)). Ethylene glycol acts as mild reducing agent (Eqs. 4–5) (Kozakova et al., 2015). In this case, ethylene glycol undergoes dehydration process and results in formation of acetaldehyde that results in reduction of Fe3+ cations. Also, the water produced in this process (Eq. (4)) increases dissociation of the precursor. When ammonia was mixed in the sol for changing the pH to different levels, it dissociates according to reaction represented in Eq. (4) (Hu et al., 2009), thus increased number of hydroxyl ions are in the sol. Hydroxyl ions produced, as per Eqs. 5–8, react with Fe3+ and Fe2+ ions to form hydroxides of iron as represented by Eqs. (9) and (10). At lower values of pH, because of low concentration of hydroxyl ions, probability of formation of Fe(OH)3 is high that further results in development of Fe2O3 phase (Eq. (10)). While at higher values of pH because of abundance of hydroxyl ions, Fe(OH)2 also increases in the sol whose reaction with Fe(OH)3 results in development of Fe3O4 phase.
Variation in crystallite size (t) (Eq. (11)) (Cullity, 1956) and associated dislocation density (δ) (Eq. (12)) (Was, 2016) for iron oxide nanoparticles, with full width at half maximum (B) determined from XRD patterns in Fig. 2, is shown in Fig. 3. Size and phase of the chemically synthesized nanoparticles is strongly influenced by the presence of OH– and H+ ions in solution that stimulates the polymerization behavior of metal and oxygen bonds (Chand, 2019). Changes in ratio of OH– and H+ ions lead to changes in hydrolysis and condensation rates in the sol influencing not only the crystallite/grain size of nanoparticles but also in obtaining different phases as observed in Fig. 2. The two important processes involved in particle formation are nucleation and aggregation. In the first stage several crystallites of small size are formed when the process of nucleation starts. In the second step these small crystallites then aggregate to form larger particles. So basically, when rate of aggregation is fast as compared to nucleation rate larger crystallites are formed. When rate of nucleation is higher than rate of aggregation, small crystallites are formed. Rate of nucleation and rate of aggregation are affected by several factors including concentration and interaction among anions and cations, phase composition etc. At high pH, in alkaline medium, a supersaturated network is formed due to higher OH– concentration. This will result in slowing down of nucleation rate and thus must result in formation of larger crystallites (Huang et al., 2016; Kumar and Bhowmik, 2014; Sanaullah et al., 2021). But it can be observed in Fig. 3 that there are some abnormalities in the trend of crystallite size and dislocation density. These abnormalities are due to transition from one phase to another indicating a restructuring process. At pH 1–6, crystallite size increase from ∼ 6 to 12 nm along with decrease in dislocation density. At neutral pH (7), there is an abrupt drop in “t” from ∼ 12 to 5 nm due to creation of iron oxide maghemite phase. “t” then increases to 15.5 nm as the pH of sol increases to 8 for maghemite iron oxide nanoparticles. Further, there is increase in crystallite size from ∼ 4–17 nm by increase in pH from 9 to 11.
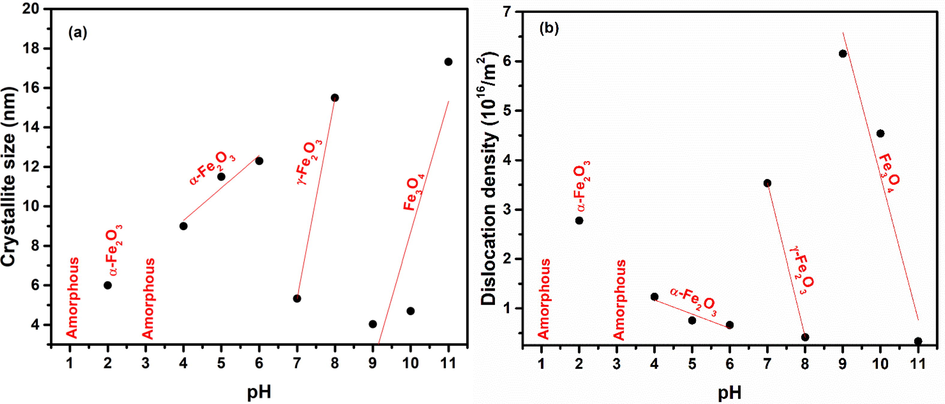
(a) Crystallite size and (b) dislocation density plotted with variation in pH for iron oxide NPs.
3.2 Surface morphology analysis
Fig. 4 shows SEM images of magnetite NPs synthesized using sol–gel with pH 9, 10 and 11, respectively. All micrographs show uniform distribution along with well-defined grain boundaries in magnetite NPs (Fig. 4).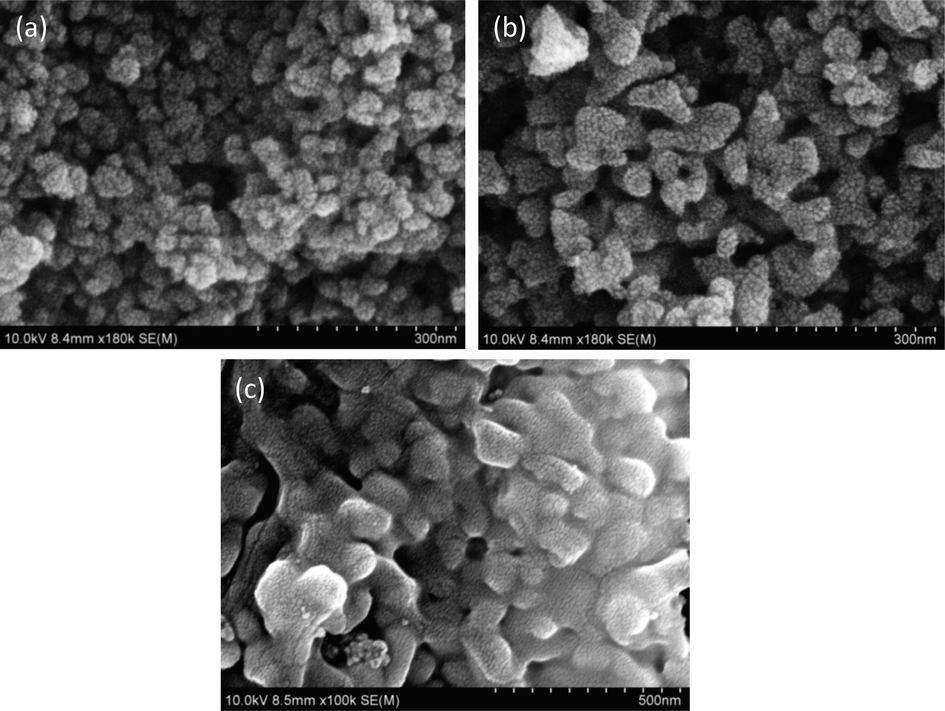
SEM for iron oxide nanoparticles synthesized with (a) pH 9 (b) pH 10 (c) pH 11.
3.3 Room temperature magnetic analysis
Magnetic characteristics (M−H loops) of iron oxide nanoparticles, under as synthesized conditions, are shown in Fig. 5. M−H loop tells about saturation magnetization, remnant magnetization and coercivity. Saturation magnetization shows alignment of magnetic spins in the sample (Salem et al., 2019). para-ferro mixed behavior is observed at pH 1, while shift to superparamagnetic behavior is observed with the increase, i.e. pH 2. Such superparamagnetic response is indicative of the presence of smaller crystallite / domain size. Ultrasmall size, absence of multiple domains and positive response to magnetic field make these nanoparticles single super spin particles with high value of susceptibility (Wahajuddin, 2012). While shift from superparamagnetic to soft ferromagnetic behavior is observed with the increase of pH to 3. This behavior persisted till pH 6. While again a shift was observed with further increase of pH to 7. This shift is due to crystallographic change from hematite to maghemite phase. As pH was increased to 8, superparamagnetic nature of nanoparticles changes to ferromagnetic nature. This transition is due to coalescence of crystallites as observed in Fig. 3. For pH 9 and 10, magnetic transformation from ferromagnetic to superparamagnetic iron oxide nanoparticles is noticed owing to phase conversion to magnetite along with reduced crystallite size (Figs. 2 and 3). As discussed earlier for Fig. 2, with increase in pH of the sol to 9 and 10, number of Fe(OH)2 increases thus probability that vacancies on the maghemite crystal structure are filled increases. This vacancy filling leads to alteration from maghemite to magnetite phase with reduced crystallite size. Maximum saturation magnetization values are obtained for pH 9 and 10. Langevin function fit to the M−H plots of the samples prepared with pH 2, 7, 9 and 10 is shown in Fig. 6. As pH increases to 11, there is increase in OH– ions concentration in the sol (strong basic) that results in coalescence of nanoparticles resulting in transition from superparamagnetic to ferromagnetic behavior. Inflection point in M−H loops of samples synthesized under various pH conditions shows the alignment of spins for different values of applied magnetic field. Further, they also contribute to the magnetocrystalline anisotropy as discussed in Fig. 7.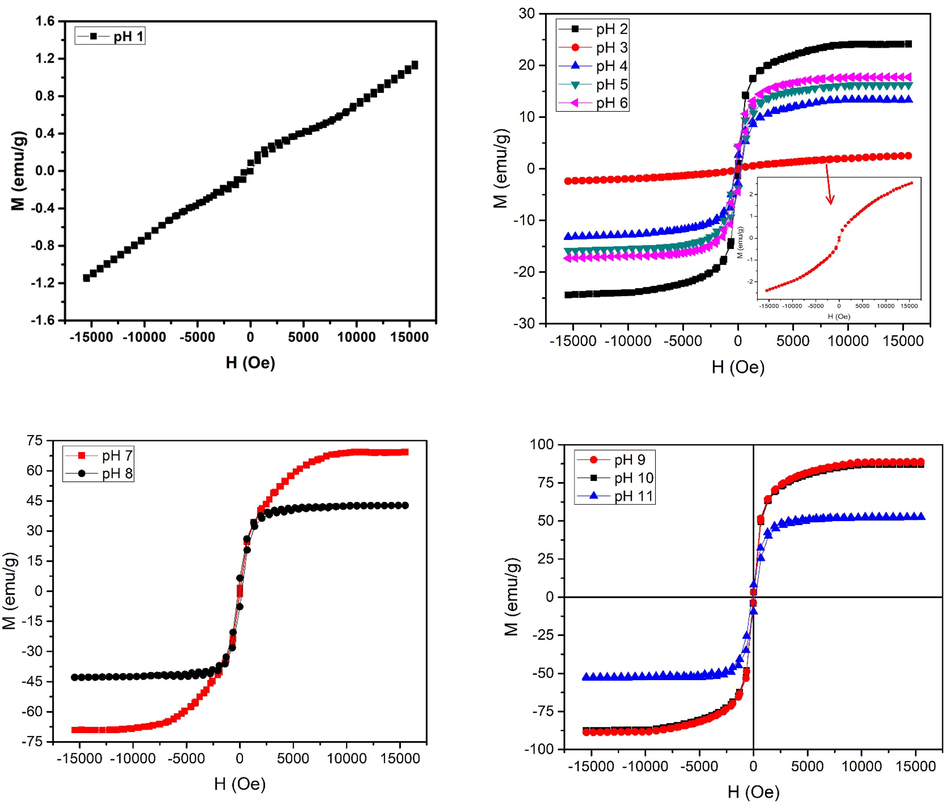
M−H loops of iron oxide synthesized with different pH values.
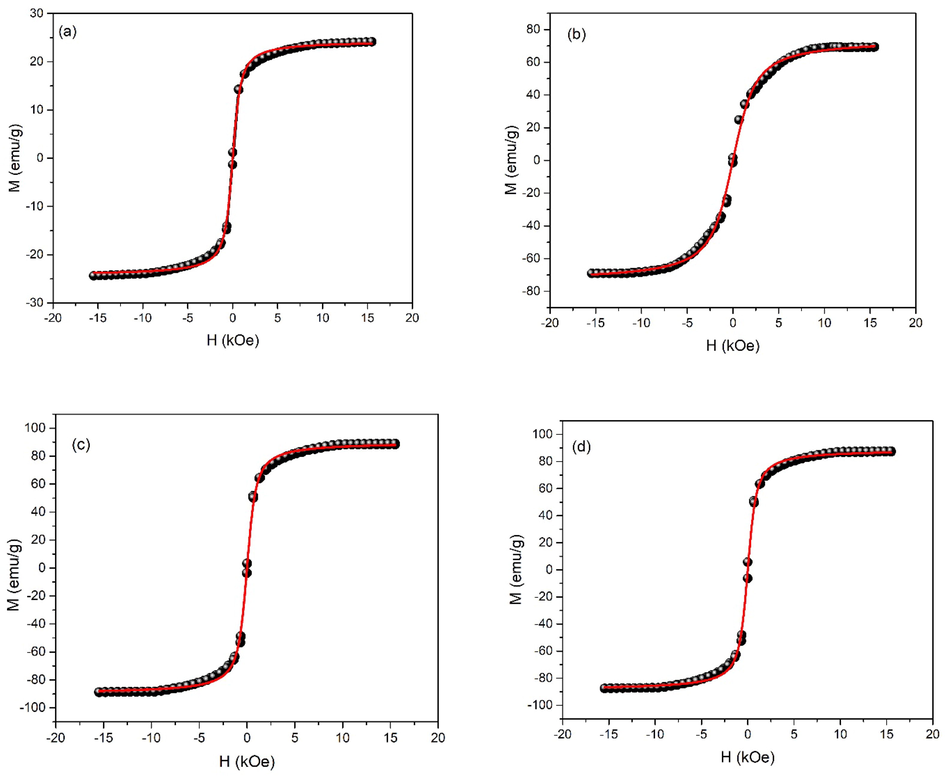
Langevin function fit to M−H plots of the samples prepared with pH a) 2, (b) 7, (c) 9 and d) 10.
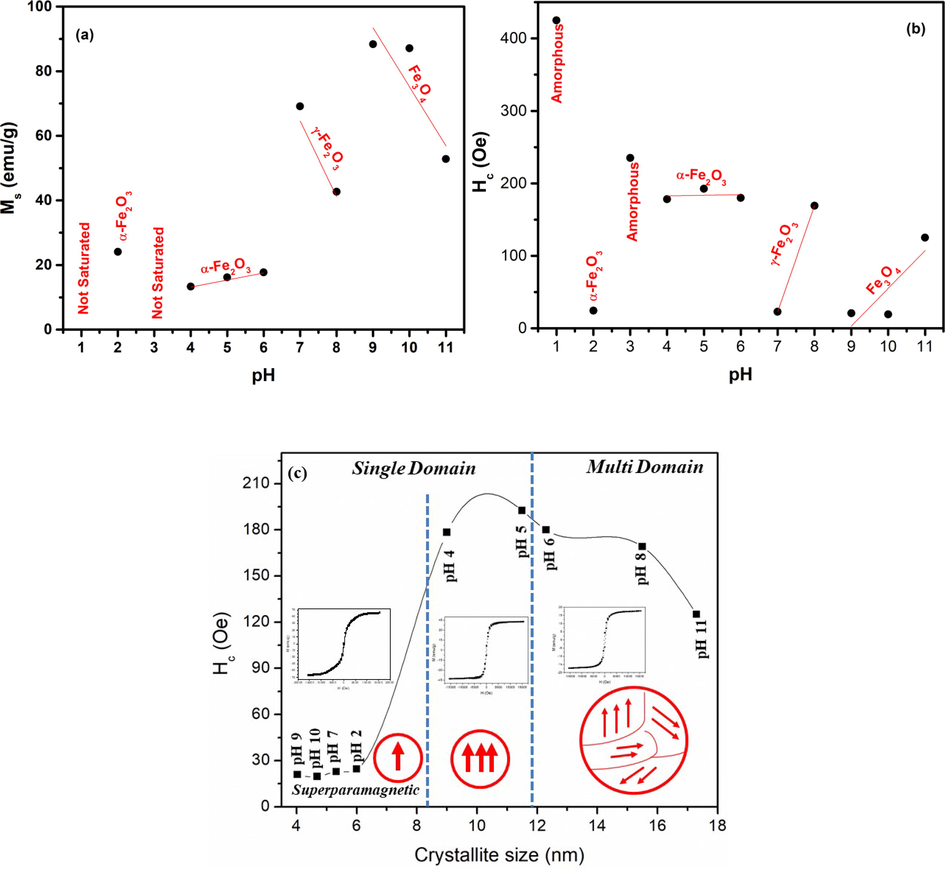
(a) Saturation magnetization, (b) coercivity plotted for changes in pH, (c) Coercivity plotted for changes in crystallite representing different domain regions.
The variation of saturation magnetization (Ms) and coercivity (Hc) as a function of pH is shown in Fig. 7 (a & b). No saturation in magnetization was observed at pH 1. While Ms of 24.1 emu/g with value of coercivity<20Oe is observed at pH 2. Restructuring of iron oxide phase at pH 3 (as observed in Fig. 2) leads to un-saturated M−H plot. For pH 4–6, an increase in Ms from 13.3 to 17.3 emu/g was observed because of the increased crystallite size (Fig. 3). As pH of the sol was increased to neutral level, i.e. 7, not only an increase in Ms to 69.1 emu/g was observed but conversion to superparamagnetic behavior was also observed. High values of Ms, i.e. 88.3 and 87.1 emu/g are observed at pH 9 and pH 10. As the diameter of nanoparticles is reduced beyond a certain limit the particles behave as single domain particles as depicted in Fig. 7(c). Fig. 7(c) shows coercivity plotted for changes in crystallite representing different domain regions. The high magnetization in these particles can be understood by considering double sphere model where the inner sphere acts like bulk because of the bound atoms and the outer sphere acts like nanomaterials where dangling bonds dictate the properties.The outer sphere comprises of uncompensated spins present at the surface and these uncompensated spins interact ferromagnetically. The magnetization associated with these surface spins can arbitrarily change their direction under thermal fluctuations exhibiting larger magnetization under the applied magnetic field. As these surface spins are surrounded by ferromagnetic surface spins of other nanoparticles so the magnetic constrictions on the orientation are not strong. Dominant spin contributions of surface atoms can be considered when particles/crystallite size is reduced to a certain value (Manukyan et al., 2014). A comparison of magnetization of various iron oxide phases prepared in this work with literature is given in Table 1. Table 1 shows that Ms of present work is higher as compared to various literature values.
pH
Magnetic behavior
Phase
Ms (emu/g)
Literature
Method
Phase
Calcination /annealing temperature
Magnetic behavior
Ms (emu/g)
1
Weak FM
----
Unsaturated
Template assisted combustion method (Manukyan et al., 2014)
α-Fe2O3
1000 K
SPM
21
2
SPM
α-Fe2O3
24.1
Hydrothermal (Ghosh et al., 2020)
Fe3O4
---
SFM
81.5
3
Weak FM
----
Unsaturated
Hydrothermal method (Cursaru et al., 2020)
α-Fe2O3
+Fe3O4
---
Weak FM
30
4
FM
α-Fe2O3
13.3
Sol-gel (Zeb et al., 2017)
γ-Fe2O3
250˚C
SPM
80
5
16.2
Carbon templatedSolution combustion
(Ianoș et al., 2018)γ-Fe2O3
----
Near SPM
26.2
Co-precipitation pyrolsis (Mirza et al., 2015)
γ-Fe2O3
275 ˚C
Ferri-Mag
50.4
6
17.7
Hydrothermal (Lei et al., 2017)
Fe3O4
---
FM
87.48
7
SPM
γ-Fe2O3
69.1
8
FM
42.6
Precipitation method (Lassoued et al., 2018)
α-Fe2O3
700˚C
FM
6.42
9
SPM
Fe3O4
88.3
10
SPM
87.1
Hydrothermal method (Trpkov et al., 2018)
α-Fe2O3
---
Weak FM
0.592
11
FM
52.8
For polycrystalline materials, magnetocrystalline anisotropy is an important physiognomy for the material to be considered for magnetic applications. Magnetocrystalline anisotropy (Keff) is the phenomenon where the magnetic anisotropy energy, i.e. the internal energy of the system, changes with changes in direction of magnetization. This energy is strongly dependent on crystal system of the specimen (Suganuma, 2018). Saturated M−H loops of Fig. 5 were used to find out the magnetocrystalline anisotropy. Fig. 5 shows that change in magnetization at higher field strengths (>10000Oe) is very small. “Law of Approach to Saturation Magnetization” (Eq. (11)) (Cullity and Graham, 2011; Ziese and Thornton, 2007) represents the connection between applied field and magnetization at high field strengths. In Eq. (13) forced magnetization (χH) is insignificant below Curie temperature. “a” and “b” are the constants demonstrating the impact of microstress and magnetocrystalline anisotropy to magnetization, respectively.
Constant “b” is crystalline structure dependent and for cubic (magnetite and maghemite) and hexagonal (hematite) crystal systems the relation between “b” and magnetocrystalline anisotropy (Keff) is represented by Eqs. (14) and (15) (Ziese and Thornton, 2007), respectively.
Slope of magnetization vs 1/H2 gives values of “b” and Keff can be found using Eqs. (14) and (15). Values of Ms are found using extrapolation of magnetization vs 1/H2 curves when (1/H2 → 0) as seen in Fig. 8. Moreover, straight line curves (Fig. 8) shows that microstress part can be disregarded. Fig. 9(a) shows plot of Keff with variation in pH for the magnetically saturated samples. Vital cause for origination of Keff is due to spin–orbit coupling in crystal lattice (Kumar and Kar, 2014). Fig. 9(b) shows coercivity plotted for changes in domain size representing different domain regions.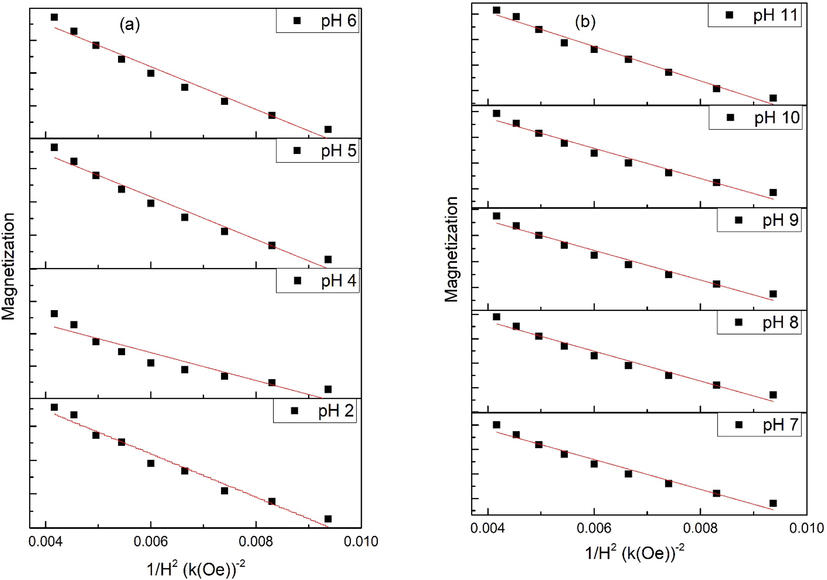
Law of approach to saturation applied to various samples of iron oxide.
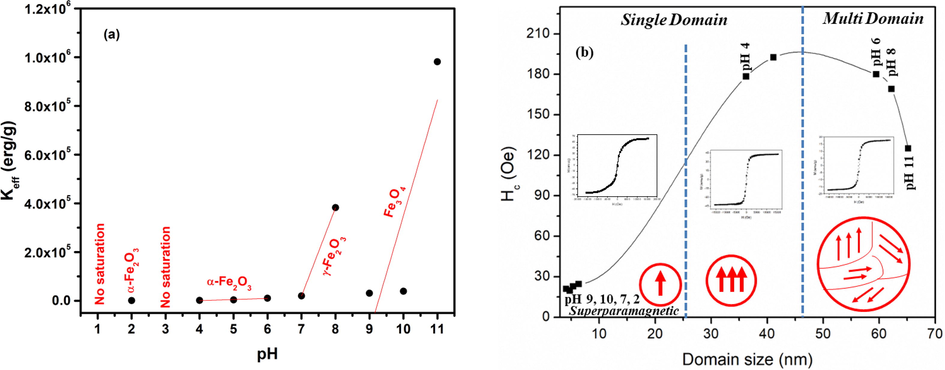
(a) Magnetocrystalline anisotropy plotted for variation in pH and (b) Coercivity plotted for changes in domain size representing different domain regions.
Iron oxide nanoparticles have many applications in biomedical field including MRI (magnetic resonance imaging) (Dadfar et al., 2020), bio sensing (Lee et al., 2020), drug delivery and bio-imaging (Mirza et al., 2020) and many more (Wahajuddin, 2012; Bakhtiary et al., 2016). Origin of superparamagnetism is size reduction of magnetic materials to single domain. Superparamagnetic nanoparticles become magnetized on the application of magnetic field but don’t hold any magnetization when externally applied magnetic field is removed. So, we can switch their magnetization, i.e. ON or OFF (Wahajuddin, 2012; Bakhtiary et al., 2016). For biomedical applications, it is required that superparamagnetic nanoparticles must have ultra-small dimensions and high saturation magnetization. These nanoparticles can be bound to drugs and an externally applied magnetic field can provide them to detect the tumor or towards any organ to be treated (Laurent et al., 2008). In absence of magnetic field, these nanoparticles do not agglomerate as a result of absence of coercivity and remnant magnetization. Thus, may lead to the reduced probability of blood vessels and capillaries’ blockage.
3.4 Dielectric and impedance analysis
3.4.1 Dielectric constant
Dielectric properties play important role in short ranged electrical conduction of material. Dipoles can be created as a result of piling of charged carriers under the effect of applied electric field. Dielectric constant (
) for a specimen with area A and thickness d for an applied field with frequency f is presented in Eq. (16) (Macdonald and Barsoukov, 2005).
Plots for dielectric constant with changes in frequency are presented in Figs. 10 and 11. It is observed that dielectric constant for pH 2–11 exhibits dispersion that is dominant at low frequencies and this dielectric dispersion decreases as electric field frequency increases. Such trends of dielectric constant are explained by “Maxwell Wagner Theory”. This theory states that there are dipoles present in the dielectric medium. Some time is required by these dipoles to align in a certain direction when field is applied. At lower frequencies the dipoles get enough time for their alignment in field direction. At higher frequencies because of high field reversal rate the dipoles are not able to align according to field direction resulting in reduced polarization. Moreover, a dielectric material comprises of grains & grain boundaries. Grains possess conduction in contrast with grain boundaries. Grains play an active role at higher frequency and grain boundaries play their role at lower frequency. So, because of active part of grain & grain boundaries with different conductivities at different frequencies, normal dispersion behavior is observed (Imran et al., 2018; Sanaullah et al., 2020). Despite the normal dispersion behavior for pH 2–11, at pH 1 it was observed that value of dielectric constant again increases at high frequency (log f > 6.5). Normally at very high frequencies, electron hopping probability between lattice ions lag the applied electric field frequency and hereafter decrease in dielectric value is common in this regime of frequency. However, the anomalous dielectric response observed at pH 1 indicates that at high frequencies, electronic polarization and electron hopping between different sites increases that gives rise to increase in dielectric values. Moreover, inherent defects in nanomaterials like vacancies and interfaces tend to trap charged particles which in turn are released at higher frequencies, increasing the dielectric values (Shah et al., 2018; Khan et al., 2020). Transitions of dielectric constant with changes in pH show that relatively low values of dielectric constant 73.83 and 54.5 (log f = 5.0) are observed for pH 1 and 3, respectively. This relatively low dielectric constant is due to amorphous behavior (Fig. 2). Based on the analysis carried out by Saravanan et al. (Saravanan et al., 2009) amorphous nature of the materials gives rise to low polarizing ability as compared to that of the polycrystalline materials. Superparamagnetic hematite nanoparticles synthesized at pH 2 depicted dielectric constant of 99.49 (log f = 5.0). Dielectric constant of ferromagnetic hematite nanoparticles at pH 4–6 increases from ∼ 71 to 97 (log f = 5.0). Dielectric constant of 109.87 and 80.48 at log f = 5.0 was observed for maghemite synthesized with pH 7 and pH 8 , respectively. Moreover, for magnetite phase at pH 9 increase in dielectric constant to 154.12 (log f = 5.0) was observed that decreased to 96.81 (log f = 5.0) at pH 11. Despite the resemblance in crystal structure of magnetite and maghemite, magnetite nanoparticles offer high polarization capabilities because of the presence of Fe2+ ions (Ziese and Thornton, 2007; Cuenca et al., 2016). In addition, it can be observed from Fig. 10 that comparatively high dielectric constants are observed for superparamagnetic nanoparticles of hematite (pH 2), maghemite (pH 7) and magnetite (pH 9, 10). As size of nanoparticles is reduced to superparamagnetic regime, grain boundaries effect increases which is the reason for relatively high dielectric values. This effect will be discussed in detail later. Comparison of dielectric constant for various iron oxide phases obtained with changes in pH under as-synthesized conditions with literature are tabulated in Table 2.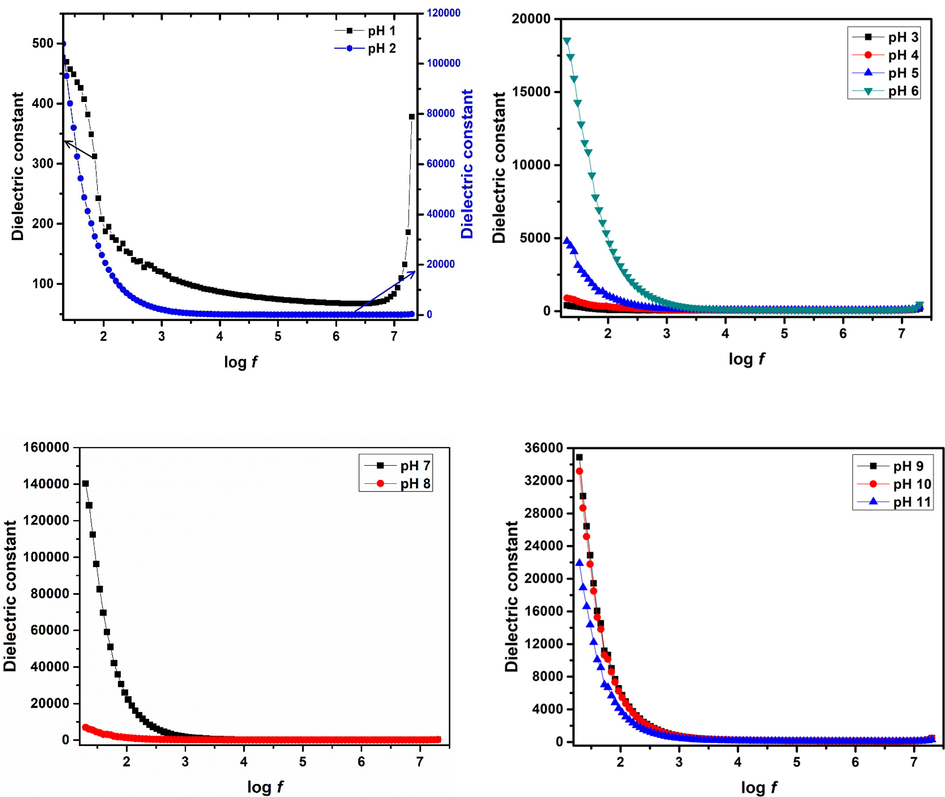
Dielectric constant for various iron oxide phases plotted for changes in log f.
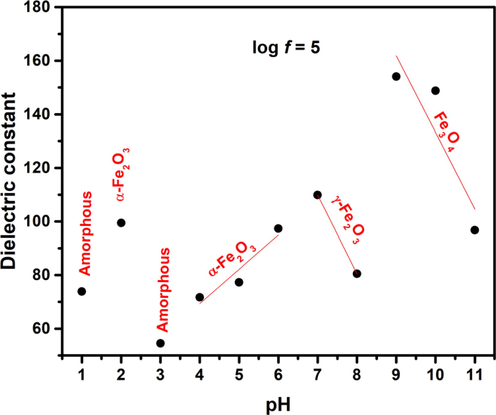
Dielectric constant plotted for changes in pH of nanoparticles.
pH
Phase
Dielectric constant
Literature
log f
Method
Phase
Dielectric constant
3.0
4.0
5.0
6.0
1
----
119.70
87.5
73.83
68.1
Co-precipitation method (Kumar et al., 2018)
Fe3O4
61.94
2
α-Fe2O3
2173.6
257.4
99.49
78.3
Co-precipitation method (Azab and El-Menyawy, 2019)
Fe3O4
∼70
Co doped Fe3O4
∼140
3
----
62.1
57.1
54.51
53.5
Sol-gel (Kumar et al., 2019)
α-Fe2O3
45.02 at f = 100 kHz at (T = 380 K)
10 % Zn doped α-Fe2O3
48.42 at f = 100 kHz at (T = 380 K)
4
α-Fe2O3
115.7
84.5
71.7
66.5
Sol-gel (Kumar et al., 2018)
α-Fe2O3
66.9 at f = 0.1 MHz (T = 100 K)
5
164.6
85.4
77.28
75.2
Co-precipitation (Manikandan et al., 2020)
Fe2O3
∼230
Nd doped Fe2O3
∼130
6
555.2
128.2
97.40
93.3
Wet ChemicalRoute
(Ali et al., 2015)γ-Fe2O3
∼50 at log f = 3.0
7
γ-Fe2O3
1817.7
268.8
109.8
87.1
8
188.5
97.9
80.48
69.4
Combustion method (Hiremath and Venkataraman, 2003)
γ-Fe2O3
25–30 at f = 10 kHz
9
Fe3O4
748.8
243.3
154.1
128.4
10
712.6
231.6
148.7
124.0
Co-precipitation pyrolysis (Mirza et al., 2015)
γ-Fe2O3
∼28 at f = 4x10⁵ Hz
11
470.3
152.8
96.81
80.7
3.4.2 Tangent loss
Tangent loss for various iron oxide phases is obtained using Eq. (17) (Macdonald and Barsoukov, 2005) and can be seen in Fig. 12.
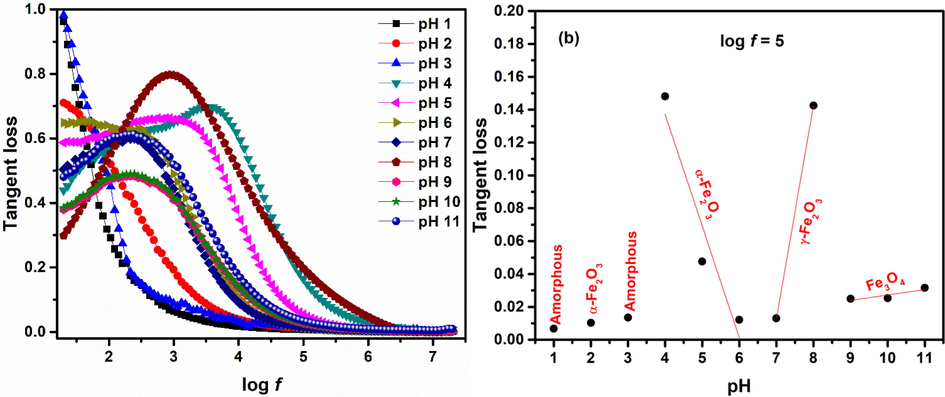
Tangent loss for various iron oxide phases with changes in (a) log f (c) pH.
where ρ is resistivity.
The two main loss mechanisms in dielectric material include: 1) Resistive loss: At low frequencies dipoles have high enough energy to align according to the direction of applied field resulting in high losses. According to resistive loss mechanism space charges that are mobile in the dielectric medium require energy and the limiting factor for mobility of these charge carriers is the skin effect which is high in high frequency region. At higher fields the electron exchange between different ions is not synchronized and charges follow the field flow in almost parallel manner minimizing the losses. This trend is followed by nanoparticles prepared using pH 1–3. 2) Relaxation losses: This type of losses in dielectric material arise when natural frequency of jumping electrons between different sites become equal to applied field (Yousuf et al., 2019; Manohar et al., 2019). This results in resonance phenomena where the ions oscillate with maximum energy resulting in relaxation peak (maximum tangent loss) at a particular frequency as observed for nanoparticles synthesized with pH 4–11. The relaxation time is given by ωτ = 1 (Macdonald and Barsoukov, 2005) and is listed in Table 3.
pH
Relaxation frequency fmax (kHz)
Relaxation time τ (μsec)
1
---
---
2
---
---
3
---
---
4
4.073803
39.05551
5
1.071519
148.4849
6
0.30903
514.8519
7
0.20893
761.5217
8
0.870964
182.6763
9
0.20893
761.5217
10
0.229087
694.516
11
0.245471
648.1601
3.4.3 Conductivity
Conductivity of iron oxide phases was calculated using Eq. (18) (Macdonald and Barsoukov, 2005) and is plotted in Fig. 13. Conductivity spectrum in Fig. 13 (a) is divided into two parts. First part is where conductivity shows constant trend. This part is frequency independent and represents the dc like conductivity. Second part is frequency dependent part that shows dispersion and contributes towards ac conductivity of iron oxide nanoparticles. A general observation is that conductivity of charge carriers increases slowly by increase in frequency of applied field due to increased migration of electrons with increasing frequency (Khan et al., 2020; Yousuf et al., 2019; Manohar et al., 2019). Ac conductivity in iron oxide nanoparticles depends upon hopping of Fe2+ and Fe3+ ions. Changes in conductivity of iron oxide nanoparticles is consistent with changes in dielectric properties (Fig. 11) and also with changes in phases observed in Fig. 2.
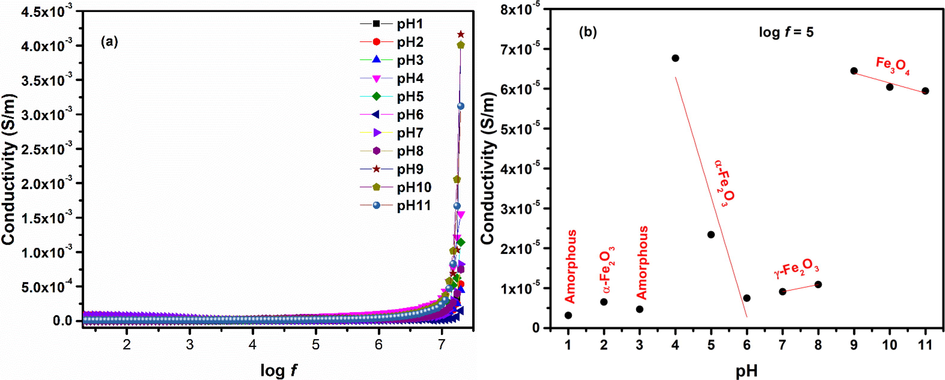
Conductivity of iron oxide phases plotted for changes in (a) log f (b) pH.
3.4.4 Complex impedance
Complex impedance (Z*) was calculated using Eq. (19) (Macdonald and Barsoukov, 2005; Imran et al., 2018), whereas, real (Z') and imaginary (Z'') impedances were calculated using Eqs. (20) and (21) (Macdonald and Barsoukov, 2005; Imran et al., 2018).
Fig. 14 (a, b) shows formation of two frequency dependent regions in real and imaginary impedance. Low frequency region shows a slight decrease in Z', whereas, high frequency region shows monotonic decrease in Z' that becomes constant at relatively higher frequency values. This result is in agreement with the conductivity response presented in Fig. 13(a) that showed increased conductivity values at high frequencies (Ali et al., 2018; Panda et al., 2014; Basha et al., 2022). Various relaxation peaks were observed in Z'' as shown in Fig. 14(b). These relaxation peaks provide significant information about the grains and interface effects in polycrystalline materials (Ali et al., 2018; Panda et al., 2014). For pH 1 and 3 the relaxation peaks occur in low frequency region, and both have amorphous nature and are weak ferromagnetic in nature. Relaxation peaks of various samples were observed at different frequency values. These peaks describe the effect of grains and grain boundaries. Detailed effect of grains and grain boundaries was evaluated using Cole-Cole plots (Fig. 14(c)). Cole-Cole plots, plotted between Z' and Z'', usually shows three semicircles, i.e. (i) high frequency semi-circle, (ii) mid frequency semi-circle and (iii) low frequency semi-circle. These three semi-circles show the effect of resistances coming from grain, grain boundaries and their interface (Macdonald and Barsoukov, 2005; Khan et al., 2020). Fig. 14 (c) shows formation of single semicircle as a result of very high grain boundary resistance as compared to grains. Zview fitting of these Cole-Cole plots was done with different electrical components to obtain the effect of grain and grain boundaries. The best-fit results were obtained using three elements-based circuit i.e. a low resistance to represent grains attached in series with parallel group of a high resistance and a capacitor to represent grain boundaries. Results of the fitting are summarized in Table 4. Comparison of Table 4, Fig. 11 and Fig. 13 (b) shows that conductivity of iron oxide nanoparticles is affected by variations in grain boundary resistance.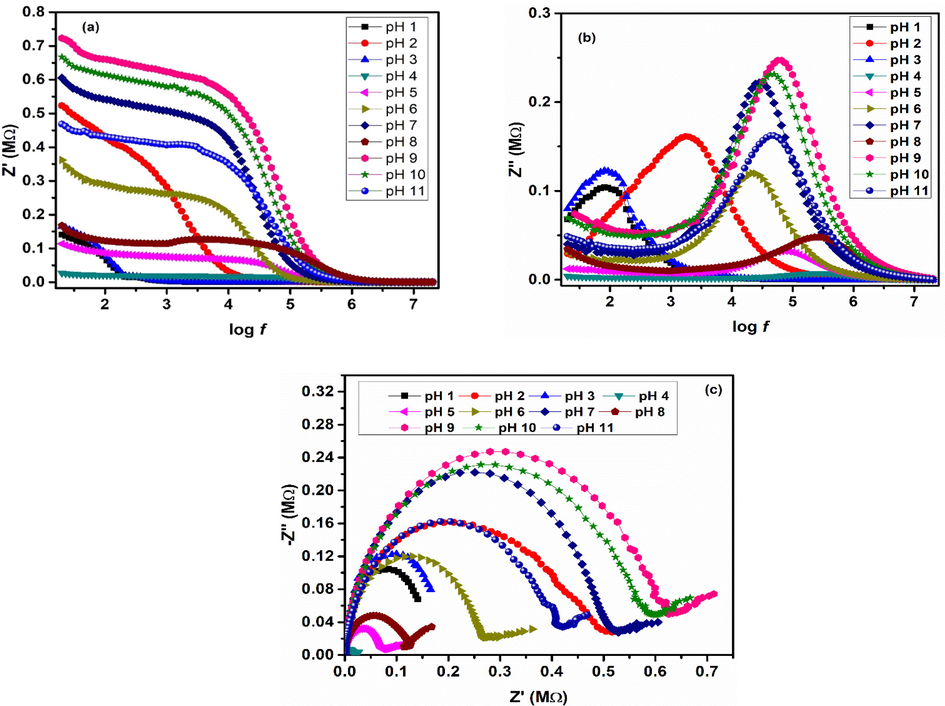
(a) Real impedance (b) imaginary impedance for various iron oxide phases.
pH
Grain resistance (Ω)
Grain boundary resistance (MΩ)
Grain boundary Capacitance (pF)
Relaxation frequency (kHz)
Relaxation time (μsec)
1
31.33
0.14
13924.93
0.081
1958.03
2
18.99
0.52
169.04
1.79
88.47
3
25.03
0.17
12682.72
0.075
2098.07
4
21.83
0.027
21.09
281.84
0.56
5
28.73
0.11
16.45
85.11
1.87
6
31.42
0.36
19.64
22.38
7.11
7
42.61
0.60
9.12
28.84
5.52
8
114.69
0.16
3.36
281.83
0.56
9
150.74
0.71
3.79
58.88
2.70
10
160.43
0.66
5.09
46.77
3.40
11
273.49
0.47
8.15
41.68
3.81
3.4.5 Complex modulus
Complex modulus spectroscopy is used to consider and discuss the relaxation mechanisms (Thakur et al., 2015; Behera et al., 2008). Modulus is represented using Eqs. 22–25 (Imran et al., 2018).
Where,
Fig. 15 (a, b) presents plots for real (M') and imaginary (M'') moduli. M' (Fig. 15(a)) exhibits minimum values for all pH at log f < 3.5. However, with increase in frequency (log f > 3.5) M' increases asymptotically attaining a maximum value. This change in behavior is associated with short range mobility of space charge carriers. M'' (Fig. 15(b)) shows relaxation peak at a particular frequency. Below this relaxation peak charge carriers exhibit long-range motion whereas, above this confinement of charge carriers to potential wells takes place. Thus, presence of relaxation peak in M'' exhibits transition from long range to short range mobility of space charge carriers. Therefore, in such type of materials the conduction mechanism is associated with hopping process (Sahu and Behera, 2018). Impedance information was also plotted using modulus formalism. Complex impedance plots in Fig. 14(c) are useful for evaluate the effect of high resistances, whereas plots of complex modulus (Fig. 15(c)) present the capacitances nature of the material.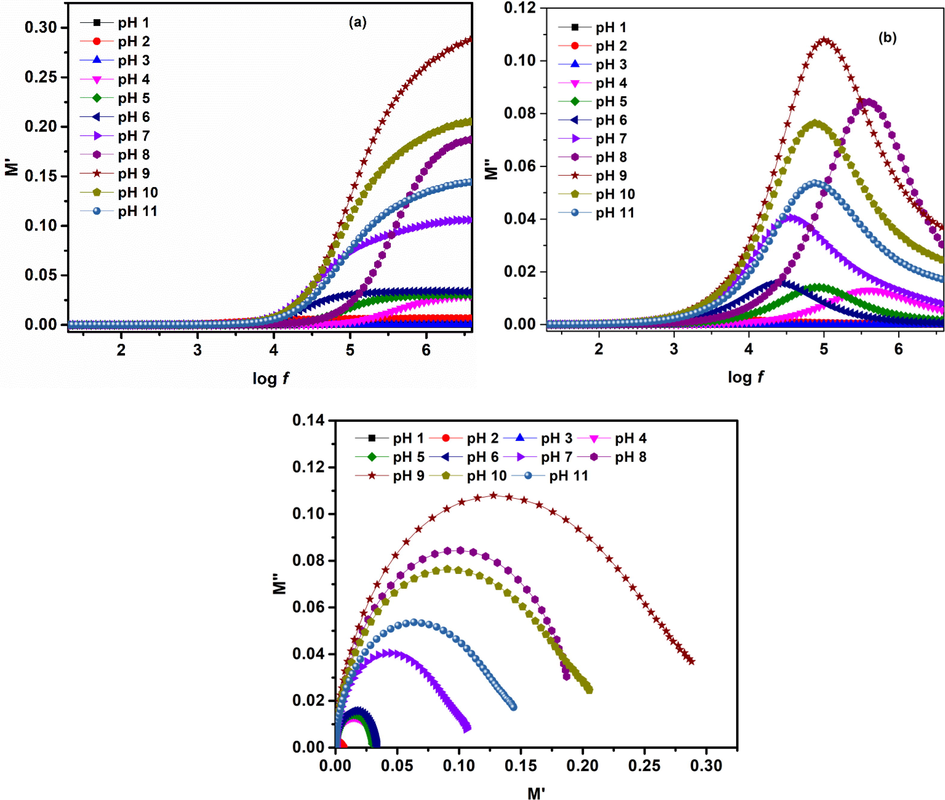
(a) Real and (b) imaginary part of Modulus as function of frequency (c) complex modulus plots for iron oxide phases at various pH values.
3.5 Antioxidant activity
Various metabolic progressions and stresses propagate in humans due to body environment, and in return various reactive species are generated. Reactive oxygen species, i.e. ROS, are one of the main free radicals. Increase in the reactive oxygen species may lead to destruction in the structure of biomolecules that leads to the cell death. Further, the destruction in the biomolecules can lead to increased oxidative stress and can be a cause of various health diseases including cardiovascular disease, cancer, etc. (Grune et al., 2001; Noguchi and Niki, 2000). Antioxidant properties have gained so much attention due to their vital role in inhibition of harmful effects of reactive oxidative stress. For the verification of capability of as synthesized iron oxide nanoparticles against ROS level, DPPH (2, 2-diphenyl-1-picrylhydrazyl) radical scavenging method was utilized. Variety of samples with concentration of 250 μg/mL were prepared in the laboratory while optimized sample (i.e. iron oxide synthesized using pH 9) was used to prepare concentrations such as 50, 100, 150, 200, 250 μg/mL (Fig. 16). Sample prepared with pH 9 was preferred because of the superparamagnetic nature and high saturation magnetization. For the preparation of 1 mM stock solution of DPPH, methanol was used as solvent. Working solutions, with different concentrations, were incubated under dark conditions at 37 °C temperature (French et al., 1994; Batool et al., 2020). De-colorization (as shown in inset of Fig. 16 (b)) of DPPH was observed from intense purple color that indicates the strong antioxidant activity of prepared samples. To measure the absorbance of the prepared samples, UV–visible spectrophotometer was used. Decrease in value of absorbance was observed which indicates that scavenging activity of the prepared samples is increased. For comparison of ROS percentage inhibition values (ROS %), ascorbic acid (+ive control) was used. ROS % of prepared samples were obtained by using DPPH assay according to Eq. (26).
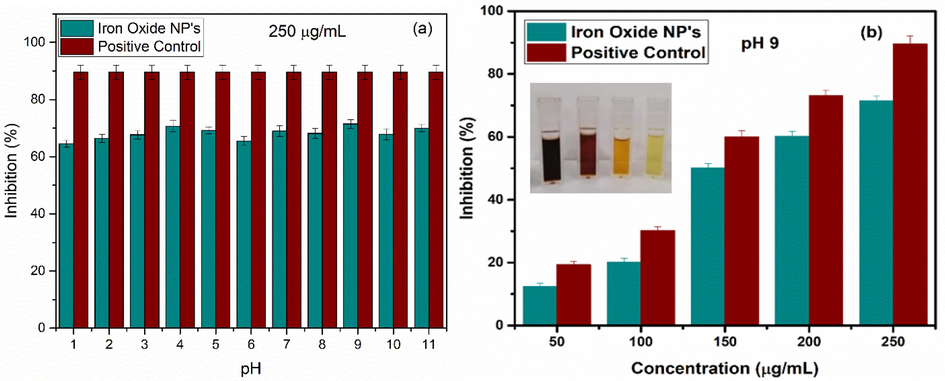
(a) Comparison study of antioxidant activity between iron oxide nanoparticles at various pH and positive control at 250 μg/mL (b) Comparison study of antioxidant activity between iron oxide at pH 9 and positive control at various concentrations; inset showing de-colorization of DPPH. Values represent the mean ± SD for n = 3, and data were analyzed with one-way and two-way ANOVA at a significance level of 0.05. Obtained value for significant figure is<0.05 (p < 0.05), obtained results are significantly different.
In Eq. (26), Ao is used for absorbance value of DPPH while Ac denotes absorbance value of prepared samples. In Fig. 16, comparison of antioxidant activity between iron oxide at various pH with positive control at 250 μg/mL and comparison of antioxidant activity between iron oxide at pH 9 with positive control at various concentrations, respectively, are shown. Maximum antioxidants scavenge value at pH 9 was found to be ∼ 72 %.
3.6 Hemolysis activity
Hemolysis activity describes the denaturation of blood cells by physiochemical interaction of the cell with nanoparticles. The hemolytic response of optimized iron oxide sample was used to determine the destruction rate of membrane of red blood cells (RBC) which can lead towards the hemoglobin release into the plasma. Fresh human blood samples of a healthy volunteer without any specific pathologies were preserved in Vacutainer tubes coated with EDTA so that coagulation could be prevented. Further, the tubes containing blood samples were centrifuged at 2000 rpm for 20 min. After centrifuging, two distinct regions were observed, i.e. upper yellowish region containing plasma and lower layer of hematocrit RBC. Plasma was discarded according to safety rules and RBC was further washed three to four times with phosphate buffer saline (PBS) with pH 7.4 and again centrifuge was performed. Afterwards washed RBC were re-suspended with 20 mL of PBS (to fill original level of plasma) to get PBS treated RBS as a –ive control (Rajapriya et al., 2020). RBC were treated with equal volume of optimized nanoparticles at various concentrations, i.e. 25 μg/mL to 125 μg/mL (with interval of 25 μg/mL). Then incubation at room temperature (25 °C) for time interval of 30 min was done. The + ive control, using doxorubicin (10 mg) into the PBS treated RBC, was prepared and incubated for 30 min at room temperature; samples were then centrifuged at 5000 rpm for 15 min. Absorbance readings were checked for all the final products. Hemolysis (% lysis) was examined by considering the recorded absorbance values according to Eq. (27) (Singh et al., 2020; Kirienko et al., 2019).
Here As, A0, A+ represent absorbance of RBC treated with nanoparticles, absorbance of –ive control and + ive control, respectively.
Obtained results (Fig. 17) shows that all nanoparticles showed hemolysis activity in a concentration dependent manner. With increased concentration of nanoparticles, i.e. 125 μg/mL maximum of hemolysis was observed and found to be ∼ 5.9 %. While for lower concentrations, <5 % of hemolysis was observed, as reported previously, that is safe to be used (Vinotha et al., 2019; Abinaya et al., 2018). Lower concentrations of nanoparticles were found to be harmless and biocompatible according to percentage of hemolysis activity. Optimized sample (pH 9) was further used for hemolytic activity with variation in concentration at different time intervals (Fig. 17(c)). Low hemolytic activity was observed under all varied concentration conditions for the samples synthesized using pH 9. Thus, optimized samples can be good to be used as anticancer agent.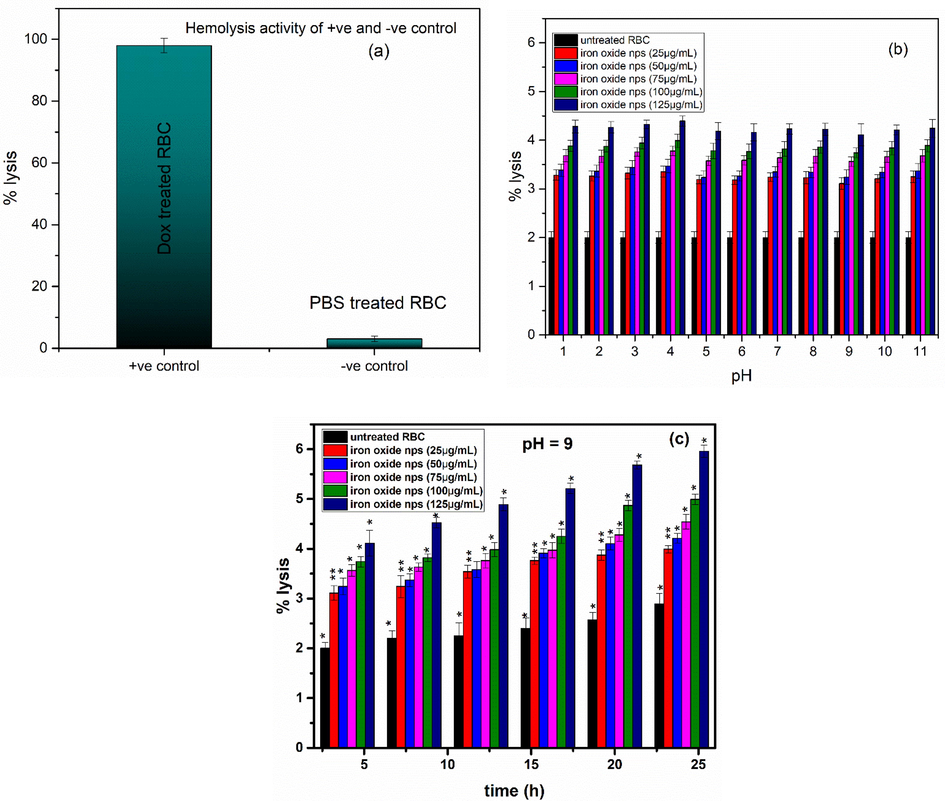
Hemolysis activity of (a) positive and negative control, (b) untreated RBC and samples at different pH at various concentrations (c) untreated RBC and iron oxide NPs at pH 9 at various concentrations. Thus, optimized samples can be good to be used as anticancer agent. Values represent the mean ± SD of three replicates, and data were analyzed with one-way and two-way ANOVA at a significance level of 0.05. For figure (a), significance figure is p > 0.05 i.e. results are not significant, for figure (b), significance value is p << 0.005), therefore, we reject the null hypothesis and accept the alternative hypothesis that not all the population means are equal. For figure (c) values with dissimilar superscript are highly significantly different (**P < 0.005). Values with the same superscript letter are significantly different (*P < 0.05).
3.7 Dispersion in simulated body fluid
The colloidal stability and biodegradability of optimized sample were investigated using simulated body fluid (SBF). Compressed discs of nanoparticles were immersed in SBF over 1, 2, 4, 8, 13, 20, and 26 weeks. Before the experiment, the compacted disk's area (mm2), diameter (mm), and thickness (mm) were determined. The biodegradability of the optimized sample was investigated. Eq. (28) was used to calculate the volume of simulated body fluid (Ochsner and Altenbach, 2013).
Where vs denotes the volume of SBF (mL) and Sa denotes the disk's surface area (mm2). Samples were dipped into the SBF before being heated at 36 °C, i.e. normal human temperature. After dipping for the appropriate amount of time, samples were removed and cleaned with de-ionized (DI) water. After washing, the samples were placed in a desiccator to dry without being heated. Eq. (29) was used to determine the possible weight reduction (%) (Ochsner and Altenbach, 2013).
Where w1 represents the weight of the disc before soaking and w2 represents the weight of the disc after soaking. Fig. 18 depicts the weight decrease values.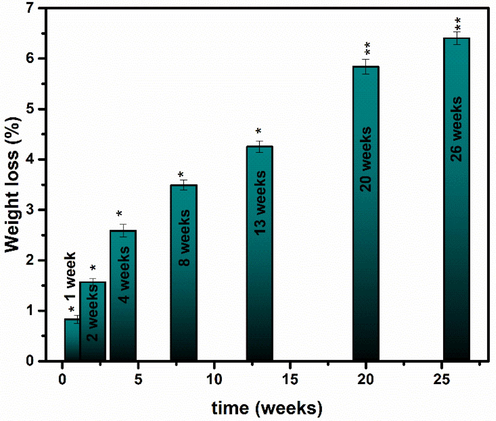
Biodegradation test for optimized sample of iron oxide. Values represent the mean ± SD for n = 3, and data were analyzed with one-way and two-way ANOVA at a significance level of 0.05. Different symbols per column indicate significant difference among treatments. Values with dissimilar superscript are significantly different (*P < 0.05). Values with the same superscript letter are not significantly different (**P > 0.05).
3.8 Drug efficacy
Curcumin, naturally existing drug, has demonstrated potential anticancer activity in numerous models which can be further utilized in cancer therapy (Aggarwal et al., 2003; Mukerjee and Vishwanatha, 2009). An ethanol solution of curcumin was prepared to examine the drug (curcumin) loading efficiency of iron oxide nanoparticles. The encapsulation efficacy of iron oxide nanoparticles revealed that optimized nanoparticles were quickly absorbed in the first half hour, followed by progressive encapsulation (Fig. 19). The encapsulation efficacy was judged to be ∼ 83 % after a 120-minute period. The interaction of positively charged hydrogen ions (found in curcumin) with negatively charged iron and oxygen ions might explain the rapid encapsulation (present in the as synthesized nanoparticles).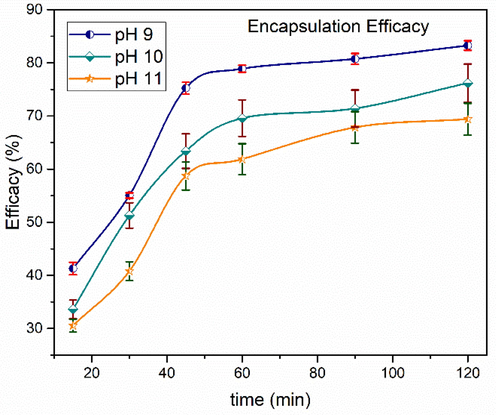
Time dependent drug encapsulation efficiency of as synthesized nanoparticles. values represent the mean ± SD for n = 3, and data were analyzed with one-way and two-way ANOVA at a significance level of 0.05. Significance value is p < 0.05, which shows that obtained results are significantly different.
To figure out the solubility of curcumin loaded nanoparticles, 0.01 M PBS solution was used. It was observed that curcumin loaded iron oxide nanoparticles dissolved well in aqueous medium. While bare curcumin was poorly dissolved in PBS with undissolved flakes of curcumin compounds visible in the solution. As one of the major problems of anticancer drug delivery vehicles is biodegradation and instability in physiological pH (Das et al., 2009; Shaikh et al., 2009). To compare the biodegradation and instability of bare curcumin with our nanoparticles, incubation with PBS solution was performed and HPLC method was utilized to estimate their concentration at various time intervals. From Fig. 20, it is observed that bare curcumin rapidly degrades itself under wet conditions i.e. ∼ 6 % of bare curcumin remained undamaged after incubation for time interval of 6 h. Whereas, under same conditions, drug loaded nanoparticles remained stable i.e. ∼ 87 %. It is to be noted that iron oxide nanoparticles prepared using pH 9 were helpful to increase the stability as well as solubility of curcumin in PBS by providing protection against biotransformation as well as hydrolysis.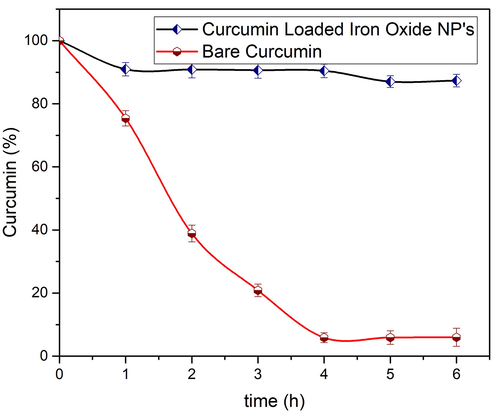
. Stability of bare and nanoparticles loaded curcumin in 0.01 M PBS solution after incubation at 37 °C. Values represent the mean ± SD for n = 3, and data were analyzed with one-way and two-way ANOVA at a significance level of 0.05. For Bare Curcumin, significant value is p < 0.005 i.e. results are highly significant, for Loaded NP’s p value is p < 0.05 showing that results are significantly different.
3.9 MTT assay
To assess the viability of optimized samples, the MTT test was employed. Fig. 21 indicates that customized nanoparticles have a proclivity to decrease the cell viability (%) of cancer cell lines (HCT-116). As the concentration of optimized sample (i.e. synthesized at pH 9) of as synthesized nanoparticles was increased, the percentage of cell viability dropped progressively. The concentration of exposed nanoparticles in this study varied from 5 to 25 μg/mL, with a 5 μg/mL difference. The results show that raising the concentration resulted in a reduction in cell viability. Malignant cells showed around 17.3 % viability after 24 h of treatment with nanoparticles at a dose of 25 μg/mL. This decrease can be ascribed to the nanoparticle's smaller crystallite size, which is important in determining the amount of toxicity for exposed cells (Golestanzadeh et al., 2017). The cell viability (Fig. 21) indicates that the iron oxide NPs produced by this method are hazardous to HCT-116 cell lines. It should be mentioned that iron oxide nanoparticles are highly hazardous to cancer cell lines and have the potential to be used in the creation of anticancer drugs. The findings imply that cell death is triggered by a loss of membrane integrity in the cell lines.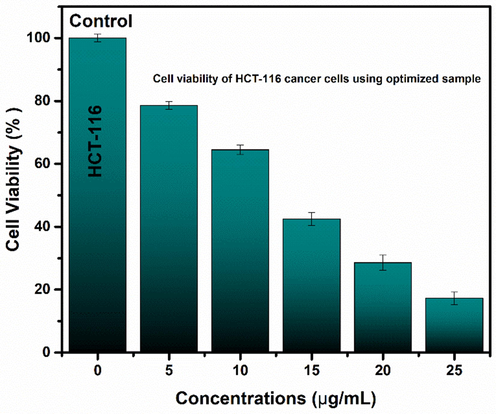
Cell viability capability of iron oxide nanoparticles using various concentrations. Values represent the mean ± SD for n = 3, and data were analyzed with one-way and two-way ANOVA at a significance level of 0.05. Significance value is less than p < 0.05, which shows that obtained results are significantly different.
3.10 In-vivo biodistribution of nanoparticles
3.10.1 Effect of amount of reducing agent
Correlation between the amounts of reducing agent and radiolabeling efficacy were studied before the injection of nanoparticles and the obtained data is shown in Fig. 22. The radiolabeling efficacy was tested by varying amount of the reducing agent, e.g., SnCl2·2H2O, from 5 µg to 20 µg. Maximum radiolabeling efficacy was achieved by 20 µg of SnCl2·2H2O as a reducing agent. The relation was further investigated by performing experiments at lower amounts of reducing agent, e.g. 10 µg and 15 µg.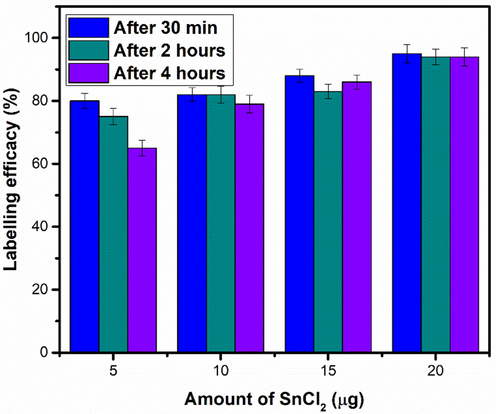
Effect of amount of SnCl2 on labelling efficacy. Values represent the mean ± SD for n = 3, and data were analyzed with one-way and two-way ANOVA at a significance level of 0.05. Significance value after 30 min, 2 h and 4 h are<0.05 (p < 0.05), which shows that obtained results are significantly different.
3.10.2 Effect of pH
The value of pH is a major factor affecting the radiolabeling efficacy (data shown in Fig. 23). Iron oxide nanoparticles were labeled with 99mTc at various pH values (3–7). Since the normal physiological pH of human body is ranging from 4.5 to 7.5 so in the present study a limited pH window, e.g., (3–7), was utilized rather than using the full pH range, e.g. from (1–14). In all these formulations, 20 µg of SnCl2·2H2O was used as reducing agent. At pH 3 (the actual pH of the reaction mixture), the labeling efficacy was excellent, e.g. 94 %, that gradually decreased by increasing the pH value beyond 3. At pH 5, labeling efficacy was 83 % that further dropped to 69 % at pH 7. So, pH 3 was selected as optimum pH for all further radiolabeling formulations.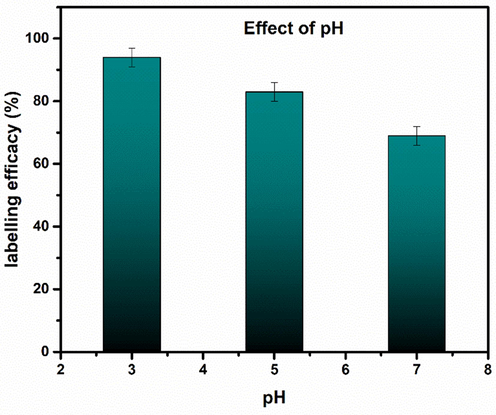
Effect of pH Labeling Yield. Values represent the mean ± SD for n = 3, and data were analyzed with one-way and two-way ANOVA at a significance level of 0.05. Obtained values showed that obtained results are significantly different (p < 0.05).
3.10.3 Stability of 99mTc-iron oxide nanoparticles at room temperature
The stability of 99mTc-iron oxide nanoparticles reflecting the rate of complexation between nanoparticles and the radiometal was assessed at room temperature by paper chromatography using acetone as a mobile phase; data is shown in Fig. 24. It is observed that the radiolabeling efficacy decreased by increasing the incubation time, e.g. it was just 95 % after 30 min of incubation which gradually decreased to 94 % at 2 h and remained stable up to 24 h.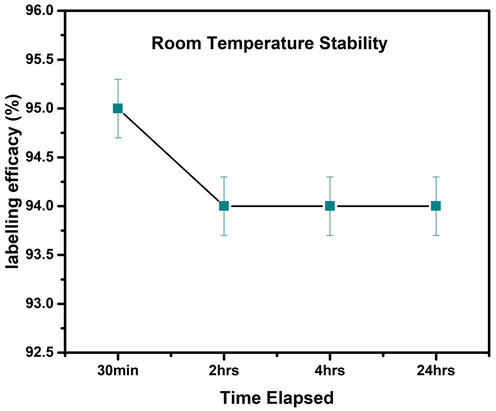
Stability of the radioligand at room temperature. Values represent the mean ± SD for n=3, and data were analyzed with one-way and two-way ANOVA at a significance level of 0.05. No significant differences were observed between any conditions i.e. P > 0.05.
3.10.4 Stability 99mTc-iron oxide nanoparticles in human blood serum
Similarly, the stability of 99mTc-iron oxide nanoparticles was also tested in human serum; data is shown in Fig. 25. The labeled nanoparticles were found stable up to 96 % for 30 min of incubation but the radiolabeling efficacy dropped to 95 % at 2 h of incubation that remained constant up to 24 h of incubation. Furthermore, the lipophilicity data showed that labeled entity was lipophilic in nature.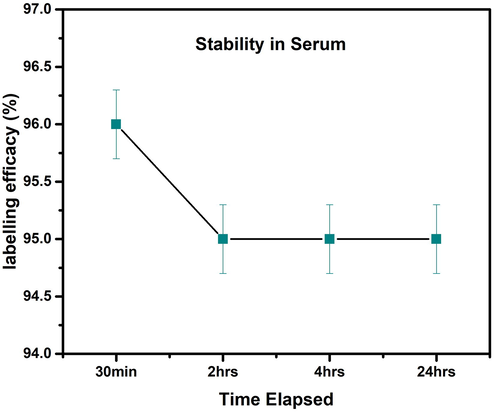
Stability of the radioligand in human serum at room temperature. Values represent the mean ± SD for n = 3, and data were analyzed with one-way and two-way ANOVA at a significance level of 0.05. Obtained value for significant figure is<0.05 (p < 0.05), obtained results are significantly different.
3.10.5 Effect of amount of ligand on radiolabeling efficacy
The amount of ligand was also changed as shown in Fig. 26 to see its effect on radiolabeling efficacy. It was observed that radiolabeling yield is highly dependent on the amount of ligand, e.g. by using low amount of ligand (at 50 µg), the radiolabeling yield was very low. The radiocomplex was incubated at room temperature and after 1 h incubation time, the radiolabeling yield reached to 80 % which was retained even after incubation time of 4 h. The experiment was repeated by using 100 µg, 150 µg and 200 µg of ligand, respectively, by keeping constant all remaining parameters and conditions. The radiolabeling data indicate that at 200 µg of ligand, the maximum radiolabeling yield was obtained which abruptly dropped to 87 % at 150 µg of ligand. These findings clearly indicate that amount of ligand plays a basic role in radiolabeling yield.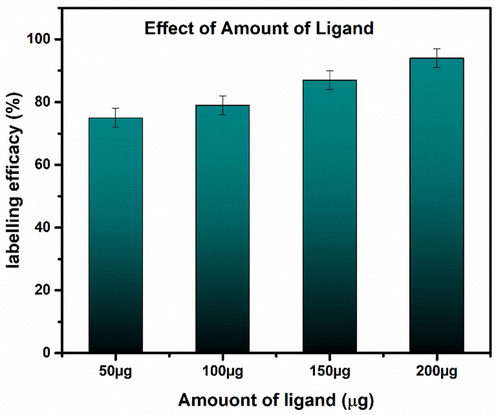
Effect of amount of ligand on radiolabeling yield at room temperature. Values represent the mean ± SD for n = 3, and data were analyzed with one-way and two-way ANOVA at a significance level of 0.05. Obtained value for significant figure are<0.05 (p < 0.05) showing these results are significantly different.
3.10.6 Lipophilicity and protein binding
Results of lipophilicity analysis showed that the radiolabeled nanoparticles are lipophilic in nature. Furthermore, the nanoparticle-based radio-conjugates bind to a variety of protein molecules present in blood plasma leading to a reduced amount of drug in blood. The amount of free or unbound drug may cause severe side-effects or pharmacological activities in the human body. The data from present study indicate that 86.3 ± 2.8 % of 99mTc-iron oxide nanoconjugate exhibited binding with proteins in blood, which is significantly high to show strong binding with proteins. Obviously, the mean remaining fraction (100 % − 86.3 % = 13.7 %) did not show any binding to the proteins in blood. The formula to evaluate the partition coefficient is shown below: Log p Value = Log (86.3/13.7) = 0.79
Partition co-efficient study reflected that the complex is lipophilic in nature because of high Log p value, i.e. 0.79.
3.10.7 Biodistribution of 99mTc-iron oxide nanoparticles in rabbit
Keeping in view these promising in vitro observations, the potential of 99mTc-iron oxide nanoparticles was tested in an in vivo mode by injecting it intravenously in a rabbit animal model and developed its scintigraphy profile on a Gamma Camera. After injecting radiopharmaceutical to rabbit, imaging was studied in dynamic mode up to 10 min. Static images at 15 min, 1 h, 2 h, 4 h and 24 h (p.i.), were performed to clearly assess the retention of radiotracer in the animal; data is shown in Fig. 27. Furthermore, to assess any abnormality, the rabbits were kept in strict observation till 72 h after the study.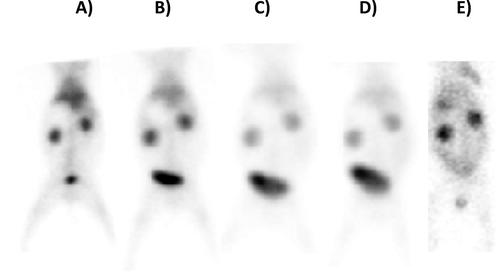
Static whole-body images of rabbit showing the biodistribution of 99mTc-iron nanoparticles at various time intervals of post injection (in anterior view projections), A) 15 min B) 1 h, C) 2 h, D) 4 h, and E) 24 h.
The scintigraphy data shown in Fig. 27 indicate that the radiotracer (after injection) was firstly taken up by heart followed by liver which is cleared slowly, and activity is washed through kidneys and finally accumulated in bladder where a progressive increase in activity level is observed with passage of time. It might be due to the fact that 99mTc-iron oxide nanoparticles exhibit rapid and specific binding to cells in the bladder indicating a possibility of its clinical application in diagnosis of bladder malignancies.
Furthermore, the uptake of 99mTc-iron oxide nanoparticles in different organs of animal at 15 min post injection static study is shown in Fig. 28. These findings indicate that initially, there is maximum uptake in heart and liver with poor retention in these organs, thus showing a rapid excretion through kidneys into bladder.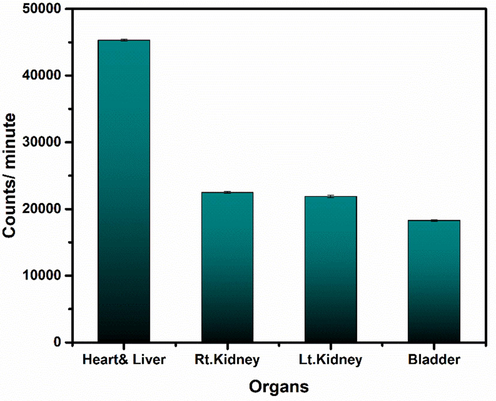
Uptake of Radio-nanoconjugate in various organs of rabbit at 15 min post injection. Values represent the mean ± SD for n = 3, and data were analyzed with one-way and two-way ANOVA at a significance level of 0.05. Obtained value for significant figure is>0.05 (p > 0.05), obtained results are not significantly different.
Above scintigraphy data clearly indicate that prominent uptake was observed in various body organs, e.g. heart, liver, kidney and bladder, thus supporting the hypothesis that the uptake of a radio-nanoconjugate depends on various factors, e.g. the nature of the complex, pH value, blood flow and plasma concentration etc. The accumulation of the radio-nanoconjugate in these organs of interest indicates a rapid binding of the radiotracer to some specific cells in these body organs exhibiting the possibility of its further investigation to be developed as a feasible nano-radiolabeled diagnostic agent. It was further observed that the most probable route of excretion of radiotracer and its metabolites was through renal pathway which is a normal physiological phenomenon for the excretion of majority of drugs. So, it is another advantage of the novel radiotracer under investigation. These findings are further supported by measuring uptake of radiotracer in various organs of rabbit at discrete time intervals of 15 min, 1 h, 2 h, 4 h, and 24 h (data shown in Fig. 29).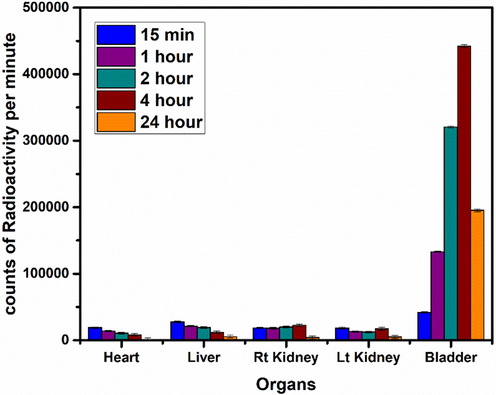
Uptake of Radio-nanoconjugate in various organs of rabbit at discrete time points. Values represent the mean ± SD for n = 3, and data were analyzed with one-way and two-way ANOVA at a significance level of 0.05. Obtained value for significant figure is>0.05 (p > 0.05), obtained results are not significantly different.
4 Conclusions
Iron oxide nanoparticles were prepared by sol–gel method by varying pH of iron oxide sol. Hematite, maghemite and magnetite phases of iron oxide were observed by XRD in the pH ranges of 1–6, 7–8 and 9–11, respectively. In addition to structural transitions, magnetic transitions were also observed. Detailed structural and magnetic analysis proved that superparamagnetic iron oxide nanoparticles showed reduced particle size and enhanced magnetization properties. Nanoparticles synthesized using pH 2, 7, 9 and 10 exhibited superparamagnetic behavior while 4–6, 8 and 11 resulted in ferromagnetic behavior. Detailed dielectric analysis, including impedance spectroscopy, showed iron oxide nanoparticles prepared at pH 2, 7 and 9 exhibited excellent dielectric properties because of grain size effect. Superparamagnetic iron oxide nanoparticles showed potential scavenge activity (i.e. ∼ 72 %) of ROS. Optimized iron oxide nanoparticles showed very fragile hemolytic action and thus found to be biocompatible and can effectively be used for anti-cancer applications. While these nanoparticles showed enhanced impact on cancerous cell lines and showed viability up to ∼ 17.3 %. Optimized nanoparticles showed ∼ 83 % drug efficacy for naturally existing drug (curcumin). Biodistribution was studied using CT scan of animal (rabbit) that was observed for numerous times after injecting nanoparticles into the vein of rabbit. Quality of survival of rabbit, after injecting nanoparticles, was examined with passage of time. It was observed that optimized nanoparticles were potential candidates for therapeutic and drug delivery purposes.
Ethical statement
The study was conducted according to the guidelines of the Declaration of Helsinki and approved by the Ethics Committee of Institute of Nuclear Medicine & Oncology (INMOL) (protocol code INMOL/07/20).
Acknowledgement
Authors are also thankful to Ghurki trust teaching hospital pathology department, BioMed Clinical Lab, Molecular Biology & Genomic Research Centre, Lahore. Authors are thankful to Dr. Usman, Chinese Academy of Sciences, China, for providing SEM analysis of the samples.
Conflict of Interest
Authors state no conflict of interest.
References
- pH-dependent magnetic phase transition of iron oxide nanoparticles synthesized by gamma-radiation reduction method. J. Radioanal. Nucl. Chem.. 2014;301(2):399-407.
- [Google Scholar]
- Structural characterization of Bacillus licheniformis Dahb1 exopolysaccharide—antimicrobial potential and larvicidal activity on malaria and Zika virus mosquito vectors. Environ. Sci. Pollut. Res.. 2018;25(19):18604-18619.
- [Google Scholar]
- Anticancer potential of curcumin: preclinical and clinical studies. Anticancer Res. 2003;23(1):363-398.
- [Google Scholar]
- Magnetic and magnetization properties of Co-doped Fe2O3 thin films. IEEE Trans. Magn.. 2014;50(8):1-4.
- [Google Scholar]
- Effect of Fe3+/Fe2+ ratio on superparamagnetic behavior of spin coated iron oxide thin films. IEEE Trans. Magn.. 2014;50(8):1-4.
- [Google Scholar]
- Role of precursor to solvent ratio in tuning the magnetization of iron oxide thin films–A sol-gel approach. J. Magn. Magn. Mater.. 2019;471(4):14-24.
- [Google Scholar]
- Enhanced dielectric properties of Fe-substituted TiO2 nanoparticles. Phys. B Condens. Matter. 2018;534(2):1-4.
- [Google Scholar]
- Preparation of superparamagnetic maghemite (γ-Fe2O3) nanoparticles by wet chemical route and investigation of their magnetic and dielectric properties. Curr. Appl Phys.. 2015;15(8):925-929.
- [Google Scholar]
- Study of uncoated and silica-coated hematite (α-Fe2O3) nanoparticles. Surf. Interfaces. 2018;13(1):196-204.
- [Google Scholar]
- Antioxidant nanomaterials in advanced diagnoses and treatments of ischemia reperfusion injuries. J. Mater. Chem. B. 2017;5(48):9452-9476.
- [Google Scholar]
- Effect of Cobalt Dopant on the Structural, Magnetic and Dielectric Properties of Fe3O4 Nanoparticles Prepared by Co-precipitation Method. J. Electron. Mater.. 2019;48(5):3229-3238.
- [Google Scholar]
- Targeted superparamagnetic iron oxide nanoparticles for early detection of cancer: Possibilities and challenges. Nanomed. Nanotechnol. Biol. Med.. 2016;12(2):287-307.
- [Google Scholar]
- Structural, electrical, and magnetic properties of nano Sr1−XLaXFe12O19 (X = 0.2–0.8) Sci. Rep.. 2022;12:12723.
- [Google Scholar]
- Microwave assisted sol-gel synthesis of bioactive zirconia nanoparticles–Correlation of strength and structure. J. Mech. Behav. Biomed. Mater.. 2020;112(4):104012-104025.
- [Google Scholar]
- Structural and impedance properties of KBa2V5O15 ceramics. Mater. Res. Bull.. 2008;43(2):401-410.
- [Google Scholar]
- Manipulation over phase transformation in iron oxide nanoparticles via calcination temperature and their effect on magnetic and dielectric properties. IEEE Trans. Magn.. 2017;53(9):1-5.
- [Google Scholar]
- Elucidating the morphological and structural evolution of iron oxide nanoparticles formed by sodium carbonate in aqueous medium. J. Mater. Chem.. 2012;22(25):12498-12506.
- [Google Scholar]
- Magnetite Fe3O4 nanoparticles synthesis by wet chemical reduction and their characterization. Adv. Nat. Sci. Nanosci. Nanotechnol.. 2015;6(3):035009-035012.
- [Google Scholar]
- Effect of n-alkyl trimethylammonium bromides on folding and stability of alkaline and acid-denatured cytochrome c: A spectroscopic approach. J. Colloid Interface Sci.. 2006;297(2):561-569.
- [Google Scholar]
- Structural changes in β-lactoglobulin by conjugation with three different kinds of carboxymethyl cyclodextrins. Thermochim Acta. 2005;432(1):106-111.
- [Google Scholar]
- Effect of pH values on the structural, optical and electrical properties of SnO2 nanostructures. Optik. 2019;181(1):768-778.
- [Google Scholar]
- Study of the magnetite to maghemite transition using microwave permittivity and permeability measurements. J. Phys. Condens. Matter. 2016;28(10):106002-106018.
- [Google Scholar]
- Elements of X-ray Diffraction. Addison-Wesley Publishing; 1956.
- Introduction to magnetic materials. John Wiley & Sons; 2011.
- The Influence of Synthesis Parameters on Structural and Magnetic Properties of Iron Oxide Nanomaterials. Nanomaterials. 2020;10(1):85-94.
- [Google Scholar]
- Dadfar, Seyed Mohammadali, Denise Camozzi, Milita Darguzyte, Karolin Roemhild, Paola Varvarà, Josbert Metselaar, Srinivas Banala et al. 2020. “Size-isolation of superparamagnetic iron oxide nanoparticles improves MRI, MPI and hyperthermia performance.” Journal of Nanobiotechnology 18, no. 1, 1-13.
- A novel view of the separate and simultaneous binding effects of docetaxel and anastrozole with calf thymus DNA: Experimental and in silico approaches. Spectrochim. Acta A Mol. Biomol. Spectrosc.. 2020;2020(228):117528
- [Google Scholar]
- Ligand-based targeted therapy for cancer tissue. Expert Opin. Drug Deliv.. 2009;6(3):285-304.
- [Google Scholar]
- Dependence of pH and surfactant effect in the synthesis of magnetite (Fe3O4) nanoparticles and its properties. J. Magn. Magn. Mater.. 2010;322(4):400-404.
- [Google Scholar]
- Determining the Interaction Behavior of Calf Thymus DNA with Anastrozole in the Presence of Histone H1: Spectroscopies and Cell Viability of MCF-7 Cell Line Investigations. DNA Cell Biol.. 2021;40(8):1039-1051.
- [Google Scholar]
- Experimental and theoretical determination of the electronic structure and optical properties of three phases of ZrO 2. Phys. Rev. B. 1994;49(8):5133-5142.
- [Google Scholar]
- Comprehensive structural and magnetic properties of iron oxide nanoparticles synthesized through chemical routes. J. Alloy. Compd.. 2020;818(1):152931-152942.
- [Google Scholar]
- Synthesis and antioxidant activity of star-shape phenolic antioxidants catalyzed by acidic nanocatalyst based on reduced graphene oxide. Mater. Sci. Eng. C. 2017;71(3):709-717.
- [Google Scholar]
- A novel and inexpensive method based on modified ionic gelation for pH-responsive controlled drug release of homogeneously distributed chitosan nanoparticles with a high encapsulation efficiency. Fibers Polym.. 2020;21(9):1917-1926.
- [Google Scholar]
- Age-related changes in protein oxidation and proteolysis in mammalian cells. J. Gerontol. A Biol. Sci. Med. Sci.. 2001;56(11):B459-B467.
- [Google Scholar]
- Phase transition behavior in Fe2O3 nanofibers. Appl. Surf. Sci.. 2020;507(3):145179-1415196.
- [Google Scholar]
- In vitro characterization and osteoblast responses to nanostructured photocatalytic TiO2 coated surfaces. Acta Biomater.. 2012;8(6):2411-2416.
- [Google Scholar]
- Dielectric, electrical and infrared studies of γ-Fe2O3 prepared by combustion method. Bull. Mater. Sci.. 2003;26(4):391-396.
- [Google Scholar]
- Characterization of the structural changes of human serum albumin upon interaction with single-walled and multi-walled carbon nanotubes: spectroscopic and molecular modeling approaches. Res. Chem. Intermed.. 2019;45(2):401-442.
- [Google Scholar]
- Fabrication of monodisperse magnetite hollow spheres. J. Phys. Chem. C. 2009;113(3):900-906.
- [Google Scholar]
- Effect of pH value on electromagnetic loss properties of Co–Zn ferrite prepared via coprecipitation method. J. Magn. Magn. Mater.. 2016;405(2):36-41.
- [Google Scholar]
- Hussain C.M., ed. Analytical Applications of Functionalized Magnetic Nanoparticles. Royal Society of Chemistry; 2021.
- Maghemite, γ-Fe2O3, nanoparticles preparation via carbon-templated solution combustion synthesis. Ceram. Int.. 2018;44(12):14090-14094.
- [Google Scholar]
- Electronic and structural properties of phase-pure magnetite thin films: effect of preferred orientation. J. Electron. Mater.. 2018;47(11):6613-6624.
- [Google Scholar]
- Biodistribution of iron-oxide-stabilized 99m Tc-ZrO2 nanoparticles in rabbit using honey as a capping agent—microwave-assisted sol–gel approach. J. Sol-Gel Sci. Technol.. 2021;98(1):95-112.
- [Google Scholar]
- Seyedehsara Masoomi Dezfooli, Nurhidayatullaili Binti Muhd Julkapli, Wan Jefrey Basirun, and Ali Seyfoddin. “Nanoantioxidants: Recent Trends in Antioxidant Delivery Applications.” Antioxidants. 2020;9(1):24.
- [Google Scholar]
- Simultaneous normal–Anomalous dielectric dispersion and room temperature ferroelectricity in CBD perovskite BaTiO3 thin films. J. Mater. Res. Technol.. 2020;9(5):11439-11452.
- [Google Scholar]
- Beyond Antimicrobials: Non-Traditional Approaches to Combating Multidrug-Resistant Bacteria. Front. Cell. Infect. Microbiol.. 2019;9(2):343-356.
- [Google Scholar]
- The formation mechanism of iron oxide nanoparticles within the microwave-assisted solvothermal synthesis and its correlation with the structural and magnetic properties. Dalton Trans.. 2015;44(48):21099-21108.
- [Google Scholar]
- Micro-structural characterization and magnetic study of Ni1.5Fe1.5O4 ferrite synthesized through coprecipitation route at different pH values. Mater. Chem. Phys.. 2014;146(1–2):159-169.
- [Google Scholar]
- Kumar, Vijay, Surjeet Chahal, Dharamvir Singh, Ashok Kumar, Parmod Kumar, and Asokan, K. 2018. “Annealing effect on the structural and dielectric properties of hematite nanoparticles.” In AIP Conference Proceedings 1953, no. 1, 030245-030256.
- Effect of Ho3+ substitution on the cation distribution, crystal structure and magnetocrystalline anisotropy of nanocrystalline cobalt ferrite. J. Exp. Nanosci.. 2014;9(4):362-374.
- [Google Scholar]
- Structural and dielectric properties of superparamagnetic iron oxide nanoparticles (SPIONs) stabilized by sugar solutions. Mater. Sci.-Pol.. 2018;36:1-11.
- [Google Scholar]
- Investigations on magnetic and electrical properties of Zn doped Fe2O3 nanoparticles and their correlation with local electronic structures. J. Magn. Magn. Mater.. 2019;489(3):165398-165408.
- [Google Scholar]
- Structural and dielectric properties of superparamagnetic iron oxide nanoparticles (SPIONs) stabilized by sugar solutions. Mater Sci Pol. 2018;36(3):123-133.
- [Google Scholar]
- Synthesis, photoluminescence and Magnetic properties of iron oxide (α-Fe2O3) nanoparticles through precipitation or hydrothermal methods. Physica E. 2018;101(1):212-219.
- [Google Scholar]
- Magnetic iron oxide nanoparticles: synthesis, stabilization, vectorization, physicochemical characterizations, and biological applications. Chem. Rev.. 2008;108(6):2064-2110.
- [Google Scholar]
- Lee, Dong Yun, Sukmo Kang, Yonghyun Lee, Jin Yong Kim, Dohyun Yoo, Wonsik Jung, Soyoung Lee, Yong Yeon Jeong, Kwangyeol Lee, and Sangyong Jon, 2020. “PEGylated Bilirubin-coated Iron Oxide Nanoparticles as a Biosensor for Magnetic Relaxation Switching-based ROS Detection in Whole Blood.” THERANOSTICS 10, no. 5, 1997-2007.
- Synthesis and magnetic properties of octahedral Fe3O4 via a one-pot hydrothermal route. Phys. Lett. A. 2017;381(4):314-318.
- [Google Scholar]
- Impedance spectroscopy: theory, experiment, and applications. History. 2005;1(8):1-13.
- [Google Scholar]
- Glucokinase activity enhancement by cellulose nanocrystals isolated from jujube seed: A novel perspective for type II diabetes mellitus treatment (In vitro) J. Mol. Struct.. 2022;1269:133803
- [Google Scholar]
- Effect of neodymium stimulation on the dielectric, magnetic and humidity sensing properties of iron oxide nanoparticles. Mater. Chem. Phys.. 2020;254:123572
- [Google Scholar]
- Dielectric, magnetic hyperthermia, and photocatalytic properties of ZnFe2O4 nanoparticles synthesized by solvothermal reflux method. Appl. Phys. A. 2019;125(7):477-485.
- [Google Scholar]
- Ultrasmall α-Fe2O3 superparamagnetic nanoparticles with high magnetization prepared by template-assisted combustion process. J. Phys. Chem. C. 2014;118(29):16264-16271.
- [Google Scholar]
- Marjani, N., Dareini, M., Lotfabad, M.A., Pejhan, M., Mokaberi, P., Tehranizadeh, Z.A., Saberi, M.R. and Chamani, J. 2022. Evaluation of the binding effect and cytotoxicity assay of 2-Ethyl-5-(4-methylphenyl) pyramido pyrazole ophthalazine trione on calf thymus DNA: spectroscopic, calorimetric, and molecular dynamics approaches. Luminescence, 2022, 37 (2), 310-322.
- Application of Iron Oxide as a pH-dependent Indicator for Improving the Nutritional Quality. Clinical nutrition research. 2016;5(3):172-179.
- [Google Scholar]
- Mirza, Salma, Malik Shoaib Ahmad, Muhammad Ishaq Ali Shah, and Muhammad Ateeq, 2020. “Magnetic nanoparticles: drug delivery and bioimaging applications.” In Metal Nanoparticles for Drug Delivery and Diagnostic Applications 11, no. 2, 189-213.
- A study of dielectric, optical and magnetic characteristics of maghemite nanocrystallites. Mater. Chem. Phys.. 2015;164(5):183-187.
- [Google Scholar]
- Synthesis of a α-Fe2O3 nanocrystal in its different morphological attributes: growth mechanism, optical and magnetic properties. Nanotechnology. 2007;18(27):275608-275618.
- [Google Scholar]
- Novel perspective into the interaction behavior study of the cyanidin with human serum albumin-holo transferrin complex: Spectroscopic, calorimetric and molecular modeling approaches. J. Mol. Liq.. 2022;356:119042
- [Google Scholar]
- The in vitro stability and in vivo pharmacokinetics of curcumin prepared as an aqueous nanoparticulate formulation. Biomaterials. 2010;31(25):6597-6611.
- [Google Scholar]
- Synthesis and applications of nano-structured iron oxides/hydroxides–a review. Int. J. Eng. Sci. Technol.. 2010;2(8):127-146.
- [Google Scholar]
- Differential scanning calorimetric study of the molten globule state of cytochrome c induced by sodium n-dodecyl sulfate. Thermochim Acta. 2004;409(2):137-144.
- [Google Scholar]
- Comparison of Binding Interactions of Lomefloxacin to Serum Albumin and Serum Transferrin by Resonance Light Scattering and Fluorescence Quenching Methods. J. Biomol. Struct. Dyn.. 2011;28(4):483-502.
- [Google Scholar]
- Formulation, characterization and evaluation of curcumin-loaded PLGA nanospheres for cancer therapy. Anticancer Res. 2009;29(10):3867-3875.
- [Google Scholar]
- Phenolic antioxidants: A rationale for design and evaluation of novel antioxidant drug for atherosclerosis. Free Radic. Biol. Med.. 2000;28(10):1538-1546.
- [Google Scholar]
- Ochsner A., Altenbach H., eds. Advances in Bio-Mechanical Systems and Materials. Springer; 2013.
- Sol–gel based materials for biomedical applications. Prog. Mater Sci.. 2016;77(2):1-79.
- [Google Scholar]
- Dielectric relaxation and conduction mechanism of cobalt ferrite nanoparticles. J. Alloy. Compd.. 2014;615(4):899-905.
- [Google Scholar]
- Oil-in-water nanoemulsions comprising Berberine in olive oil: biological activities, binding mechanisms to human serum albumin or holo-transferrin and QMMD simulations. J. Biomol. Struct. Dyn.. 2021;39(3):1029-1043.
- [Google Scholar]
- Synthesis and characterization of zinc oxide nanoparticles using Cynara scolymus leaves: enhanced hemolytic, antimicrobial, antiproliferative, and photocatalytic activity. J. Clust. Sci.. 2020;31(4):791-801.
- [Google Scholar]
- Effect of pH value on structural and magnetic properties of CuFe2O4 nanoparticles synthesized by low temperature hydrothermal technique. Mater. Res. Express. 2018;5(9):095025
- [Google Scholar]
- Meteoric synthesis of Luminescent Fe2O3 Nanoparticles: A potential Cytotoxic, Antioxidant & Bactericidal agent. Int. J. Appl. Ceram. Technol.. 2020;17(6):2768-2778.
- [Google Scholar]
- Controlled nanostructuring of TiO2 nanoparticles: a sol–gel approach. J. Sol-Gel Sci. Technol.. 2015;74(2):299-309.
- [Google Scholar]
- Structural, electrical and magnetic properties of iron oxide thin films. Adv. Sci. Lett.. 2013;19(3):828-833.
- [Google Scholar]
- Free growth of iron oxide nanostructures by sol-gel spin coating technique—structural and magnetic properties. IEEE Trans. Magn.. 2014;50(8):1-5.
- [Google Scholar]
- Microwave assisted iron oxide nanoparticles—structural and magnetic properties. IEEE Trans. Magn.. 2014;50(8):1-4.
- [Google Scholar]
- Ferromagnetic effects in Cr-doped Fe2O3 thin films. IEEE Trans. Magn.. 2014;50(8):1-4.
- [Google Scholar]
- Characterizing the Binding of Angiotensin Converting Enzyme I Inhibitory Peptide to Human Hemoglobin: Influence of Electromagnetic Fields. Protein Pept. Lett.. 2020;27(10):1007-1021.
- [Google Scholar]
- Relaxation processes and conduction mechanism in bismuth ferrite lead titanate composites. J. Phys. Chem. Solid. 2018;113(1):186-193.
- [Google Scholar]
- Microwave assisted iron oxide nanoparticles—structural and magnetic properties. IEEE Trans. Magn.. 2014;50(8):1-4.
- [Google Scholar]
- “Biogenic synthesis and antimicrobial potency of iron oxide (Fe3O4) nanoparticles using algae harvested from the Mediterranean Sea, Egypt.”. The Egypt. J. Aquat. Res.. 2019;45(3):197-204.
- [Google Scholar]
- Antibacterial performance of glucose-fructose added MW based zirconia coatings–Possible treatment for bone infection. J. Mech. Behav. Biomed. Mater.. 2020;104(4):103621-103635.
- [Google Scholar]
- Tangerine mediated synthesis of zirconia as potential protective dental coatings. Mater. Sci. Eng. C. 2021;120(5):111653-111682.
- [Google Scholar]
- Microwave assisted synthesis of Fe3O4 stabilized ZrO2 nanoparticles–Free radical scavenging, radiolabeling and biodistribution in rabbits. Life Sci.. 2021;271(2):119070-119094.
- [Google Scholar]
- Effect of the amorphous-to-crystalline transition in Ba0.5Sr0.5TiO3 thin films on optical and microwave dielectric properties. J. Phys. D Appl. Phys.. 2009;42(4):045401-045421.
- [Google Scholar]
- Tunable structural and electrical impedance properties of ordered and disordered iron oxide phases for capacitive applications. Ceram. Int.. 2018;44(14):16352-16364.
- [Google Scholar]
- Nanoparticle encapsulation improves oral bioavailability of curcumin by at least 9-fold when compared to curcumin administered with piperine as absorption enhancer. Eur. J. Pharm. Sci.. 2009;37(3–4):223-230.
- [Google Scholar]
- Sharma S.K., ed. Complex Magnetic Nanostructures: Synthesis, Assembly and Applications. Springer; 2017.
- Hemolysis tendency of anticancer nanoparticles changes with type of blood group antigen: An insight into blood nanoparticle interactions. Mater. Sci. Eng. C. 2020;109(5):110645
- [Google Scholar]
- Structural Characterization and Dielectric Studies of Superparamagnetic Iron Oxide Nanoparticles. J. Korean Ceram. Soc.. 2018;55(3):230-238.
- [Google Scholar]
- Suganuma K., ed. Wide Bandgap Power Semiconductor Packaging: Materials, Components, and Reliability. Woodhead Publishing; 2018.
- Magneto-Biosensor for the Detection of Uric Acid Using Citric Acid-Capped Iron Oxide Nanoparticles. J. Nanosci. Nanotechnol.. 2020;20(4):2144-2153.
- [Google Scholar]
- Thakur, Vanita, Anupinder Singh, A. M. Awasthi, and Lakhwant Singh. 2015.“Temperature dependent electrical transport characteristics of BaTiO3 modified lithium borate glasses.” AIP Advances 5, no. 8, 087110-087122.
- Hydrothermal synthesis, morphology, magnetic properties and self-assembly of hierarchical α-Fe2O3 (hematite) mushroom-, cube-and sphere-like superstructures. Appl. Surf. Sci.. 2018;457(5):427-438.
- [Google Scholar]
- Magnetic iron oxide nanoparticles for drug delivery: applications and characteristics. Expert Opin. Drug Deliv.. 2019;16(1):69-78.
- [Google Scholar]
- Synthesis of ZnO nanoparticles using insulin-rich leaf extract: anti-diabetic, antibiofilm and anti-oxidant properties. J. Photochem. Photobiol. B Biol.. 2019;197(2):111541-111553.
- [Google Scholar]
- Superparamagnetic iron oxide nanoparticles: magnetic nanoplatforms as drug carriers. Int. J. Nanomed.. 2012;7(4):3445-3452.
- [Google Scholar]
- Fundamentals of radiation materials science: metals and alloys. springer; 2016.
- Novel iron oxide–cerium oxide core–shell nanoparticles as a potential theranostic material for ROS related inflammatory diseases. J. Mater. Chem. B. 2018;6(30):4937-4951.
- [Google Scholar]
- Xu, Yichen, Huabo Zheng, David Schumacher, Elisa Anamaria Liehn, Ioana Slabu, and Mihaela Rusu, 2021. “Recent Advancements of Specific Functionalized Surfaces of Magnetic Nano-and Microparticles as a Theranostics Source in Biomedicine.” ACS Biomaterials Science & Engineering 6, no 7, 1913-1942.
- Impact of mesoporous silica nanoparticle surface functionality on hemolytic activity, thrombogenicity and non-specific protein adsorption. J. Mater. Chem. B. 2013;1(14):1909-1920.
- [Google Scholar]
- Yousuf, Muhammad Asif, Mirza Mahmood Baig, Najeeb Fuad Al-Khalli, Muhammad Azhar Khan, Mohamed F. 2019. Aly Aboud, Imran Shakir, and Muhammad Farooq Warsi. “The impact of yttrium cations (Y3+) on structural, spectral and dielectric properties of spinel manganese ferrite nanoparticles.” Ceramics International 45, no. 8, 10936-10942.
- Evaluating anticancer activity of plant-mediated synthesized iron oxide nanoparticles using Punica granatum fruit peel extract. J. Mol. Struct.. 2020;1204(6):127539-127552.
- [Google Scholar]
- Yusoff, A. H. M., Midhat Nabil Salimi, and Mohd Faizal Jamlos. 2017. “Synthesis and characterization of biocompatible Fe3O4 nanoparticles at different pH.” In AIP Conference Proceedings, vol. 1835, no. 1, 020010-020024.
- Surface spins disorder in uncoated and SiO2 coated maghemite nanoparticles. J. Magn. Magn. Mater.. 2017;429(3):270-275.
- [Google Scholar]
- Controllable synthesis, magnetic and biocompatible properties of Fe3O4 and α-Fe2O3 nanocrystals. J. Solid State Chem.. 2012;196(5):138-144.
- [Google Scholar]
- Synthesis of Fe3O4 nanoparticles from emulsions. J. Mater. Chem.. 2001;11(6):1704-1709.
- [Google Scholar]
- Ziese M., Thornton M.J., eds. Spin electronics. Vol Vol. 569. Springer; 2007.


