

Translate this page into:
A multi-evaluating strategy for raw and processed Veratrum nigrum L.: Fingerprinting combined with quantitative analysis based on multivariate chemometric methods
⁎Corresponding authors. huihui851025@163.com (Huizi Ouyang), hejun673@163.com (Jun He)
-
Received: ,
Accepted: ,
This article was originally published by Elsevier and was migrated to Scientific Scholar after the change of Publisher.
Peer review under responsibility of King Saud University.
Abstract
Veratrum nigrum L. (VN) is a well-known herbal medicine and rich in chemical components with multiple pharmacological activities including antihypertensive, anticancer, and antifungal effects. In the current experiment, the quality of VN from different habitats was evaluated based on combinative method of fingerprint, multi-component quantification and chemical pattern recognition. Fifteen batches of VN were collected, and intrinsic chemical composition were identified using ultra-performance liquid chromatography coupled with quadrupole time-of-flight mass spectrometry, which is a method for analyzing the similarity between samples, coupled with fingerprint of traditional Chinese medicine. The fingerprint similarity model show that 22 common peaks were selected covering 15 batches of and the similarity > 0.963. The total of 22 joint components were tentatively identified by comparison with standard substances or literature. A ultra-high performance liquid chromatography coupled with triple quadrupole mass spectrometry method for simultaneous determination of 8 compounds was established to evaluate the contents of raw and processed Veratrum nigrum L. Multivariate analysis was then applied to compare different batches of herbs based on ultra-high performance liquid chromatography coupled with triple quadrupole mass spectrometry data. All raw and processed samples were classified by partial least squares discriminant analysis based on the 8 analyzed compounds. The findings suggested that veratramine and polydatin with a variable importance for the project (VIP) > 1 were identified as significant constituents, the presence of which can be used to differentiate between raw and processed Veratrum nigrum L. samples. These results indicate that processing methods show important effects on the composition of Veratrum nigrum L..
Keywords
Veratrum nigrum L.
Processing
Fingerprint
Quantitative analysis
Chemical pattern recognition

1 Introduction
Veratrum nigrum L., named as “LiLu”, originate from the dry roots and rhizomes of plants in the Liliaceae family (Fan et al., 2020). It has been widely used in traditional medical systems in China, due to their reliable therapeutic efficacy. The components of VN are alkaloids, flavonoids and stilbene (Cong et al., 2008; Zheng, et al., 2019). Pharmacological and chemical studies have been revealed that the major therapeutic compounds of this herbal medicine are steroidal alkaloids (Szeliga et al., 2019). With internally use, VN treats blood-stroke, epilepsy and resolving phlegm, while with external use, it cures scabies, tinea capitis, and maggot killing (Kang, et al., 2015; Park, et al., 2016; Li et al., 2020).
Recently, the chemical composition and pharmacological action of VN has been widely reported, but its use has limitations due to its toxicity. In traditional Chinese medicines (TCMs) theory, processing (plain-frying or stir-frying until brown, steaming, braising, or stir-frying with wine) is necessary. It can promote its therapeutic effects and/or reduce side-effects of herbs by decreasing their levels of toxic constituents (Wang et al., 2017; Zhou et al., 2015). At present, the researches focusing on pharmacological activities show that processing method is a significant factor influencing its compositional contents (Chen et al., 2020; Zhang et al., 2016). It is worth noting that processed VN plays an important role in reducing the toxicity and promoting to be widely used in further clinical applications.
Because of the complexity, similarity and diversity of the chemical structures, the analysis of VN is still a great challenge. Fortunately, the fingerprint can describe integral characterization of VN and reflect the internal chemical composition information (Chen et al., 2018; Viapiana et al., 2016). UPLC-Q-TOF/MS can provide a high mass resolution and fragment ion, which will be the beneficial for structure elucidation and can be used in the identification of common peaks in fingerprint (Kadokami et al., 2019; Park et al., 2020; Gampe et al., 2016; Zhao et al., 2015). Meanwhile, Ultra-high performance liquid chromatography coupled with triple quadrupole mass spectrometry (UPLC-MS/MS) is a powerful platform in the quantification of the main fingerprint components depending on its high separation capacity and sensitivity (Jiao, et al., 2019; Lin et al., 2019; Chan et al., 2019). Thus, the use of fingerprint in combination with Liquid chromatography-mass spectrometry (LC-MS) might exhibit the unique advantage for the analysis the discrimination of Veratrum nigrum L. samples.
In this study, fingerprint analysis and UPLC-Q-TOF/MS were used to identify the key chemical markers that are responsible for the characterization. Furthermore, a UPLC-MS/MS method was established to simultaneously determine 8 compounds including apigenin, cyclopamine, jervine, polydatin, quercetin, resveratrol, veratramine, and veratrosine within 5 min in VN. Moreover, the present assay further analyzes the main components of raw and processed VN using chemical pattern recognition. And it highlights the infuence of processing on the compounds and this information will be useful in the evaluation and diferentiation of raw and processed VN herbs.
2 Materials and methods
2.1 Materials, chemicals and reagents
Fifteen batches of raw VN were collected from different provinces in China and identified by Prof. Tianxiang Li from School of Chinese Materia Medica, Tianjin University of Traditional Chinese Medicine. Sample information is provided in Table 1. The voucher specimens were deposited at the Tianjin University of Traditional Chinese Medicine, China.
Batch
Region
Lot Number
Batch
Region
Lot Number
Batch
Region
Lot Number
1
Yunnan
20190917
6
Shanxi
20190620
11
Hubei
20190918
2
Jiangxi
20190920
7
Jilin
20190812
12
Heilongjiang
20190808
3
Fujian
20190817
8
Xinjiang
20190908
13
Guangdong
20190911
4
Shanxi
20190915
9
Guizhou
20190816
14
Zhejiang
20190813
5
Anhui
20190907
10
Guangxi
20190706
15
Anhui
20190826
Acetonitrile and methanol (Merck & Co Inc, USA) were of HPLC grade. Formic acid of HPLC-grade was obtained from ROE Co., ltd. Deionized water was prepared by a Milli-Q water purification system (Millipore, Milford, MA, USA). Apigenin, cyclopamine, jervine, polydatin, quercetin, resveratrol, and veratramine were purchased from Chengdu Desite Bio-Technology Co., ltd (Chengdu, China). Veratrosine was purchased from Chengdu Chroma-Biotechnology Co., ltd (Chengdu, China).
2.2 Processing methods of Veratrum nigrum L.
The roots and rhizomes of the plants were cut into segments, and were stir-fried in a metallic pan at 120–140 °C, over a medium flame for about 15 min, the color on the surface of samples turns brown and scorched spots appeared.
2.3 Preparation of standard solutions
Apigenin, cyclopamine, jervine, polydatin, quercetin, resveratrol, veratramine and veratrosine were accurately weighed and dissolved in methanol at a final concentration of 100 μg/mL as stock solutions, respectively. Working standard solutions were further obtained by diluting the above stock solutions in appropriate amounts.
2.4 Preparation of sample solutions
The roots and rhizomes of the plants were ground into powder form in an electric grinder and then passed through a 24-mesh (0.8 mm) sieve. Each sample was accurately weighed (10.0 g) and extracted 3 times by hydrodistillation with 150 mL of 70 % ethanol (v/v) for 2 h at 100 Volt. The supernate was filtered through a 0.22 µm filter membrane and was stored at 4 °C until analysis.
2.5 Chromatographic and mass spectrometric conditions
2.5.1 UPLC-Q-TOF/MS acquisition analysis of fingerprint
UPLC-Q-TOF/MS system was composed of Agilent 1290 UPLC instrument (Agilent Technologies, Waldbronn, Germany) and Agilent 6520 Q-TOF mass spectrometer (Agilent Corporation, Santa Clara, CA, USA). The mass spectra data was acquired in the negative electrospray ion (ESI) mode. The chromatographic peaks were separated on an CORTECS® UPLC® C18 column (2.1 × 100 mm, 1.6 µm, Waters) at a flow rate of 0.3 mL/min. Mobile phase consisted of 0.1 % formic acid–water (A) and acetonitrile (B). The gradient elution program was set as: 0–5 min, 5 %–13 % B; 5–18 min, 13 %–21 % B; 18–20 min, 21 %–60 % B; 20–25 min, 60 %–62.5 % B; 25–34 min, 62.5 %–73 % B; 34–35 min, 73 %–76 % B. The post run time was 5 min. The injection was 1 µL. The related Q-TOF/MS parameters were listed as follows: drying gas, N2; gas flow rate, 11 L/min; drying gas temperature, 350 °C; nebulizer gas pressure, 40 psi; capillary voltage, 3500 V; fragmentor voltage, 135 V; collision energy (CE), 30 V. The scan range of mass spectra was m/z 100–1700.
2.5.2 UPLC-MS/MS analysis
UPLC-MS/MS system consists of an Agilent 1290 ultra-high performance liquid chromatography system (Agilent Technologies, Germany) coupled with an Agilent 6470 series triple quadrupole mass spectrometer (Agilent Technologies, Singapore) with an electrospray ionization (ESI) source. The quantitative analysis was performed on a CORTECS® UPLC® C18 column (2.1 × 100 mm, 1.6 µm, Waters) at 20 °C with a flow rate of 0.3 mL/in and the injection volume of 5 µL. Mobile phase was a mixture of 0.1 % formic acid–water (A) and acetonitrile (B). The gradient program of mobile phase was as follows: 0–2 min, 15–47 % B; 2–5 min, 47–47 % B. Data analysis was performed using Masshunter Workstation Software from Agilent Technology (version B.09.00).
The multiple reaction monitoring (MRM) mode was applied for quantification in positive and negative ionization mode simultaneously. The optimum MS values were maintained as follows: nebulizing gas pressure, 35 psi; drying gas (N2) flow rate, 7 L/min with a temperature at 300 °C; sheath gas flow, 11 L/min with a temperature at 350 °C. The precursor-product ion pairs used for the MRM detection and MS parameters are showed in Table 2.
Compound
Precursor Ion (m/z)
Product Ion (m/z)
Fragmentor (V)
Collision Energy (V)
Ion mode
Veratrosine
572.4
457.2
242
40
Positive
Jervine
426.3
114.0
214
36
Positive
Cyclopamine
412.3
114.0
80
36
Positive
Veratramine
410.3
295.1
189
32
Positive
Polydatin
389.1
227.0
156
28
Negative
Quercetin
301.0
151.0
128
24
Negative
Apigenin
269.0
117.0
141
40
Negative
Resveratrol
229.1
107.0
93
24
Positive
2.6 Method validation
2.6.1 UPLC-Q-TOF/MS acquisition method validation
The precision, repeatability, and stability were investigated to validate the applicability of UPLC-Q-TOF/MS method by using the samples. For precision, the method was evaluated by intra-day variability. Relative standard deviations (RSDs) were calculated as the measure of precision. In the repeatability examination, six replicates of the samples from the same batch were extracted and analyzed. To evaluate the stability of the analytes, sample solutions were stored at room temperature and then analyzed by replicate injections at 0, 2, 4, 8, 10, and 12 h. RSDs were used to assess stability.
2.6.2 UPLC-MS/MS method validation
The linearity of the assay for the test compounds was assessed by least-square linear regression of the analyte-to-standard peak area ratio (y) versus the normalized standard concentration (x). Lower limit of quantification (LLOQ) for each sample was defined based on the concentrations that generated peaks with signal-to-noise values (S/N) of 10. The raw VN (batch 1) was applied to validate the method, including precision, repeatability, stability and recovery. For precision, the method was assessed by intra-day and inter-day variability. In the repeatability examination, six replicates of the samples from the raw VN (batch 1) were extracted and analyzed. The recovery was carried out by adding known amount of 8 standards solution to raw VN samples (5 g), which was used to further investigate the accuracy of the method. The samples were prepared according to the procedure described for sample preparation in section “2.4”. Recovery was calculated using the following formula: recovery (%) = (amount found - original amount)/amount spiked × 100 %. To assess the stability of analytes, sample solutions were stored at room temperature and then analyzed by replicate injection at 0, 2, 4, 8, 10 and 12 h.
2.7 Statistical analysis
The original data of VN in multiple reaction monitoring modes were processed by the MassHunter software and Qualitative Navigator software. The chromatogram data (TXT format) from the UPLC-Q-TOF/MS system was imported into the “Similarity Evaluation System of Traditional Chinese Medicine Chromatographic Fingerprint” software (2004 edition, developed by the Chinese Pharmacopoeia Commission). Multivariate chemometric methods, such as hierarchical cluster analysis (HCA), principal component analysis (PCA) and partial least-squares discrimination analysis (PLS-DA), were applied to classify the new matrix data and determine their similarities and differences. Combined with chemical pattern recognition methods to synthesize the resulting fingerprint profiles, the results were judged to visually reflect the quality differences between samples of different origins. Statistical analyses were carried out using SPSS 25.0 and SIMCA-P 14.1 software.
The external standard method was used for accurate quantification of VN samples, and all chromatographic data obtained from UPLC-MS/MS was processed by the SIMCA-P software. Furthermore, PLS-DA, a supervised multivariate data analysis technique, characterized by variable selection criteria and potential biomarker output. The VIP > 1.0 was used as the criterion to further screen out the components that contribute more to the above samples classification. According to the VIP, potential biomarker were considered to be the significantly markers which could distinguish the differences of VN from different areas and processing procedures.
3 Results and discussion
3.1 Fingerprint analysis using UPLC-Q-TOF/MS
3.1.1 Method validation for fingerprint analysis
The retention times (Rt) and peak areas of 22 common compounds(P1-P22) were employed to calculate the RSD values, which were regarded as the important assessment indicator of precision, repeatability, and stability. The RSD values of precisions were all below 6.7 %, which displayed a high accuracy of Rt and peak areas of target ions in the process of multiple samples analysis by the UPLC-Q-TOF/MS method. Moreover, the repeatability with the RSDs ranging from 0.6 % to 6.9 % showed good consistency of results detected by UPLC-Q-TOF/MS. Finally, the RSDs indicative of stability were within 2.1 %-6.2 %, demonstrating that sample solutions were stable for qualitative detection in 12 h. All data are displayed in Table 3. These results indicated that UPLC-Q-TOF/MS method was applicable and reliable for acquiring the fingerprint data.
Compounds
Precision RSD (%)
Repeatability RSD (%)
Stability RSD (%)
Compounds
Precision RSD (%)
Repeatability RSD (%)
Stability RSD (%)
1
2.7 %
2.7 %
6.2 %
12
3.8 %
3.6 %
3.1 %
2
2.9 %
2.6 %
3.8 %
13
5.0 %
6.9 %
5.9 %
3
1.7 %
2.6 %
4.7 %
14
6.1 %
5.7 %
5.8 %
4
0.9 %
0.6 %
2.1 %
15
4.6 %
4.9 %
3.8 %
5
2.1 %
1.7 %
3.6 %
16
3.2 %
4.9 %
3.8 %
6
1.0 %
1.0 %
2.1 %
17
1.5 %
6.3 %
5.1 %
7
0.7 %
0.9 %
2.4 %
18
5.4 %
6.0 %
4.7 %
8
1.9 %
1.6 %
2.9 %
19
6.7 %
6.1 %
5.0 %
9
2.4 %
1.8 %
2.5 %
20
5.5 %
2.9 %
5.6 %
10
1.2 %
1.3 %
2.9 %
21
6.2 %
4.7 %
4.5 %
11
0.6 %
1.6 %
2.4 %
22
4.6 %
5.8 %
3.5 %
3.1.2 Similarity assessment of fingerprint
To achieve higher resolution, faster separation, and provide good responses to all chemical components in MS analysis, the UPLC chromatographic conditions and the MS conditions were optimized. Multiple reaction monitoring modes were employed to obtain as many corresponding MS and MS2 signals as possible. Fifteen batches (S1–15) of VN were analyzed, and chromatograms were recorded. The chromatographic fingerprint of 15 batches of samples were shown in Fig. 1. Then, the chromatogram data (TXT format) from the UPLC-Q-TOF/MS system were imported into the “Similarity Evaluation System of Traditional Chinese Medicine Chromatographic Fingerprint” software (2004 edition, developed by the Chinese Pharmacopoeia Commission), as recommended by the China Pharmacopoeia Committee. The chromatogram of S1 was set as the reference spectrum, and a total of 22 common peaks (P1-P22) were aligned and marked manually. Moreover, 22 of common components were unambiguously identified by comparing their retention times, accurate masses with data from the corresponding standard substances, and comparison with the data from previous joint literature (Table 4). Most of the samples had a similarity level of 0.963–0.994 (Table 5), compared with the reference fingerprint (R). The above results showed that the compositions of 15 batches of VN from different area were the same.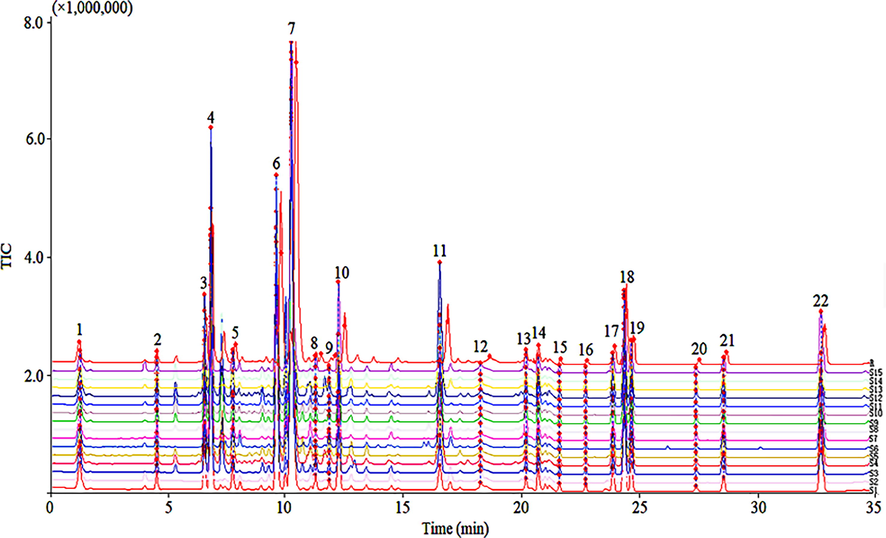
Fingerprint of 15 batches of Veratrum nigrum L. (VN) were analyzed by the Similarity Evaluation System.
No.
Rt
m/z
Fragment Ion
Loading
Possible
Molecular
Diff
(min)
Form
Compound
Formula
(ppm)
1
1.24
104.0598
57.0348
[M + H]+
2,3-diaminopropanoate
C3H7N2N2
1.05
2
4.50
460.3089
141.9587
[M + H]+
Verdine
C27H41NO5
−0.55
3
6.56
588.3315
508.5408, 536.3210
[M + H]+
Pseudojervine
C33H49NO8
−2.53
4
6.83
572.3629
410.3055, 536.5753
[M + H]+
Veratrosine
C33H49NO7
4.75
5
7.77
444.3131
426.2079
[M + H]+
Vibeissine
C27H41NO4
3.26
6
9.63
426.3018
102.1279
[M + H]+
Jervine
C27H39NO3
−3.54
7
10.26
410.3077
217.1029, 295.2057
[M + H]+
Veratramine
C27H39NO2
3.83
8
11.31
658.3615
640.3504
[M + H]+
Veratroylzygadenine
C36H51NO10
0.36
9
11.89
412.3233
125.9862, 110.0085
[M + H]+
Cyclopamine
C27H41NO2
2.14
10
12.29
576.3567
412.3215
[M + NH4]+
Cucurbitacin B
C32H46O8
−2.74
11
16.62
398.3435
394.311
[M + H]+
Solanidine
C27H43NO
1.11
12
18.39
228.1267
61.9271
[M + H]+
Harmaline hydrochloride
C14H15N2O
−4.35
13
20.28
343.2111
240.1603
[M + H]+
Diethyllachesine
C21H28NO3
3.1
14
20.80
219.1607
239.4640, 119.0312
[M + H]+
Nitrocyanamide
C5H12N7O3
0.8
15
21.73
279.0825
121.064
[M + H]+
Dimethyl 4,4-dinitroheptanedioate
C9H14N2O8
−0.88
16
22.84
279.1548
121.1477, 106.0173
[M + NH4]+
Lotaustralin
C11H19NO6
0.78
17
24.00
399.2165
101.5266
[M + H]+
Galbanic acid
C24H30O5
0.35
18
24.48
282.2022
275.0844, 109.0520
[M + H]+
7,7-diethoxyheptane-1,4-diamine
C11H27N3O5
0.57
19
24.80
281.1701
554.2748
[M + H]+
(2,6-dimorpholin-4-ylpyrimidin-4-yl) hydrazine
C12H20N6O2
2.25
20
27.57
284.2151
146.0256
[M + H]+
Bis (4-tert-butylphenyl) oxidanium
C20H27O
−5.88
21
28.73
256.1905
104.0621
[M + H]+
C10-homoserine lactone
C14H25NO3
0.2
22
32.89
360.2383
100.9134, 226.8619
[M + H]+
Broussonetine H
C18H33NO6
3.08
Batch
S1
S2
S3
S4
S5
S6
S7
S8
S9
S10
S11
S12
S13
S14
S15
R
S1
1
S2
0.989
1
S3
0.978
0.968
1
S4
0.936
0.907
0.953
1
S5
0.987
0.983
0.992
0.94
1
S6
0.978
0.971
0.98
0.947
0.975
1
S7
0.984
0.986
0.972
0.933
0.973
0.984
1
S8
0.951
0.945
0.971
0.975
0.965
0.97
0.966
1
S9
0.979
0.962
0.996
0.958
0.988
0.981
0.974
0.972
1
S10
0.967
0.948
0.99
0.978
0.981
0.975
0.959
0.98
0.988
1
S11
0.958
0.953
0.989
0.931
0.974
0.97
0.965
0.959
0.988
0.974
1
S12
0.931
0.914
0.951
0.985
0.942
0.95
0.944
0.992
0.957
0.972
0.939
1
S13
0.981
0.975
0.985
0.939
0.987
0.981
0.983
0.972
0.988
0.969
0.972
0.951
1
S14
0.964
0.947
0.991
0.967
0.975
0.983
0.964
0.974
0.993
0.993
0.985
0.961
0.972
1
S15
0.994
0.994
0.972
0.915
0.988
0.967
0.981
0.943
0.97
0.954
0.953
0.919
0.98
0.949
1
R
0.987
0.979
0.994
0.963
0.993
0.989
0.987
0.984
0.994
0.989
0.982
0.968
0.992
0.988
0.982
1
3.1.3 Chemometric analysis of fingerprint
HCA, PCA and PLS-DA multivariate statistical methods were employed to further explore the difference in quality of different samples (Kandasamy et al., 2020; Zhang et al., 2021). HCA is an unsupervised pattern recognition method based on a set of unclassified samples: the dendrogram was able to intuitively show the similarities and differences of the tested samples. As shown in Fig. 2, when the distance scale was approximately 11, fifteen samples were divided into five clusters, with considerable differences between them. The samples in group 5, which were formed with S1, S9, S10, S11, S13, S14 and S15, showed better similarity, which indicated that the samples in group 5 had the similar chemical constituents. All the samples from 15 batches VN, with their 22 common peaks, were assembled in a 15 × 22 data matrix for the PCA model. The R2 and Q2 values of the PCA score plot were 0.982 and 0.553, respectively, indicating that the established PCA model had a good fit and predictability. As shown in Fig. 3A, the different batches of VN samples do not exhibit a clear classification. As illustrated in Fig. 3B, each point in the load diagram represents a peak, and its distance from the origin represents the extent of its contribution to the overall distribution of the samples. The peaks No. 7, No. 8, No. 6, No. 4 and No. 11 were farther from the origin in the coordinate system, indicating that they had a greater contribution to the difference in quality among the VN samples.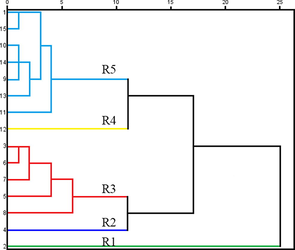
HCA of 15 batches of raw VN samples.
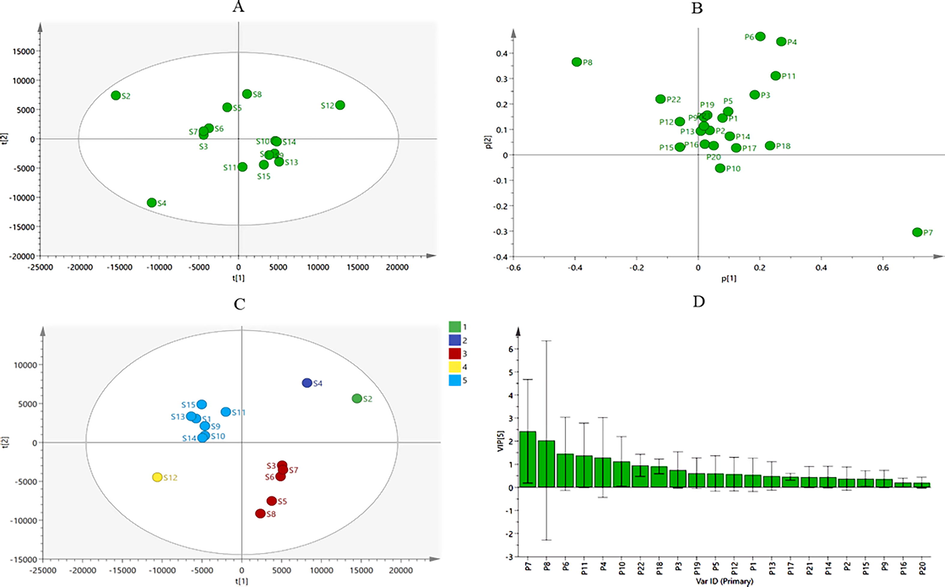
Fngerprint analysis of chemometrics for 15 batches of VN. (A) The PCA score plot of 15 batches of VN. (B) The PCA loading plot. (C) The PLS-DA score plot. (D) The PLS-DA variable importance plot (VIP) histogram of 15 batches of VN. (2. Verdine, 3.
pseudojervine, 4. Veratrosine, 5. Vibeissine, 6. Jervine, 7. Veratramine, 8. Veratroylzygadenine, 9. Cyclopamine, 10. Cucurbitacin B, 11. Solanidine).
The data of the samples were further analyzed using the supervised PLS-DA model to obtain the components of variability among the batches of samples (Campmajó et al., 2020; Zhao et al., 2020), the results showed that VN samples from different batches were divided into 5 groups, which confirmed the results of HCA analysis, as shown in Fig. 3C. The PLS-DA model of the 15 samples was generated to determine the potential markers from the 22 common peaks. The variable importance in projection (VIP), which represented the importance of each variable for distinguishing different regions, were shown in Fig. 3D. The components with VIP > 1 were usually considered as the potential classification markers (Windarsih et al., 2019). In total, six significant variables were obtained, which were peak 7 (veratramine), peak 8 (veratroylzygadenine), peak 6 (jervine), peak 11 (solanidine), peak 4 (veratrosine) and peak 10 (cucurbitacin B) in order of their projection importance values. These components were the main reasons for the differences among the 15 batches of samples and had a certain iconic effect, and the results were consistent with the results of the loadings plot in the PCA.
Based on the complexity of the chemical components of herbal medicine, fingerprinting techniques combined with chemical pattern recognition analysis can truly and graphically reflect the quality differences of herbal medicine and reveal the patterns among its complex components.
3.2 UPLC-MS/MS quantitative analysis of VN
Chromatographic fingerprinting of traditional Chinese medicine can reflect the wholeness and complexity of herbal medicine components, emphasizing the attribution of shared peaks and similarity evaluation, but the content of shared peaks of known components is difficult to determine, so the quantitative determination of multiple components using UPLC-MS/MS on the basis of fingerprinting can make up for the above deficiencies.
The linear calibration curves of peak areas (y) versus concentrations (x) were plotted for eight main active compounds. The regression coefficients (r2) were > 0.9990 for the 8 compounds, indicating good linearity within a relatively wide range of concentrations. For precision, the RSD for the contents of the 8 characteristic components ranged from 1.0 to 4.4 %. In the test of repeatability, the RSD values for all target analytes ranged from 1.7 to 4.6 %. The results indicated that the method is precise and repeatable. Stability, measured as RSD, was in the range 0.7–2.8 %, indicating that the samples were stable for 12 h. The recovery of each analyte ranged from 95.0 to 103.2 %. These results indicated that the method of sample preparation was acceptable in the current condition. The full scan monitoring chromatograms of the analytes are shown in Fig. 4. The validation data shown in Table 6 is considered to be satisfactory for the subsequent analysis of all samples.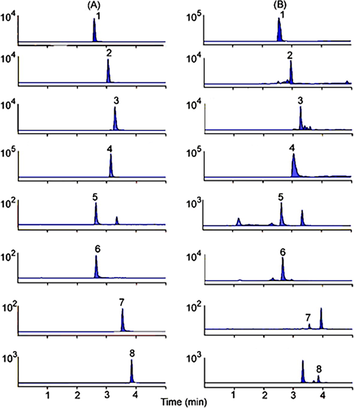
Multiple reaction monitoring (MRM) chromatograms of Veratrosine (1), Jervine (2), Cyclopamine (3), Veratramine (4), Resveratrol (5), Polydatin (6), Quercetin (7), Apigenin (8). (A) standard solution, (B) VN sample.
Compounds
Regression equation
Linear range (ng/mL)
r2
LLOQ (ng/mL)
Precision RSD (%)
Repeatability RSD (%)
Stability RSD (%)
Recovery (%)
Veratrosine
y = 2138.1640x-3979.5370
2–400
0.9992
0.1
3.3
2.6
1.3
100.3
Jervine
y = 1424.9743x-2545.4059
2–400
0.9996
0.1
1.7
1.7
2.3
95.0
Cyclopamine
y = 2640.2316x-2230.1781
1–200
0.9991
0.1
1.0
2.8
1.7
96.3
Veratramine
y = 3634.1091x-45864.7029
15–3000
0.9990
0.1
1.1
2.8
1.9
96.0
Polydatin
y = 8.6428x-213.5339
35–7000
0.9993
0.2
4.0
2.6
2.4
103.2
Quercetin
y = 18.0939x-35.9843
2–400
0.9992
0.1
3.3
4.6
1.6
100.0
Apigenin
y = 21.6934x-37.2819
2–400
0.9991
0.2
4.4
2.3
2.8
102.9
Resveratrol
y = 50.2651x + 338.4728
8–1600
0.9995
0.1
1.3
1.8
0.7
99.4
The validated method was applied to the analysis of 15 batches of raw and processed VN samples. The contents of the 8 compounds in raw and processed VN samples are listed in Table 7. There were significantly differences in the contents of analytes between raw and processed samples. For example, compared with the raw VN, the total contents of veratrosine, jervine, resveratrol in most batches of processed VN is significantly increased. And the result of cyclopamine, veratramine, polydatin, apigenin is the opposite. As shown in Fig. 5, there are significantly decreased changes in contents of veratramine and polydatin. It can indicate two toxic components are sensitive to high temperature, and this phenomenon reveals that processing in high temperature may have a certain effect on reducing the toxicity of VN.
Batch
Veratrosine
Jervine
Cyclopamine
Veratramine
Q
H
Q
H
Q
H
Q
H
1
4.36 ± 0.17
3.02 ± 0.18
2.80 ± 0.13
2.71 ± 0.10
1.12 ± 0.05
0.17 ± 0.01
121.08 ± 1.62
85.67 ± 3.03
2
2.99 ± 0.08
3.45 ± 0.07
2.42 ± 0.11
2.78 ± 0.08
1.24 ± 0.05
0.19 ± 0.01
126.88 ± 5.92
85.01 ± 1.72
3
2.91 ± 0.05
5.19 ± 0.16
3.10 ± 0.27
2.66 ± 0.11
1.79 ± 0.06
0.62 ± 0.28
90.83 ± 6.21
73.66 ± 4.62
4
2.88 ± 0.15
2.79 ± 0.23
3.54 ± 0.26
2.77 ± 0.12
1.32 ± 0.09
0.31 ± 0.01
103.15 ± 6.50
70.36 ± 3.27
5
6.65 ± 0.52
5.02 ± 0.21
2.41 ± 0.04
2.53 ± 0.11
1.43 ± 0.07
0.16 ± 0.01
99.22 ± 3.52
83.69 ± 3.06
6
9.07 ± 1.40
8.63 ± 2.77
2.25 ± 0.27
2.40 ± 0.10
2.39 ± 0.07
1.99 ± 0.02
96.19 ± 4.60
84.14 ± 4.09
7
4.26 ± 2.09
4.78 ± 0.22
2.91 ± 0.08
2.67 ± 0.03
1.67 ± 0.03
0.62 ± 0.56
97.59 ± 9.80
89.24 ± 1.49
8
7.02 ± 1.53
8.97 ± 2.80
2.63 ± 0.09
2.77 ± 0.14
2.55 ± 0.02
1.43 ± 0.69
96.52 ± 6.69
82.05 ± 2.10
9
3.46 ± 1.66
3.05 ± 1.31
2.87 ± 0.19
3.04 ± 0.10
1.49 ± 0.03
0.26 ± 0.02
96.40 ± 15.81
69.52 ± 7.10
10
3.28 ± 0.15
6.33 ± 0.36
3.23 ± 0.18
3.50 ± 0.04
1.74 ± 0.06
0.18 ± 0.02
81.16 ± 5.41
63.47 ± 1.85
11
3.71 ± 0.14
4.21 ± 0.18
3.09 ± 0.14
3.37 ± 0.18
1.95 ± 0.08
0.24 ± 0.03
81.79 ± 6.82
61.16 ± 1.18
12
8.64 ± 2.02
10.35 ± 0.43
2.28 ± 0.06
2.00 ± 0.09
2.53 ± 0.07
1.15 ± 0.77
98.20 ± 4.34
87.67 ± 1.00
13
2.92 ± 0.13
3.02 ± 0.09
2.73 ± 0.10
2.99 ± 0.14
1.51 ± 0.07
0.58 ± 0.55
104.16 ± 0.95
98.60 ± 2.96
14
2.72 ± 0.29
5.00 ± 0.17
3.63 ± 0.10
3.63 ± 0.06
1.72 ± 0.03
0.19 ± 0.02
84.89 ± 3.13
78.68 ± 5.79
15
2.80 ± 0.16
2.02 ± 0.07
3.17 ± 0.06
2.61 ± 0.07
1.33 ± 0.05
0.14 ± 0.02
120.49 ± 6.37
87.66 ± 6.40
(Remark: Q, raw samples; H, processed samples)
Batch
Polydatin
Quercetin
Apigenin
Resveratrol
Q
H
Q
H
Q
H
Q
H
1
93.44 ± 2.75
95.02 ± 5.85
0.07 ± 0.01
0.08 ± 0.01
0.83 ± 0.02
0.56 ± 0.01
5.69 ± 0.19
6.12 ± 0.13
2
83.59 ± 6.56
91.37 ± 4.05
0.09 ± 0.01
0.41 ± 0.49
0.62 ± 0.04
0.52 ± 0.01
5.54 ± 0.12
5.40 ± 0.09
3
105.98 ± 10.78
130.92 ± 2.15
0.24 ± 0.04
0.61 ± 0.06
0.76 ± 0.03
0.48 ± 0.02
2.58 ± 0.07
4.02 ± 0.16
4
115.45 ± 3.71
104.49 ± 8.99
0.26 ± 0.02
0.47 ± 0.01
1.28 ± 0.05
0.72 ± 0.03
5.31 ± 0.59
4.68 ± 0.16
5
141.64 ± 9.23
101.75 ± 3.30
0.09 ± 0.01
0.07 ± 0.01
0.93 ± 0.02
0.43 ± 0.01
3.49 ± 0.33
4.15 ± 0.20
6
128.75 ± 8.68
105.04 ± 4.66
0.50 ± 0.02
0.11 ± 0.01
0.65 ± 0.01
0.59 ± 0.01
3.98 ± 0.15
4.04 ± 0.10
7
93.84 ± 9.69
151.94 ± 15.16
0.16 ± 0.01
0.09 ± 0.01
0.86 ± 0.03
0.73 ± 0.01
5.75 ± 0.23
9.20 ± 0.46
8
92.35 ± 2.88
95.50 ± 8.25
0.25 ± 0.02
0.55 ± 0.03
0.81 ± 0.04
0.70 ± 0.03
3.31 ± 0.36
4.56 ± 0.10
9
81.20 ± 8.40
62.84 ± 4.18
0.18 ± 0.01
0.51 ± 0.02
0.67 ± 0.06
0.52 ± 0.01
2.62 ± 0.09
1.62 ± 0.02
10
130.90 ± 7.11
106.58 ± 4.30
0.15 ± 0.01
0.12 ± 0.02
0.96 ± 0.03
0.39 ± 0.01
3.33 ± 0.21
3.56 ± 0.28
11
119.37 ± 7.08
89.56 ± 6.63
0.14 ± 0.01
0.24 ± 0.01
0.86 ± 0.01
0.51 ± 0.02
2.34 ± 0.14
2.48 ± 0.08
12
126.41 ± 6.47
99.85 ± 5.44
0.18 ± 0.01
0.22 ± 0.02
0.70 ± 0.02
0.70 ± 0.03
4.17 ± 0.57
3.62 ± 0.30
13
137.04 ± 8.75
89.88 ± 4.82
0.11 ± 0.01
0.09 ± 0.02
1.06 ± 0.01
0.70 ± 0.01
7.76 ± 0.27
4.95 ± 0.07
14
113.61 ± 7.99
102.42 ± 2.16
0.21 ± 0.01
0.14 ± 0.01
0.99 ± 0.03
0.62 ± 0.02
2.75 ± 0.12
2.78 ± 0.02
15
90.99 ± 5.18
68.98 ± 2.90
0.07 ± 0.01
0.09 ± 0.02
0.80 ± 0.10
0.43 ± 0.01
5.65 ± 0.25
4.32 ± 0.17
(Remark: Q, raw samples; H, processed samples)
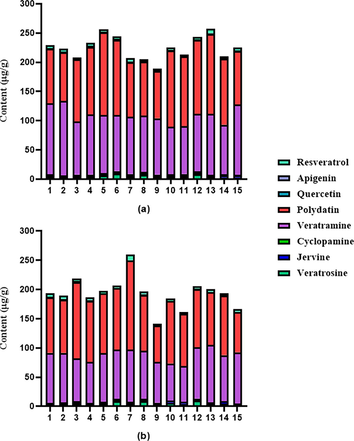
Contents of 8 components in different batches of raw and processed VN (μg/g): (A) raw; (B) processed.
The UPLC-MS/MS results were further analyzed by PLS-DA. A three-dimensional (3 D) score plot of the PLS-DA was carried out to measure the differences in the content of raw and processed VN from different origins. There was no distinct zonal aggregation of VN from different origins, indicating that origin has no significant effect on the content of ingredients (Fig. 6). Raw and processed VN samples were clearly clustered in distinct region (Fig. 7). Constituents with large loading values can be considered as markers, which contributed clearly to the classification of the samples. In the present study, potential bioactive ingredients such as veratramine and polydatin with VIP > 1 were identified as compounds that could be used to differentiate between the raw and processed VN samples, as illustrated in Fig. 8. The results showed that the chemical composition of VN samples was altered after processing. The above components contributed greatly to sample classification and may be the material basis for the change of clinical efficacy associated with herb processing.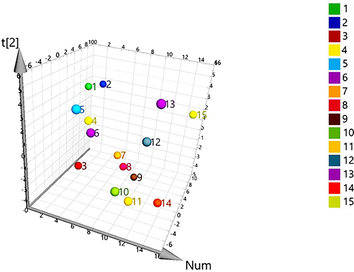
Partial least squares discriminant analysis (PLS-DA) 3D score scatter plot for 15batches of raw VN.
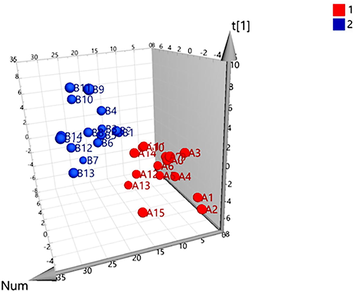
Partial least squares discriminant analysis (PLS-DA) 3D score scatter plot for raw (1) and processed VN. (2).
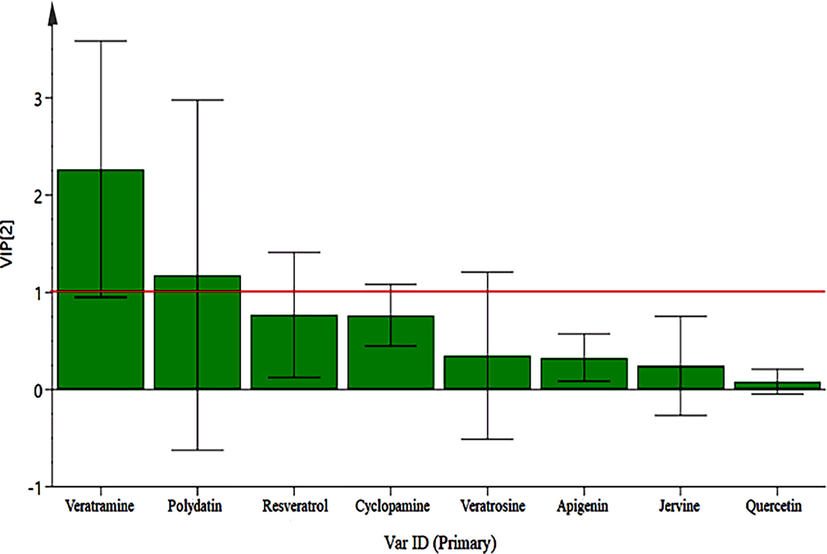
VIP plot of PLS-DA about raw and processed VN samples (1. Veratramine, 2. Polydatin, 3. Resveratrol, 4. Cyclopamine, 5. Veratrosine, 6. Apigenin, 7. Jervine, 8. Quercetin.).
4 Conclusions
In this study, a new method of fingerprint analysis combined with qualitative analysis was established to evaluate the quality of VN, the results of fingerprint showed that the 15 batches of samples contained 22 common peaks and their similarity results were>0.963. The chromatographic data of multiple fingerprints of VN were balanced and analyzed by chemometric methods including HCA, PCA and PLS-DA. The results of the three analyses were validated against each other, which systematically explained the intrinsic quality characteristics of VN. Further analysis of PLS-DA indicated that potential chemical markers for the classification of VN from different origins were veratramine, veratroylzygadenine, jervine, solanidine, veratrosine and cucurbitacin B. In addition, 8 bioactive compounds in VN samples were quantified by UPLC-MS/MS, of which veratramine and polydatin were identified, based on PLS-DA, as key compounds that can be helpful to distinguish between raw and processed VN samples. The methods, combining UPLC-Q-TOF/MS, fingerprint and UPLC-MS/MS, are established for the identification of raw VN and its processed products, which provided the basis for the quality evaluation of VN.
CRediT authorship contribution statement
Guangzhe Yao: Methodology, Data curation, Software, Writing – original draft. Mengxuan Wu: Methodology, Data curation, Software. Minglei Ge: Methodology, Data curation, Software. Mengmeng Zhang: Methodology, Data curation, Software. Xiunan Cao: Methodology, Data curation, Software. Yameng Zhu: Methodology, Data curation, Software. Shujie Wei: Methodology, Data curation, Software. Yanxu Chang: Writing – review & editing. Huizi Ouyang: Writing – review & editing. Jun He: Conceptualization, Funding acquisition, Project administration, Supervision.
Acknowledgment
This study was supported by National Natural Science Foundation of China (81673824).
Declaration of Competing Interest
The authors declare that they have no known competing financial interests or personal relationships that could have appeared to influence the work reported in this paper.
References
- High-performance liquid chromatography with fluorescence detection fingerprinting combined with chemometrics for nut classification and the detection and quantitation of almond-based product adulterations. Food Control.. 2020;114:107265
- [CrossRef] [Google Scholar]
- Qualitative and quantitative analysis of sesquiterpene lactones in Centipeda minima by UPLC–Orbitrap–MS & UPLC-QQQ-MS. J. Pharm. Biomed. Anal.. 2019;174:360-366.
- [CrossRef] [Google Scholar]
- The composition differences between small black beans and big black beans from different habitats and its effects on the processing of Polygonum multiflorum. Phytochem. Anal.. 2020;32(5):767-779.
- [CrossRef] [Google Scholar]
- Analysis of the high-performance liquid chromatography fingerprints and quantitative analysis of multicomponents by single marker of products of fermented Cordyceps sinensis. J. Anal. Methods Chem.. 2018;2018:1-9.
- [CrossRef] [Google Scholar]
- Cong, Y., Zhou, Y. B., Chen, J., Zeng, Y. M., Wang J. H., 2008. Alkaloid profiling of crude and processed Veratrum nigrum L. through simultaneous determination of ten steroidal alkaloids by HPLC–ELSD. Journal of Pharmaceutical and Biomedical Analysis. 48 (3),573-578. https://doi.org/10.1016/j.jpba.2008.05.023.
- UPLC-MS/MS method for the simultaneous quantification of eight compounds in rat plasma and its application to a pharmacokinetic study after oral administration of Veratrum (Veratrum nigrum L.) extract. BioMed. Res. Int.. 2020;2020:1-9.
- [CrossRef] [Google Scholar]
- Characterization and identification of isoflavonoid glycosides in the root of Spiny restharrow (Ononis spinosa L.) by HPLC-QTOF-MS, HPLC–MS/MS and NMR. J. Pharma. Biomed. Anal.. 2016;123:74-81.
- [CrossRef] [Google Scholar]
- UPLC-QqQ-MS/MS-based phenolic quantification and antioxidant activity assessment for thinned young kiwifruits. Food Chem.. 2019;281:97-105.
- [CrossRef] [Google Scholar]
- Comprehensive target analysis for 484 organic micropollutants in environmental waters by the combination of tandem solid-phase extraction and quadrupole time-of-flight mass spectrometry with sequential window acquisition of all theoretical fragment-ion spectra acquisition. Anal. Chem.. 2019;91(12):7749-7755.
- [CrossRef] [Google Scholar]
- 1H HRMAS-NMR based metabolic fingerprints for discrimination of cheeses based on sensory qualities. Saudi J. Biol. Sci.. 2020;27(6):1446-1461.
- [CrossRef] [Google Scholar]
- Steroidal alkaloids from Veratrum nigrum enhance glucose uptake in skeletal muscle cells. J. Nat. Prod.. 2015;78(4):803-810.
- [CrossRef] [Google Scholar]
- Two new steroidal alkaloids from the rhizomes of Veratrum nigrum L. and their anti-TYLCV activity. Fitoterapia. 2020;147:104731
- [CrossRef] [Google Scholar]
- Lin, H.Y., Lin, T.S., Wang, C.S., Chien, H.J., Juang, Y.M., Chen, C.J., Lai, C.C. Rapid determination of bioactive compounds in the different organs of Salvia Miltiorrhiza by UPLC-MS/MS. Journal of Chromatography B. 1104, 81–88, https://doi.org/10.1016/j.jchromb.2018.11.006.
- Veratri Nigri Rhizoma et Radix (Veratrum nigrum L.) and its constituent jervine prevent adipogenesis via activation of the LKB1-AMPKα-ACC axis in vivo and in vitro. Evid.-Based Complement. Altern. Med.. 2016;2016:1-12.
- [CrossRef] [Google Scholar]
- An integrated approach for efficient and accurate medicinal cuscutae semen identification. Plants. 2020;9(11):1410.
- [CrossRef] [Google Scholar]
- Identification of candidate genes involved in steroidal alkaloids biosynthesis in organ-specific transcriptomes of Veratrum nigrum L. Gene. 2019;712:143962
- [CrossRef] [Google Scholar]
- An approach based on HPLC-fingerprint and chemometrics to quality consistency evaluation of Matricaria chamomilla L. commercial samples. Front. Plant Sci.. 2016;7
- [CrossRef] [Google Scholar]
- Discovery of discriminatory quality control markers for Chinese herbal medicines and related processed products by combination of chromatographic analysis and chemometrics methods: radix Scutellariae as a case study. J. Pharm. Biomed. Anal.. 2017;138:70-79.
- [CrossRef] [Google Scholar]
- Application of 1H-NMR based metabolite fingerprinting and chemometrics for authentication of Curcuma longa adulterated with C. heyneana. J. Appl. Res. Med. Aromat. Plants. 2019;13:100203
- [CrossRef] [Google Scholar]
- Thermal effects on the dissolution enhancement of Radix scutellariae by wine-processing. Appl. Therm. Eng.. 2016;103:522-527.
- [CrossRef] [Google Scholar]
- Multiple-fingerprint analysis of Poria cocos polysaccharide by HPLC combined with chemometrics methods. J. Pharma. Biomed. Anal.. 2021;198:114012
- [CrossRef] [Google Scholar]
- Qualitative and quantitative analysis of major triterpenoids in Alismatis Rhizoma by high performance liquid chromatography/diode-array detector/quadrupole-time-of-flight mass spectrometry and ultra-performance liquid chromatography/triple quadrupole mass spectrometry. Molecules. 2015;20(8):13958-13981.
- [CrossRef] [Google Scholar]
- Zhao, H., Lai, C., Yu, Y., Wang, Y., Zhao, Y.J., Ma, F., Hu, M., Guo, J., Wang, X., Guo, L. Acidic hydrolysate fingerprints based on HILIC-ELSD/MS combined with multivariate analysis for investigating the quality of Ganoderma lucidum polysaccharides. Int. J. Biol. Macromol., 163, 476–484, https://doi.org/10.1016/j.ijbiomac.2020.06.206.
- Pharmacokinetics and enterohepatic circulation of jervine, an antitumor steroidal alkaloid from Veratrum nigrum in rats. J. Pharma. Anal.. 2019;9:367-372.
- [CrossRef] [Google Scholar]
- Chemometric analyses for the characterization of raw and processed seeds of Descurainia sophia (L.) based on HPLC fingerprints. J. Pharm. Biomed. Anal.. 2015;111:1-6.
- [CrossRef] [Google Scholar]


