

Translate this page into:
Rice husk silica as a sustainable filler in the tire industry
⁎Corresponding author. mahmoodbarani7@gmail.com (Mahmood Barani), narendrapalsingh14@gmail.com (Narendra Pal Singh Chauhan)
-
Received: ,
Accepted: ,
This article was originally published by Elsevier and was migrated to Scientific Scholar after the change of Publisher.
Peer review under responsibility of King Saud University.
Abstract
In this paper, we studied commercially available precipitated rice husk silica (RHS) with conventional precipitated silica, which has nearly the same surface area, and replaced part of the carbon black with RHS and conventional silica in a basic tread formulation. All formulations were mixed with the same amount of filler during the study. Silica was used at 15, 30 and 50 phr loading, and part of the carbon black was replaced by silica. Compound curing characteristics, physical properties, rebound resilience, heat generation, abrasion loss, dynamic properties and morphology were analyzed. The results indicated that RHS demonstrated compound properties comparable to those of conventional silica. As part of the carbon black was replaced with conventional silica, a slower cure rate, higher rebound resilience, lower heat generation, lower abrasion loss, and lower tan delta were observed with no significant change in physical properties, but some changes in physical properties were observed using one way ANOVA analysis. We found the same trend when replacing part of the carbon black with RHS, such as a slower cure rate, higher rebound resilience, lower heat generation, lower abrasion loss, and lower tan delta with no significant change in physical properties, but some changes in physical properties were observed using one way ANOVA. This sustainable material could be used to replace conventional silica in tire compounding, as well as to replace a portion of carbon black with RHS for improved heat build-up, rolling resistance, and abrasion loss.
Keywords
Conventional silica
Filler
Rice husk silica
Rubber compound
Sustainable

1 Introduction
The rubber compound is made mostly with carbon black filler, and carbon black is the petroleum derivation product (Kundu, 2000). Its use has numerous drawbacks, including scarcity, high cost, higher hysteresis, and nonrenewable products (Choi et al., 2003).
To make green tires, carbon black has been replaced with silica over the last decade. It has lower rolling resistance, better durability and a wet grip (Li et al., 2013). However, because of the large number of silanol functional groups on the surface, dispersion and processing of silica is more difficult than with other fillers (Flory and Rehner Jr, 1943, Choi et al., 2004). Bis-[3-(triethoxysilyl)propyl] tetrasulfide (TESPT) is commonly used as a silane coupling agent to improve dispersion (Moresco et al., 2020).
Rice is one of the most important food crops. It is the agricultural commodity with the fourth-highest worldwide production (rice paddy, 755.5 million metric tonnes in 2019), followed by sugarcane (1949.3 milliontonnes), maize (1148.5 milliontonnes), and wheat (765.8 million tonnes) (Adeyeye, 2020). Approximately 22% of the weight of rice husk is generated during rice milling, and rice husk is an important type of agricultural residue that is used as biomass. Biomass is one of the most promising energy carriers and has the potential to play a significant role in environmentally friendly energy utilisation (Shen et al., 2021). A new type of silica has been studied as a sustainable material. Rice husks are of great interest to research because of their very high amounts of ash and silica (Punsuvon et al., 2008). Rice husk is mainly used for energy generation, resulting in ash. When the rice husk is burned for energy, approximately 17% of the ash is produced. This ash contains approximately 94% silica. The use of this ash in a synthetic process produced silica. During the present study, we used nearly the same surface area of both silica samples to better understand the material's properties.
If this rice husk ash (RHA) is not used, it will result in massive waste, environmental pollution, and energy loss. As a result, determining the usefulness of RHA is absolutely essential. Since carbon black and silica are the main components of RHA, they are used as fillers in polymer materials (Ji et al., 2020). In the other hand, nanomaterials and specially nanofluids gained lots of intrest in recent years. Natural rubber compounds containing both grades of RHA filler (low and high carbon content) and different loadings were studied and compared to commercial fillers (carbon black and silica) and found to have inferior mechanical properties (Sae-Oui et al., 2002). As a result, many studies have focused on RHA as a source of silica (Ahmed and Adam, 2009). RHS has the potential to be used as a sustainable filler in rubber compounds (Chandrasekhar et al., 2005).
There are few papers on rice husk ash and the replacement of carbon black with conventional silica. To the best of our knowledge, no report exists that substitutes conventional silica with RHS or a part of carbon black with RHS as a filler in natural rubber-based dual filler tire tread compounds. In this study, we investigated commercially available RHS as a sustainable filler in a natural rubber-based tire tread compound. The synthetic route was used to prepare RHS from rice husk ash.
2 Materials and methods
2.1 Materials
Natural rubber (92 ML 1 + 4 at 100 °C) was procured from R1 International, Thailand. The goal of using this polymer is to provide greater strength while reducing rolling resistance. Carbon black (BKT Carbon, India) is used as a reinforcing filler in rubber compounds, while conventional silica (Madhu silica Pvt. Ltd., India) is used as a filler to improve tire wet grip and rolling resistance. Rice husk silica was a renewable and sustainable material, and Si69 (bis(triethoxysilylpropyl)tetrasulfide, Lanxing Chemical Ltd., India) was used to improve silica dispersion. Zinc oxide (Singhal Commodities, India) as an activator, stearic acid (Godrej Industries Limited, India) as a co-activator which disperse the activator in rubber matrix, sulfur (Standard Chemical, India) as a vulcanizing agent, TBBS(N-tert-butyl-2-benzothiazyl sulfenamide, Shandong Sunshine Chemical Co. Ltd., China) as a primary accelerator to increase the rate of vulcanization, peptizol-11 (mixture of 2-2′ dibenzamidodiphenyl disulfide, kaolin, stearic acid, mineral oil and activators, Acmechem, India) as a peptizer to reduce the mooney viscosity of compound, microcrystalline wax (Raj Petro, India) as an antidegradent during static condition, 6-PPD (N-(1,3-dimethylbutyl)-N'-phenyl-p-phenylenediamine, Sennics Co. Ltd., China) as an antidegradent during dynamic condition, DPG (diphenyl guanidine, Shandong Sunshine Chemical Co. Ltd., China) as secondary accelerator which gives synergetic effect with presence of primary accelerator to increase rate of vulcanization, were used. All the materials are commercial grades.
2.2 Preparation of rubber compounds
The mixing was done with a Banbury mixer (HF Mixing Group, Germany), which has a two-wing tangential rotor and a capacity of 1.6 L. Depending on Mooney viscosity, each batch was mixed in three to four stages. Stage 1 mixing was carried out with a variable rotor speed starting at 85 rpm and a temperature control unit (TCU) set at 50 °C. By adjusting the rotor speed(in rpm), the mixing temperature was kept at 145–150 °C for two minutes. To achieve a good silanization reaction with the surface hydroxyl group of silica, the mixing temperature, mixing time, and ethanol removal are critical conditions (Suzuki et al., 2002).
Stage 2 mixing was carried out by using variable rotor speed, starting from 70 rpm with a TCU set at 50 °C. The mixing temperature was maintained at 145–150 °C for one minute by adjusting the rotor speed (in rpm).
Stage 3 (Re-Mill) mixing was performed at variable rpm to maintain the same viscosity in all formulations. The discharge temperature was maintained at 120 °C. Our goal was to achieve the same level of viscosity so that subsequent processing of rubber compounds would be consistent from formulation to formulation. This stage revealed when and where viscosity was high in the compound.
Stage 4 The final mixing stage was carried out at a constant rotor speed of 40 rpm and a TCU temperature of 50 °C, with the addition of sulfur, accelerator, and rubber compound. The temperature of the discharge was 98–103 °C. Table 1 depicts the mixing procedure for each stage.
Stage 1
Time (seconds)
Actions
0
Loading of raw rubber, Silica, Silane coupling agent, Part carbon black, Peptizol and ram down
45
Ram sweeping and ram down
80–130
Ram sweeping and ram down
240–455
Extra mix and Dump (Dump temperature: 145–150 °C)
Stage 2
0
Loading of first master batch (stage 1), remaining carbon black, ZnO, 6-PPD, MC Wax, Stearic acid and ram down
30–40
Ram sweeping and ram down
70–90
Ram sweeping and ram down
170–222
Extra mix and Dump (Dump temperature: 145–150 °C)
Stage 3
0
Loading of second master batch (stage 2) and ram down
90
Ram sweeping and ram down
120–360
Extra mix and Dump (Dump temperature: 120 °C)
Stage 4
0
Loading of second master batch (stage 2) or Remill (Stage 3) [where applicable], Sulfur, cure accelerators (TBBS, DPG) and ram down
90
Ram sweeping and ram down
180
Extra mix and dump (dump temperature: 98–103 °C)
2.3 Chemical characterization of conventional silica & rice husk silica
2.3.1 Surface area identification
ASTM D5604 was used to determine the single point B.E.T. (Consoli et al., 2019) (Brunauer, Emmett, and Teller) nitrogen surface area (NSA) of RHS and conventional silica. A Quantachrome NOVA 2200E BET, Boynton Beach, Florida, was used to calculate nitrogen surface area. At high temperatures (300 °C), the samples were vacuum-dried. At the nitrogen boiling point (196 °C) and a fractional saturation pressure of 0.30+/-0.01, the amount of gas adsorbed to the particle surface is estimated.
2.3.2 Particle size distribution
The laser scattering particle size distribution of RHS and conventional silica was determined by using a laser scattering particle size distribution analyzer from Horiba, Ltd., Japan (Model LA-96V2). ISO-13320 was used to determine the particle size distribution using the static light scattering particle sizing technique. Suspension of silica was prepared by 1 wt% silica powder dispersed in 100 mL deionized water. Sodium hexametaphosphate (1 wt%) was used as a dispersing agent. 1–2 drops of nonionic surfactant was used as a stabilizer. Sonication was performed for 10 min using a probe sonicator from Cole Parmar, USA (500 Watt).
2.3.3 Morphology
The morphology of the RHS and conventional silica was determined using scanning electron microscopy (SEM) with a backscattered electron detector (BSD) by Carl Zeiss (Model EVO 18). The sample was properly dispersed in a suitable solvent (acetone) using an ultrasonicator for approximately 15 min and then dried in an oven at 70 °C for 10 min before the start of the test.
The morphology of the RHS and conventional silica was further studied using transmission electron microscopy (TEM) from Thermo Scientific (Model: TALOS F200S G2) at an operating voltage of 200 kV. Images were captured using TEM image and analysis (TIA) software. Sample preparation was incorporated as per ASTM D3849 by dispersion in toluene.
2.3.4 Fourier transform infrared
Fourier transform infrared (FTIR) spectroscopy was performed using an FTIR spectrometer from PerkinElmer (Model—Spectrum Two). Diffuse reflectance infrared Fourier transform spectroscopy was used for the analysis of conventional silica and RHS. KBr was used to dilute these materials.
2.3.5 Thermogravimetric analysis
Thermogravimetric analysis (TGA) is a thermal analysis process in which the mass of the sample is determined over time as the temperature changes. Thermal analysis of both silica samples was performed using a Perkin Elmer TGA instrument (Model TGA 8000) at temperature ranging from 50 °C to 650 °C in a nitrogen atmosphere at a heating rate of 10 °C/min, nitrogen was switched to oxygen, and the temperature range was set from 750 °C to 850 °C at the same heating rate.
2.3.6 pH
pH measurements were performed by using a pH meter from M/s Janki Impex Pvt. Ltd., India (Model: J55). ASTM D6739 was used to determine the pH of the aqueous solution of silica.
2.4 Characterization of rubber compounds
2.4.1 Mooney viscosity
The viscosity of rubber mixes was determined in an EKT-2003M Mooney viscometer (Ektron Tek company Ltd., Taiwan) using a large rotor (ML) at 100 °C and a test time of 5 min with 1 min of preheating according to the guidelines of ASTM D1646 (Jang, 2019).
2.4.2 Cure characterization
The rheometric properties were characterized by using a rubber process analyzer (model, RPA 2000 from Alpha Technologies, USA). ASTM D5289 was used to determine the curing properties of rubber compounds at 150 °C for 60 min (Hashemi et al., 2020, Sheng et al., 2021). The optimum cure time (tc90) is the time corresponding to an optimum torque in the rheograph. Optimum torque is measured by using Eq. (1).
The cure rate index (CRI) of the compound was calculated by using Eq. (2):
2.4.3 Payne effect
The storage modulus (G’) of rubber green compound with curative was determined using a rubber process analyzer (model, RPA 2000 from Alpha Technologies, USA) at a temperature of 100 °C, frequency of 2 Hz, and varying strain from 0.560% to 100%. The Payne effect was measured by the difference in storage modulus (G’) at low strain (0.560%) and higher strain (100%).
2.4.4 Crosslink density
Cured rubber compounds were used to determine crosslink density (CLD), referred to as ASTM D6814. Samples were poured in toluene solvent for 72 h at room temperature (ASTM, 2018). The Flory-Rehner Eq. (3) was used to calculate the crosslink density.
Vr = volume fraction of polymer in a swollen network in equilibrium with pure solvent and is calculated as (Eq. (4)):
2.4.5 Physico- mechanical characterization
2.4.5.1 Physical propertiess
ASTM D3182 referred to curing the green rubber compounds using a steam heating hydraulic curing press (Santosh Rubber Machinery Pvt., Ltd., India). Compression molding techniques were used at 10 MPa molding pressure and 150 °C cure temperature. Tensile slabs of compounds were cured at twice the optimum cure time (2 × tc90). ASTM D412 referred to die out the tensile slabs in dumbbell-shaped specimens using a die cutter from Prolific, India. The tensile properties of dumbbell-shaped specimens were determined according to ASTM D412 using Instron UTM Model 5967 from the United States (Ercan Kalkan et al., 2020).
Multiunit hardness tester used to measure Shore A hardness of cured rubber dumbbell referring ASTM D2240 (Gibitre Instruments, Italy) (Jabez et al., 2021).
2.4.5.2 Rebound resilience
The rebound resilience of cured samples was determined according to ASTM D7121 (Patel et al., 2019). The rebound resilience tester used was procured from Zwick, Germany.
2.4.5.3 Heat build-up measurement
ASTM D623 was used to determine the heat build-up properties using a Goodrich Flexometer Model II supplied by Tech Pro (Shahin et al., 2020). Testing was carried out for 25 min, and the temperature rise at the base surface of the specimen (ΔT) was captured. Software (Flexometer, version 1.3.0) automatically displaced the delta temperature (the base temperature at 25 min – base temperature before the start).
2.4.5.4 Dynamic mechanical analysis
ASTM D5992 was used to measure the dynamic properties of cured rubber compounds under shear mode using a dynamic mechanical analyzer (Model DMA450 + from Metravib, France) (Esmaeeli et al., 2019).
2.4.5.5 Abrasion resistance
ASTM D5963 was used to measure the abrasion loss of the cured samples using Gibitre Instruments, Italy (Wang et al., 2019a,b).
2.5 Microscopy
The dispersion of silica was performed using TEM by thermo scientifically (Model: TALOS F200S G2). Identification of silica in the cured compound was performed using an EDX detector coupled with TEM. A thin section (approximately 60 nm) sample was prepared using the cryo ultramicrotome sample preparation technique.
Atomic force microscope (AFM) images were obtained using Park Systems (Model: NX 10, Operation Mode: NCM noncontact).
3 Results and discussion
3.1 BET surface area analysis
The BET surface area of the commercially available RHS was 104 m2/g, while that of conventional precipitated silica was 112 m2/g. Both surface areas were found to be almost comparable. However, RHS has a slightly lower surface area than conventional silica. Generally, a higher surface area of silica means higher dispersion. However, surface activity also has an impact on reinforcement properties (Jembere and Fanta, 2017). The number of silanol functional groups present on silica determines surface activity/reactivty. A greater number of functional groups results in greater rubber-filler interaction and dispersion, which increases reinforcing properties such as modulus.
3.2 Particle size distribution analysis
The particle size distribution curve is depicted in Fig. 1. The distribution curves for both silica samples were monomodal. The transformed distribution density represented in accordance with ISO9276-1 provided the differential size distribution on a log scale plot. The area under the curve represents the volume portion of size classes (Retamal Marín et al., 2018). The mean particle size diameter of RHS was found to be 5.66 µm, while that of conventional silica was 5.51 µm. Particle size and distribution of particle size were found to be comparable.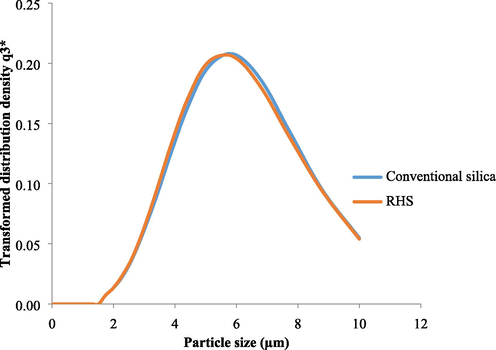
Particle size distribution of silica using light scattering.
3.3 Morphology
The SEM images are shown in Fig. 2. Both silica types were amorphous, and the agglomerate of RHS was more consistent and smaller in size than conventional silica. RHS has an irregular shape, whereas conventional silica is more spherical. Agglomeration of both conventional silica and RHS was due to hydrogen bonding between silanol groups on the surface of silica.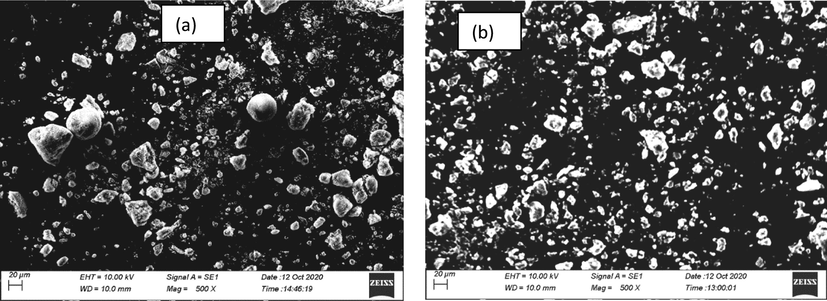
Morphology of silica by SEM (a) Conventional silica (b) Rice husk silic.
The TEM images are shown in Fig. 3. The boundaries of RHS were well-defined, whereas the boundaries of conventional silica were diffused. The silica particles were aggregated, and the mean aggregate diameter for conventional silica was found to be approximately 20 nm and 19 nm for RHS.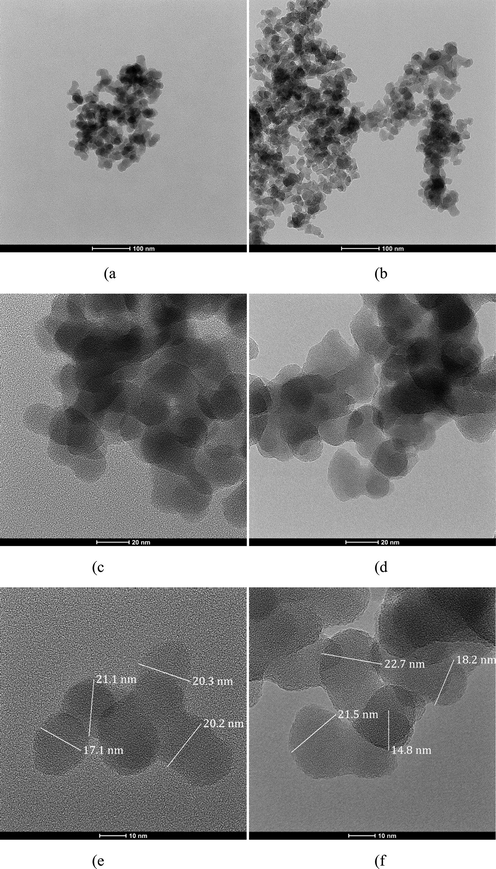
Morphology of silica by TEM (a) Conventional silica at 94,000× magnification, (b) Rice husk silica at 94,000× magnification, (c) Conventional silica at 390kx magnification, (d) Rice husk silica at 390kx magnification, (e) Conventional silica at 630kx magnification, (f) Rice husk silica at 630kx magnification.
3.4 FT-IR studies
FTIR spectra of RHS and conventional silica are shown in Fig. 4. The bands centered at 3363 cm−1 and 951 cm−1 were assigned to the SiO—H asymmetric stretching vibration and bending vibration, respectively. The predominant absorbance peak at 1075 cm−1 was denoted by the Si—O—Si asymmetric stretching vibration (Liu et al., 2011). The broad band between 2800 and 3750 cm−1 was due to silanol hydroxyl groups, and the absorbed water peak between 1200 and 1050 cm−1 was associated with Si—O—Si asymmetric band stretching and 790–815 cm−1 belonged to Si—O—Si stretching modes (Kamath and Proctor, 1998). The band located at 797 cm−1 was ascribed to the Si—O asymmetric stretching vibration and bending vibration, and the band at 1663 cm−1 was attributed to the H—O—H bending vibration.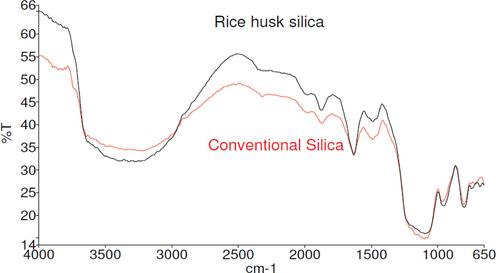
Fourier transform infrared (FTIR) spectra for rice husk silica and conventional silica.
3.5 TGA analysis
The TG-DTG thermograms from 30 °C to 850 °C at a heating rate of 10 °C/min for both conventional silica and RHS are depicted in Fig. 5. The weight loss of RHS up to 150 °C was 4.07%, whereas that of conventional silica was 2.68%. RHS showed higher weight loss than conventional silica up to 150 °C, which was attributedto the higher physisorbed water and residual organic solvent in RHS (Zhang et al., 2012). The degradation up to 180 °C wt. loss was attributed to the dehydroxylation process (Zhang et al., 2016). The hydroxyl group coupling on the SiO2 surface forms H2O, which then evaporates (dehydration). The desorption of physisorbed water was completed at 150 °C, followed by a weight loss region a broad due to the dihydroxylation process (Zburavlev, 2000). The weight loss of bare silica below 200 °C is 4.8%, which is attributed to physisorbed water and residual organic solvent.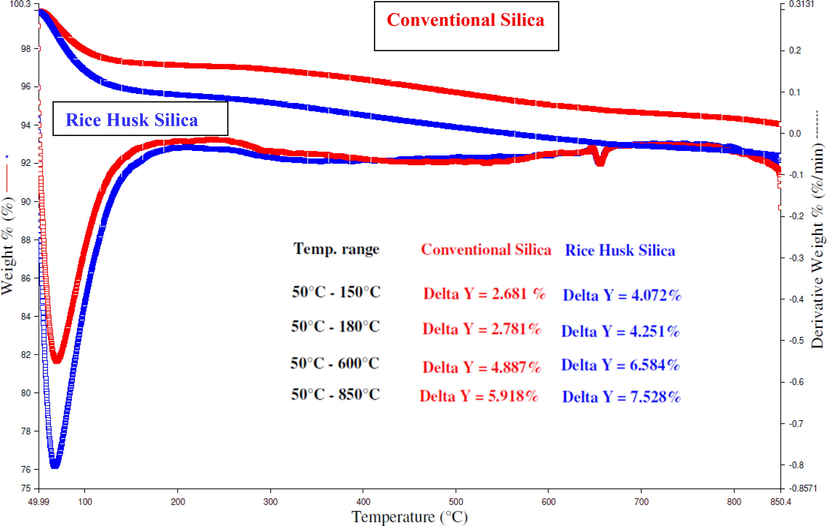
TG-DTG thermogram for conventional silica and rice husk silica.
3.6 pH
The pH of RHS was obtained in the same way as conventional silica. RHS was 6.6 pH, whereas conventional silica was 6.5 pH. Both silica were acidic. This affects the vulcanization characteristics of the rubber compound (Parmar et al., 2022). The higher pH of the material indicated a faster CRI in the rubber compound. However, the lower pH of the material has shown a slower CRI of the rubber compound.
3.7 Compound formulation and its Mooney viscosity and curing characteristics
Table 2 shows the basic formulation of Tire Tread, which has a binary filler system. The amount of materials used in any rubber compound formulation is calculated based on phr. As a result, the rubber phr should always be 100. NR is used to achieve desirable tread properties such as higher strength, low rolling resistance, and low heat build up, among others. As reinforcing fillers, carbon and silica are both used. Silica is used to achieve low heat buildup, low rolling resistance, low cut and chip, and improved wet grip. In general, total filler loading in tread formulations ranges from 40 to 80 phr. In our recipe, we kept the total filler loading as low as possible to achieve balanced properties. Si69 is used to improve silica dispersion, processing, and reduce re-agglomeration in rubber compounds. It is recommended to use 10% silica. The recommended dose of ZnO is 5phr of NR-based compound. Stearic acid is commonly used as 50% of the ZnO dose. The antidegradant dose and type are determined by the application of the tyre (car tire, off the road (OTR) tire, etc.) and tire components (tread, base, sidewall, inner component, etc.). Sulphur is used as a vulcanizing agent in unsaturated rubbers such as NR, poly butadiene rubber (PBR), and styrene butadiene rubber (SBR) (SBR). The accelerator is used to speed up the vulcanization process. Sulfur, accelerator dosage, and accelerator type are determined by the required physical and process properties. Abbreviations: NR, natural rubber; MC Wax, Microcrystalline Wax; ZnO, Zinc oxide; 6-PPD, N-(1,3-Dimethylbutyl)-N'-phenyl-p-phenylenediamine; TBBS, N-tert-butyl-2-benzothiazyl sulfenamide; DPG, diphenyl guanidine.
Ingrediets (phra)
Si-15
RHS-15
Si-30
RHS-30
Si-50
RHS-50
NR
100.000
100.000
100.000
100.000
100.000
100.000
Conventional silica
15.000
0.000
30.000
0.000
50.000
0.000
Rice Husk Silica
0.000
15.000
0.000
30.000
0.000
50.000
Si69
1.500
1.500
3.000
3.000
5.000
5.000
Carbon black
45.000
45.000
30.000
30.000
10.000
10.000
Peptizol-11
0.150
0.150
0.150
0.150
0.150
0.150
M C Wax
2.500
2.500
2.500
2.500
2.500
2.500
ZnO
5.000
5.000
5.000
5.000
5.000
5.000
Stearic acid
2.5
2.5
2.5
2.5
2.5
2.5
6-PPD
3.000
3.000
3.000
3.000
3.000
3.000
Sulphur
1.500
1.500
1.500
1.500
1.500
1.500
TBBS
1.200
1.200
1.200
1.200
1.200
1.200
DPG
0.300
0.300
0.300
0.300
0.300
0.300
Table 3 displays its rheometric properties and Mooney viscosity. At 60 phr, the total amount of filler remained constant in all formulations. As a result, we can make a more accurate comparison of RHS to conventional silica. We compared the two types of silica at 15 phr (Si-15 and RHS-15). RHS seemed to have MH, ts2, tc90, and CRI values that were comparable to those of conventional silica. For a better understanding, higher phr loadings of both silica (Si-30, RHS-30, Si-50, and RHS-50) were used. The same trend has been observed at higher silica phr loadings. At 30 and 50 phr loading, RHS has comparable rheometric properties. Fig. 6 depicts the rheograph of all formulations.
Ingredients (phra)
Si-15
RHS-15
Si-30
RHS-30
Si-50
RHS-50
Mooney Viscosity @ 100 °C
ML(1 + 4)@100 °C
63
63
60
62
59
62
Rheometric properties @ 150 °C/1 hr
Minimum Torque [dN m]
2.75
2.85
2.41
2.43
2.21
2.33
Maximum Torque [dN m]
22.75
22.96
22.24
22.24
23.29
22.85
ts2 [min]
4.72
4.48
4.96
4.71
5.11
5.00
tc90 [min]
16.25
16.02
21.85
21.51
27.54
28.75
MH-ML [dN m]
20.00
20.11
19.83
19.81
21.07
20.52
CRI [min−1]
8.67
8.67
5.92
5.95
4.46
4.21
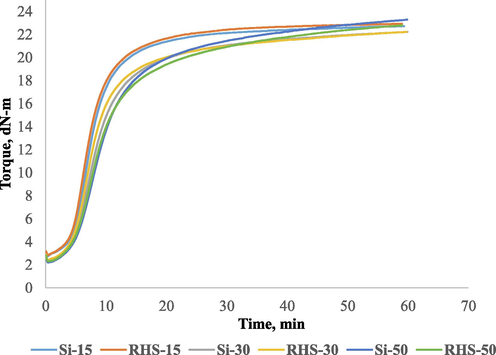
Rheogrphs of conventional silica and rice husk silica compounds.
When we replaced some of the carbon black (15 and 35 phr) with conventional silica. Slightly scorch safety (ts2) increased with more conventional silica (Si-30), and an optimum curing time (tc90) also increased with a reduced CRI. As silica increased from 30 phr to 50 phr (Si-30 & Si-50), ts2 and tc90 further increased with the reduction of CRI. This was because the pH of silica was lower than that of carbon black. As silica increased,the mean lower pH material doses increased so that ts2 and tc90 further increased with reducing CRI. The active surface of silica was also responsible for giving higher ts2. As the active surface of silica increased,the adsorption of the catalyst by silanol groups on the silica surface subsequently increased, resulting in a higher scorch time (Zafarmehrabian et al., 2012, Wang et al., 2019a,b).
The Scorch time is not increased significantly when the conventional silica was increased, but tc90 increased significantly, causing the CRI to decrease significantly. The results are shown in Table 3. We have not observed any significant difference in the maximum torque of the compounds (Si-15, Si-30, and Si-50). Fig. 6 shows the Rheograph. We used the same amount of RHS to replace the carbon black (15 and 35 phr). The same observation was made when a portion of the carbon black was replaced with conventional silica. A slight increase in scorch safety (ts2) was observed with more RHS (RHS-30), and an optimum curing time (tc90) was also significantly increased with a decrease in CRI. As the RHS increased from 30 phr to 50 phr (RHS-30 and RHS-50), ts2 and tc90 increased further with the reduction in the CRI. Furthermore, as the amount of RHS increases, the scorch time does not increase significantly, but tc90 increases significantly, causing the CRI to decrease significantly. The results are shown in Table 3. We found no significant difference in the maximum torque of the compounds (Si-15, Si-30, and Si-50).The rheograph is shown in Fig. 6.
Mooney viscosity of compounds is shown in Table 3. We maintained the final viscosity at the same level (59–63 MV) of all compounds by using the Re-Mill stage (Stage 3), which was required to avoid further processing variations in compounds.
3.8 Cross-link density (CLD)
CLD is depicted in Table 4. We compared the compound mixed with conventional silica versus RHS. RHS-15 showed almost the same CLD as Si-15. RHS-50 showed the same CLD as Si-50. This was because both silica have almost the same surface area, comparable particle size and comparable distribution of particle size. This was also confirmed by statistical analysis using the one-way anova technique (JMP software). The confidence level is consider as 95%. There is no significant difference between CLD of Si-15 and RHS-15 and also between Si-30 and RHS-30. There was significant difference between cross link density of Si-50 and RHS-50. p-value is higher than 0.05 indicates no significant difference in the results.
Test Parameters
Si-15
RHS-15
Si-30
RHS-30
Si-50
RHS-50
Cross link density [ mol/m3]
1.002
1.011
1.147
1.148
1.344
1.286
Hardness [Shore A]
72
71
73
73
72
72
Abrasion loss [mm3]
97
99
91
94
89
90
We replaced some of the carbon black with conventional silica. It was observed that CLD slightly increased with increasing silica doses. Si-15 showed slightly lower CLD than Si-30. Si-30 showed slightly lower CLD than Si-50. Basis on the experience we can say no significant change in the cross-link density of the compound after replacing 15 phr carbon black with conventional silica (Si-15 and Si-30). When we compared Si-15 and Si-50, we observed a higher CLD in Si-50 than in Si-15. This also favored a higher MH-ML of Si-50 compared to Si-15. It was also confirmed by using one way analysis technique. We cannot conclude that there has been no significant change in between Si-15 and Si-30. The CLD of Si-15 and Si-30, Si-15 and Si-50, and Si-30 and Si-50 changed significantly. When we replaced the part carbon black with RHS. CLD has been observed to increase slightly with increasing RHS doses. RHS-15 had a CLD that was slightly lower than RHS-30. RHS-30 had a CLD that was slightly lower than RHS-50. When we compared RHS-15 and RHS-50, we observed that RHS-50 had a higher CLD than RHS-15. RHS-50 had a higher MH-ML than RHS-15. It was also confirmed using one way analysis technique. From that we can not say no significant change in RHS-15 and RHS-30. There was significant change in CLD between RHS-15 and RHS-30, RHS-15 versus RHS-50 and also between RHS-30 and RHS-50.
3.9 Payne effect
To determine the level of filler interactions, a change in storage modulus from lower strain (0.56%) to higher strain (100%) was measured as the Payne effect (Payne, 1966). A large difference from the G’@0.56% to G’@100% strain indicated a higher Payne effect, indicating a higher degree of filler interaction. Fig. 7 shows that the Payne effect of rubber compounds increased when increasing the carbon black dose. Si-15 showed higher Payne effect than the Si-30. Si-30 showed higher Payne effect than Si-50. This is because of the lower particle size and high surface area of black with a narrow filler particle–particle distance, which favors filler network formation and increases the Payne effect (Sattayanurak et al., 2020). RHS also showed the same trend as conventional silica. RHS-50 showed a lower Payne effect than RHS-30. RHS-30 showed a lower Payne effect than RHS-15. RHS-15 showed a comparable Payne effect with Si-15. RHS-30 showed a comparable Payne effect with SI-30. RHS-50 shows a slightly higher Payne effect than Si-50. However, we can say that RHS compounds show Payne effects comparable to those of conventional silica compounds at the same silica/carbon ratio. The lower silica compound showed a higher storage modulus at low strain and a lower storage modulus at high strain. Si-15 showed a higher storage modulus at a lower strain than Si-30, and Si-30 showed a higher storage modulus than Si-50. The RHS compound also showed the same trend as the conventional silica compound. RHS-15 showed a higher storage modulus than RHS-30. RHS-30 was shown higher than RHS-50. The higher storage modulus at the low strain in higher carbon compound because of high surface area carbon black used. The variation in storage modulus with strain amplitude also depends on its microstructure (Ponnamma et al., 2014, Sadasivuni et al., 2014, Ning et al., 2021).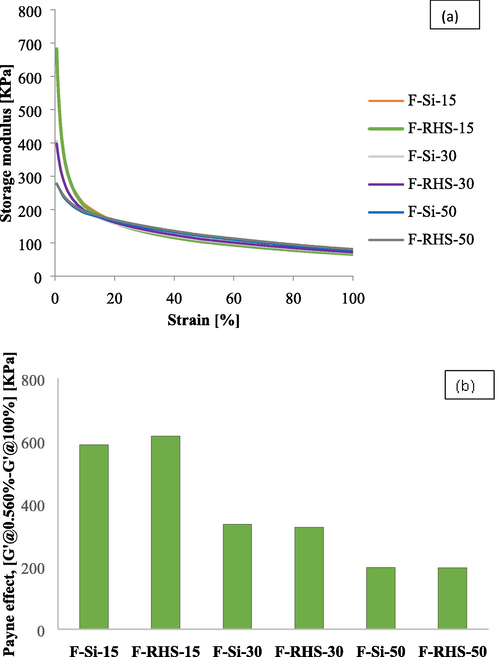
Effect of storage modulus as a function of strain (a) and Payne effect (b) of RHS and conventional silica compound.
3.10 Physico-mechanical characteristics
3.10.1 Physical properties
The unaged physical properties of the compounds are shown in Fig. 8. We compared the compound made with conventional silica to RHS at 15 phr loading (Si-15, RHS-15). RHS-15 showed a modulus @ 300%, tensile strength, and elongation at break comparable to those of Si-15. This was confirmed statistically using the one way anova analysis technique. The level of confidence is set at 95 %. There is no significant difference in the physical properties of Si-15 and RHS-15 (modulus @ 300 %, tensile strength, and elongation at break).P-value was found more than 0.05. A p-value greater than 0.05 indicates that there is no significant difference in the results. When we investigated higher silica loading. We revealed the same result with a lower amount of silica. With Si-30 and Si-50, RHS-30 and RHS-50 have comparable modulus at 300 %, tensile strength, and elongation at break. It was also confirmed using one way anova analysis. There was no significant difference in physical properties between Si-30 and RHS-30 and also for Si50 and RHS-50. P-value shown higher than 0.05. This was because both silica have almost the same surface area, comparable particle size and comparable particle size distribution.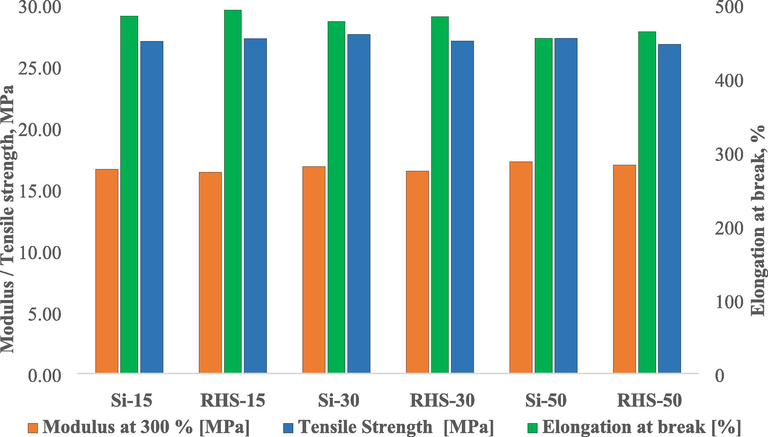
Mechanical properties of rice husk silica and conventional silica compounds.
As we replace part of the carbon black with conventional silica, it was found that Si-15 has comparable modulus @ 300% and tensile strength compare to Si-30 and Si-50, but the elongation at break decreased as the silica content increased. Si-30 had a slightly lower elongation at break than Si-15. Si-50 has a slightly lower elongation at break than Si-30. In one way anova analysis, there was no significant difference in elongation at break between Si-15 and Si-30, Si-30 and Si-50, but there was a significant difference between Si-15 and Si-50. There was no significant difference in modulus @ 300 % between Si-15 and Si-30, but there was a significant difference between Si-15 and Si-50 and Si-30 and Si-50. There was no significant difference in tensile strength between Si-15 and Si-30, Si-15 and Si-50 and also for Si-30 and Si-50.
As we replaced the part carbon black with RHS, the same observation as that of replacing part of the carbon black with conventional silica. The modulus at 300 % and tensile strength of RHS-15 were comparable to those of RHS-30 and RHS-50, but the elongation at break decreased as silica content increased. RHS-30 has showed slightly less elongation at break than RHS-15. RHS-50 has showed slightly less elongation at break than RHS-30. In one way anova analysis, we found same trend in modulus at 300% and tensile strength as replacing part carbon black with conventional silica. There was no siginificant difference in modulus @ 300% between RHS-15 and RHS-30 but found siginificant difference in case of RHS-15 versus RHS-50 as well as RHS-30 versus RHS-50. There was no significant difference in tensile strength between RHS-15 and RHS-30 as well as RHS-15 versus RHS-50 as well as RHS-30 and RHS-50. In case of elongation at break, we foud different observation as that of replacing part carbon black with conventional silica. There was no significant difference in elongation at break in between RHS-15 and RHS-30, RHS-15 and RHS-50 and also for RHS-30 and RHS-50 (see Supplementary file Fig. S1 to S4). The hardness of the compound is shown in Table 4. All of the compounds showed almost the same hardness.
3.10.2 Rebound resilience
Rebound resilience is shown in Fig. 9. RHS-15 revealed comparable 100 °C rebound resilience to Si-15. RHS-30 has comparable rebound resilience to Si-30. RHS-50 has comparable rebound resilience to Si-50. We found no change in rebound resilience when replacing conventional silica with RHS.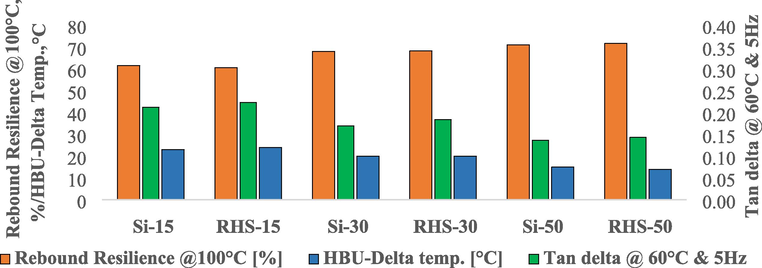
Rebound resilience at 100 °C, heat build-up and tan delta at 60 °C of rice husk silica and conventional silica compounds.
When replacing part of the carbon black with conventional silica, we found that increasing the content of silica in the formulation shows increasing rebound resilience. Si-50 has a higher rebound resilience than Si-30. Si-30 unveiled a higher resilience of rebound than Si-15. When replacing part of the carbon black with RHS, the results showed that increasing the RHS content in the formulation showed increasing rebound resilience. RHS-50 has a higher rebound resilience than RHS-30. RHS-30 has a higher rebound resilience than RHS-15.
3.10.3 Heat build-up
The RHS compound showed a heat build-up comparable to that of the conventional silica compound at the same phr loading of silica (15, 30 and 50 phr of silica). The results are shown in Fig. 9. When we replace part of the carbon black with conventional silica. We observed that the heat build-up decreased with an increase in the silica content. Si-50 revealed a lower build-up of heat than Si-30. Si-30 revealed a lower build-up of heat than Si-15. The heat build-up property is the laboratory parameter used to predict the heat generation of tire compounds in services. The heat build-up results favor 100 °C rebound resilience. We can say that higher silica compounds will provide lower heat generation in service.
When replacing part of the carbon black with RHS, the same trend was observed as replacing part of the carbon black with conventional silica. RHS-50 has a lower heat build-up than RHS-30. RHS-30 has a lower heat build-up than RHS-15. With increasing content of silica in the total mass of the filler, with a decreasing tendency of heat build-up (Al-Hartomy et al., 2016). This was due to less deformation of the silanized silica sample under constant load. Hybrid filler compounds also have a lower temperature increase than expected under the mixing rule (Yadollahi et al., 2018).
3.10.4 Dynamic mechanical analysis
When dynamic mechanical properties were tested, the RHS compound showed tan delta comparable to conventional silica compounds in the same phr loading of silica. When replacing the carbon black part with conventional silica. We observed a higher silica content compound that showed a lower tan delta than a lower silica content compound. The results are shown in Fig. 9. Si-15 showed a tan delta higher than Si-30. Si-30 showed a higher tan delta than Si-50. The tan delta was lowered at 60 °C, and the rolling resistance of the tire was lowered (Chundawat et al., 2020). Silica or carbon black/silica blend compounds produce lower tan delta (at 60 °C) than those containing only carbon black compounds. The lowering of tan delta at 60 °C with increasing silica content and reducing the carbon content in compound because of adherence of rubber molecule on to the carbon black surface is mainly taking place in the form of physical adsorption, i.e., mainly physical interaction between carbon black and rubber. In the silica/silane system, chemical bonds occur between silica and rubber. Under dynamic deformation conditions, when rubber molecules with only physical interactions are detached and reattached to the filler surface, the compounds with more of the physical interactions create higher energy losses and thus higher tan delta at 60 °C. Furthermore, part of the rubber was chemically immobilized on the surface of silica and therefore could not be removed even under higher stress (Nordsiek, 1985). These lower tan delta (at 60 °C) compounds would have lower rolling resistance and lower fuel consumption in the tire (Dominic et al., 2020).
3.10.5 Abrasion loss
Abrasion loss is a laboratory predictor of the properties of wear. We compared the RHS compound to the conventional silica compound with the same phr silica loading. The abrasion loss of the RHS compound was found to be almost comparable to that of conventional silica. As carbon black was replaced by conventional silica, we observed a higher content of silica, resulting in lower abrasion losses. Si-15 has a higher abrasion loss than Si-30. Si-30 showed a slightly higher loss of abrasion than Si-50. In addition, if the substitution of Part carbon black was replaced by RHS. Then, we observed the same nature as replacing part of the carbon black with conventional silica. A higher content of silica compounds resulted in alower loss of abrasion. RHS-15 has a higher abrasion loss than RHS-30. RHS-30 has a slightly higher abrasion loss than RHS-50. Results are shown in Table 4.
3.11 Microscopy
Fig. 10 shows TEM images of Si-50 and RHS-50 compounds at 36,000X magnification. Images show that both compounds exhibit uniform dispersion. In the rubber matrix, the state of dispersion of spherical particles can vary from highly dispersed to aggregate depending on the thermodynamics of the system and kinetics of sample preparation. The clustering of filler particles is favored by strong van der Waals forces (Meera et al., 2009).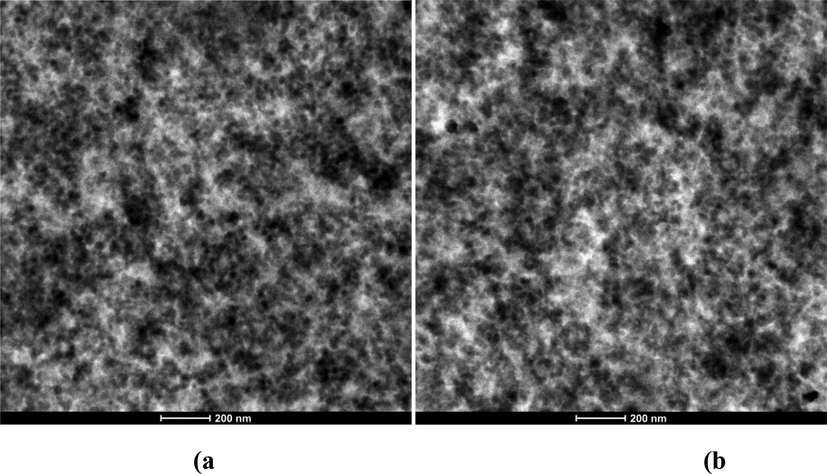
TEM images showing the silica dispersion of compounds collected from cured compound at 36,000× magnification: (a) Si-50, (b) RHS-50.
The presence of silica was confirmed by using TEM-EDX (Fig. 11). Si-50 and RHS-50 both compounds showed the presence of silica.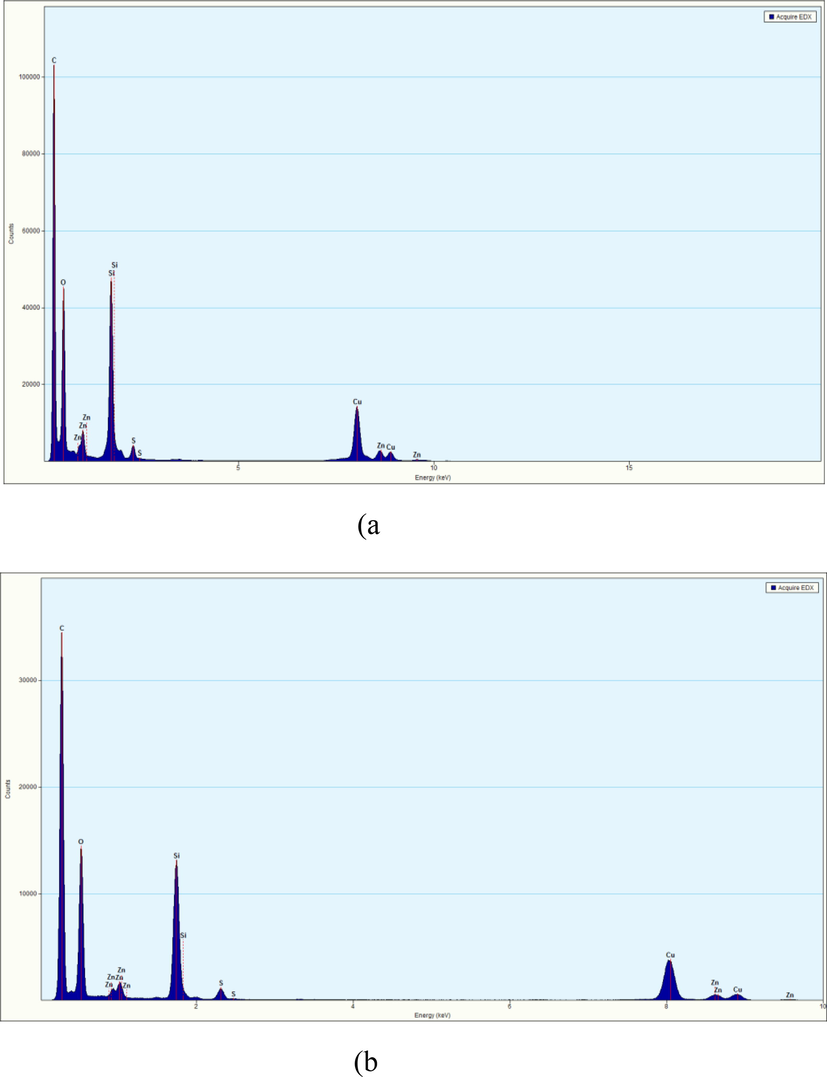
TEM-EDX images showing the presence of silica in compounds collected from fresh cured samples: (a) Si-50 and (b) RHS-50.
AFM images for Si-50 and RHS-50 are presented in Fig. 12 (a) and (b), respectively. For AFM of composite samples, thin sections of approximately 150 nm were obtained using a cryoultramicrotome. AFM micrographs indicate that the improved dispersion of Si-50 is reasonably better than that of RHS-50.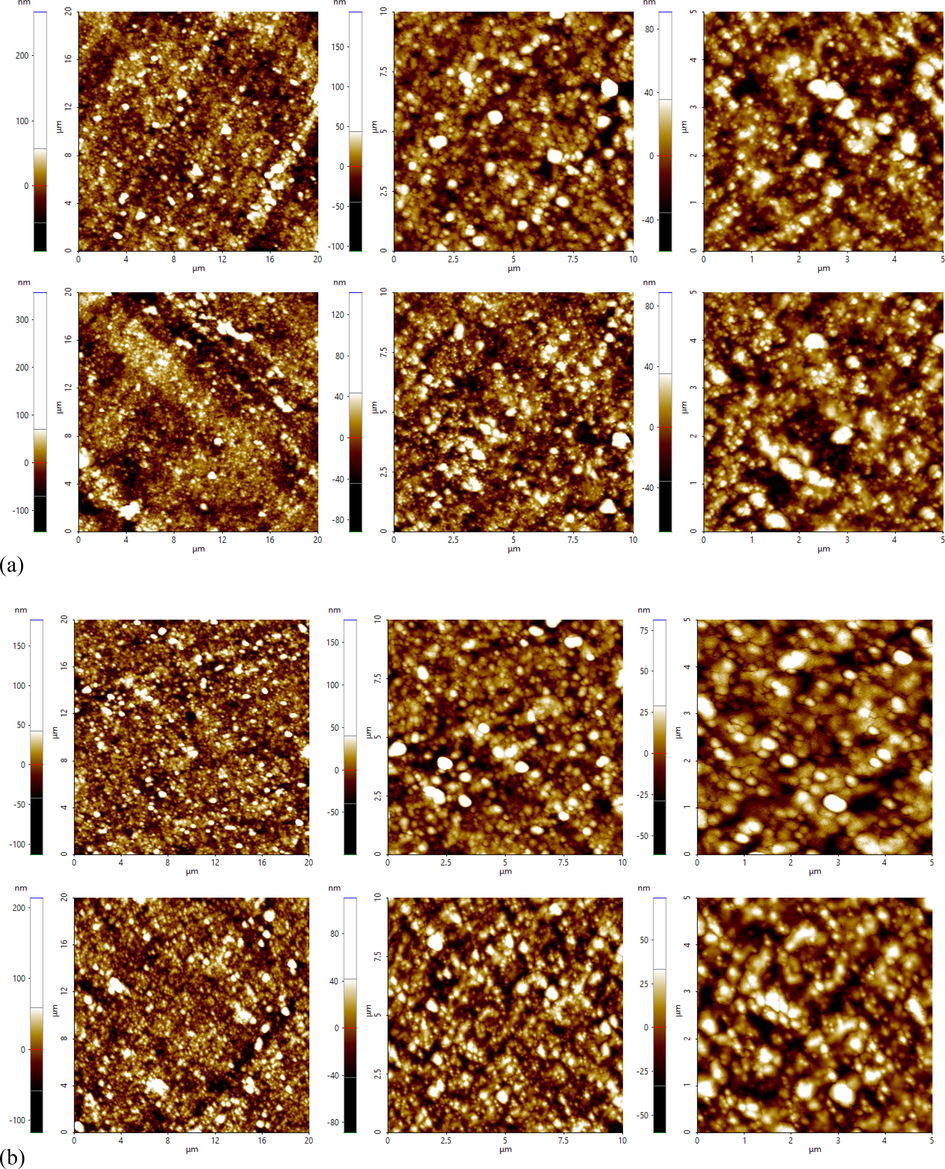
AFM images showing the silica dispersion of compound collected from cured compound: (a) Si-50, (b) RHS-50.
4 Conclusion
Rice husk silica compounds have rheometric, physical, rebound resilience, heat build-up, abrasion loss and dynamic properties comparable to those of conventional silica compounds at the same phr loads. As the doses of silica increased in the rubber compound as the rebound resilience increased and the heat buildup, the loss of abrasion and tan delta decreased. When the part carbon black was replaced by RHS. We found the same trend as replacing part of the carbon black with conventional silica. As the doses of RHS increased in the rubber compound as the rebound resilience increased and the heat buildup, the loss of abrasion and tan delta decreased. This sustainable material could be the same source for replacing conventional silica in tire compounding as well as for replacing part of the carbon black with RHS with improved heat build-up, rebound resilience, tan delta, and abrasion loss. BSP, one of the authors, is defending his Ph.D. thesis with this study.
Acknowledgements
Authors gratefully acknowledge Wilmar International Limited, China, for providing RHS for study.
References
- Quality evaluation and acceptability of cookies produced from rice (Oryza glaberrima) and soybeans (Glycine max) flour blends. J. Culin. Sci. Technol.. 2020;18:54-66.
- [Google Scholar]
- The benzylation of benzene using aluminium, gallium and iron incorporated silica from rice husk ash. Microporous Mesoporous Mater.. 2009;118:35-43.
- [Google Scholar]
- Influence of carbon black/silica ratio on the physical and mechanical properties of composites based on epoxidized natural rubber. J. Compos. Mater.. 2016;50:377-386.
- [Google Scholar]
- 6814-02. Standard test method for determination of percent devulcanization of crumb rubber based on crosslink density. Annu. B. ASTM Stand.. 2018;9:1-3.
- [Google Scholar]
- Effect of organic acid treatment on the properties of rice husk silica. J. Mater. Sci.. 2005;40:6535-6544.
- [Google Scholar]
- Effect of filler–filler interaction on rheological behaviour of natural rubber compounds filled with both carbon black and silica. Polym. Int.. 2003;52:23-28.
- [Google Scholar]
- Influence of filler type and content on properties of styrene-butadiene rubber (SBR) compound reinforced with carbon black or silica. Polym. Adv. Technol.. 2004;15:122-127.
- [Google Scholar]
- Walnut shell ash as a sustainable material for compounding with bromobutyl rubber for tire inner liner applications. Polym. Compos.. 2020;41:5317-5330.
- [Google Scholar]
- Short-and long-term effects of sodium chloride on strength and durability of coal fly ash stabilized with carbide lime. Can. Geotech. J.. 2019;56:1929-1939.
- [Google Scholar]
- Green tire technology: Effect of rice husk derived nanocellulose (RHNC) in replacing carbon black (CB) in natural rubber (NR) compounding. Carbohydr. Polym.. 2020;230:115620.
- [Google Scholar]
- POSS nanoparticles as a potential compatibilizer for natural rubber/butadiene rubber blends. Polym. Adv. Technol.. 2020;31:2290-2300.
- [Google Scholar]
- Designing a new dynamic mechanical analysis (DMA) system for testing viscoelastic materials at high frequencies. Modell. Simul. Eng.. 2019;2019
- [Google Scholar]
- Statistical mechanics of cross-linked polymer networks I. Rubberlike elasticity. J. Chem. Phys.. 1943;11:512-520.
- [Google Scholar]
- Experimental determining the mechanical and stiffness properties of natural rubber FRT triangle elastic joint composite reinforcement by glass fibers and micro/nano particles. Polym. Test.. 2020;85:106461.
- [Google Scholar]
- Evaluation of ethylene propylene diene terpolymer based insulation against nitrile rubber based insulation for large composite rocket motor casing. Polym. Adv. Technol.. 2021;32:111-122.
- [Google Scholar]
- Studies on the synthesis of silica powder from rice husk ash as reinforcement filler in rubber tire tread part: replacement of commercial precipitated Silica. SMR.. 2017;20:70.
- [Google Scholar]
- An insight into the research concerning Panax ginseng CA Meyer polysaccharides: a review. Food Rev. Int.. 2020:1-17.
- [Google Scholar]
- Silica gel from rice hull ash: preparation and characterization. Cereal Chem.. 1998;75:484-487.
- [Google Scholar]
- Improvement of filler–rubber interaction by the coupling action of vegetable oil in carbon black reinforced rubber. J. Appl. Polym. Sci.. 2000;75:735-739.
- [Google Scholar]
- Surface modification of silica by two-step method and properties of solution styrene butadiene rubber (SSBR) nanocomposites filled with modified silica. Compos. Sci. Technol.. 2013;88:69-75.
- [Google Scholar]
- A sustainable route for the preparation of activated carbon and silica from rice husk ash. J. Hazard. Mater.. 2011;186:1314-1319.
- [Google Scholar]
- Nonlinear viscoelastic behavior of silica-filled natural rubber nanocomposites. J. Phys. Chem. C. 2009;113:17997-18002.
- [Google Scholar]
- Natural rubber compositions with the partial/total replacement of carbon black/naphthenic oil by renewable additives: rice husk ash and cashew nut oil. J. Appl. Polym. Sci.. 2020;137:48314.
- [Google Scholar]
- Yarn on yarn abrasion performance of high modulus polyethylene fiber improved by graphene/polyurethane composites coating. J. Eng. Fibers Fabr.. 2021;16 1558925020983563
- [Google Scholar]
- The «integral rubber» concept-an approach to an ideal tire tread rubber. Kautschuk und Gummi, Kunststoffe. 1985;38:178-185.
- [Google Scholar]
- Study of Alkali metals and Alkaline earth metals in chlorobutylrubber-based model truck inner tube compound. In: Advanced Industrial and Engineering Polymer Research. Elsevier; 2022.
- [Google Scholar]
- Review of elastomer seal assemblies in oil & gas wells: Performance evaluation, failure mechanisms, and gaps in industry standards. J. Petrol. Sci. Eng.. 2019;179:1046-1062.
- [Google Scholar]
- Effect of dispersion on dynamic properties of filler-loaded rubbers. Rubber Chem. Technol.. 1966;39:365-374.
- [Google Scholar]
- Influence of non-covalent functionalization of carbon nanotubes on the rheological behavior of natural rubber latex nanocomposites. Eur. Polym. J.. 2014;53:147-159.
- [Google Scholar]
- Simultaneous production of alpha-cellulose and furfural from bagasse by steam explosion pretreatment. Maejo Int. J. Sci. Technol.. 2008;2:182-191.
- [Google Scholar]
- Effects of sample preparation on particle size distributions of different types of silica in suspensions. Nanomaterials. 2018;8:454.
- [Google Scholar]
- Dielectric properties of modified graphene oxide filled polyurethane nanocomposites and its correlation with rheology. Compos. Sci. Technol.. 2014;104:18-25.
- [Google Scholar]
- Use of rice husk ash as filler in natural rubber vulcanizates: in comparison with other commercial fillers. J. Appl. Polym. Sci.. 2002;83:2485-2493.
- [Google Scholar]
- Synergistic effect by high specific surface area carbon black as secondary filler in silica reinforced natural rubber tire tread compounds. Polym. Test.. 2020;81:106173.
- [Google Scholar]
- Effects of soaking on compressive strength of recycled polymer modified asphalt. Int. J. Pavement Eng. 2020:1-11.
- [Google Scholar]
- A critical review of plant-based insulating fluids for transformer: 30-year development. Renew. Sustain. Energy Rev.. 2021;141:110783.
- [Google Scholar]
- Yarn on yarn abrasion failure mechanism of ultrahigh molecular weight polyethylene fiber. J. Eng. Fibers Fabr.. 2021;16 15589250211052766
- [Google Scholar]
- Effects of surface chemistry of silica particles on secondary structure and tensile properties of silica-filled rubber systems. J. Appl. Polym. Sci.. 2002;86:1622-1629.
- [Google Scholar]
- Porous organic polymer-derived nanopalladium catalysts for chemoselective synthesis of antitumor benzofuro [2, 3-b] pyrazine from 2-bromophenol and isonitriles. Org. Lett.. 2019;21:4929-4932.
- [Google Scholar]
- Role of epoxidized natural Eucommia ulmoides gum in modifying the interface of styrene-butadiene rubber/silica composites. Polym. Adv. Technol.. 2019;30:2968-2976.
- [Google Scholar]
- Nonlinear viscoelastic dissipation in vulcanizates containing carbon black and silanized silica hybrid fillers. Rubber Chem. Technol.. 2018;91:537-547.
- [Google Scholar]
- The effects of silica/carbon black ratio on the dynamic properties of the tread compounds in truck tires. E-J. Chem.. 2012;9:1102-1112.
- [Google Scholar]
- The surface chemistry of amorphous silica. Colloids Surf. A: Physicochem. Eng. Asp.. 2000;173:1-38.
- [Google Scholar]
- High efficiency reductive degradation of a wide range of azo dyes by SiO2-Co core-shell nanoparticles. Appl. Catal. B. 2016;199:504-513.
- [Google Scholar]
- Synthesis, characterization, and applications of ZnO nanowires. J. Nanomater.. 2012;2012
- [Google Scholar]
Appendix A
Supplementary material
Supplementary data to this article can be found online at https://doi.org/10.1016/j.arabjc.2022.104086.
Appendix A
Supplementary material
The following are the Supplementary data to this article:Supplementary data 1
Supplementary data 1


