

Translate this page into:
Immobilization of cellulose extracted from Robinia Pseudoacacia seed fibers onto chitosan: Chemical characterization and study of methylene blue removal
-
Received: ,
Accepted: ,
This article was originally published by Elsevier and was migrated to Scientific Scholar after the change of Publisher.
Peer review under responsibility of King Saud University.
Abstract
The design of economical adsorbents to remove pollutants from contaminated water is attracting more attention. In this study, cellulose was successfully extracted from Robinia Pseudoacacia seed fibers and immobilized onto chitosan beads. The prepared spherical beads were then used for the biosorption of methylene blue dye from aqueous media. Samples were investigated using several analytical methods, namely FT-IR, XRD, EDX, SEM, and TGA analyses. The adsorption experiments showed that combining cellulose with chitosan improved the removal of methylene blue. The maximum uptake amount of methylene blue using cellulose–chitosan composite beads was 55 mg/g. However, it was about 35 mg/g at 20 °C for chitosan beads. The kinetic data complied strongly with the pseudo-second order equation, suggesting that the biosorption phenomenon has predominantly a chemical nature. Overall, the current study has shown a promising technique to design new adsorbents from abundant natural polymers for eliminating cationic dyes from water.
Keywords
Cellulose
Robinia Pseudoacacia
Chitosan beads
Biosorption
Methylene blue

1 Introduction
The existence of synthetic dye molecules in industrial wastes has attracted environmental concern due to the effects of such pollutants on both environments and human health. To remove such contaminants from wastewaters, many physicochemical methods have been proposed (Forgacs et al., 2004; Tünay et al., 1996; Zhang et al., 2016). The adsorption process has become a common choice for contaminants uptake due to its simple use, low cost, and the existence of various types of adsorbents. The efficiency of the adsorption phenomenon can be influenced by the physicochemical characteristics of the used adsorbent and its reuse ability (Manish et al., 2018; Hossein and Amiri, 2018). Hence, there is a continued interest in developing adsorbents from natural sources. Chitosan biopolymer was obtained from chitin upon deacetylation in basic conditions (Guo and Wilson, 2012), and it can be functionalized, cross-linked, and used for composite formation, in the form of beads, fibers, nanomaterials, etc. (Mahaninia and Wilson, 2015; Kumar et al., 2019; Ltaief and Jabli, 2021; Jabli, 2020).
Biopolymer-based adsorbents have been widely investigated in the literature (Baroncini et al., 2016). As examples of related published investigations, a previous investigation by Sabzevari et al. (2018) on the design of graphene oxide cross-linked with chitosan displayed high methylene blue adsorption capacity. Kong and Wilson (2020) reported the development of composites containing chitosan and pectin in dimethyl sulfoxide versus water. The prepared materials had a high adsorption capacity of methylene blue. Guo and Wilson (2012) studied the crosslinking of chitosan and poly(acrylic acid) through an ionic gelation process. The prepared copolymers exhibited high methylene blue adsorption. Mahaninia and Wilson (2015) studied the cross-linking of chitosan beads with epichlorohydrin and glutaraldehyde at variable compositions. The cross-linked beads showed effective elimination of phosphate ions from aqueous suspension. Kumar et al. (2019) prepared chitosan/poly(vinyl alcohol)/ZnO bio-nanocomposites films as adsorbents of Acid Blue 1 dye. Recently, Wang et al. (2022) reported on the preparation of magnetic chitosan biochar using a chemical coprecipitation technique after filling chitosan with a Schiff base reaction. The resulting composites removed a high amount of amaranth dye. Schio et al. (2022) studied the development of a lignocellulosic Luffa cylindrica material immobilized to crosslinked chitosan to eliminate Food red 17 dye from an aqueous medium by changing the adsorption experimental factors.
Robinia Pseudoacacia which is an important plant growing through the world produces significant quantities of seed fibers. It has valorized it some special purposes (Lu et al., 2022; Stéphane et al., 2018). However, the seed fibers have not yet studied. In this study, we extracted cellulose from Robinia Pseudoacacia seed fibers and immobilized it onto gelled chitosan beads at variable composition ratios. The prepared spherical beads were used for the biosorption of methylene blue. The equilibrium adsorption characteristics of the composites using methylene blue was determined from the variation of the experimental data of pH, time, concentration of methylene blue, and temperature. The composites were analyzed using several analytical methods such as FT-IR, XRD, EDX, SEM, and TGA analyses.
2 Experiments
2.1 Reagents and materials
Robinia Pseudoacacia seed fibers were collected from the region of Al-Zulfi (KSA) during the month of August. Highly viscous chitosan (degree of deacetylation = 85%) was purchased from Sigma-Aldrich and employed as received. Methylene blue dye (purity = 82%) was purchased from Sigma-Aldrich as a powder. Acetic acid, hydrogen peroxide (30%), NaOH, and HCl were supplied at analytical grade. Distilled water was employed to prepare the dye solutions.
2.2 Extraction of cellulose from Robinia Pseudoacacia seed fibers
Cellulose was extracted from Robinia Pseudoacacia seed fibers with reference to the methods reported in the literature (Gao et al., 2020; Almutairi et al., 2021) with a slight modification. The collected fibers were washed with water, in attempt to eliminate impurities deposed on the surface, and air dried. To remove the lignin, the fibers were treated in a solution of NaOH (5 wt%, LR = 1:50 (w/v)) at 80 °C for 2 h. To remove the remaining lignin and the undesirable color, the resulting matter was treated in a solution containing acetic acid and hydrogen peroxide (v/v = 1:1) at a temperature of 90 °C for 2 h. Finally, the obtained product was filtered and blended with chitosan gel solution at variable composition ratios.
2.3 Fabrication of cellulose–chitosan composites
The powders of chitosan were dissolved in distilled water containing (2% w/v) of acetic acid under continuous magnetic stirring at ambient temperature to ensure complete dissolution. Then, the extracted cellulose from Robinia Pseudoacacia seed fibers was added to the chitosan solution at ratios of 5% and 10%, based on the mass of chitosan. The mixture was stirred for 24 h to evade the creation of air bubbles in the obtained viscous solution, after which, the resulting solution was pumped through a nozzle of a micropipette, into an alkaline solution of NaOH (2 M) to obtain spherical composite spheres. The same experiment was performed to prepare unmodified chitosan beads without adding the extracted cellulose. Fig. 1 depicts photographs of the major steps for the preparation of chitosan-extracted cellulose spherical beads.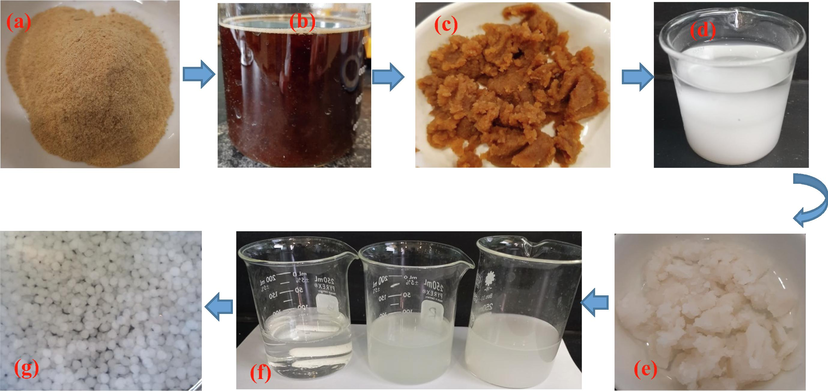
Major steps in the synthesis of extracted cellulose–chitosan composite beads: (a) grinded fibers, (b) fibers treated with NaOH solution, (c) unbleached cellulose, (d) bleached cellulose in solution, (e) bleached cellulose, (f) chitosan-cellulose mixture, and (g) wet prepared beads.
2.4 Characterization methods
FT-IR spectra data were obtained using a Perkin Elmer Spectrum Two ATR-FTIR at wavenumbers varying from 4000 to 400 cm−1. The diffractograms of X-ray powder were realized at room temperature using a PANalytical X’Pert PRO MPD. The morphological features of the prepared beads were determined using a Philips Fei Quanta 200 SEM wchich was equipped with an Energy Dispersive X-ray analysis system. The thermal properties of the studied materials were determined by thermogravimetric measurements using a TA Instruments device. The heating rate = 10° C min−1 and the temperature rises from room temperature to 900 °C.
2.5 Adsorption tests
Methylene blue adsorption tests were investigated in batch mode. A volume of 20 mL of dye solution was mixed with 0.012 g of raw and composite beads. The absorbance of the solution was assessed using a UV–vis spectrophotometer. The maximum wavelength of methylene blue was set at 664 nm. The adsorbed methylene blue level was considered using formula (1):
3 Results and discussion
3.1 Characterization of the prepared samples
FT-IR spectrum of chitosan powders, chitosan beads, chitosan–cellulose (5%), and (d) chitosan-cellulose (10%) are represented in Fig. 2. FT-IR spectrum of chitosan powder reveals the presence of absorption peaks at around 891 and 1145 cm−1, which are attributed to the saccharide structure. The bands at 1373 cm−1 and 1543 cm−1 correspond to the vibration of C—H, and to the stretching vibration of the amino groups of chitosan, respectively (Almutairi et al., 2021). The band at 1651 cm−1 is assigned to the NH bending of amide I. The broad band observed at 3360 cm−1 corresponds to the stretching vibrations of the hydroxyl and amino groups (Lin et al., 2012; Anicuta et al., 2010). Comparing the spectrum of the prepared composites with that of the chitosan powders, the peak observed at 3360 cm−1 shifted to new frequency values (3321 cm−1 for chitosan–cellulose 5% and 3306 cm−1 for chitosan–cellulose 10%). This chemical shifting suggests the occurrence of the intermolecular interaction between the OH and NH groups of cellulose and chitosan through the reaction.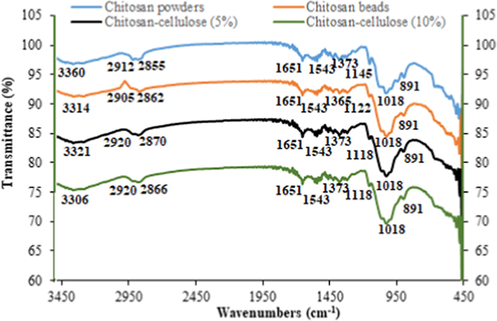
FT-IR spectrum of: (a) chitosan powders, (b) chitosan beads, (c) chitosan–cellulose (5%), and (d) chitosan–cellulose (10%).
Fig. 3 displays the SEM pictures of chitosan powders, chitosan beads, chitosan–cellulose (5%), and chitosan–cellulose (10%). Compared to the unmodified chitosan beads, the composite chitosan–cellulose beads exhibited a thicker network. This observation suggests that because of the strong hydrogen bonding result, chitosan can bind cellulose and form a thick and strong skeleton during preparation. This could offer the prepared composites improved chemical and mechanical characteristics over the native cellulose. Additionally, the beads became relatively rougher compared to the unmodified ones.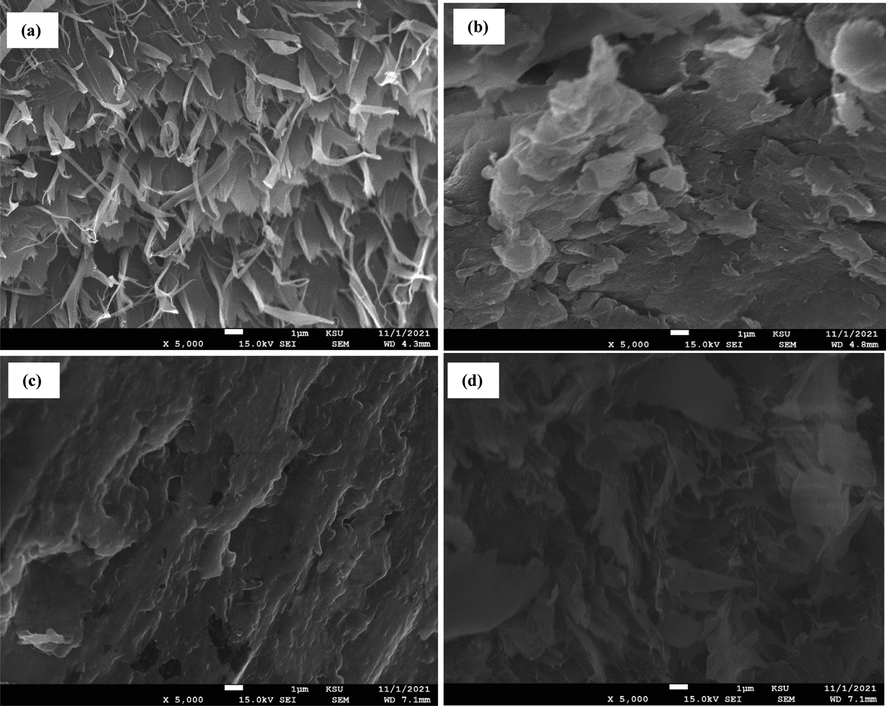
SEM pictures of: (a) chitosan powders, (b) chitosan beads, (c) chitosan–cellulose (5%), and (d) chitosan–cellulose (10%).
Fig. 4 shows the EDX analysis of chitosan powders, chitosan beads, chitosan–cellulose (5%), and chitosan–cellulose (10%). The results showed that increasing in the cellulose content of the chitosan biopolymer led to an icrease in carbon content and a decrease in oxygen content.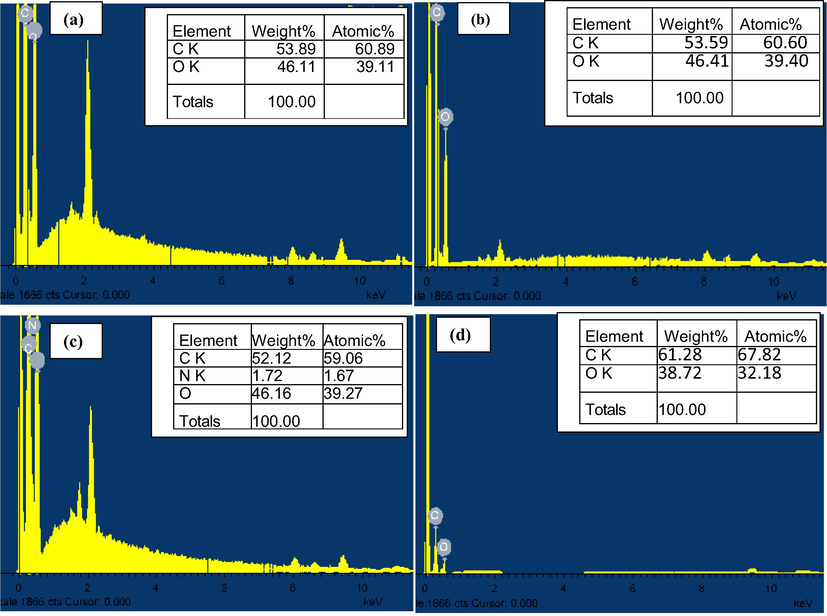
EDX analysis of: (a) chitosan powders, (b) chitosan beads, (c) chitosan-cellulose (5%), and (d) chitosan-cellulose (10%).
Fig. 5 shows the X-ray spectrum of chitosan powders, chitosan beads, chitosan–cellulose (5%), and chitosan–cellulose (10%). The XRD patterns of the chitosan beads displayed a broad peak at around 2θ = 19.8°, which corresponded to the crystal plane of (2 2 0) (Khan et al., 2012). This peak shifted to higher values with the addition of high cellulose contents. It was about 20.2° for the composite chitosan–cellulose (5%) and 20.5° for chitosan–cellulose (10%). This trend proves the gain in the interaction between the two biopolymers.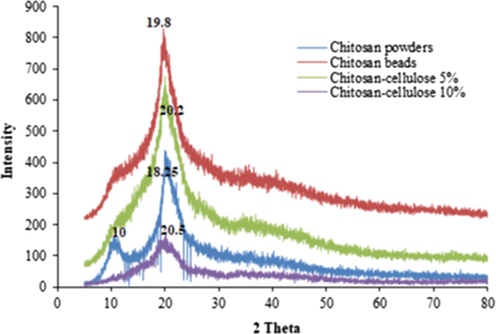
XRD patterns of: (a) chitosan powders, (b) chitosan beads, (c) chitosan–cellulose (5%), and (d) chitosan–cellulose (10%).
The TGA/DTA curves of chitosan powders, chitosan beads, chotosan–cellulose (5%), and chitosan–cellulose (10%) are represented in Fig. 6. It is shown that chitosan powders decomposed at 320 °C, which was higher than that observed for chitosan beads (310 °C). This could be explained by the dissolution of the biopolymer in acid media during chemical transformation making the prepared beads less thermally stable. The prepared two composites showed two thermal degradation peaks: the primary decomposition proceeds at 300 °C, and the second one occurs at 360 °C. The improvement of the thermal stability of the prepared materials might be the result of the interaction between cellulose and chitosan through hydrogen bonding.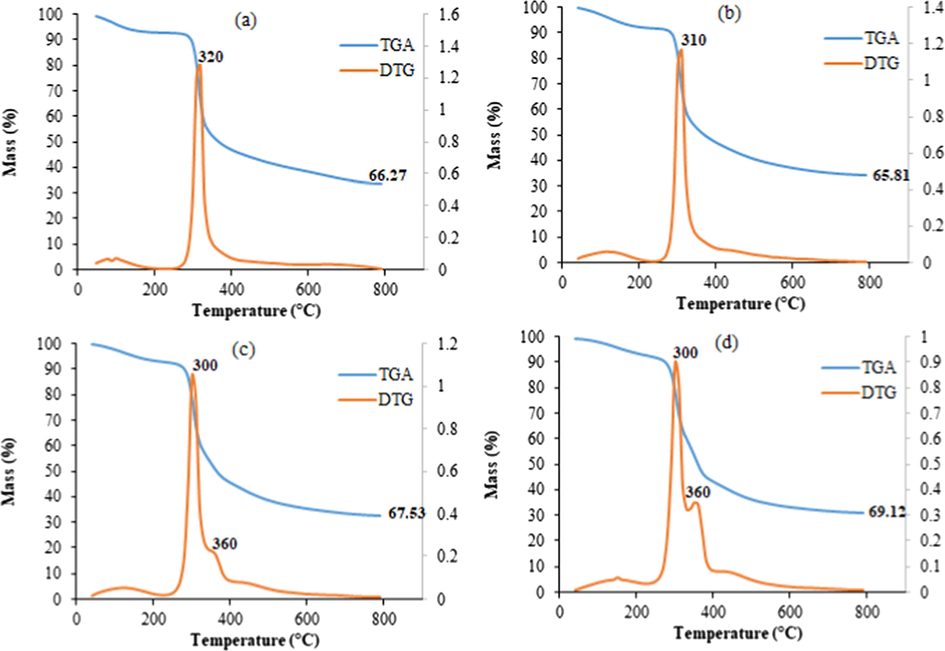
TGA and DTG plots of: (a) chitosan powder, (b) chitosan spheres, (c) chitosan–cellulose (5%), and (d) chitosan–cellulose (10%).
3.2 Application to methylene blue removal
3.2.1 Influence of experimental parameters
To determine the optimum adsorption conditions of methylene blue, beads at different ratios of cellulose (0%, 5%, 7%, and 10%) were studied as adsorbents. Fig. 7a shows that the addition of cellulose content to chitosan improved the pollutant removal capacity. Its maximal value is achieved when the ratio was of 10% (experimental conditions: T = 20 °C, pH = 6, time = 90 min, and C0 = 20 mg/L). Further adsorption investigations consider the ratio 10% at which the optimum adsorption was reached.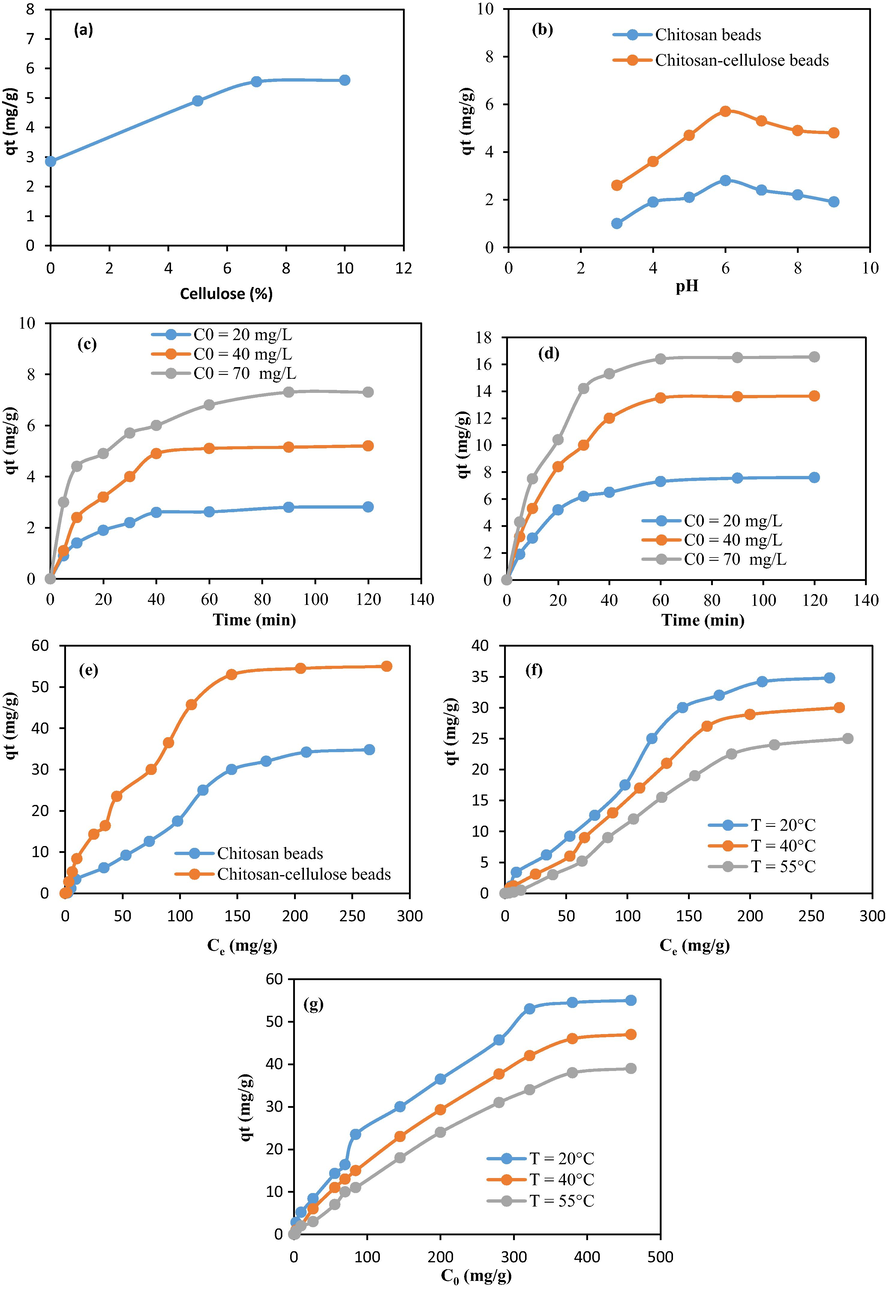
(a) effect of cellulose content, (b) effect of pH, (c) effect of contact time for chitosan spheres, (d) effect of contact time for chitosan–cellulose complex spheres, (e) effect of concentration of methylene blue, (f) influence of temperature for chitosan spheres, and (g) influence of temperature for chitosan–cellulose complex spheres.
The surface charge of both the adsorbate and adsorbent can be affected by the pH solution through the deprotonation and protonation process (Wu et al., 2009). Fig. 7b exhibits the variation in the pollutant removal amount as a function of pH using chitosan and chitosan–cellulose composite beads. As shown, the optimum pH was close to 6 (T = 20 °C, time = 90 min, C0 = 20 mg/L). In fact, in highly acidic pH conditions, the surface of the adsorbent was protonated, leading to low adsorption amounts of cationic methylene blue. When the pH increased, the adsorption of methylene blue was improved due to the occurrence of electrostatic attraction.
Fig. 7c, d displays the influence of time on methylene blue removal (pH = 6, T = 20 °C). The pollutant removal capacity increased with time until an equilibrium was reached. After 30 min of reaction, the adsorption occurred quickly, then increased gradually, and finally reached equilibrium at about 90 min. In fact, at the first stage of the mechanism, a lot of available adsorption sites were present on the adsorbent surface, which favored the removal of the adsorbate. Nevertheless, in the final period of adsorption, the sites became saturated on the surface of the adsorbent limiting the adsorption.
Fig. 7e represents the influence of the initial methylene blue concentration on the biosorption (pH = 6, time = 90 min). The results indicated that at a low initial dye concentration, the adsorption increased quickly. This behavior could be explained by the fact that there were enough non occupied adsorption sites; thus, the adsorption equilibrium was quickly reached. However, at high initial dye concentrations, the adsorption capacity tended to stabilize due to the limited adsorption sites. As shown, the maximum adsorption amount of methylene blue for the cellulose–chitosan complex spheres was 55 mg/g, and it was about 35 mg/g at 20 °C for the chitosan beads. This improvement in color adsorption capacity could be justified by the addition of more hydroxyl groups from cellulose. In fact, the presence of considerable hydroxyl groups in the studied two biopolymers led to high adsorbed amounts of cationic methylene blue molecules. As example, this adsorption capacity achieved within the prepared composites is comparable to that obtained using alginate beads modified with porphyrin zinc complex (52.3 mg/g) (Raoudha et al., 2022). Fig. 7f, g demonstrates that the pollutant removal capacity using the present samples was affected by the changing temperature value (time = 90 min and pH = 6). The adsorption phenomenon was exothermic suggesting that several chemical interactions would be mitigated at large temperatures.
3.2.2 Modeling of kinetic data
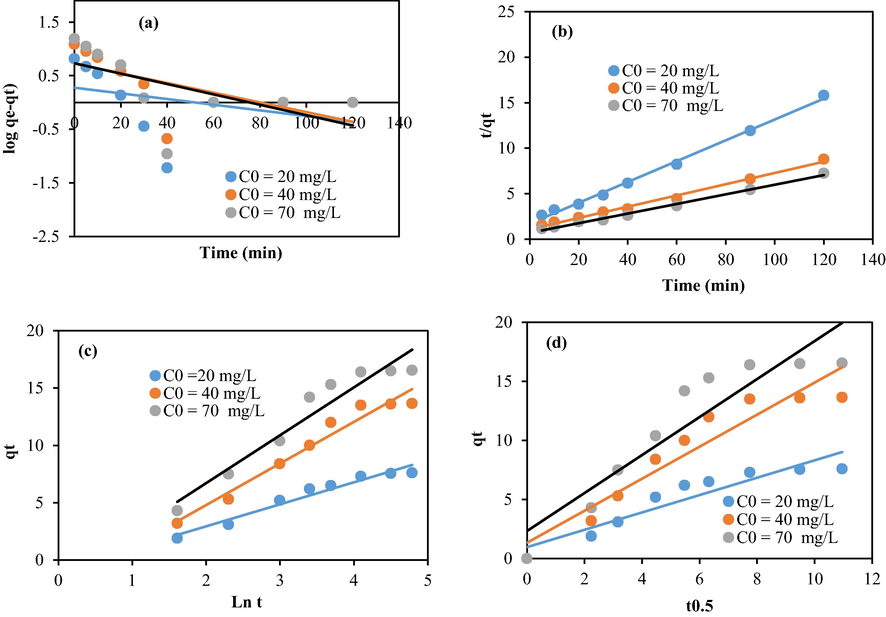
The relationship between the adsorption of methylene blue and time was assessed using theoretical kinetic models including, pseudo-first order, Elovich, pseudo-second order, and intra-particular diffusion models (Figs. 8 and 9).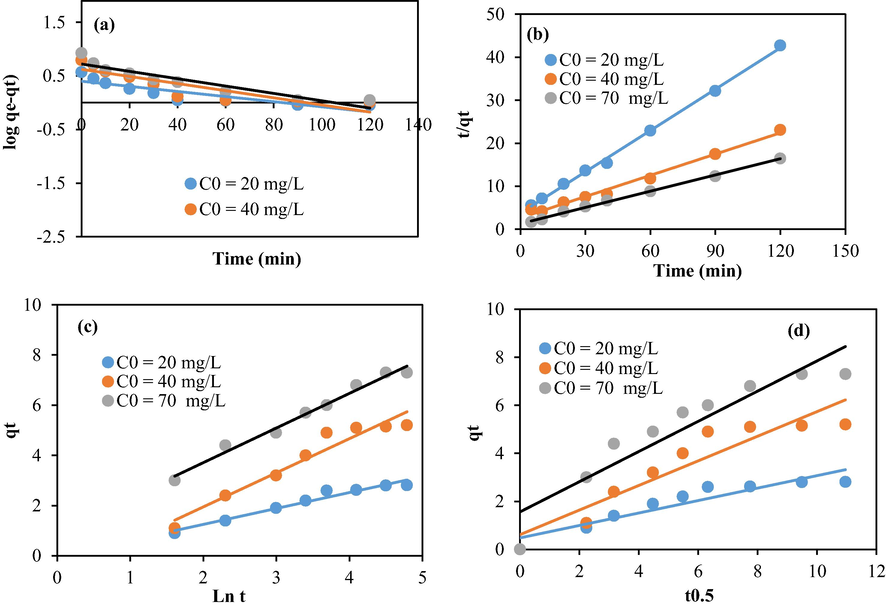
Modeling of the kinetic data using chitosan beads: (a) First order, (b) Second order, (c) Elovich, and (d) intra-particular diffusion.
Modeling of the kinetic data using chitosan–cellulose composite beads (10%): (a) First order, (b) Second order, (c) Elovich, and (d) intra-particular diffusion.
Table 1 summarizes the values computed from the above models. The regression coefficient related to the second order model is larger than the coefficients related to the other models. It has a value close to one (R2 ≥ 0.99). In addition, the calculated adsorption values were close to the experimental results. These trends suggest that the bio sorption data comply well with the second order model suggesting, therefore, that the studied phenomenon is essentially influenced by the chemical mechanism (Song et al., 2017). The intercept C related to the intraparticle diffusion model is positive. This suggests that the studied adsorption is mainly monitored by both internal and external diffusions (Zhang et al., 2021).
Adsorbents
Chitosan beads
Composite spheres (10%)
Initial Dye Concentration (mg/L)
20
40
70
20
40
70
First order
qe (mg/g)
2.51
4.17
5.25
1.88
5.30
5.40
k1 (min−1)
0.0048
0.0066
0.00069
0.0053
0.0091
0.0097
R2
0.77
0.77
0.87
0.13
0.42
0.34
Second order
qe (mg/g)
3.125
6.075
7.95
8.75
16.18
18.90
K2 (g·mg−1·min−1)
0.027
0.01
0.012
0.0076
0.0035
0.0039
R2
0.99
0.99
0.99
0.99
0.99
0.98
Elovich
α (mg·g−1·min−1)
0.615
0.769
2.74
1.20
1.82
2.81
β (mg·g−1·min−1)
1.57
0.735
0.724
0.52
0.277
0.239
R2
0.96
0.94
0.98
0.95
0.96
0.93
Intra-particular diffusion
KD (mg·g1·min1/2)
0.259
0.512
0.628
0.73
1.36
1.60
c
0.477
0.614
0.87
0.97
1.33
2.33
R2
0.87
0.87
0.87
0.88
0.90
0.86
3.2.3 Adsorption isotherms
In this study, the variation of the adsorption quantity versus the methylene blue concentration was investigated using Langmuir, Freundlich, and Temkin isotherms (Yao et al., 2010; Kim et al., 2015; Kim et al., 2004) (Figs. 10 and 11). The computed adsorption parameters are summarized in Table 2. The high coefficient regression values (R2 ≥ 0.97) obtained within the Freundlich isotherm indicate that multilayer adsorption happened at a heterogeneous interface (Kim et al., 2015). The favorability of the adsorption mechanism was assessed through the calculation of the exponent n. An exponent n between 2 and 10 means good. However, a value in the range 1–2 signifies that the process is moderate. Finally, a value smaller than one means that the adsorption is poor (Arami et al., 2005). In this research, the synthesized chitosan–cellulose spheres were moderate biosorbents (n > 1). However, unfunctionalized chitosan is a poor biosorbent (n < 1).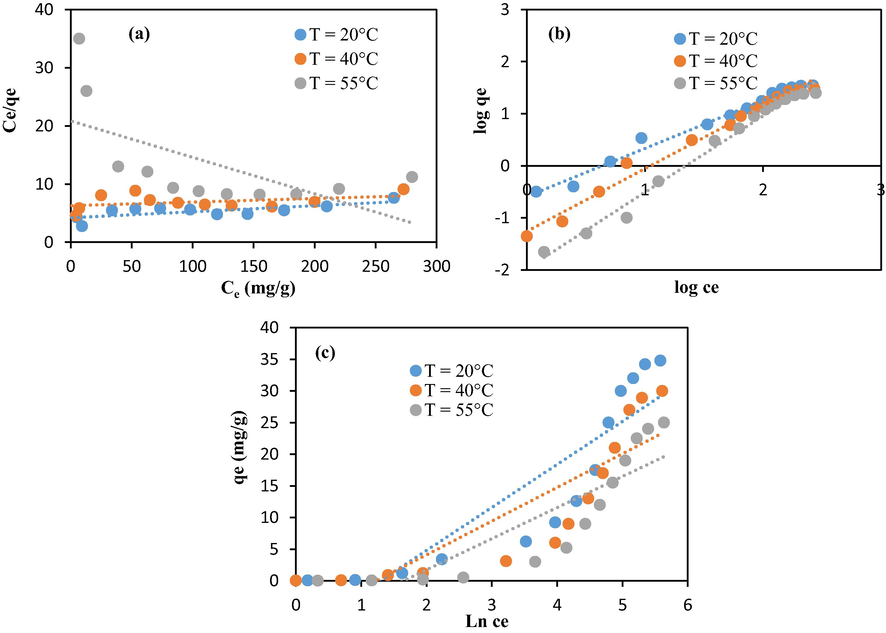
Modeling of the isotherm data related to chitosan beads through: (a) Langmuir, (b) Freundlich, and (c) Temkin.
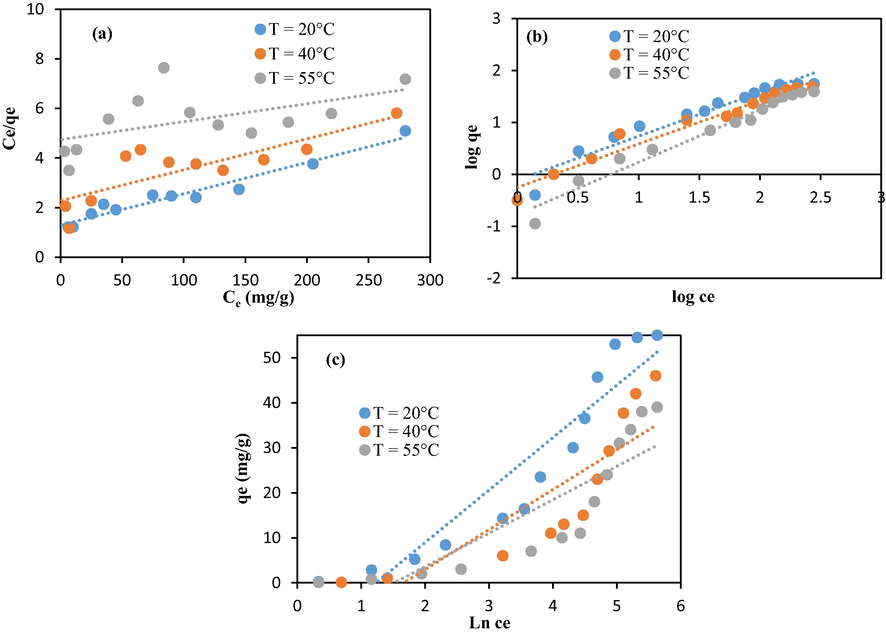
Modeling of the isotherm data related to chitosan–cellulose beads through: (a) Langmuir model, (b) Freundlich, and (c) Temkin.
Model
Adjustable parameter
Adsorbent
Chitosan beads
Chitosan–cellulose beads (10%)
20 °C
40 °C
55 °C
20 °C
40 °C
55 °C
Langmuir
qL (mg·g−1)
96.2
163.94
15.95
78.74
80
138.9
KL (L·mg−1)
0.0024
0.001
0.003
0.009
0.0055
0.0015
R2
0.52
0.15
0.39
0.95
0.68
0.30
Freundlich
nF
1.08
0.83
0.69
1.19
1.20
1.01
KF [(mg g−1)·(L mg−1)1/n]
0.257
0.055
0.01
0.781
0.56
0.17
R2
0.98
0.98
0.98
0.97
0.97
0.97
Temkin
BT
6.82
5.32
4.91
11.65
8.87
7.42
AT
0.273
2.26
1.833
3.44
5.298
4.557
R2
0.80
0.75
0.75
0.88
0.76
0.75
3.2.4 Calculation of the thermodynamic quantities
The thermodynamic quantities related to the adsorption of methylene blue onto the studied adsorbents were identified. The free energy change was determined using the following equation (Kim et al., 2015; Arami et al., 2005).
The parameters ΔH° and ΔS° were determined as follow (Kim et al., 2015; Arami et al., 2005):
ΔS° and ΔH° values are computed from the intercept and the slope of the curve of Ln Kd as a function of (1/T) (Fig. 12), are given in Table 3. The values of ΔH° were negative indicating that the adsorption is exothermic. The negative values of ΔS° showed a decrease in disorder at the interface between the adsorbent and the solution, causing a well-arranged repartition of adsorbate molecules through the available sites. On the other hand, the values of ΔG° are positive. This suggests that the adsorption was thermodynamically non-spontaneous.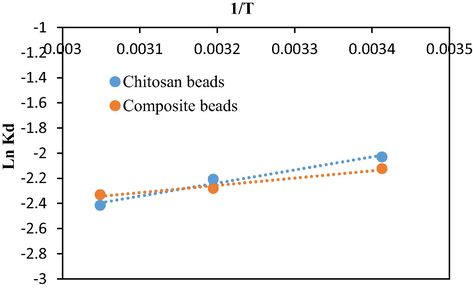
Variation of Ln Kd against the inverse of T.
Adsorbents
ΔH° (KJ/mol)
ΔS° (KJ/mol.K)
ΔG° (KJ/mol)
20 °C
40 °C
55 °C
Chitosan beads
−8.60
−46.28
4.91
7.62
6.00
Composite beads (10%)
−4.80
−34.13
5.20
6.70
4.99
4 Conclusion
In summary, cellulose was extracted from Robinia Pseudoacacia seed fibers and immobilized onto chitosan beads at different loading ratio ranging from 5% to 10%. The chemical composition, morphologies, crystallinity, and thermal properties were analyzed using FT-IR, SEM, EDX, XRD, and TGA/DTG analyses. The prepared beads were used to adsorb methylene blue from water. The adsorption experiments showed that the addition of cellulose to chitosan improved the removal of methylene blue. The maximum adsorption amount of methylene blue using cellulose–chitosan complex spheres was 55 mg/g, and it was about 35 mg/g at 20 °C for chitosan beads. The kinetic data complied well with the pseudo-second order equation suggesting that the adsorption phenomenon was mainly affected by chemical mechanisms. The experimental data followed the Freundlich isotherm implying that multilayer adsorption occurred at heterogeneous interface. The obtained data also indicated the chitosan–cellulose complex spheres were moderate adsorbents. On the contrary, chitosan spheres were poor adsorbents. The calculation of the thermodynamic factors displayed that the conducted adsorption process was exothermic, non-spontaneous from a thermodynamic point of view, and characterized by a decay in disorder at the interface between the adsorbent and the solution. Further work will be extended to design other new composites for environmental applications.
Acknowledgments
The authors would like to thank Deanship of Scientific Research at Majmaah University for supporting this work under Project No. R-2022-205.
Declaration of Competing Interest
The authors declare that they have no known competing financial interests or personal relationships that could have appeared to influence the work reported in this paper.
References
- Extraction of Cellulose Polymeric Material from Populus tremula Fibers: Characterization and Application to the Adsorption of Methylene Blue and Crystal Violet. Polymers. 2021;13(19):3334.
- [Google Scholar]
- Fourier transform infrared (FTIR) spectroscopy for characterization of antimicrobial films containing chitosan. Analele Univ. din Oradea Fasc. 2010:1234-1240.
- [Google Scholar]
- Removal of dyes from colored textile wastewater by orange peel adsorbent: equilibrium and kinetic studies. J. Colloid Interface Sci.. 2005;288:371-376.
- [Google Scholar]
- Recent advances in bio-based epoxy resins and bio-based epoxy curing agents. J. Appl. Polym. Sci.. 2016;133:44103-44122.
- [Google Scholar]
- Removal of synthetic dyes from wastewaters: A review. Environ. Int.. 2004;30:953-971.
- [Google Scholar]
- Efficient extraction of cellulose nanocrystals from waste Calotropis gigantean fiber by SO42-/TiO2 nano-solid superacid catalyst combined with ball milling Exfoliation. Ind. Crops Prod.. 2020;152:112524.
- [Google Scholar]
- Synthetically engineered chitosan-based materials and their sorption properties with methylene blue in aqueous solution. J. Colloid Interface Sci.. 2012;388:225-234.
- [Google Scholar]
- On tailored synthesis of nano CaCO3 particles in a colloidal gas aphron system and evaluating their performance with response surface methodology for heavy metals removal from aqueous solutions. J. Water Environ. Nanotechnol.. 2018;3:141-149.
- [Google Scholar]
- Synthesis, characterization, and assessment of cationic and anionic dye adsorption performance of functionalized silica immobilized chitosan bio-polymer. Int. J. Biol. Macromol.. 2020;153:305-316.
- [Google Scholar]
- Mechanical and barrier properties of cellulose nanocrystal reinforced chitosan-based nanocomposite films. Carbohydr. Polym.. 2012;90:1601-1608.
- [Google Scholar]
- Adsorption isotherms and kinetics of cationic and anionic dyes on three-dimensional reduced graphene oxide macrostructure. J. Ind. Eng. Chem.. 2015;21:1191-1196.
- [Google Scholar]
- Arsenic removal using mesoporous alumina prepared via a templating method. Environ. Sci. Technol.. 2004;38:924-931.
- [Google Scholar]
- Uptake of Methylene Blue from Aqueous Solution by Pectin-Chitosan Binary Composites. J. Compos. Sci.. 2020;4:95.
- [Google Scholar]
- Bio-based (chitosan/PVA/ZnO) nanocomposites film: Thermally stable and photoluminescence material for removal of organic dye. Carbohydr. Polym.. 2019;205:559-564.
- [Google Scholar]
- Preparation and Characterization of Chitosan/Cellulose Blend Films using ZnCl2·3H2O as a Solvent. Bioresources. 2012;7:5488-5499.
- [CrossRef] [Google Scholar]
- Immobilization of copper oxide nanoparticles onto chitosan biopolymer: Application to the oxidative degradation of Naphthol blue black. Carbohydr. Polym.. 2021;261:117908.
- [Google Scholar]
- Effect of arbuscular mycorrhizal fungi in roots on antioxidant enzyme activity in leaves of Robinia pseudoacacia L. seedlings under elevated CO2 and Cd exposure. Environ. Pollut.. 2022;294:118652.
- [Google Scholar]
- Cross-linked chitosan beads for phosphate removal from aqueous solution. J. Appl. Polym. Sci.. 2015;133:42949.
- [Google Scholar]
- Removal of Cu (II) ion from aqueous solutions by Rice Husk Carbon-Chitosan Composite gel (CCRH) using response surface methodology. Environ. Nanotechnol. Monit. Manage.. 2018;10:189-198.
- [Google Scholar]
- Synthesis and characterization of a new meso-tetrakis (2,4,6-trimethylphenyl) porphyrinto) zinc(II) supported sodium alginate gel beads for improved adsorption of methylene blue dye. Int. J. Biol. Macromol.. 2022;202:161-176.
- [Google Scholar]
- Graphene Oxide-Chitosan Composite Material for Treatment of a Model Dye E_uent. ACS Omega. 2018;3:13045-13054.
- [Google Scholar]
- Adsorption performance of Food Red 17 dye using an eco-friendly material based on Luffa cylindrica and chitosan. J. Mol. Liquids. 2022;349:118144.
- [Google Scholar]
- A facile approach towards aminocoated polyethersulfone particles for the removal of toxins. J. Colloid Interface Sci.. 2017;485:39-50.
- [Google Scholar]
- Optimization and kinetic modelling of robinetin and dihydrorobinetin extraction from Robinia pseudoacacia wood. Ind. Crops Prod.. 2018;126:22-30.
- [Google Scholar]
- Preparation of magnetic chitosan corn straw biochar and its application in adsorption of amaranth dye in aqueous solution. Int. J. Biol. Macromol.. 2022;199:234-242.
- [Google Scholar]
- Characteristics of Elovich equation used for the analysis of adsorption kinetics in dye-chitosan systems. Chem. Eng. J.. 2009;150:366-373.
- [Google Scholar]
- Adsorption behavior of methylene blue on carbon nanotubes. Bioresour. Technol.. 2010;101:3040-3046.
- [Google Scholar]
- MXene/sodium alginate gel beads for adsorption of methylene blue. Mater. Chem. Phys.. 2021;260:124123.
- [Google Scholar]
- Removal of heavy metal ions using chitosan and modified chitosan: A review. J. Mol. Liq.. 2016;214:175-191.
- [Google Scholar]


