

Translate this page into:
QSAR studies of some side chain modified 7-chloro-4-aminoquinolines as antimalarial agents
*Corresponding author. Tel.: +91 9981219293 nitendrasemail@yahoo.com (Nitendra K. Sahu)
-
Received: ,
Accepted: ,
This article was originally published by Elsevier and was migrated to Scientific Scholar after the change of Publisher.
Available online 13 December 2010

Peer review under responsibility of King Saud University.
Abstract
The quantitative structure–activity relationship (QSAR) analyses were carried out for a series of new side chain modified 4-amino-7-chloroquinolines to find out the structural requirements of their antimalarial activities against both chloroquine sensitive (HB3) and resistant (Dd2) Plasmodium falciparum strain. The statistically significant best 2D QSAR models for Dd2, having correlation coefficient (r2) = 0.9188 and cross validated squared correlation coefficient (q2) = 0.8349 with external predictive ability (pred_r2) = 0.7258 and for HB3, having r2 = 0.9024, q2 = 0.8089 and pred_r2 = 0.7463 were developed by multiple linear regression coupled with genetic algorithm (GA–MLR) and stepwise (SW–MLR) forward algorithm, respectively. The results of the present study may be useful on the designing of more potent analogues as antimalarial agents.
Keywords
QSAR
7-Chloro-4-aminoquinolines
Antimalarials
MLR
Genetic algorithm

1 Introduction
Malaria is one of the most widespread diseases in the world. According to WHO estimates 40% of the world’s population presently live under malarial threat (WHO, 2000). Around 300 and 500 million cases of malaria occur annually, leading to 1–3 million deaths. Its control is globally a high priority task. Although effective antimalarial agents have been known for a long time, the alarming spread of drug resistant strains of Plasmodium falciparum, which is the most lethal parasite species, undergoes the urgency and continuous need for the discovery of new therapeutics. A major initiative in this direction is to find enzyme targets that are critical to the disease process or essential for the survival of the parasite. Identification and design of novel chemical entities specifically affecting these targets could lead to better drugs for the treatment of malaria (Sahu et al., 2008). Among old and new drug targets of malaria, host heme molecule remains one of the most attractive target and 7-chloroquinoline compounds are very selective towards heme bindings (Vippagunta et al., 1999). So, rather than identifying new molecules for efficacy, modified 7-chloroquinolines having many advantages and efficiency are now in priority for antimalarial chemotherapy.
The quantitative structure–activity relationship (QSAR) approach helps to correlate the specific biological activities or physical properties of a series of compounds with the measured or computed molecular properties of the compounds, in terms of descriptors (Hansch et al., 2001). QSAR methodologies save resources and expedite the process of the development of new molecules and drugs. There have been many QSAR researches related to design of anti-malarial drugs so far (Bhattacharjee et al., 2004; Dascombe et al., 2005; Katritzky et al., 2006; Adane and Bharatam, 2008; Deshpande et al., 2009) but a systematic QSAR study is yet to be carried out for series of new 4-amino-7-chloroquinolines carrying a branched or a linear side chain with two or three amino functions.
The aim of present work is to derive some statistically significant QSAR models for side chain modified 4-amino-7-chloroquinolines for their antimalarial activities and to relate antimalarial activity to its physicochemical properties. The results obtained may contribute to further designing novel antimalarial agents.
2 Experimental
2.1 Data set
A data set of 18 compounds of side chain modified 4-amino-7-chloroquinolines for antimalarial activities against chloroquine sensitive (HB3) and resistant (Dd2) P. falciparum strains was used for the present 2D QSAR study (Yearick et al., 2008). There is high structural diversity and a sufficient range of the biological activity in the selected series of these derivatives (Table 1). It insists as to select these series of compounds for our QSAR studies. The biological activity values [IC50 (nM)] reported in literature were converted to their molar units and then further to negative logarithmic scale (pIC50) and subsequently used as the dependent variable for the QSAR analysis.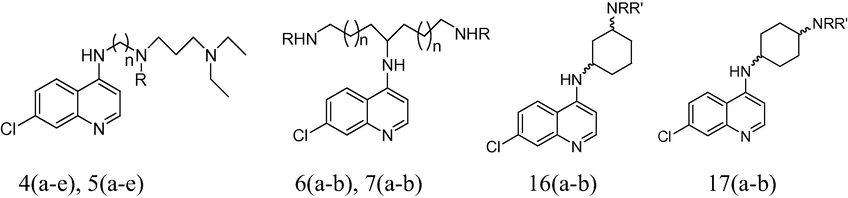
Compound
n
R
R′
IC50 (nM) Dd2
IC50 (nM) HB3
4a
2
H
–
129
29.2
4b
3
H
–
56.3
27.3
4c
4
H
–
170
72.5
4d
5
H
–
103
46
4e
6
H
–
269
82.8
5a
2
Et
–
31.2
27.3
5b
3
Et
–
28.1
21.2
5c
4
Et
–
84.6
24.1
5d
5
Et
–
43.4
15.7
5e
6
Et
–
274
62.9
6a
1
Et
–
128
187
6b
1
i-Pr
–
99.8
44.1
7a
2
Et
–
882
716
7b
2
i-Pr
–
2550
1314
16a
–
Et
Et
80
26.3
16b
–
H
i-Pr
51.8
27.8
17a
–
Et
Et
76.1
25.5
17b
–
H
i-Pr
75.7
31.3
All 18 compounds were built on workspace of molecular modeling software VLife MDS 3.5 (Vlife Sciences Technologies Pvt. Ltd. Pune, India) and then the structure was converted to three-dimensional space for further analysis. All molecules were batch optimized for the minimization of energies using Merck molecular force field (MMFF) followed by considering distance-dependent dielectric constant of 1.0, convergence criterion or root-mean-square (RMS) gradient at 0.01 kcal/mol Å and the iteration limit to 10,000 (Halgren, 1996). The energy-minimized geometry was used for the calculation of the various 2D descriptors (Individual, Chi, ChiV, Path count, ChiChain, ChiVChain, Chainpathcount, Cluster, Pathcluster, Kapa, Element Count, Estate number, Estate contribution, Semi-impirical, Hydophillic–hydophobic and Polar surface area). The various alignment-independent (AI) descriptors were also calculated. For calculation of alignment, the independent descriptor was assigned the utmost three attributes. The first attribute was T to characterize the topology of the molecule. The second attribute was the atom type, and the third attribute was assigned to atoms taking part in the double or triple bond. The preprocessing of the independent variables (i.e., 2D descriptors) was done by removing invariable (constant column), which resulted in total 153 descriptors to be used for QSAR analysis. In addition to the VLife descriptors, 50 descriptors were also calculated using the Win CAChe version 6.1 modeling software (Fujitsu private limited, Japan).
The sphere exclusion (SE) method (Hudson et al., 1996; Zheng and Tropsha, 2000; Golbraikh and Tropsha, 2003; Coi et al., 2009) was adopted for division of training and test data set comprising of 14 and 4 molecules, respectively, with dissimilarity value of 2.3 where the dissimilarity value gives the sphere exclusion radius. The spherical exclusion method employs the following algorithm: (i) select a point and include it in the training set; (ii) build a sphere with radius R with a center in this point; (iii) include all points within the sphere, except for the center, in the test set; (iv) discard all points in the sphere from the initial set; (v) if no points are left, stop, otherwise go to step (i). The most active compound in the dataset is selected as the starting point for building a sphere (Lather and Fernandes, 2009). Four compounds, namely, 4b, 5d, 16a and 17b were used as test set while the remaining molecules were used as the training set (Table 2). The unicolumn statistics of the training and test sets is reported in Table 3. Max., maximum; min., minimum; SD, standard deviation.
Compd
XY polarizability
Radius of gyration
T_2_C_4
Electron affinity
T_N_N_4
Polarizability AHC
T_C_N_4
T_2_C_3
HOMO energy
T_N_N_5
Kappa3
4a
−25.8
33.04
16
0.75
2
39.36
5
24
−8.71
0
6.43
4b*
−25.07
37.64
17
0.75
3
41.21
3
24
−8.72
0
7.04
4c
−27.72
43.35
17
0.75
2
43.05
5
24
−8.71
1
7.64
4d
−25.9
48.86
17
0.75
2
44.89
5
24
−8.71
0
8.28
4e
−28.97
55.24
17
0.74
2
46.73
5
24
−8.71
0
8.91
5a
8.267
21.37
16
0.67
2
43.05
6
24
−8.61
0
6.91
5b
−52.26
26.25
17
0.66
3
44.89
3
24
−8.62
0
7.51
5c
1.612
27.23
17
0.69
2
46.73
5
24
−8.64
1
8.1
5d*
−46.14
35.47
17
0.7
2
48.58
5
24
−8.66
0
8.73
5e
39.15
41.56
17
0.72
2
50.42
5
24
−8.67
0
9.35
6a
15.08
22.09
23
0.78
3
48.58
3
27
−8.9
0
7.65
6b
−18.34
22.78
23
0.68
3
55.95
3
27
−8.75
0
8.63
7a
52.94
28
23
0.76
1
52.26
7
27
−8.89
2
8.82
7b
63
30.4
23
0.73
1
59.63
7
27
−8.84
2
9.77
16a*
28.95
19.11
20
0.75
2
39.07
5
25
−8.71
0
4.35
16b
−22.53
19.13
20
0.75
2
42.75
5
25
−8.68
0
4.84
17a
−28.13
19.12
20
0.69
1
39.07
5
25
−8.63
1
4.35
17b*
−19.46
20.72
20
0.67
1
42.75
5
25
−8.6
1
4.84
Data set
Average
Max.
Min.
SD
Total
Dd2
Training
6.847
7.551
5.594
0.530
95.854
Test
7.208
7.363
7.097
0.123
28.830
HB3
Training
4.172
4.674
2.881
0.558
58.410
Test
4.613
4.804
4.505
0.131
18.452
2.2 Feature selection and model development
Feature selection is a key step in QSAR analysis. An integral aspect of any model-building exercise is the selection of an appropriate set of features with low complexity and good predictive accuracy. This process forms the basis of a technique known as feature selection or variable selection (Guyon and Elisseeff, 2003). Among several search algorithms, stepwise (SW) forward–backward variable selection method (Darlington, 1990), genetic algorithms (GA) (Hasegawa et al., 1999) and simulated annealing (SA) (Zheng and Tropsha, 2000) based feature selection procedures are most popular for building QSAR models and can explain the situation more effectively.
In the selected equations, the cross-correlation limit was set at 0.5, the number of variables at 10, and the term selection criteria at q2. An F value was specified to evaluate the significance of a variable. The variance cutoff was set at 0, with autoscaling in which the number of random iterations was set at 100.
In SW forward–backward variable selection algorithm, the model is repeatedly altered from the previous one by adding or removing a predictor variable in accordance with the ‘stepping criteria’ (in this case F = 4 for inclusion; F = 3.99 for exclusion for the forward–backward selection method). In GA method, population and number of generations were set as 10 and 1000, respectively and speed of 9999. In SA method, the maximum and minimum temperature were set as 100 K and 0.01 K, respectively and the temperature was decreased by 5 units with 100 iterations at that particular temperature.
Multiple linear regression (MLR) analysis is the standard method for multivariate data analysis (Darlington, 1990). It estimates the values of the regression coefficients by applying least squares curve fitting method. For getting reliable results, dataset having typically five times as many data points (molecules) as independent variables (descriptors) is required.
2.3 Model quality and validation
The developed QSAR models are evaluated using the following statistical measures: n, (the number of compounds in regression); k, (number of variables); DF, (degree of freedom); optimum component, (number of optimum PLS components in the model); r2, (the squared correlation coefficient); r2se, (standard error of squared correlation coefficient); F test, (Fischer’s value) for statistical significance; q2, (cross-validated correlation coefficient); q2_se, (standard error of cross-validated square correlation co-efficient); pred_r2, (r2 for external test set); pred_r2se, (standard error of predicted squared regression); Z score, (Z score calculated by the randomization test); best_ran_q2, (highest q2 value in the randomization test); best_ran_r2, (highest r2 value in the randomization test). The regression coefficient r2 is a relative measure of fit by the regression equation. It represents the part of the variation in the observed data that is explained by the regression. However, a QSAR model is considered to be predictive, if the following conditions are satisfied: r2 > 0.6, q2 > 0.6 and pred_r2 > 0.5 (Golbraikh and Tropsha, 2002). The F-test reflects the ratio of the variance explained by the model and the variance due to the error in the regression. High values of the F-test indicate that the model is statistically significant. The low standard error of r2 (r2_se), q2 (q2_se) and pred_r2 (Pred_r2se) shows absolute quality of fitness of the model.
Internal validation was carried out using ‘leave-one-out’ (q2, LOO) method (Cramer et al., 1988). The cross-validated coefficient, q2, was calculated using the following equation: where yi, and are the actual and predicted activity of the ith molecule in the training set, respectively, and ymean is the average activity of all molecules in the training set.
However, a high q2 value does not necessarily give a suitable representation of the real predictive power of the model for antimalarial ligands. So, an external validation was also carried out in the present study. The external predictive power of the model was assessed by predicting pIC50 value of the nine test set molecules, which were not included in the QSAR model development. The predictive ability of the selected model was also confirmed by pred_r2. where yi, and ŷi are the actual and predicted activity of the ith molecule in the test set, respectively, and ymean is the average activity of all molecules in the training set.
3 Results and discussion
The QSAR study of 18 new side chain modified 7-Chloro-4-aminoquinoline derivatives for antimalarial activities (Table 1) through MLR methodology, based on various feature selection methods viz. SW, GA and SA using VLife MDS 3.5 software resulted in the following statistically significant models (Table 4), considering the term selection criterion as r2, q2 and pred_r2. The training and test sets were selected by sphere exclusion method and the models were validated by both internal and external validation procedure. To ensure a fair comparison, the same training and test sets were used for each model’s development (Table 2). A Uni-column statistics for training set and test set was generated to check correctness of selection criteria for trainings and test set molecules (Table 3).
Sr. No.
Statistical parameter
2D QSAR results
HB3
Dd2
SW–MLR (Model 1)
SW–MLR (Model 2)
GA–MLR (Model 3)
SA–MLR (Model 4)
1
r2
0.9024
0.8462
0.9188
0.8634
2
q2
0.8089
0.6828
0.8349
0.7177
3
pred_r2
0.7463
0.7536
0.7258
0.7577
4
r2_se
0.1988
0.2372
0.1723
0.2235
5
q2_se
0.2782
0.3406
0.2458
0.3214
6
pred_r2se
0.2649
0.2156
0.2257
0.2138
7
Z Score Q2
3.45129
4.13827
2.84884
2.95782
8
Best rand Q2
0.64418
0.22046
0.66627
0.46807
9
F test
30.8281
18.3411
37.7243
21.0637
10
Ntraining
14
14
14
14
The maximum and minimum value in training and set were compared in a way that:
-
The maximum value of pIC50 of test set should be less than or equal to maximum value of pIC50 of training set.
-
The minimum value of pIC50 of test set should be higher than or equal to minimum value of pIC50 of training set.
This observation showed that test set was interpolative and derived within the minimum–maximum range of training set. The mean and standard deviation of pIC50 values of sets of training and test provide insights to relative difference of mean and point density distribution of two sets. The mean of the test sets was higher than the training sets that indicates the presence of relatively more active molecules as compared to the inactive ones. To ensure a fair comparison, the same training and test sets were used for each model’s development.
Some statistically significant 2D QSAR models were chosen for discussion (Model 1 for HB3 and Model 2–4 for Dd2 strains).
Model 1 (SW–MLR)
The statistically best model (Model 1) for antimalarial activity against HB3 with a coefficient of determination (r2) = 0.9024 was considered, as the model showed an internal predictive power (q2 = 0.8089) of 80% and a predictivity for the external test set (pred_r2 = 0.7463) of about 74%. This model indicates the positive contribution of HOMO Energy (48.22%). The descriptors T_N_N_5 define the count of number of Nitrogen atoms separated from any other Nitrogen atom by five bonds and make a negative contribution (−31.30%) to activity (like in compounds). The last descriptor kappa3 in model represents to third kappa shape index. The descriptor is negatively correlated (−20.49%) with biological activity in the QSAR models which suggests that decreasing the kappa3 of the compounds will lead to increased activity.
The descriptors selected for this model are summarized in Table 2 and the correlation matrix between the physico-chemical parameters and the biological activity for the models 1 is presented in Table 5.
pIC50
HOMO energy
T_N_N_5
Kappa3
pIC50
1
HOMO energy
0.825
1
T_N_N_5
−0.675
−0.347
1
Kappa3
−0.52
−0.421
0.162
1
Model 2 (SW–MLR)
Model 3 (GA–MLR)
Model 4 (SA–MLR)
The SW–MLR, GA–MLR and SA–MLR models predict the training data with an r2 of 0.8462, 0.9188 and 0.8634 together with root mean square error (RMSE) estimating to 0.2372, 0.1723 and 0.2235, respectively. However, the prediction result for the test set were 0.7536, 0.7258 and 0.7577 with RMSE values 0.2156, 0.2257 and 0.2138, indicating that the MLR models are quite capable of estimating the fit for the dataset of new side chain modified 7-Chloro-4-aminoquinolines.
The statistically best significant model (Model 3) obtained by the GA–MLR shows 91.88% variance in the observed activity values. The low r2_se = 0.1723 demonstrates accuracy of the model. The F test value, 37.7243 shows the overall statistical significance level to be 99.99% of the model, which means that the probability of failure for model is 1 in 10,000. Cross validated q2 of this model, 0.8349, indicates good internal prediction power of the model. Another parameter for predictivity of test set compounds is high (pred_r2 = 0.7258), which shows good external predictive power of the model.
In this QSAR Model 3, the positive coefficient (29.27%) of T_N_N_4 (count of number of Nitrogen atoms separated from any other Nitrogen atom by four bonds) showed that increase in the values of this descriptor is beneficial for the antimalarial activity (Like in compound 5a). The negative coefficient of Electron Affinity (−27.81%) and polarizability AHC (−42.93%) showed that increase in the values of these descriptors is detrimental for the antimalarial activity (Like in compounds 7a, 7b).
The descriptors selected for best QSAR models 3 are summarized in Table 2 and the correlation matrixes between the physico-chemical parameters and the biological activity for this model are presented in Table 6.
pIC50
Electron affinity
T_N_N_4
Polarizability AHC
pIC50
1
Electron affinity
−0.47524
1
T_N_N_4
0.460288
0.058763
1
Polarizability AHC
−0.66301
−0.0105
−0.04618
1
The QSAR Model 2 shows a negative correlation with descriptors XY polarizability (−34.82%), Radius of gyration (−36.28%) and T_2_C_4 (This is the count of number of double bounded atoms separated from Carbon atom by four bonds) (−28.89%). Likewise, the QSAR Model 4 shows a negative correlation with descriptors Radius of gyration (−13.13%), T_C_N_4 (count of number of Carbon atoms separated from any Nitrogen atom by four bond distance) (−26.52%) and T_2_C_3 (count of number of double bounded atoms separated from Carbon atom by three bonds) (−41.35%).
The plots of calculated vs. observed values of pIC50 for best Models 1 and 3 are shown in Fig. 1. The predicted (LOO) activities of the compounds by the above best models are shown in Table 7.
Correlation plots of observed and predicted activities of the training and test compounds for best QSAR Models 1 and 3.
Compound
Exp. pIC50 (M) HB3
Model-1 (SW–MLR)
Exp. pIC50 (M) Dd2
Model-3 (GA–MLR)
Pred. pIC50
aRes.
Pred. pIC50
aRes.
4a
7.535
7.439
0.095
6.889
7.14
−0.25
4b
7.564
7.373
0.191
7.249
7.33
−0.08
4c
7.14
7.064
0.076
6.77
6.909
−0.14
4d
7.337
7.285
0.052
6.987
6.797
0.19
4e
7.082
7.248
−0.17
6.57
6.77
−0.2
5a
7.564
7.759
−0.2
7.506
7.385
0.121
5b
7.674
7.673
0.001
7.551
7.672
−0.12
5c
7.618
7.249
0.369
7.073
7.057
0.016
5d
7.804
7.424
0.38
7.363
7.034
0.329
5e
7.201
7.339
−0.14
6.562
6.686
−0.12
6a
6.728
6.708
0.02
6.893
6.765
0.128
6b
7.356
7.105
0.251
7.001
6.901
0.1
7a
6.145
6.08
0.065
6.055
5.954
0.1
7b
5.881
5.151
−0.27
5.593
5.706
−0.11
16a
7.58
7.613
−0.03
7.097
7.109
−0.01
16b
7.556
7.68
−0.12
7.119
6.945
0.174
17a
7.593
7.63
−0.04
7.286
7.166
0.119
17b
7.504
7.672
−0.17
7.121
7.058
0.063
4 Conclusion
The present work shows how a set of antimalarial activities of various 4-quinolylhydrazones may be treated statistically to uncover the molecular characteristics which are essential for high activity. The generated models were analyzed and validated for their statistical significance and external prediction power. The awareness and understanding of the descriptors involved in antimalarial activity of these compounds could provide a great opportunity for the ligand structures design with appropriate features, and for the explanation of the way in which these features affect the biological data upon binding to the respective receptor target. The results derived may be useful in further designing more novel antimalarial agents in series.
Acknowledgments
The author thanks Vlife Science Technologies Pvt. Ltd for providing the software for the study. Nitendra K. Sahu is thankful to theCouncil of Scientific and Industrial Research (CSIR), New Delhi, India for provision of a senior research fellowship. The authors also thank the anonymous reviewers whose valuable comments and suggestions greatly helped in improving the manuscript.
References
- Curr. Med. Chem.. 2008;15(16):1552-1569.
- J. Med. Chem.. 2004;47(22):5418-5426.
- Bioorg. Med. Chem.. 2009;17:319-325.
- J. Am. Chem. Soc.. 1988;110:5959-5967.
- Regression and Linear Models;. New York: McGraw-Hill; 1990.
- J. Med. Chem.. 2005;48(17):5423-5436.
- J. Enzyme Inhib. Med. Chem.. 2009;24(1):94-104.
- J. Mol. Graph. Model. 2002;20:269-276.
- J. Chem. Inf. Comput. Sci.. 2003;43:144-154.
- J. Mach. Learning Res.. 2003;3:1157-1182.
- J. Comput. Chem.. 1996;17:553-586.
- Chem. Rev.. 2001;101:619-672.
- Quant. Struct.–Act. Relat.. 1999;18:262-272.
- Quant. Struct.–Act. Rel.. 1996;15:285-289.
- Bioorg. Med. Chem.. 2006;14(7):2333-2357.
- QSAR Comb. Sci.. 2009;28(4):447-457.
- Chem. Biol. Drug Des.. 2008;71:287-297.
- J. Med. Chem.. 1999;42:4630.
- VLife MDS 3.5., 2008. Molecular design suite, Vlife Sciences Technologies Pvt. Ltd. Pune, India.
- WHO Expert Committee on Malaria, Technical Report Series, Twentieth Report, 2000; World Health Organization, Geneva.
- Win CAChe version 6.1: Fujitsu Pvt. ltd., Japan Inc., http://www.cachesoftware.com/contacts/japan.shtml.
- J. Med. Chem.. 2008;51:1995.
- J. Chem. Inf. Comput. Sci.. 2000;40:185-194.


