

Translate this page into:
Adsorption behavior of lead onto a new class of functionalized silica gel
⁎Corresponding author. Tel.: +91 532 2462393. atulkk2008@gmail.com (Atul Kumar Kushwaha),
-
Received: ,
Accepted: ,
This article was originally published by Elsevier and was migrated to Scientific Scholar after the change of Publisher.
Peer review under responsibility of King Saud University.

Abstract
In this study the surface of silica gel was functionalized with 2-thiophenecarbonyl, 2-furoyl and l-proline. The synthesized materials were characterized by fourier transform infrared (FTIR) spectroscopy and scanning electron microscope (SEM) with energy dispersive X-ray analyzer (EDX). Batch adsorption studies were carried out to analyze the adsorption of the lead ion from aqueous solution. The factors influencing % adsorption of Pb(II) onto the silica gel and functionalized silica gel such as initial pH value of the Pb(II) ion solution, adsorbent dose, initial Pb(II) ion concentration, contact time and temperature were investigated. Langmuir and Freundlich isotherm models were used to determine the isotherm parameters associated with the adsorption process. Kinetic data were analyzed considering pseudo-first order, pseudo-second order and intraparticle diffusion approaches. The latter two mechanisms seem to be significant in the rate-controlling step. Negative values of Gibb's free energy change (ΔG°) showed that the adsorption was feasible and spontaneous and negative values of enthalpy change (ΔH°) confirmed exothermic adsorption.
Keywords
Adsorption
Kinetics
Lead
Silica gel
Isotherm
Thermodynamics

1 Introduction
The release of heavy metals from many industrial processes leads to an increase in the concentration of heavy metals in the aquatic system and have created major global concern because of their high toxicity. In fact, the presence of heavy metals in water supplies may cause serious environmental problems in view of human health and other living beings. Among the different heavy metals, lead is one of the common and most toxic pollutants released into the natural waters from various industrial activities such as metal plating, oil refining and battery manufacturing. Lead has been found to be acute toxic to human beings when present in high amounts (e.g. >15 μg/L in drinking water) (Inglezakis et al., 2007). Lead can cause acute adverse effects on the liver, kidney and reproductive system, basic cellular processes and brain functions. Hence it is necessary to remove lead from water at least below the regulatory level.
Various processes have been proposed for the removal of lead from aqueous solution. The important ones are adsorption (Sari et al., 2007a), ion exchange (Dabrowski et al., 2004), photocatalysis (Murruni et al., 2007), floatation, hyper-filtration, chemical precipitation, reverse osmosis etc. Among these the adsorption process is found to be quite suitable, cheap and effective for the removal of lead from aqueous solution. A number of adsorbents including clay (Abu-Eishah, 2008), zeolite (Nah et al., 2006), biosorbent (Akar and Tunali, 2006; Gundogdua et al., 2009; Sari et al., 2007b), agricultural wastes (Ayyappan et al., 2005), organic/inorganic composite (Solener et al., 2008; Tran et al., 2010) and alumina (Mahmoud et al., 2010) have been tried for the removal of lead from the aquatic system. In order to improve the efficiency of the adsorption processes, it is necessary to develop cheaper and easily available adsorbents with high adsorption capacities.
Availability of silica is in plenty and its high potential toward the adsorption of organic and inorganic compounds has attracted the attention of many researchers to use it for the removal of pollutants. The presence of –OH groups on the surface of the silica gel (SG) create sites for adsorption of Pb(II). In order to get high adsorption capacity, a new class of functionalized silica gel was synthesised by loading it with 2-thiophenecarbonyl, 2-furoyl and l-proline. The adsorption properties of the activated silica gel (ASG), 2-thiophenecarbonyl loaded silica gel (TLSG), 2-furoyl loaded silica gel (FLSG) and l-proline loaded silica gel (PLSG) were investigated with lead as the target pollutant from aqueous solution as a function of pH, adsorbent dose, initial Pb(II) ion concentration, contact time and temperature. The adsorption capacity of all the adsorbents was compared with each other for getting a better adsorbent in order to get high adsorption efficiency for the removal.
2 Materials and methods
2.1 Adsorbent
Silica gel G (SG) was obtained from Sigma Aldrich Chemicals Pvt. Ltd., India. Activation of SG was done by adding 100 mL of 6 M HCl in 20 g of SG and the mixture was allowed to reflux with continuous stirring for 4 h. The resultant material was filtered and washed with double distilled water until the pH became 7 and dried at 150 °C for 5 h.
The thiophenecarbonyl loaded silica gel (TLSG) was prepared by mixing 3 mmol of 2-thiophenecarbonyl chloride with 1 g of activated silica gel (ASG) and the mixture was stirred vigorously for 5 h at reflux temperature. The resulting material was washed with toluene to remove unattached thiophenecarbonyl chloride and finally dried in a hot air oven at 80 °C. The 2-furoyl loaded silica gel (FLSG) was synthesized using asimilar method given for the synthesis of TLSG. l-Proline loaded silica gel (PLSG) was prepared by mixing 3 mmol of l-proline solution with 1 g of activated silica gel (ASG) and the mixture was stirred vigorously for 30 min at 50 °C. The resulting slurry was poured onto a stainless steel tray and was kept at 50 °C for 24 h in forced air oven followed by an increase in temperature up to 120 °C, where thermochemical reaction between silica gel and l-proline takes place. After cooling, the material was washed with double distilled water and dried in a hot air oven at 80 °C. The resulting materials (ASG, TLSG, FLSG and PLSG) were kept in a dessicator for use as an adsorbent.
2.2 Adsorption experiment
Batch adsorption experiments were carried out to determine the effects of pH, adsorbent dose, initial Pb(II) ion concentration, contact time and temperature by varying the parameter under study and keeping other parameters constant.
Stock solution (1000 mg/L) of Pb(II) was prepared by dissolving the requisite amount of Pb(NO3)2 (Merck) into double distilled water. It was subsequently diluted to different concentrations (5, 10, 15, 20 and 25 mg/L) and the pH of Pb(II) ion solutions were maintained by adding 0.1 M HNO3 or 0.1 M NaOH. In each experiment a pre-weighed amount of adsorbent was added to 50 mL of Pb(II) ion solution in 150 mL conical flasks and stirred on a magnetic stirrer (Remi) at the speed of 200 rpm. The adsorption was monitored by determining the concentration of Pb(II) in solution by an atomic absorption spectrophotometer (ECIL 4141).
Percentage of Pb(II) adsorption and quantity of Pb(II) adsorbed on the adsorbent at the time of equilibrium (qe) was calculated using Eqs. (1) and (2) respectively.
3 Results and discussion
3.1 Characterization of adsorbents
The FT-IR spectra of ASG, TLSG, FLSG and PLSG were recorded by FTLA2000 spectrophotometer using KBr disc method and are shown in Fig. 1. FT-IR spectra of ASG showed a band at 1027 cm−1 due to asymmetric stretching of Si–O–Si and corresponding symmetric stretching was observed at 805 cm−1. The Si–O–Si bending mode was positioned at 502 cm−1. The peaks at 3473 cm−1 and 1594 cm−1 were due to the stretching and bending of O–H groups present in silica respectively. The FT-IR spectra of TLSG, FLSG and PLSG showed a band at 1350 cm−1 which was due to the bending of C–H group and the band around 1740 cm−1 was due to the stretching of C⚌O group of ester which confirms loading of ASG with 2-thiophenecarbonyl in TLSG, 2-furoyl in FLSG and l-proline in PLSG.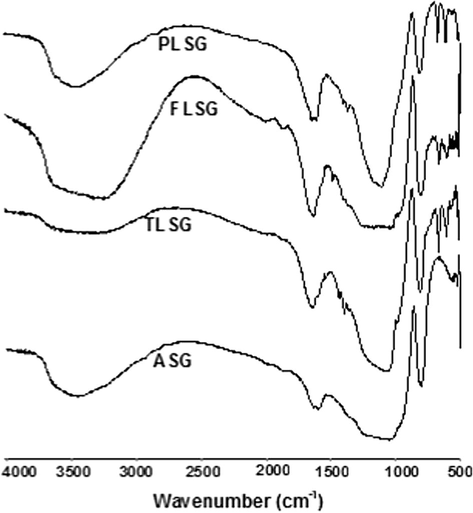
FT-IR spectra of ASG, TLSG, FLSG and PLSG.
Surface morphology of adsorbents and wt.% of elements was studied using SEM-EDX (Carl Zeiss NTS GmbH, Oberkochen, Germany; Model: SUPRA 40VP). SEM micrograph (Fig. 2a–d) of adsorbents showed a rough and porous nature, indicating that the materials present good characteristics to be employed as an adsorbent for metal ion uptake. There was no significant change observed in surface morphology of ASG after its loading with 2-thiophenecarbonyl, 2-furoyl and l-proline. This indicated that the differences in adsorption capacity depend on functional groups present on its surface and not due to the morphology of adsorbents. EDX spectra (Fig. 3a–d) were recorded and wt.% of elements is shown in Table 1. Results showed carbon/silica (C/Si) ratio in ASG, TLSG, FLSG and PLSG as 0.007, 0.24, 0.32 and 0.358, respectively. EDX analysis yielded direct evidence for the functionalization of silica gel surface with 2-thiophenecarbonyl, 2-furoyl and l-proline.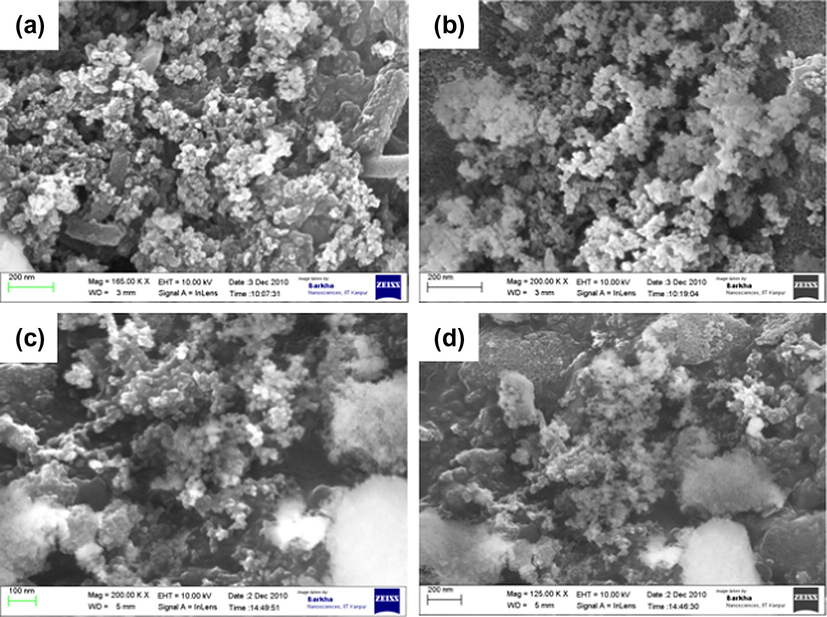
SEM images of ASG (a), TLSG (b), FLSG (c) and PLSG (d).
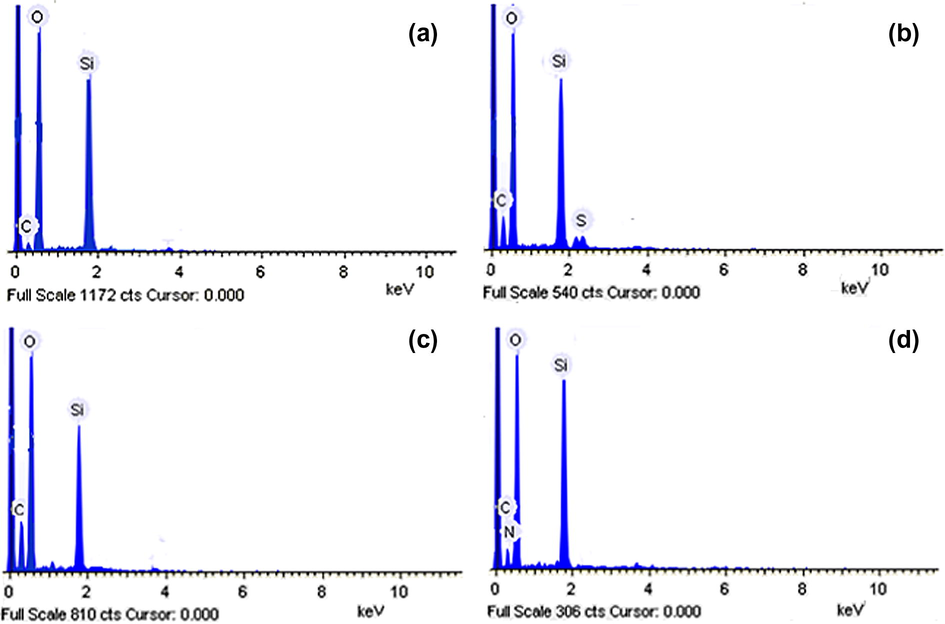
EDX spectra of ASG (a), TLSG (b), FLSG (c) and PLSG (d).
Adsorbents
Wt.% of elements
Si
O
C
S
N
ASG
41.65
58.04
0.3
–
–
TLSG
33.6
55.05
8.15
3.2
–
FLSG
32.43
57.1
10.4
–
–
PLSG
31.7
54.64
11.35
–
2.3
3.2 Influence of pH
The pH of the aqueous solution has a significant effect on the adsorptive uptake of metal ions presumably due to its impact on both the surface binding-sites of the adsorbent and the presence of hydrogen ion in solution. The influence of pH on adsorption of Pb(II) ion was studied over the pH range 2–5.5. Fig. 4 shows that the adsorption of Pb(II) ion increased as pH increased from 2 to 5.5. At lower pH values, hydrogen ion concentration in solution increased, which competes with Pb(II) ions for the binding sites of the adsorbent and reduced the adsorbed amounts of Pb(II) ion. At higher pH values, the presence of hydrogen ions in the solution decreased and the adsorbent surface also deprotonated, resulting in increased adsorption of Pb(II). Further increase in pH causes precipitation of Pb(II) due to the formation of hydroxide, therefore, a pH higher than 5.5 was avoided.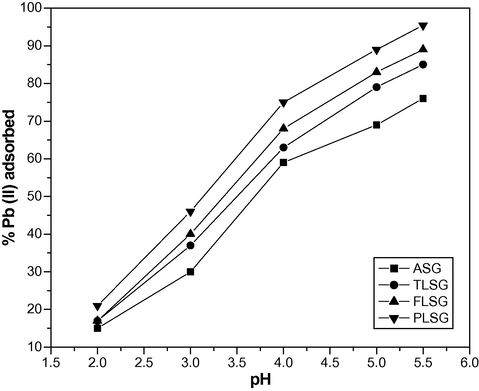
Influence of pH on adsorption of Pb(II) on ASG, TLSG, FLSG and PLSG (adsorbent dose: 2 g/L; initial Pb(II) concentration: 10 mg/L; contact time: 90 min; temperature: 303 K).
3.3 Effect of adsorbent dose
The effect of adsorbent dose on adsorption was studied in the range of 0.5–4 g/L. Fig. 5 shows that the adsorption of Pb(II) on ASG, TLSG, FLSG and PLSG increased from 42% to 76%, 43% to 85%, 49% to 89% and 54% to 95.4% respectively, when the adsorbent dose increased from 0.5 to 2 g/L. This increase in adsorption was due to an increase in the adsorptive surface area and the availability of more active adsorption sites. A Further increase in the adsorbent dose did not cause any significant change because equilibrium was achieved between the solid and the solution phase.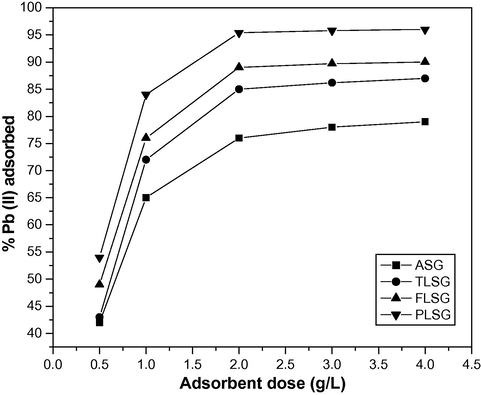
Effect of adsorbent dose on adsorption of Pb(II) on ASG, TLSG, FLSG and PLSG (pH: 5.5; initial Pb(II) concentration: 10 mg/L; contact time: 90 min; temperature: 303 K).
3.4 Effect of initial Pb(II) ion concentration
To observe the effect of initial Pb(II) concentration on adsorption, the experiments were conducted over the range of initial Pb(II) ion concentration (5–25 mg/L) (Fig. 6). The % removal of Pb(II) decreased from 78 to 66.4%, 86 to 76.8%, 90.6 to 83.2% and 95.8 to 92.4% onto ASG, TLSG, FLSG and PLSG respectively as initial Pb(II) ion concentration increased from 5 to 25 mg/L. In spite of this, the absolute amount of Pb(II) adsorbed at equilibrium increased in all cases, from 1.9 to 8.2 mg/g, 2.1 to 9.5 mg/g, 2.2 to 10.3 mg/g and 2.3 to 11.4 mg/g onto ASG, TLSG, FLSG and PLSG, respectively, with an increase in the initial concentration of Pb(II) from 5 to 25 mg/L, attesting to the efficacy of the removal process. Apparently, the initial Pb(II) concentration plays an important role in affecting the capacity of adsorbents to adsorb Pb(II). The higher the initial concentration of Pb(II), stronger the driving force of the concentration gradient and therefore the higher the adsorption capacity (Weng et al., 2009).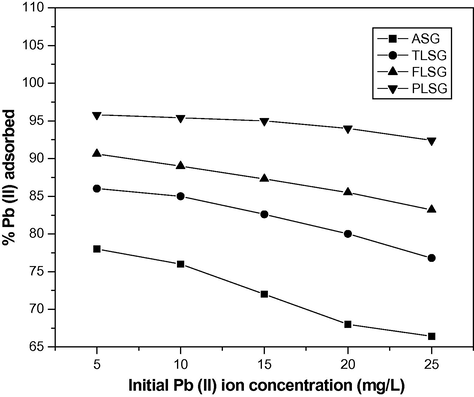
Effect of initial Pb(II) ion concentration on adsorption of Pb(II) on ASG, TLSG, FLSG and PLSG (adsorbent dose: 2 g/L; pH: 5.5; contact time: 90 min; temperature: 303 K).
3.5 Adsorption kinetics
From Fig. 7, a two-stage kinetic behavior was evident: a very rapid initial adsorption over a few minutes, followed by a longer period of much slower uptake. The rate of adsorption of Pb(II) was very rapid in the first 15 min, thereafter it declined slowly with lapse of time. Maximum % adsorption was found at 90 min of contact time and thereafter no change was observed, this indicates that the adsorption process has reached the equilibrium point.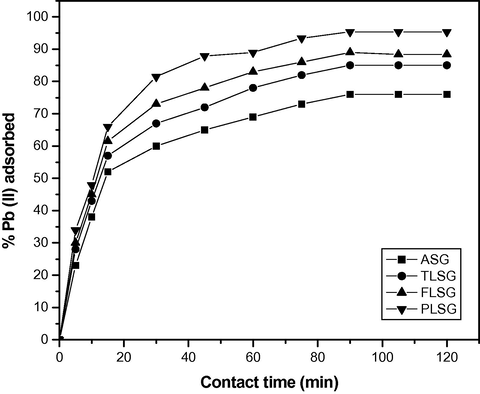
Adsorption kinetics of Pb(II) on ASG, TLSG, FLSG and PLSG (adsorbent dose: 2 g/L; initial Pb(II) concentration: 10 mg/L; pH: 5.5; temperature: 303 K).
Several kinetic models have been proposed to clarify the mechanism of a solute adsorption from aqueous solution onto an adsorbent. The rate constant of adsorption was determined from the pseudo-first order rate expression (Eq. (3)) (Gupta et al., 2011) given by Lagergren:
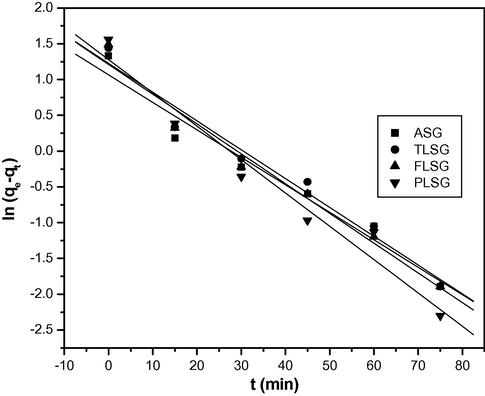
Pseudo-first order kinetics plots for adsorption of Pb(II) on ASG, TLSG, FLSG and PLSG (adsorbent dose: 2 g/L; initial Pb(II) concentration: 10 mg/L; pH: 5.5; temperature: 303 K).
Adsor-bents
qeexp
Pseudo-first order
Pseudo-second order
Intraparticle diffusion
qecal
k1
R2
qecal
k2
R2
ki
C
R2
ASG
3.8
2.90
0.038
0.962
3.89
0.045
0.988
0.015
2.47
0.971
TLSG
4.25
3.40
0.040
0.970
4.38
0.038
0.987
0.018
2.72
0.962
FLSG
4.45
3.35
0.041
0.972
4.56
0.043
0.991
0.017
3.01
0.928
PLSG
4.77
3.58
0.046
0.960
4.90
0.046
0.994
0.017
3.35
0.842
The pseudo-second order sorption kinetics (Gupta et al., 2011) may be written as follows:
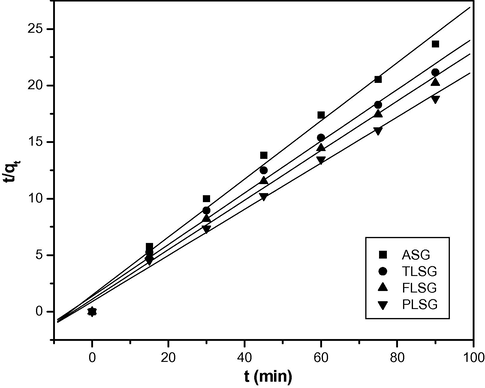
Pseudo-second order kinetics plots for adsorption of Pb(II) on ASG, TLSG, FLSG and PLSG (adsorbent dose: 2 g/L; initial Pb(II) concentration: 10 mg/L; pH: 5.5; temperature: 303 K).
Intraparticle diffusion plays an important role in the adsorption process. It is a multi-step process, involving adsorption on the external surface and diffusion into interior. The intraparticle diffusion model (Kushwaha et al., 2010) can be expressed as follows:
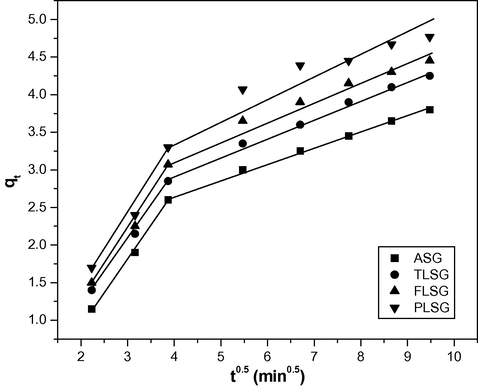
Intraparticle diffusion plots for the adsorption of Pb(II) on ASG, TLSG, FLSG and PLSG (adsorbent dose: 2 g/L; initial Pb(II) concentration: 10 mg/L; pH: 5.5; temperature: 303 K).
3.6 Adsorption isotherm
Adsorption equilibrium describes the nature of adsorbate–adsorbent interaction. In the present study the equilibrium data were analyzed using the Langmuir and Freundlich isotherm models. The analysis of the isotherm data by seeing how well they can be accommodated by different models is an important step in establishing a model that can be successfully used for design purposes.
3.6.1 Langmuir isotherm model
The saturated monolayer isotherm can be represented as:
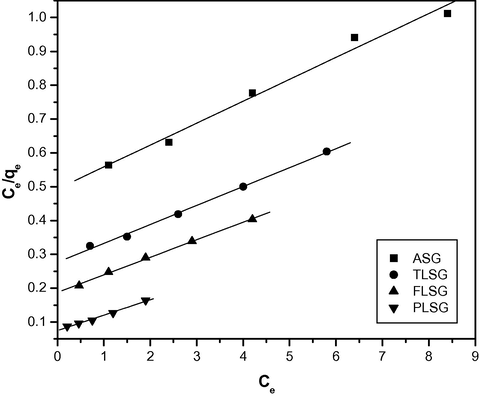
The Langmuir plots for the adsorption of Pb(II) on ASG, TLSG, FLSG and PLSG.
Adsorbents
Langmuir isotherm parameters
Freundlich isotherm parameters
Qmax
b
R2
Kf
n
R2
ASG
15.62
0.129
0.985
1.91
1.43
0.992
TLSG
17.85
0.202
0.996
2.95
1.41
0.987
FLSG
19.60
0.272
0.997
3.99
1.42
0.995
PLSG
22.22
0.608
0.989
7.96
1.38
0.982
3.6.2 Freundlich isotherm model
Freundlich isotherm can be expressed as follows (Aklil et al., 2004):
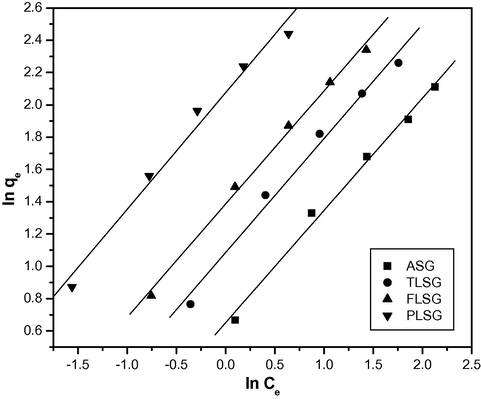
The Freundlich plots for the adsorption of Pb(II) on ASG, TLSG, FLSG and PLSG.
3.7 Thermodynamic study
To observe the effect of temperature on adsorption of Pb(II) onto ASG, TLSG, FLSG and PLSG experiments were conducted at three different temperatures 303, 313 and 323 K. It was observed that the adsorption decreased as the temperature increased, which indicates a low temperature favors Pb(II) adsorption for all the four adsorbents. This may be due to the tendency of Pb(II) molecules to escape from the solid phase to the bulk phase with an increase in temperature of the solution. A similar observation was also reported in the study on the sorption of Pb onto modified and unmodified kaolinite clay (Jiang et al., 2009).
Thermodynamic parameters such as enthalpy (ΔH°), entropy (ΔS°) and Gibb's free energy (ΔG°) are important for a better understanding of the effect of temperature on adsorption, were determined by Eq. (10) (Nandi et al., 2009) and (11).
The values of ΔH° and ΔS° were determined from the slope (−ΔH°/R) and the intercept (ΔS°/R) of the plots of ln (qem/Ce) vs. 1/T (Fig. 13). The ΔG° values were calculated by using Eq. (11). The values of thermodynamic parameters are presented in Table 4. Negative values of ΔG° indicate that the adsorption process was feasible and spontaneous in nature. The negative values of ΔG° increased in the order ASG < TLSG < FLSG < PLSG indicate that the adsorption was more spontaneous on PLSG. Negative value of ΔS° described the decrease in randomness at the adsorbent–solution interface during the adsorption and was more negative for PLSG indicating Pb(II) ion is more stable on PLSG. Negative values of ΔH° suggest the exothermic nature of adsorption and are in the range of −8 to −41 kJ/mol, which indicate that both the physical and chemical adsorption mechanisms were present in the adsorption process.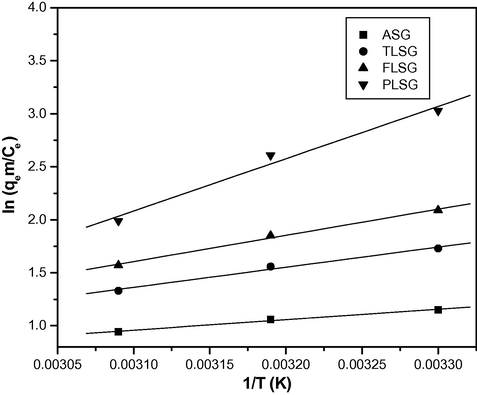
The plots of ln (qem/Ce) vs. 1/T for the adsorption Pb(II) on ASG, TLSG, FLSG and PLSG (adsorbent dose: 2 g/L; initial Pb(II) concentration: 10 mg/L; pH: 5.5; contact time: 90 min).
Adsorbents
ΔH° (kJ/mol)
ΔS° (J/mol/K)
ΔG° (kJ/mol)
303 K
313 K
323 K
ASG
−8.164
−17.35
−2.907
−2.734
−2.560
TLSG
−15.779
−37.60
−4.387
−4.011
−3.635
FLSG
−20.543
−50.34
−5.290
−4.787
−4.284
PLSG
−41.012
−109.8
−7.743
−6.645
−5.547
3.8 Adsorption mechanism
At optimum condition % removal of Pb(II) by adsorption was observed as 76%, 85%, 89% and 95% by ASG, TLSG, FLSG and PLSG respectively. All the three functionalized adsorbents having an adsorption capacity greater than ASG and PLSG were found to be best among the four adsorbents. The % removal of Pb(II) was increased by 9%, 13% and 19% after the modification of ASG to TLSG, FLSG and PLSG respectively. The highest % removal shown by PLSG was due to the presence of nitrogen as a donor atom having a lone pair of electrons, which was freely available for chelation with Pb(II), but in the case of TLSG and FLSG a lone pair of sulfur and oxygen was conjugated with double bonds and used to stabilize the aromatic ring, which reduced its availability for chelation and adsorption capacity. The proposed scheme for the adsorption mechanism is given in Fig. 14.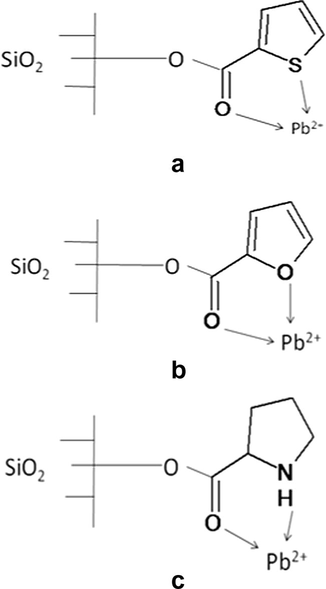
Scheme of adsorption mechanism of Pb(II) on TLSG (a), FLSG (b) and PLSG (c).
4 Conclusions
The % removal of Pb(II) increased after loading SG with organic functional groups and the highest adsorption was observed on PLSG (95%). The optimum condition for the adsorption was found to be pH 5.5 and temperature 303 K. Adsorption processes followed pseudo-second order kinetics, surface adsorption and intraparticle diffusion mechanism. Equilibrium studies showed that the adsorption of Pb(II) onto ASG, TLSG, FLSG and PLSG followed the Langmuir and freundlich isotherm models. Negative values of ΔH° and ΔG° indicate that the adsorption of Pb(II) onto ASG, TLSG, FLSG and PLSG was thermodynamically feasible, spontaneous and exothermic.
Acknowledgements
The authors are thankful to Dr. Dinesh Deva of Nanoscience, IIT Kanpur, India for recording SEM-EDX and the Council of Scientific and Industrial Research (CSIR), New Delhi, India, for the financial support.
References
- Removal of Zn, Cd, and Pb Ions from water by Sarooj clay. Applied Clay Sci.. 2008;42:201-205.
- [Google Scholar]
- Biosorption characteristics of Aspergillus flavus biomass for removal of Pb(II) and Cu(II) ions from an aqueous solution. Bioresour. Technol.. 2006;97:1780-1787.
- [Google Scholar]
- Removal of heavy metal ions from water by using calcined phosphate as a new adsorbent. J. Hazard. Mater.. 2004;112:183-190.
- [Google Scholar]
- Removal of Pb(II) from aqueous solution using carbon derived from agricultural wastes. Process Biochem.. 2005;40:1293-1299.
- [Google Scholar]
- Selective removal of the heavy metal ions from waters and industrial wastewaters by ion-exchange method. Chemosphere. 2004;56:91-106.
- [Google Scholar]
- Uptake of heavy metals from synthetic aqueous solutions using modified PEI—silica gels. Water Res.. 2003;37:729-734.
- [Google Scholar]
- Biosorption of Pb(II) ions from aqueous solution by pine bark (Pinus brutia Ten.) Chem. Eng. J.. 2009;153:62-69.
- [Google Scholar]
- Kinetics and thermodynamics of malachite green adsorption on banana pseudo-stem fibers. J. Chem. Pharm. Res.. 2011;3:284-296.
- [Google Scholar]
- Grass waste: A novel sorbent for the removal of basic dye from aqueous solution. J. Hazard. Mater.. 2009;166:233-238.
- [Google Scholar]
- Adsorption of methylene blue onto bamboo-based activated carbon: kinetics and equilibrium studies. J. Hazard. Mater.. 2007;141:819-825.
- [Google Scholar]
- Equilibrium modeling and kinetic studies on the adsorption of basic dye by a low-cost adsorbent: coconut (Cocos nucifera) bunch waste. J. Hazard. Mater.. 2008;158:65-72.
- [Google Scholar]
- Removal of Pb(II) from aqueous solutions by using clinoptilolite and bentonite as adsorbents. Desalination. 2007;210:248-256.
- [Google Scholar]
- Removal of Pb(II) from aqueous solution using modified and unmodified kaolinite clay. J. Hazard. Mater.. 2009;170:332-339.
- [Google Scholar]
- Mass transfer, kinetics and equilibrium studies for the biosorption of methylene blue using Paspalum notatum. J. Hazard. Mater.. 2007;146:214-226.
- [Google Scholar]
- Enhanced adsorption of malachite green dye on chemically modified silica gel. J. Chem. Pharm. Res.. 2010;2:34-45.
- [Google Scholar]
- Removal and preconcentration of lead (II) and other heavy metals from water by alumina adsorbents developed by surface-adsorbed-dithizone. Desalination. 2010;251:123-130.
- [Google Scholar]
- Photocatalytic removal of Pb(II) over TiO2 and Pt–TiO2 powders. Catalysis Today. 2007;129:127.
- [Google Scholar]
- Removal of Pb ion from water by magnetically modified zeolite. Minerals Eng.. 2006;19:1452-1455.
- [Google Scholar]
- Adsorption characteristics of brilliant green dye on kaolin. J. Hazard. Mater.. 2009;161:387-395.
- [Google Scholar]
- Adsorption characteristics of Cu(II) and Pb(II) onto expanded perlite from aqueous solution. J. Hazard. Mater.. 2007;148:387.
- [Google Scholar]
- Biosorption of Pb(II) and Ni(II) from aqueous solution by lichen (Cladonia furcata) biomass. Biochem. Eng. J.. 2007;37:151-158.
- [Google Scholar]
- Adsorption characteristics of lead(II) ions onto the clay/poly(methoxyethyl)acrylamide (PMEA) composite from aqueous solutions. Desalination. 2008;223:308-322.
- [Google Scholar]
- Preparation of chitosan/magnetite composite beads and their application for removal of Pb(II) and Ni(II) from aqueous solution. Mater. Sci. Eng. C.. 2010;30:304-310.
- [Google Scholar]
- Removal of methylene blue from aqueous solution by adsorption onto pineapple leaf powder. J. Hazard. Mater.. 2009;170:417-424.
- [Google Scholar]


