

Translate this page into:
Synthesis, spectroscopic characterization, molecular modeling and eukaryotic DNA degradation of new hydrazone complexes
⁎Corresponding author. Present address: Chemistry Department, Faculty of Science, Kuwait University, Kuwait. Tel.: +96566734989; fax: +96524816482. aelasmy@yahoo.com (Ahmed A. El-Asmy)
-
Received: ,
Accepted: ,
This article was originally published by Elsevier and was migrated to Scientific Scholar after the change of Publisher.
Peer review under responsibility of King Saud University.

Abstract
2,5-Hexanedione bis(salicyloylhydrazone) [H4L] formed novel complexes with some transition metal ions. H4L and its complexes were characterized by elemental analyses, spectral (IR, 1H NMR, ESR and MS), thermal and magnetic measurements. The complexes have the formulae [VO(H2L)]·2H2O, [Ni(H2L)]·3H2O, [Zn(H2L)], [Ni(H4L)Cl2]·2H2O and [Cr2(H2L)(OAc)2(OH)2]–·2H2O, [Cu(H4L) (H2L)(EtOH)2]·2H2O, [Co2(H2L)(OAc)2]·H2O, [Mn2(H2L)–(OH)2]·H2O [Cu2(H2L)(OAc)2(H2O)6], and [Co2(H2L)(H2O)4Cl2]·2H2O. H4L released its OH or NH protons during the complex formation. Acetate and hydroxo groups bridged the two chromium in [Cr2(H2L)(OAc)2(OH)2]·2H2O. The magnetic moments and electronic spectra of all complexes provide: tetrahedral for [Co2(H2L)(OAc)2]·H2O, [Ni(H2L)]·3H2O and [Zn(H2L)]; square-pyramidal for [VO(H2L)]·2H2O and octahedral for the rest. In DMF solution, the bands are shifted to higher energy suggesting a weak interaction with the solvent. The ESR spectra support the mononuclear geometry for [VO(H2L)]·2H2O and [Cu(H3L)2(EtOH)2]·2H2O. The thermal decomposition of the complexes revealed the outer and inner solvents as well as the end product which in most cases is metal oxide.
Keywords
2,5-Hexanedione bis(salicyloylhydrazone)
Spectra
Antibacterial activity
Thermal analysis
ESR
Molecular modeling

1 Introduction
Many hydrazones have antimicrobial, antitumor and fungicidal activities due to their ability to form stable chelates with the essential metal ions in which the fungus needs in its metabolism (Petering et al., 1973; Van Giessen et al., 1973; Sharma et al., 2007). Mono- and polynuclear Cu2+ complexes serve as models for galactose oxidase and used as an effective oxidant. The redox behavior of the Cu2+ model has a special interest in some biological systems (Sevagapandian et al., 2000; Llanguri et al., 2001). Great interest has been focused on the synthesis and structural characterization of hydrazone complexes in order to compare their coordinative behavior with their antimicrobial activities (Thompson et al., 1953). Diacetylmonoxime thiosemicarbazone is effective against vaccine infections in mice by chelating some essential metal ions from the virus (Perrin, 1976). Metal complexes of salicylaldehyde isobutroyl-hydrazone (HSIBuH) and o-hydroxy-acetophenone isobutyroyl-hydrazone (H2AIBuH) have been prepared (Ibrahim, 1992). An octahedral structure was proposed for [Ni(SIBuH)2], [Ni(HAIBuH)2], [Co(SIBuH)–(OAc)(H2O)] and [Cu(SIBuH)2]·H2O, low-spin octahedral for [Co(HAIBuH)2] and square-planar for [Cu(AIBuH)(H2O)]. 1,1,3-Propanetetrasalisoyltetracarbo-hydrazone (H8PTSTCH) has multidentate behavior and flexibility to bind in three dimensional space (El-Asmy et al., 1994) to form [Cu4(PTSTCH)–(H2O)8]·4H2O, [Co(PTSTCH)(H2O)12]·–6H2O, [Sn4(PTSTCH)–(H2O)8] and [(UO2)4(PTSTCH)(H2O)8]. Salicyl-aldehyde salicylhydrazone, H2SS, complexes [M(HSS)2] (M = Cu2+, Co2+, Mn2+, VO2+, TiO2+), [M‘(SS)] (M‘ = Cu2+, Ni2+, Co2+) and [Cu(HSS)] have been synthesized forming square-planar geometry with Cu2+ and octahedral with Ni2+ and Co2+ (Narang and Aggakwai, 1974). 2-Aceto-1-naphthol-N-salicoylhydrazone was success-fully used for the microdetermination of metal ions in solution (Khattab et al., 1982). Salicaldehyde furonylhydrazone behaves as dibasic ONO forming [Ni(L)(H2O)2], [Co(L)(H2O)2], [CuL], [Zn(L)(H2O)], [Zr(OH)2(L)–(CH3OH)2], [Zr(OH)2(HL)2], [MoO(L)Cl] and [UO2(L)(CH3OH)]. The Cu2+ and Mo(V)O complexes exhibit subnormal magnetic moments with anti-ferromagnetic interaction (Syamal and Maurya, 1985). Mn2+, Co2+, Ni2+, Cu2+ and Zn2+ complexes of salicylidene-N-cyanoacetohydrazone, H2L1 and 2-hydroxy-l-naphthylidene-N-cyanoaceto hydrazone, H2L2 have been characterized and exhibit octahedral configuration, except [Co(HL2)OAc] which has tetrahedral structure (Abou El-Enein et al., 2008). No work was done on the ligand under investigation as well as its metal complexes.
2 Experimental
All materials and solvents were used as received. 2,5-Hexanedione, salicaldehyde, and hydrazine hydrate were BDH products. VOSO4·H2O, Cr3(OAc)7(OH)2, MnCl2·4H2O, CoCl2·6H2O, Co(OAc)2·4H2O, NiCl2·6H2O, Ni(OAc)2·4H2O, CuCl2·2H2O Cu(OAc)2·H2O and Zn(OAc)2·2H2O were from Sigma–Aldrich, Germany. Ethanol, methanol, diethylether, acetone, dimethylsulfoxide and dimethylformamide were E. Merk products, and directly used.
2.1 Synthesis of the ligand
The ligand was prepared by similar method reported earlier for 2,5-hexanedione bis(isonicotinyloylhydrazone) (El-Asmy et al., 2010) by the reaction of 0.05 mol of 2,5-hexanedione with 0.1 mol of salicylic acid hydrazide, in 50 ml ethanol. The reaction mixture was boiled under reflux on a water bath for 2 h. After evaporation, the precipitate formed was separated by filtration, recrystallized from ethanol and dried. The preparation procedure is shown as follows: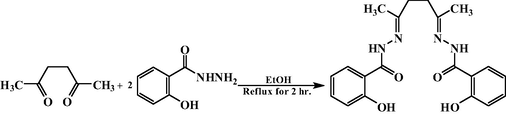
2.2 Synthesis of the complexes
Mononuclear complexes were prepared by heating a mixture of the ligand (3 mmol), dissolved in 20 ml aqueous-ethanol mixed with three drops of 5 M NaOH, and the metal salts (3 mmol) in 30 ml ethanol on a water bath for 1 h. Binuclear complexes were prepared by heating a mixture of the ligand (3 mmol, in NaOH) and the metal salts (6 mmol) in 30 ml aqueous-ethanol solution (v/v) under reflux on a water bath for 4–6 h. The precipitate was filtered off, washed with diethyl ether and finally dried in a vacuum desiccator over anhydrous CaCl2.
2.3 Physical measurements
C, H and N were performed at the Microanalytical Unit of Cairo University. Metal analyses were carried out according to the standard methods (Vogel, 1994). Chloride ion was determined gravimetrically as AgCl. Molar conductance values for the soluble complexes (10−3 mol L−1) in DMSO were measured at room temperature (25 ± 1 °C) using a Tacussel conductivity bridge model CD6NG. The IR spectra (KBr disks) were recorded on a Mattson 5000 FTIR Spectrophotometer (400–4000 cm−1). The electronic spectra, as Nujol and/or DMF solution, were recorded on a UV2–100 Unicam UV/Vis. The 1H NMR spectra of H4L and its Zn2+ complex, in d6-DMSO (300 MHz) were recorded on a Varian Gemini Spectrometer. ESR spectra were obtained on a Bruker EMX spectrometer working in the X-band (9.78 GHz) with 100 kHz modulation frequency. The mass spectrum of the ligand was recorded in Varian MAT 311 Spectrometer. The magnetic moments were measured at 25 ± 1 °C using a Johnson Matthey magnetic susceptibility balance. Thermogravimetric measurements were recorded on a DTG-50 Shimadzu thermogravimetric analyzer. The nitrogen flow and heating rate were 20 ml min−1 and 10 °C min−1. The effect of buffer at pH 2–12 on the ligand was carried out by recording the spectra of 0.5 ml of 1 × 10⁻² mol l−1 of H4L in EtOH and the measuring flask was completed to 10 ml with aqueous buffer solution having the desired pH without adding supporting electrolyte. The theoretical calculations were performed using Hyper Chem 7.5 program system. The molecular geometry of the ligand was optimized using molecular mechanics (MM+) and then optimized at PM3 using the Polak-Ribiere algorithm.
2.4 Antibacterial activity
The ligand and some complexes were screened against Sarcina sp. as Gram positive and Escherichia Coli as Gram negative bacteria using the cup-diffusion technique. A 0.2 ml of each (10 μg/ml) was placed in the specified cup made in the nutrient agar medium on which a culture of the tested bacteria has been spread to produce uniform growth. After 24 h incubation at 37 °C, the diameter of inhibition zone was measured as mm.
2.5 Genotoxicity
A solution of 2 mg of Calf thymus DNA was dissolved in 1 ml of sterile distilled water. Stock concentrations of the investigated ligand and its complexes were prepared by dissolving 2 mg/ml DMSO. Equal volumes from each compound and DNA were mixed thoroughly and kept at room temperature for 2–3 h. The effect of the chemicals on the DNA was analyzed by agarose gel electrophoresis. A 2 μl of loading dye was added to 15 μl of the DNA mixture before being loaded into the well of an agarose gel. The loaded mixtures were fractionated by electrophoresis, visualized by UV and photographed.
2.6 Computational details
The theoretical calculations of the quantum chemistry were performed on a Pentium 4 (3 GHz) computer using Hyper Chem 7.5 program system. The molecular geometry of the ligand was optimized using molecular mechanics (MM+). The low lying obtained from MM+ was then optimized at PM3 using the Polak-Ribiere algorithm in RHF-SCF, set to terminate at an RMS gradient of 0.01 kcal Å−1 mol−1 and convergence limit was fixed to 1 × 10⁻⁸ kcal mol−1.
3 Results and discussion
3.1 Characterization of the ligand
3.1.1 Molecular geometry of H4L
The atomic numbering scheme and the theoretical geometric structure for H4L are shown in Scheme 1. Reading the values of the bond lengths and angles, one can observe the formation of intramolecular hydrogen bond [(49)H–O(27)…. H(40)–N(10)] from one side with a bond length of 1.89 Ǻ; the other side has no hydrogen bonding. The molecular parameters of the ligand are: total energy (−104472), binding energy (−5309), electronic energy (−785.537), heat of formation (−55.09) kcal/mol; HOMO (−9.1591), LUMO (−0.4474) and the dipole moment (4.024 D).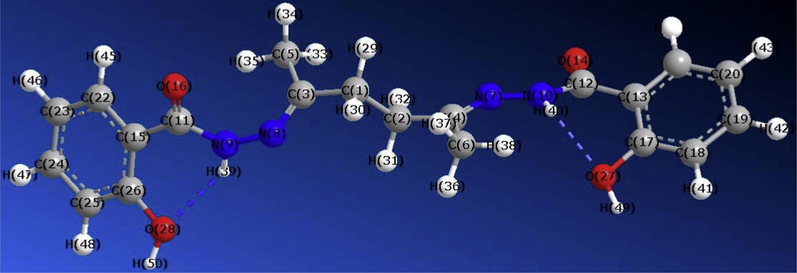
Molecular modeling of H4L using HyperChem 7.5 program optimized using molecular mechanics (MM+) at PM3 using the Polak-Ribiere algorithm.
3.1.2 Effect of solvents and buffer on the ligand
The spectrum of H4L shows the π → π∗ and n → π∗ bands at 38760, 36495, 29940 and 31445 cm−1 for the C⚌O and C⚌N groups. In water, the main bands are found at 42370, 33555 and 30675 cm−1. The spectrum in benzene (nonpolar molecule) has three bands at 38170, 32465 and 26455 cm−1; the spectrum is changed from polar to nonpolar solvent due to the formation of hydrogen bonding with H2O. The bands at (43105 and 33110), (41320, 38760, 36765 and 33110 cm−1), and (40000, 32050, 28900 and 26665 cm−1) are observed in CH3OH, C2H5OH, and CH3Cl, respectively. The spectra are similar in DMF and DMSO with strong bands at 29760 and 29240 cm−1, respectively. In acetone, two weak bands are observed due to the weak solubility.
Examining the spectra at different pHs, the main band due to the nonionic form of the ligand observed at 300 nm is unaltered in the pH range of 2–7. A new band at 326 nm is observed in the pH 10–12 due to the ionic form. The spectrum at pH 7–9 has two bands at 300 and 326 nm representing the pH at which the two forms exist in equilibrium. The values [7.42 (7.33), 9.62 (10.49)] are nearly similar at the two wavelengths 326 (300 nm). The first may be due to the liberation of the amidic proton (CONH) while the second is due to the phenoxy proton (OH). The relation between the absorbance and pH at two wavelengths (Fig. 1) was used to calculate the pK’s of the ligand. The curves are characterized by two well defined s-shapes denoting the presence of two pK’s. The pK in each s-shape is calculated by the half height method (Issa et al., 1973).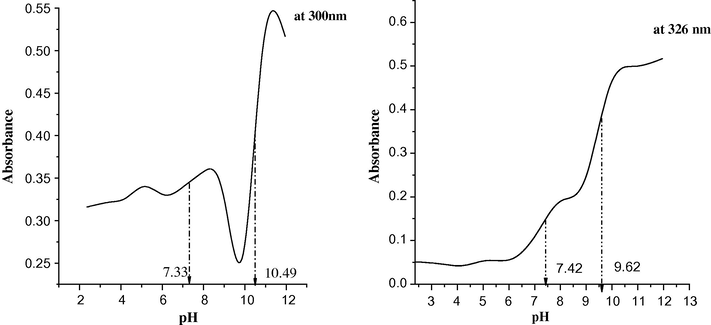
Absorbance-pH relation for the ligand at 300 and 326 nm.
3.1.3 IR, 1H NMR and MS spectra of the ligand
The IR assignments of H4L bands are included in Table 2. The spectrum shows bands at 3290, 3090, 1644, 1626 and 1368 cm−1 assigned to υ(OH), υ(NH), υ(C⚌O), υ(C⚌N) and δ(OH) vibrations, respectively. The 1H NMR spectrum shows signals at 12.44 and 11.19 ppm for the OH protons (due to the presence of the two −OH in different planes) one in the plane while the other is out-of-plane. The signal at 10.02 ppm is due to the NH proton while the multiple signals at 7.88–6.82 ppm are due to the phenyl groups. The CH3 and CH2 protons appeared at 2.04 and 3.32 ppm. On deuteration, the signals of OH and NH disappeared. The mass spectrum of H4L reveals the molecular ion peak [M−4]+ at m/z = 378 (Mol. Wt. = 382). The fragmentation pattern of the ligand is represented in Scheme 2.
Serial No.
ν(OH)
δ(OH)
ν(NH)
ν(C⚌N)
ν(C⚌Na)
ν(C⚌O)
ν(CO)
υ(M–O)
υ(M–N)
1
3290
1368
3039
1626
–
1644
–
–
–
2
–
–
3099
1610
–
1652
–
526
464
3
3389a
1399
1605
–
1605
1247
532
437
3278
1326a
4
3446b
1373
1612
1577
–
1249
539
424
3426
1328a
3384a
5
3590
1374
–
1594
1532
–
1253
529
423
3440b
6
3410
1378
–
1603
1565
–
1248
533
464
7
3370(br)
1363
3279
1609
–
1633
1242
530
431
8
3316
1375
–
1600
1536
–
1258
498
440
9
3412(br)
1375
3078
1607
1531
1653
1223
531
486
10
3411
1378
–
1599
1534
–
1252
491
463
11
3199
1376
–
1598
1542
–
1257
499
427
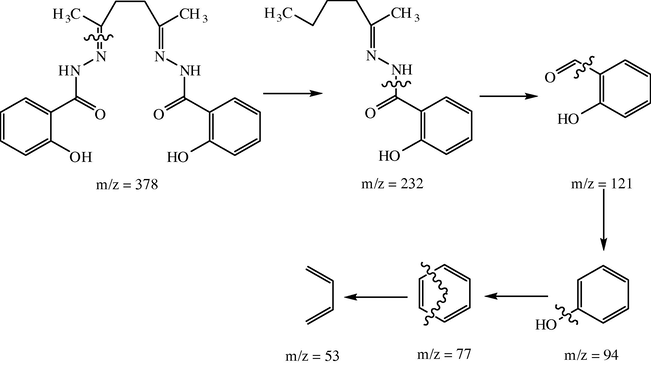
Fragmentation pattern of the ligand.
3.2 Characterization of the complexes
VO2+, Cr3+, Mn2+, Co2+, Ni2+, Cu2+ and Zn2+ ions have the ability to form complexes with H4L having the formulae: [VO(H2L)]·2H2O, [Ni(H2L)]·3H2O, [Zn(H2L)], [Ni(H4L)Cl2]·2H2O, [Cu(H4L)(H2L)-(EtOH)2]·2H2O, [Co2(H2L)-(OAc)2]·H2O, [Cr2(H2L)(OAc)2(OH)2]·2H2O, [Cu2(H2L)(OAc)2−(H2O)6], [Mn2(H2L)(OH)2]·H2O and [Co2(H2L)(H2O)4−Cl2]·2H2O (Table 1). The source of OH in the Cr3+ complex is the metal salt and in the Mn(II) complex from the reaction in basic medium. The complexes are insoluble in most common organic solvents but are completely soluble in DMSO. The molar conductance values, for 10−3 mol L−1 solution, were in agreement with non-electrolytes (Bahgat and Orabi, 2002).
Serial no.
Compound
Empirical formula;
Color
M.P., °C
% Found (Calcd.)
M.W.
C
H
N
Cl
M
1
H4L
C20H22N4O4; 382.42
White
175–176
62.6 (62.8)
5.7 (5.6)
14.3 (14.6)
–
2
[VO(H2L)]·2H2O
C20H24N4O7V; 483.40
Brown
>300
49.7 (49.7)
5.0 (5.0)
11.311.5)
3
[Cr2(H2L)(OAc)2(OH)2]·2H2O
C24H32N4O12Cr2; 671.92
Paige
>300
42.4 (42.8)
5.1 (4.8)
8.1 (8.3)
15.3 (15.5)
4
[Mn2(H2L)(OH)2]·H2O
C20H24N4O7Mn2; 542.24
Paige
>300
44.5 (44.3)
4.4 (4.5)
9.9 (10.3)
–
19.9 (20.2)
5
[Co2(H2L)(H2O)4Cl2]·2H2O
C20H32N4O10Cl2Co2;676.80
Brown
>300
35.3 (35.5)
3.7 (4.7)
7.7 (8.3)
9.9 (10.5)
16.9 (17.4)
6
[Co2(H2L)(OAc)2]·H2O
C24H28N4O9Co2; 636.41
Brown
>300
45.8 (45.3)
4.2 (4.4)
9.1 (8.8)
19.0 (18.5)
7
[Ni(H4L)Cl2]·2H2O
C20H26N4O6Cl2Ni; 548.11
Brown
>300
44.2 (43.8)
5.2 (4.8)
9.9 (10.2)
13.5 (13.0)
10.2 (10.7)
8
[Ni(H2L)]·3H2O
C20H26N4O7Ni; 493.14
Yellow
275–276
50.0 (49.0)
5.1 (5.3)
10.9 (11.4)
11.8 (11.9)
9
[Cu(H4L)(H2L)(EtOH)2]·2H2O
C44H58N8O12Cu; 897.50
Brown
>300
58.3 (58.8)
5.9 (6.5)
12.0 (12.5)
–
6.9 (7.1)
10
[Cu2(H2L)(OAc)2(H2O)6]
C24H38N4O14Cu; 733.5
Brown
>300
38.9 (39.3)
4.8 (5.5)
8.6 (8.9)
17.5 (17.3)
11
[Zn(H2L)]
C20H20N4O4Zn; 445.75
White
>300
53.6 (53.9)
4.5 (4.5)
12.2 (12.6)
14.6 (14.7)
3.2.1 IR and 1H NMR spectra of the complexes
Examining the IR spectra of the complexes (Table 2) one may conclude the following:
-
In all complexes, the υ(C⚌N) in the ligand is shifted to lower wavenumber with the appearance of a new band due to υ(M–N) indicating the participation of this group in bonding.
-
In most complexes, the υ(OH) appeared as medium or broad band at higher wavenumbers proving the destruction of the hydrogen bond accompanied by new bands attributed to the hydroxo bridge (OH) in [Cr2(H2L)(OAc)2(OH)2]·2H2O and [Mn2(H2L)(OH)2]·H2O (Kumar et al., 2009) as well as the hydrate H2O. This observation is supported by the appearance of δ(OH) more or less at the same position with another band at 1328 cm−1 due to the δ(OH) of hydroxo group.
-
In [VO(H2L)]·2H2O, the υ(OH) and δ(OH) bands disappear revealing the deprotonation of the phenolic OH and its participation in bonding.
-
In most complexes, the (C⚌O) and (NH) bands disappear indicating the enolization of CONH and the CO group is participating in coordination. Evidence is the appearance of new bands at 1531–1577 and 1223–1258 cm−1 due to υ(C⚌N∗) and υ(CO) vibrations. In [VO(H2L)]·2H2O and [Ni(H4L)Cl2]·2H2O, the C⚌O and NH bands still existing at the same position.
-
In [Cu(H3L)2(EtOH)2]·2H2O, the (C⚌O) and (NH) bands appear very weak at the same position indicating that the ligands coordinate in the keto-enol form. In [Cr2(H2L)(OAc)2(OH)2]·2H2O, [Co2(H2L)(OAc)2]·H2O and [Cu2(H2L)(OAc)2(H2O)6], the acetate groups act as bridged bidentate confirming by the appearance of two bands in the regions 1599–1605 and 1435–1447 cm−1 with difference ≈150 cm−1 (Adams et al., 2002).
-
The appearance of bands due to υ(M–O), υ(M–OH) and υ(M–OH2) at ≈528 and ≈3347 due to the hydrated water. The bands at 3292, 930 and 600 cm−1 in [Cu2(H2L)(OAc)2(H2O)6] and [Co2(H2L)(H2O)4Cl2]·2H2O are attributed to υ(OH), ρr(H2O) and ρw(H2O) of coordinated water (El-Asmy and Al-Hazmi, 2009).
-
The 1H NMR spectrum of [Zn(H2L)2] shows a signal at 13.65 ppm attributed to the OH proton with the disappearance of the NH proton. On deuteration, the OH signal disappeared.
3.2.2 Spectral and magnetic studies
The magnetic moments and the significant electronic absorption bands of the complexes, recorded in DMF or Nujol mull, are given in Table 3 (DMF has no effect on the color).
Serial No.
μeff (BM)a
State
Intraligand and charge-transfer (cm−1)
d–d transition (cm−1)
Ligand field parameters B; β; Dq
Suggested geometry
1
–
DMSO
36495; 33780; 31445; 29940
–
–
2
0.71
DMF
35710; 32255; 27930; 23040
Square-based pyramid
Nujol
24390, 23580, 21920, 20745
19530; 19375; 17360
3
3.92
DMSO
33110; 27470
20325; 16775
335.3; 0.365; 1677
Octahedral
Nujol
25510, 24035, 22830
21095; 17855
457.9; 0.498; 1786
4
6.38
Nujol
25380, 24630, 23580, 21830
19157; 17120
Tetrahedral
5
4.53
DMF
35710; 33330; 28405; 25905
20660
Nujol
25510, 24750, 22830
20745;18725; 17605
889.6; 0.916; 979
Octahedral
6
4.27
DMF
35710; 33330; 27930; 25125
22620
483.5; 0.498; 689
Tetrahedral
Nujol
24270, 22725, 22025
20490; 19530; 17540
7
3.21
DMF
36495; 33330; 31445; 29760; 28405
21185
Octahedral
DMSO
36495; 33555; 31250;29760; 28245
21095
Nujol
23255, 21455, 20575
19840; 18515; 17240; 14880
454.0; 0.44;1044
8
3.47
DMF
35710; 32675; 29940;
23145; 21925
Tetrahedral
DMSO
35460; 32050; 28405
23920; 22935; 21645; 17920; 15475
Nujol
25250, 22935, 21645
20325,19155; 17120
9
1.77
DMF
35970; 33330; 27775; 25905
---------
Octahedral
Nujol
24630, 23145, 21459
19455;18655; 17120
10
2.09
DMF
35710; 33330; 27920; 23470
16285
Octahedral
DMSO
24035; 21735
20080; 18180
Nujol
25510, 23470, 21645
11
–
DMSO
37035; 35460; 25250;
31645; 29940
-
Tetrahedral
The spectrum of H4L shows the π → π∗ and n → π∗ bands at 36495, 38780, 31445 and 29940 cm−1 for the C⚌O and C⚌N groups. A change is observed on the spectra of its complexes. The bands at 25250–28405 and 23040–25905 cm−1 in the spectra of the complexes may be due to LMCT from N and O donors.
The two bands at 23040 and 19530 cm−1 in the spectrum of [VO(H2L)]·2H2O in DMF is assigned to the dxz → dxy transition (El-Metwally et al., 2005) in a square-pyramidal geometry. In Nujol, multiple bands are appeared at 17360, 19375, 20745, 21920, and 23580 cm−1 with additional broad band centered at 24390 cm−1 due to a charge-transfer. Its magnetic moment (0.71 BM) is anomalous for one unpaired electron which may be due to interaction with neighboring molecules.
The spectrum of [Cr2(H2L)(OAc)2(OH)2]·2H2O, in DMSO, shows bands at 16775 and 20325 cm−1 attributed to 4A2g (F) → 4T2g (P) (ν1) and 4A2g (F) → 4T1g (F) (ν2), in an octahedral geometry (Aranha et al., 2007) (Scheme 3). In Nujol, these bands are observed at 17855, 21095 and 22830 cm−1. In addition, a band at 24035 cm−1 is due to a charge-transfer. The ligand field parameters, in DMSO (Nujol) [Dq = 1676.7 (1785.8) cm−1, B = 335.3 (457.9) cm−1 and β = 0.365 (0.498)] further supported the proposed geometry. The lower value of β indicates more covalency. Its magnetic moment (3.92 BM) is normal for three unpaired electrons with no orbital contribution.![Structures of [Cr2(H2L)(OAc)2(OH)2]·2H2O, [Co2(H2L1)(H2O)4Cl2]·2H2O and [Ni((H2L)]·3H2O.](/content/184/2017/10/1_suppl/img/10.1016_j.arabjc.2012.12.032-fig5.png)
Structures of [Cr2(H2L)(OAc)2(OH)2]·2H2O, [Co2(H2L1)(H2O)4Cl2]·2H2O and [Ni((H2L)]·3H2O.
The electronic spectrum of [Co2(H2L)(H2O)4Cl2]·2H2O, in Nujol, shows bands at 18725 and 20745 cm−1 assigned to 4T1g → 4A2g (ν2) and 4T1g → 4T1g (P) (ν3) characteristic for an octahedral geometry (Chandra et al., 2006). In DMF solution, only band is observed at 20660 cm−1. The band due to 4T1g → 4T1g (ν1) is not observed and calculated to be 9785 cm−1. The B, β and 10Dq values (Table 3) agree with those reported for octahedral Co2+ complexes. The value of β indicates a strong covalent bond. The μeff value for each metal ion is 4.53 BM is slightly lower than the values reported for complexes having the proposed geometry (Scheme 3) may be due to interaction between the two metal atoms.
The spectra of [Co2(H2L)(OAc)2]·H2O in Nujol (DMF) show bands at 22025 (22620) cm−1 attributed to 4A2 → 4T1 (ν3) similar to those reported for tetrahedral complexes (Efthimiadou et al., 2007]. The B, β and 10Dq values (Table 3) agree with those reported for tetrahedral Co2+ complexes. Reduction in the B and β values indicates a covalent character of L–M bonds. The value of β indicates a strong covalent bond. The ν1 (4A2 → 4T2) is calculated to be 6889 cm−1. The complex shows additional bands at 17540 and 19530 cm−1 in a tetrahedral structure (El-Shazly et al., 2006) around the Co2+ ion.
The magnetic moment (3.21 BM) of [Ni((H4L)Cl2]·2H2O is expected for octahedral structure with 3A2g ground term (Singh and Singh, 2001). Its electronic spectrum shows broad bands in Nujol at 23255 (ν3) and 14880 cm−1 (ν2) assigned to 3A2g → 3T1g (F) (ν2) (Lal et al., 2009). The values of B (454 cm−1) and 10Dq (10442 cm−1) are used to calculate β and ν1, 3A2g → 3T2g (F), to be 0.44 and 10442 cm−1, respectively (Abd El-Wahab, 2007). The spectra in DMF and DMSO are similar showing only band at ≈21100 cm−1.
The magnetic moment (3.47 BM) of [Ni((H2L)]·3H2O lies within the range reported for a tetrahedral structure. Its electronic spectrum in Nujol shows bands at 20325, 19155 and 17120 cm−1 falling in the range reported for the proposed geometry (Scheme 3) (El-Shazly et al., 2005).
The electronic spectrum of [Cu(H3L)2(EtOH)2]·2H2O exhibits bands at 17120 19155, 22220 cm−1 in Nujol assigned to 2T2g → 2Eg and a symmetric forbidden ligand–metal charge-transfer. In DMF, no observed bands for the d–d transitions but the band appearing at 25905 cm−1 is mainly due to a charge-transfer. The band positions with magnetic moment of 1.77 BM are consistent with an octahedral geometry (Manoj et al., 2009). The spectrum of [Cu2(H2L)(OAc)2(H2O)6] in Nujol exhibits bands at 18180 and 20080 cm−1 assigned to 2T2g → 2Eg and a symmetric forbidden ligand–metal charge-transfer. In DMSO, these bands are observed at 16285 and 21735. The broadness of the first band may be due to Jahn–Teller effect which enhances the distortion in octahedral geometry (Al-Hazmi et al., 2005). The magnetic moment (2.09 BM) for each copper atom is consistent with one unpaired electron in an octahedral geometry.
The electronic spectrum of [Mn2(H2L)(OH)2]·H2O exhibits multiple weak bands at 17120, 21830 23580 and 24630 cm−1 assignable to the transitions in a tetrahedral structure. The magnetic moment (6.38 BM) is corresponding to five unpaired electrons with orbital contribution in a high spin geometry (PUI, 2007).
3.2.3 Thermal studies
The thermogravimetric data considering the decomposition temperature range, the removed species and the weight losses for most complexes are presented in Table 4. Example for one mononuclear complex and binuclear complex is described here in detail.
Complex
Temp. range, °C
Removed species
Weight loss % Found (Calcd)
[VO(H2L)]·2H2O
38–129
−2H2O
5.8(5.7)
130–341
−(C6H10 + 2OH)
24.7(24.5)
342–547
−(C14H8O2)
44.4(43.9)
549–718
−2N2
11.4(11.8)
719–800
VO (Residue)
13.7(13.9)
[Ni(H2L)]·3H2O
70–134
−3H2O
11.7(11.0)
253–344
−(C7H6NO + C2H4 + CH3)
32.8(33.1)
346–653
−(C7H6NO + CH3)
27.5(27.3)
654–793
−(2(C = N) + 0.5O2)
11.3(13.78)
794–800
NiO (Residue)
15.46(14.6)
[Co2(H2L)(OAc)2]·H2O
50–125
−H2O
2.8(2.8)
239–334
−C6H10+2OH
18.6(18.2)
334–475
−(C14H8 + 2N2 + 2AcO)
55.1(55.0)
476–800
2CoO (Residue)
23.5(23.3)
[Zn(H2L)]
168–360
−2C7H6N
46.8(46.4)
361–481
−C4H10
12.8(12.9)
482–555
−2C = N + 1.5O2
(22.3)(18.2)
556–800
ZnO (Residue)
[Mn2(H2L)(OH)2]·H2O
29–82
−H2O
2.9(3.4)
287–410
−(2C6H5O + C6H10 + 2N2 + C2)
64.9(64.2)
411–800
2MnO (Residue)
25.3(26.1)
[Cu2(H2L)(OAc)2(H2O)6]
203–399
−(2C7H6NO + C2H4 + CH3 + 6H2O)
53.0(53.3)
399–545
−(CH3 + C = N + AcO)
14.4(13.6)
546–773
−(C = N + AcO)
12.7(11.6)
773–800
2CuO (Residue)
19.9(21.5)
[Cr2(H2L)(OAc)2(OH)2]·2H2O
36–137
−2H2O
6.0(5.4)
225–327
−(C6H10 + 2OH)
17.4(17.3)
327–431
−(C14H10N4O + 2AcO + OH)
55.0(54.7)
431–800
Cr2O3 (Residue)
21.6(22.6)
The steady part of the thermogram of [Zn(H2L)] (Scheme 4) till 167 °C indicates the absence of any solvent outside the sphere. The 1st decomposition step starting at 168–360 °C is due to the removal of two phenolic rings {2C6H5O} (% Found 41.9; Calcd. 41.7). The 2nd step (361–481 °C) indicates the decomposition of {C6H10} (% Found 18.7; Calcd. 18.4). The last step (482–555 °C) shows the decomposition of {2N2 + CO + C} (% Found 21.8; Calcd. 21.5). ZnO is the stable residue at 800 °C (% Found 18.0; Calcd. 18.3).
In [Cr2(H2L)(OAc)2(OH)2]·2H2O, the TG curve is characterized by steps at 36–137, 138–327, 328–431 and 432–800 °C corresponding to the removal of outside water (% Found 6.0; Calcd. 5.4), C6H10 + 2OH (% Found 17.4; Calcd. 17.3) and C14H10N4O + 2OAc + OH (% Found 55.0 Calcd. 54.7) after which the residue is Cr2O3 (% Found 21.6; Calcd. 22.6).
3.2.4 ESR spectra
To obtain further information about the stereochemistry of VO2+ and Cu2+ complexes, ESR spectra were recorded and their spin Hamiltonian parameters were calculated.
The room temperature solid state ESR spectra of the copper complexes [Fig. 2(a and b)] exhibit an axially symmetric g-tensor parameters with g|| > g⊥ > 2.0023 indicating that the copper site has a
ground state (Kasumov et al., 2004). In axial symmetry, the g-values are related by the expression, G = (g−2)/(g⊥−2) = 4. According to Hathaway (Hathaway and Billing, 1970; Hathaway, 1984), as value of G is greater than 4, the exchange interaction between Cu2+ centers in the solid state is negligible, whereas when it is less than 4, a considerable exchange interaction is indicated in the solid complex. The calculated G values for the copper complexes are less than 4 suggesting copper–copper exchange interactions. The ESR spectrum of [Cu2(H2L)(OAc)2(H2O)6] is similar to the ESR spectra of the reported binuclear Cu2+ complexes (Khan et al., 1989). The ESR spectrum of [Cu(H3L)2(EtOH)2]·2H2O exhibits a single line centered at g// = 2.25 and g// = 2.07, respectively, (Fig. 1b) attributable to dipolar broadening and enhanced spin lattice relaxation. This line is probably due to insufficient spin-exchange narrowing toward the coalescence of four copper hyperfine lines to a single line. Note that, the same kind of powder ESR line shapes has been observed for many tetrahedral or square-planar binuclear Cu2+ complexes with a strong intranuclear spin-exchange interaction.![The ESR spectra of (a) [Cu2(H2L)(OAc)2(H2O)6]; (b) [Cu(H4L)(H2L)(EtOH)2]·2H2O and (c) [VO(H2L)]·2H2O.](/content/184/2017/10/1_suppl/img/10.1016_j.arabjc.2012.12.032-fig6.png)
The ESR spectra of (a) [Cu2(H2L)(OAc)2(H2O)6]; (b) [Cu(H4L)(H2L)(EtOH)2]·2H2O and (c) [VO(H2L)]·2H2O.
Molecular orbital coefficients, α2 and β2 were calculated (John et al., 2003):
The values of α2 and β2 for the complexes indicate that the in-plane σ-bonding and in-plane π-bonding are appreciably covalent, and are consistent with very strong in-plane σ-bonding in these complexes. For the Cu2+ complexes, the high values of β2 compared to α2 indicate that the in-plane π-bonding is less covalent than the in-plane σ-bonding. These data are well consistent with other reported values.
The ESR spectrum of [VO(H2L)]·2H2O (Fig. 1c) provides a characteristic octet ESR spectrum showing the hyperfine coupling to the 51V nuclear magnetic moment and similar to those reported for mononuclear vanadium molecule (Thaker et al., 1994). In the powdered form for the mono vanadium complex, the spectrum showed the parallel and the perpendicular features which indicate axially symmetric anisotropy with well resolved sixteen-lines hyperfine splitting characteristic for the interaction between the electron and the vanadium nuclear spin (I = 7/2) (Khasa et al., 2003). The spin Hamiltonian parameters are calculated to be g//(1.93), g⊥(1.96), A//(200 × 10−4 cm−1) and A⊥(60). The calculated ESR parameters indicate that the unpaired electron (d1) is present in the dxy-orbital with square-pyramidal or octahedral geometry (Raman et al., 2003). The values obtained agree well with the g-tensor parameters reported for square pyramidal geometry.
The molecular orbital coefficients α2 and β2 for complex (2) are calculated using the reported equations (Warad et al., 2000) and found to be 0.92 and 0.83, respectively. The low value of β2 than α2 indicates that the in-plane σ-bonding is less covalent and consistent with other reported data (Georgieva et al., 2006).
3.2.5 Antimicrobial activity
The ligand and its metal complexes were tested against Gram-positive, Bacillus thuringiensis (BT), H4L is more effective on BT than the complexes.
3.2.6 Eukaryotic DNA degradation test
Examining the DNA degradation assay of H4L and its metal complexes, one can conclude variability on their immediate damage on the calf thymus (CT) DNA. The complexes have higher effect on the calf thymus DNA than the ligand. [VO(H2L)]·2H2O, [Cr2(H2L)(OAc)2(OH)2]·2H2O, [Mn2(H2L)(OH)2]-·H2O, [Co2(H2L)(H2O)4Cl2]·2H2O, and [Co2(H2L)(OAc)2]·H2O have little effect while the [Ni(H4L)Cl2]·2H2O and [Zn(H2L)] complexes degrading the CT DNA completely (Fig. 3). [Cr2(H2L)(OAc)2(OH)2]·2H2O and the ligand have similar effect. The results suggest that direct contact of [Ni(H4L)Cl2]·2H2O and [Zn(H2L)] is necessary to degrade the DNA of Eukaryotic subject.![Biological effect of H4L and its complexes on the Calf Thymus DNA Lanes arranged as: C-control DNA, 1-Ligand, 2-[VO(H2L)]·2H2O, 3-[Cr2(H2L)(OAc)2(OH)2]·2H2O, 4-[Mn2(H2L)(OH)2]·H2O, 5-[Co2(H2L)(H2O)4Cl2]·2H2O, 6-[Co2(H2L)(OAc)2]·H2O, 7-[Ni(H4L)Cl2]·2H2O and 8-[Zn(H2L)].](/content/184/2017/10/1_suppl/img/10.1016_j.arabjc.2012.12.032-fig7.png)
Biological effect of H4L and its complexes on the Calf Thymus DNA Lanes arranged as: C-control DNA, 1-Ligand, 2-[VO(H2L)]·2H2O, 3-[Cr2(H2L)(OAc)2(OH)2]·2H2O, 4-[Mn2(H2L)(OH)2]·H2O, 5-[Co2(H2L)(H2O)4Cl2]·2H2O, 6-[Co2(H2L)(OAc)2]·H2O, 7-[Ni(H4L)Cl2]·2H2O and 8-[Zn(H2L)].
3.2.7 Molecular modeling of the complexes
The molecular modeling of the complexes is presented. The molecular parameters of the complexes are shown in Table 5. Inspection of the data, it is observed that:
-
All complexes have dipole moment values except [Mn2(H2L)(OH)2]·H2O and [Zn(H2L)] which have zero moment; this may be due to the trans-form of the complexes; the highest one is [Cr2(H2L)(OAc)2(OH)2]·2H2O which is considered as a strong polar molecule.
-
Comparing the data of the two Ni(II) complexes, one can observe that [Ni(H2L)]·3H2O has a lower moment than [Ni(H4L)Cl2]·2H2O suggesting that the oxygen and nitrogen atoms exist in opposite side (Scheme 8).
-
The shape of [Zn(H2L)] (Scheme 10) is found tetrahedral rather than a square-planar and this expected for the d10-system with sp3 hybridization.
-
All heats of formation are positive and arranged the complexes as: [Zn(H2L)] > [Ni(H2L)]·3H2O > [Ni(H4L)Cl2]·2H2O > [Mn2(H2L)-(OH)2]·H2O > [Cr2(H2L)(OAc)2(OH)2]·2H2O > [Co2(H2L)(OAc)2]·H2O.
| Parameters | Total energy (kcal/mol) | Binding energy (kcal/mol) | Heat of formation (kcal/mol) | Electronic energy (kcal/mol) | Nuclear energy (kcal/mol) | Dipole moment (Debyes) | HOMO (eV) | LUMO (eV) |
|---|---|---|---|---|---|---|---|---|
| 2 | −159729 | −5029 | 413 | −1376200 | 1216471 | 7.562 | −8.83343 | −2.76606 |
| 3 | −128285 | −4028 | 437 | −954834 | 826549 | 0 | −9.10911 | −2.32027 |
| 4 | −171110 | −5162 | 176 | −1340384 | 1169273 | 1.873 | −9.39293 | −2.12368 |
| 8 | −117365 | −4122 | 652 | −839924 | 722558 | 1.560 | −9.09869 | −2.19626 |
| 7 | −135331 | −3863 | 509 | −967888 | 832556 | 6.428 | −8.31821 | −2.75733 |
| 11 | −96501 | −3339 | 799 | 634367 | 537865 | 0 | −9.04210 | −2.54182 |
The bond lengths and angles of the compounds are listed in Supplementary Tables 1S–7S.
4 Conclusion
2,5-Hexanedione bis(salicyloylhydrazone) has been prepared and characterized. Its molecular geometry is predicted by molecular modeling using MM+ and PM3 methods and its bond lengths and angles are calculated. It showed multidentate behavior with four ionizable protons. Its ionization constants are 7.42 and 9.62 representing the amide and hydroxo protons. Its UV spectrum is changed from polar to nonpolar solvents. The IR spectra give evidence for coordination of the ligand through the NO donor atoms and the NMR spectra supported the coordination sites. The magnetic measurement and the electronic spectra suggested that the formed complexes having tetrahedral: [Co2(H2L)(OAc)2]·H2O, [Ni(H2L)]·3H2O and [Zn(H2L)]; square-pyramidal: [VO(H2L)]·2H2O and octahedral for the rest. The stable oxides VO, Cr2O3, CoO, NiO, ZnO and MnO remain as residues at the end step of TGA. The DNA degradation assay for the compounds suggests that direct contact of [Ni(H4L)Cl2]·2H2O and [Zn(H2L)] is necessary to degrade the DNA of Eukaryotic subject.
References
- Spectrochim. Acta. 2007;67A:25.
- Spectrochim. Acta. 2008;71A:421.
- Inorg. Chem. Commun.. 2002;15:1063.
- J. Coord. Chem.. 2005;58(8):713.
- Polyhedron. 2007;26:1373.
- Polyhedron. 2002;21:987.
- Spectrochim. Acta. 2006;65A:852.
- Polyhedron. 2007;26:1148.
- J. Spectrochim. Acta. 2010;75A:1516.
- Qatar Univ. Sci. J.. 1994;14:88.
- Spectrochim. Acta. 2009;71A:1885.
- Spectrochim. Acta. 2005;61A:1113.
- J. Coord. Chem.. 2006;59(8):846.
- Spectrochim. Acta. 2005;61A:243.
- Spectrochim. Acta. 2006;63:403.
- Struct. Bonding (Berlin). 1984;57:55.
- Coord. Chem. Rev.. 1970;5:143.
- Mans. Sci. Bull.. 1992;19:31.
- Phys. Chem.. 1973;254:314.
- Spectrochim. Acta. 2003;59A:1349.
- J. Coord. Chem.. 2004;57:591.
- J. Chem. Soc., Dalton Trans. 1989:1117.
- Phys. B. 2003;334:347.
- Bull. Soc. Chim. Belg.. 1982;91:265.
- Inorg. Chem. Commun.. 2009;12:686.
- J. Coord. Chem.. 2009;62:3864.
- Inorg. Chim. Acta. 2001;315:53.
- Spectrochim. Acta. 2009;72:474.
- Inorg. Chim. Acta 1974:9137.
- Top. Curr. Chem.. Vol 181. New York: Springer Verlag; 1976.
- Cancer Res.. 1973;4:367-372.
- J. Coord. Chem.. 2007;60:709.
- Transition Met. Chem.. 2003;28:29.
- Transition Met. Chem.. 2000;25:388.
- Inorg. Chim. Acta. 2007;360:2009.
- Transition Met. Chem.. 2001;26:487.
- Ind. J. Chem.. 1985;24A:836.
- Transition Met. Chem.. 1994;19:623.
- Proc. Soc. Exp. Biol. Med.. 1953;84:496.
- J. Nat. Cancer Inst.. 1973;51:139.
- A Text Book of Quantitative Inorganic Analysis. London: Longmans; 1994.
- Ind. J. Chem.. 2000;39:415.
Appendix A
Supplementary data
Supplementary data associated with this article can be found, in the online version, at http://dx.doi.org/10.1016/j.arabjc.2012.12.032.
Appendix A
Supplementary data
Supplementary Tables 1S–7S
Supplementary Tables 1S–7S


