

Translate this page into:
A series of nickel(II) complexes derived from hydrazide derivatives, electrochemical, thermal and spectral studies
⁎Corresponding author at: Chemistry Department, Faculty of Science, Mansoura University, Egypt. Tel.: +20 966553205965. n_elmetwaly00@yahoo.com (Nashwa El- Metwally)
-
Received: ,
Accepted: ,
This article was originally published by Elsevier and was migrated to Scientific Scholar after the change of Publisher.
Peer review under responsibility of King Saud University.

Abstract
A series of Ni(II)–hydrazide complexes were prepared using derivatives of hydrazide ligands. The variation of organic ligand elaborates the mode of coordination of the organic compound referring to the addition of coordinating sites besides the NH–NH–CO group. The octahedral configuration is the major form proposed with most isolated complexes. Mass spectra were used to assure the molecular formula proposed based on the elemental analysis data for most investigated compounds. Thermal analysis as well as kinetic data supports the formula of all investigated complexes especially the presence of coordinating water molecules with most of them. Electrochemical measurements assert the stability of Ni(II) oxidation state during the complexation which may be affected during the coordination reaction. pH metric studies as well as the molecular modeling optimization reflect a shadow on the stability of the isolated complexes in solution or in solid state, respectively.
Keywords
Ni(II) complexes
Hydrazides
Spectral analysis
Cyclic voltammetry
Thermal analysis

1 Introduction
Hydrazones form an interesting class of chelating ligands, which find extensive applications in various fields (Katyal and McBryde, 1978; Maria et al., 2004). Hydrazones are important classes of compounds which have long attracted attention, owing to their remarkable biological and pharmacological properties, such as antibacterial, antiviral, antineoplastic, and antimalarial activities (Pavan et al., 2010; Sriram et al., 2005). Recently, hydrazones have drawn much attention of coordination chemists, because of their strong tendency to chelate transition metals (Xiao et al., 2000; Bermejo et al., 2003). They have interesting ligational properties due to the presence of several coordination sites and can coordinate with transition metals either in the enol(I) or keto form (II) (Zidan, 2004; Narang et al., 2000). Their biological activity may be due to the ability of the ligands to form stable complexes with the metal ions which the fungus needs for its metabolism (Van Giessen et al., 1973; El-Asmy et al., 2010). Additional information related to the spectroscopic and electrochemical properties of these ligands and some of their transition metal complexes is now available (Costamagna et al., 1993a,b). The remarkable biological activity of acid hydrazides R-CO–NH–NH2, a class of Schiff base, their corresponding aroylhydrazones, R–CO–NH–N⚌CH–R and the dependence of their mode of chelation with transition metal ions present in the living systems have been of significant interest (Savanini et al., 2002; Ochiai, 1977; Anten et al., 1987; Dilworth, 1976). The coordination compounds of aroylhydrazones have been reported to act as enzyme inhibitors (Merchant and Clothia, 1970) and are useful due to their pharmacological applications (Biradar and Havinale, 1976; Fox,1952; Kakimoto and Yashamoto, 1956). Isonicotinic acid hydrazide [INH] is a drug of proven therapeutic importance and is used as bacterial ailments, e.g., in tuberculosis (Agrarwal and Sarin, 1993). Hydrazones derived from the condensation of isonicotinic acid hydrazide with pyridine aldehydes have been found to show better antitubercular activity than INH (Durgaprasad and Patel, 1973; Al-Hazmi et al., 2005). 7 (2-Hydrazide) derivatives are used in this study. These derivatives are obtained by varying the mode of coordination between bi and/or tridentate which affects the stability of the complexes prepared especially in solution. This is considered the main cause for the pH metric study also, may affect the electrochemical behavior of the central metal ion.
2 Experimental
All chemicals used were of analytical reagent (BDH or Merck) grades and were used as supplied.
2.1 Synthesis of the organic Ligands
2.1.1 Synthesis of (E)-2-cyano-N-ethylideneracetohydrazide
This compound was prepared as reported previously (Pal et al., 2002) by mixing 0.2 mol of ethyl cyanoacetate, dissolved in 20 ml of ethanol with 0.2 mol of hydrazine hydrate in 30 ml of absolute ethanol. The mixture was allowed to cool for 4 h. The white precipitate was filtered and washed with 5 ml of absolute ethanol and recrystallized from absolute ethanol.
2.1.2 Synthesis of hydrazide derivatives
The investigated hydrazides (Figure 1) were prepared by condensing 1:1 M ratio of acetylacetone, benzaldehyde, cinnamaldehyde, acetophenone, fufuraldehyde, crotonaldehyde or salicylaldehyde, in ethanol with an ethanolic solution of (E)-2-cyano-N-ethylideneracetohydrazide. The reaction mixtures were refluxed on a water bath for 2–5 h in the presence of few drops of glacial acetic acid. The formed precipitates were separated by filtration, washed with 5–10 ml of absolute ethanol and recrystallized from ethanol and dried. The proposed formula of the ligands is based on an agreement between the analytical and mass spectral (Table 1) data as well as confirmed by IR spectra. The 1HNMR spectra of HBCH, HMCH and H2SCH in d6-DMSO showed signals at δ = 9.68–8.70 (S, 1H) for NH proton; signals in the range of δ = 3.98–4.34 ppm for methylene and CH protons of HBCH, H2SCH and HMCH; and signals in the range of δ = 7.90–6.93 ppm (multiple signals) for aromatic protons. Moreover, the spectrum of H2SCH showed the OH proton signal at 11.10 ppm (West et al., 1995; Mostafa et al., 2000).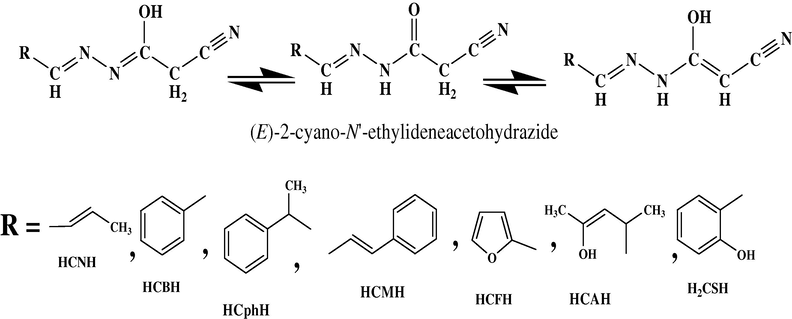
Chemical formulae of hydrazones.
Abbreviation
Full name
Color
m.p. °C
Found (Calcd)(%)
F. W
C
H
Founda
Calcd.
HCNH
(E)-N-((E)-but-2-enylidene)-2-cyanoacetohydrazide
Yellowish white
135
56.2 (55.6)
5.7 (6.0)
–
151.2
H2CAH
(E)-2-cyano-N-((Z)-4-hydroxy-2-methylpent-3-enylidene)acetohydrazide
White
170
53.6 (55.4)
6.8 (6.7)
179.0
195.2
HCPhH
(E)-2-cyano-N-(2-phenylpropylidene)acetohydrazide
White
120
65.4 (67.3)
5.2 (5.6)
213.0
214.2
HCMH
(E)-2-cyano-N-((E)-3-phenylallylidene)acetohydrazide
Yellow
168
68.0 (67.6)
4.8 (5.2)
213.0
213.2
HCBH
(E)-N-benzylidene-2-cyanoacetohydrazide
White
155
63.3 (64.1)
4.8 (4.8)
188.0
187.2
HCFH
(E)-2-cyano-N-(furan-2-ylmethylene)acetohydrazide
Light yellow
160
54.8 (54.2)
3.6 (3.9)
–
177.2
H2CSH
(E)-N-(2-hydroxybenzylidene)-2-cyanoacetohydrazide
Yellow
190
59.3 (59.1)
4.9 (4.5)
–
203.2
2.2 Synthesis of Ni(II) complexes
All complexes were prepared by adding stoichiometric quantities from each ligand (3 mmol) dissolved in ethanol and nickel acetate dissolved (3 mmol) in bidistilled water. The reaction mixtures were refluxed on a water bath for 4–6 h. The precipitate was filtered off, washed with hot ethanol and diethylether, and finally dried in vacuum desiccators over anhydrous CaCl2.
2.3 Procedure for the pH-metric titration
The titration was carried out at 25 ± 1 °C. The experimental procedure involves the pH-metric titration of the following solutions against the standardized carbonate free sodium hydroxide solution (8.834 × 10⁻³ mol l−1) and 10% (v/v) ethanol–water solution at constant ionic strength (0.1 mol l−1).
-
Solution a: 1.5 ml of HCl (0.012 mol l−1) + 2.5 ml of KCl (1 mol l−1) + 2.5 ml of ethanol.
-
Solution b: 1.5 ml of HCl (0.012 mol l−1) + 2.5 ml of KCl (1 mol l−1) + 2.0 ml of ethanol + 0.5 ml of ligand (0.01 mol l−1).
-
Solution c: solution b + 0.5 ml of (0.001 mol l−1) Ni(II) ion.
For each mixture, the volume was made up to 25 ml with bidistilled water before the titration. The values are calculated (Agrarwal and Sarin, 1993; Irving and Rossotti, 1954).
Applying these equations: where Y is the ionizable proton(s) of the ligand, V1 and V2 are the volumes of alkali required to reach the same pH in HCl and in the ligand curves, respectively, Vo is the initial volume of the mixture, TL is the ligand concentration in the initial volume, [A] and [B] are the concentrations of HCl and NaOH, respectively. The and pL values were evaluated by: where V3 is the volume of alkali required to reach the desired pH in the complex solution and TM is the initial concentration of the metal ion.
2.4 Chemical and physical measurements
Carbon, hydrogen and nitrogen contents were determined at the Microanalytical Unit of Cairo University. The nickel content was analyzed complexometrically according to the standard methods (Vogel, 1972). IR spectra were recorded on a Mattson 5000 FTIR Spectrophotometer (4000–400 cm−1) using KBr pellets. The UV–Vis, spectra were determined in the DMSO solvent with concentration (1.0 × 10⁻³ M) for the free ligands and their complexes using a Jenway 6405 Spectrophotometer with 1 cm quartz cell, in the range of 200–800 nm. Molar conductance were measured using a Jenway 4010 conductivity meter for the freshly prepared solutions at 1.0 × 10⁻³ moles in DMSO solvent. Magnetic measurements were carried out on a Sherwood Scientific magnetic balance using the Gouy method. The magnetic moment values were evaluated at room temperature (25 ± 1 °C) using a Johnson Matthey magnetic susceptibility balance. The effective magnetic moments were evaluated by applying: , where is the molar susceptibility corrected using Pascal’s constants for the diamagnetism of all atoms in the complexes and T is the absolute temperature.1H NMR spectrum of the organic compounds was recorded on a Varian Gemini 200 MHz spectrometer using DMSO-d6 as solvent. The electron-impact mass spectra of most free ligands and some of their complexes were checked at 70 eV using an AEI MS 30 Mass spectrometer. Thermogravimetric and its differential analysis (TGA/DTG) were carried out in dynamic nitrogen atmosphere (30 mL/min) with a heating rate of 10 °C/min using a Shimadzu TGA-50H thermal analyzer. The molar conductivities of freshly prepared 1.0 × 10⁻³ mol/cm3 DMSO solutions were measured for the soluble complexes using a Jenway 4010 conductivity meter. The protonation constants of the ligands and the formation constants of their complexes at 298 K were determined pH-metrically using a Hanna Instrument 8519 digital pH meter by the Irving–Rossotti method (Irving and Rossotti, 1954). The cyclic voltammetry measurements were carried out with a Potentiostat wave generator (Oxford Press) equipped with a Phillips PM 8043 X–Y recorder. The electrode assembly consists of platinum wires of 0.5 diameter as working and counter electrodes and Ag/AgCl as a reference electrode. Tetrabutylammonium tetraflouroborate (TBA+BF4−) was used as supporting electrolyte.
3 Results and discussion
Microanalytical data and the formula weights of the investigated compounds (Calculated and found) obtained from mass spectral estimations are presented in Table 2. The data coincide with each other for the stoichiometry proposed. The isolated complexes are colored solids, stable in air and insoluble in common organic solvents but completely soluble in coordinating solvents (DMSO and DMF). The molar conductivity values were measured for 0.001 M of complexes in DMSO. The values are found in 5.8–26.8 Ω−1 cm2 mol−1 range which indicates their non-electrolytic nature consequently to the strong covalent character of the acetate group. Found formula weight values obtained from mass spectra.
Complex
Color
m.p.
Λm in Ω−1 cm2 mol−1
Found (Calcd) (%)
F.W
C
H
N
Ni
Found
Calcd.
(1) [Ni(CNH)(OAc)(H2O)2]
Dark brown
265
8.8
35.8
(35.6)4.8
(4.9)13.8
(13.8)19.2
(19.3)267.7
303.9
(2) [Ni(CBH)(OAc)(H2O)2]
Dark green
>300
11.9
43.0
(42.4)4.4
(4.4)16.7
(16.5)17.3
(17.3)–
339.9
(3) [Ni(CPhH)(OAc)(H2O)3]
Dark green
270
19.0
43.0
(43.7)5.1
(5.2)11.1
(10.9)15.5
(15.2)–
385.0
(4) [Ni(CMH)(OAc)(H2O)]
Yellow
230
26.8
48.1
(48.3)4.4
(4.3)12.4
(12.1)16.6
(16.9)348.0
347.9
(5) [Ni(CFH)(OAc)]3H2O
Brown
245
5.8
34.1
(34.5)4.2
(4.3)12.0
(12.1)17.0
(16.9)347.0
347.9
(6) [Ni(HCAH)(OAc)(H2O)]H2O
Green
>300
23.0
38.6
(37.9)5.3
(5.5)12.2
(12.1)17.7
(16.9312.0
347.9
(7) [Ni(CSH)(H2O)]
Brown
260
17.4
43.3
(43.2)3.4
(3.3)12.5
(15.1)21.5
(21.1)259.8
277.9
3.1 IR spectral analysis
The most significant infrared bands (Table 3) of the ligands and their Ni(II) complexes provide a conclusive evidence for each coordination mode. The ligands coordinate through two different modes based on the orientation of the coordination sites to each others. A mononegative bidentate mode was observed with [Ni(CNH)(OAc)(H2O)2], [Ni(CBH)(OAc)(H2O)2], [Ni(CPhH)(OAc)(H2O)3], [Ni(CMH)(OAc)(H2O)] and [Ni(CFH)(OAc)]3H2O complexes. The HCNH, HCBH, HCPhH, HMH and HCFH ligands are coordinating through the C⚌N group and amide oxygen after its enolization process. The lower shift was mainly observed for υ(C⚌N) band by 20–32 cm−1. The disappearance of υ(C⚌O), υ(NH) and δ(NH) bands is observed in the free ligands at: ≈1680, ≈3248 and ≈1480 cm−1, respectively. This disappearance is followed with the appearance of new bands assigned to υ(C–O) and υ(Ni–O) at 1130–1150 and 495–504 cm−1, respectively. New bands observed in 1466–1495 cm−1 and 1323–1400 cm−1 ranges are assigned to υas and υs (COO−) referring to the coordinating acetate. The difference between the two bands is reflecting the acetate coordination mode, in the [Ni(CPhH)(OAc)(H2O)3] complex the difference is 177 cm−1 which is referring to its monodentate attachment. All the other complexes reveal a difference between the two υas and υs bands by 70–96 cm−1 range, which is supporting the bidentate attachment (Abu-Melha and El-Metwaly, 2007). A tridentate mode was observed with [Ni(CSH)(H2O)] and [Ni(HCAH)(OAc)(H2O)]H2O complexes. H2CSH ligand coordinates as a binegative tridentate mode through C⚌N, O⚌C–NH and OH groups after the enolization of amide and hydroxyl groups. H2CAH ligand coordinates as a mononegative tridentate mode through C⚌N, O⚌C–NH and OH after the enolization of amide carbonyl. This proposal is supporting with the lower shift of υ(C⚌N) band from ≈1613 to ≈1591 cm−1. The disappearance of υ(C⚌O) band (at ≈1680 cm−1) in the two ligands is followed by the appearance of two bands at ≈1127 and ≈482 cm−1 assigned to υ(C–O) and υ(Ni–O) bands. The lower shift appearance of υ(OH) band from 3480 to 3430 cm−1 as well as δ(OH) from 1360 to 1320 cm−1 is observed in the [Ni(HCAH)(OAc)(H2O)]H2O complex. The appearance of new bands in all complexes’ spectra at ≈430 cm−1 is assignable to υ(Ni–N) band. The appearance of two bands in the [Ni(HCAH)(OAC)(H2O)]H2O complex spectrum at 1466 and 1390 cm−1 is assigned to the bidentate mode of the acetate group toward the Ni(II). The appearance of bands at 835–858 and 542–580 cm−1 ranges is assigned to ρr(H2O) and ρw(H2O), respectively (Osman et al., 2002) in the investigated spectra. IR data reveal the tendency of all investigated ligands to interact with Ni(II) after the enolization of amide carbonyl which may be expected with the use of acetate salt which slightly raises the basicity of the coordination medium. More or less unshifted υCN band reveals its ruling out from the coordination. This is an expected behavior and may refer to its interaction by resonance with a neighboring amide group which directly is affecting the localization of an unshared pair of electrons sited on its N atom. s = strong, m = medium and w = weak.
Compound
νOH
νNH
νC⚌O
νC⚌N
νCN
νas(COO)−
νs(COO)−
νNi–O
νNi–N
1
[Ni(CNH)(OAc)(H2O)2]
–
–
(3280)–
(1682,m)1612,m
(1644,s)2260
(2259)1470
–1390
–496
450
2
[Ni(CBH)(OAc)(H2O)2]
–
–
(3210)–
(1685,m)1596,m
(1612,s)2250
(2252)1460
1390
480,w
435,w
3
[Ni(CPhH)(OAc)(H2O)3]
–
–
(3248)–
(1687,m)1592,m
(1616,m)2260
(2260)1500,m
1323,m
504,w
430,w
4
4)[Ni(CMH)(OAc)(H2O)]
–
– (3283)
– (1680,m)
1610,m
(1630,s)2261
(2261)1495,m
1400,m
497,w
455,w
5
[Ni(CFH)(OAc)]3H2O
–
–
(3221)–
(1682,m)1590
(1614)2259
(22591469,m
1373,m
495,w
440,w
6
[Ni(HCAH)(OAc)(H2O)]H2O
3430
(3480)–
(3280)–
(1689,m)1591,m
(1613,m)2260
(2261)1466,m
1390,m
500,w
440,w
7
[Ni(CSH)(H2O)]
–
(3433)–
(3270)–
(1680,m)1596,m
(1615,m)2260
(2260)–
–
482,w
430,w
3.2 Magnetic and spectral studies
The electronic absorption bands as well as the magnetic moment values are summarized in Table 4. All the structural formulae proposed for the complexes (Figure 2) are based on the data of electronic spectra as well as the magnetic moments which coincide with each other. The ligands have spectral bands in the range of 36,550–26,000 cm−1 corresponding to π → π∗ and n → π∗ transitions (Yadav et al., 2003) in DMF solvent. The reflectance spectra were obtained for the complexes in its solid state for assurance on the ruling out of the solvent effect on the complex structure. The electronic spectra of [Ni(CNH)(OAc)(H2O)2], [Ni(CBH)(OAc)(H2O)2], [Ni(CPhH)(OAc)(H2O)3] and [Ni(HCAH)(OAc)(H2O)]H2O complexes showed broad absorption bands in the range of 25,220–26,920 and 16,655–17,030 cm−1 that are assigned to 3A2g → 3T1g (p)(υ3) and 3A2g → 3T1g (υ2) transitions, respectively. This indicates the Ni(II) ion complexes in their six-coordination sphere (Bailar et al., 1975). The magnetic moment values of the complexes are in the range of 2.33 to 2.8 B.M. The values are slightly lower than the octahedral range (2.9–3.4 B.M.) which may be due to the absence of orbital–orbital contribution and the value for spin only moment (Aswar et al., 1998). The spectra of [Ni(CFH)(OAc)]3H2O and [Ni(CSH)(H2O)] complexes showed absorption bands at 16,775 and 17,230 cm−1 transitions, respectively arising from the 3T1(F) → 3A2(F) transitions characteristic of Ni(II) ion in a tetrahedral environment. This agrees with the electronic spectrum of [Ni(Cl)4]−2. The tetrahedral geometry is confirmed by the measured magnetic moments (μeff = 3.51 and 3.80 B.M.) which are in harmony with the reported (Figgs, 1984) value for the tetrahedral NiCl2(PPh3)2 complex especially with the presence of orbital–orbital contribution. While, the [Ni(CMH)(OAc)(H2O)] complex spectrum showed an absorption band at 20,100 cm−1 in good agreement with the square–planar geometry of 1A1g → 1A2g transition this proposal was supported by the diamagnetic appearance of the complex.
Complex
μeff (B.M.)
State
d-d transitions
B
β
10 Dq
1
[Ni(CNH)(OAc)(H2O)2]
2.33
DMF
Solid
26,920;17,030
27,800; 17,660457.66
505.40.44
0.481235.70
1263.62
2
[Ni(CBH)(OAc)(H2O)2]
2.73
DMF
Solid
25,220; 16,655
26,625; 17,075552.58
662.150.53
0.641105.2
1125.7
3
[Ni(CPhH)(OAc)(H2O)3]
2.82
DMF
Solid
26,120; 16,960
26,925; 16,710572.3
393.240.55
0.381144.6
1258.4
4
[Ni(CMH)(OAc)(H2O)]
0.00
DMF
Solid
20,100
20,675–
–
–
5
[Ni(CFH)(OAc)]3H2O
3.51
DMF
Solid
16,775
17,380–
–
–
6
[Ni(HCAH)(OAc)(H2O)]H2O
2.80
DMF
Solid
25,940; 16,570
26,830; 17,080488.42
487.820.47
0.471172.2
1219.6
7
[Ni(CSH)(H2O)]
3.80
DMF
Solid
17,230
17,245–
–
–
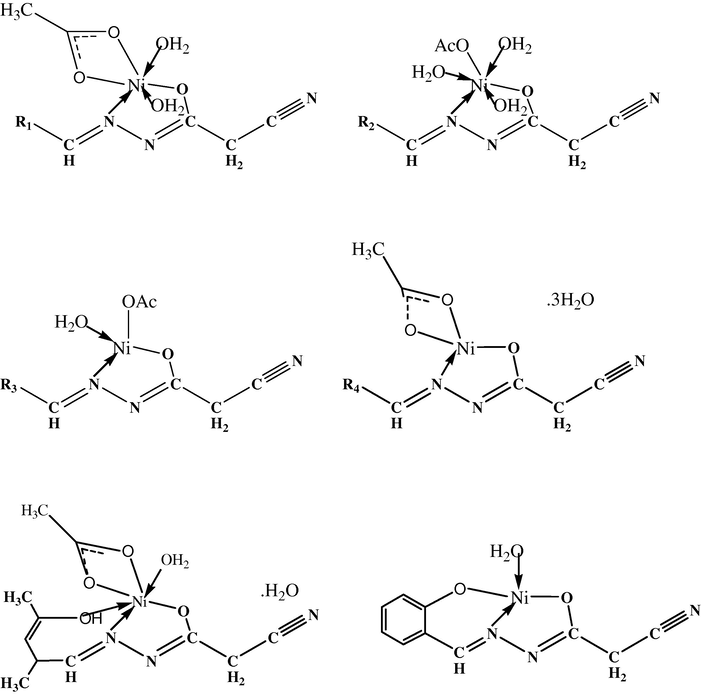
The proposed structures of all isolated complexes.
 .
.
3.3 Mass spectra
The mass spectra of most organic compounds and some investigated complexes have been recorded. The purity of H2CAH, HCPhH, HCMH and HCBH ligands and [Ni(CNH)(OAc)(H2O)2],[Ni(CMH)(OAc)(H2O)],[Ni(CFH)(OAc)]3H2O, [Ni(HCAH)(OAc)(H2O)]H2O and [Ni(CSH)(H2O)] complexes were evaluated based on the abstracted data. The spectra of most investigated compounds showed an essential peak attributed to the molecular ion peak confirming that of theoretically proposed. The spectrum of H2CAH shows a well defined parent peak at m/z = 179.0 (Calcd. 195.2) for (M++1) – H2O with a moderate intensity. The spectra of HCPhH, HCMH and HCBH organic compounds show a well defined parent peak at m/z = 213 (Calcd. 214.2) attributed to M+−1; at m/z = 213.0 (Calcd. 213.2) for molecular ion weight; at m/z = 188 (Calcd. 187.2) for M++1, respectively, with a moderate intensity. The mass spectra of [Ni(CNH)(OAc)(H2O)2], [Ni(HCAH)(OAc)(H2O)]H2O and[Ni(CSH)(H2O)] complexes did not display peaks that refer to the molecular ion peak. This may be due to the sudden fragmentation which happened during the evaporation process as an introductory step for scanning. I think a cleavage happened with the water molecules surrounding the Ni(II) ion. The first peak at m/z = 267.7 (Calcd. 303.9); at 312.0 (Calcd. 347.9) and at 259.8 (Calcd. 277.9) for M+ – water molecules, with 60.1, 65.3 and 59.3% intensities respectively which is considered higher than that known for a molecular ion peak, usually of a moderate intensity, may support our imagination. The lower intensity gives an idea for the stability of the fragment except the base peak. The molecular ion peak for [Ni(CMH)(OAc)(H2O)] and [Ni(CFH)(OAc)]3H2O complexes at m/z = 348 (Calcd. 347.9) and at 347 (Calcd. 347.8) for M+ and M+-1 respectively, with 23.1 and 28.57% intensities respectively is in a moderate appearance. A representative mass spectrum of the complex [Ni(CFH)(OAc)]3H2O is shown in Figure 3. The spectrum shows multi peaks corresponding to the successive degradation of the molecule. The molecular ion peak at m/z = 347 (Cacd. 347.8) represents M+−1 of the complex. Scheme 1 demonstrates peaks assignable to various fragments arising from the cleavage of the compound. The base peak at m/z = 91.0 (Calcd. 89.8) is assignable to NiCH3O.![Mass spectrum of [Ni(CFH)(OAc)]3H2O.](/content/184/2017/10/1_suppl/img/10.1016_j.arabjc.2013.01.002-fig3.png)
Mass spectrum of [Ni(CFH)(OAc)]3H2O.
![A proposed fragmentation pattern of [Ni(CFH)(OAc)]3H2O.](/content/184/2017/10/1_suppl/img/10.1016_j.arabjc.2013.01.002-fig4.png)
A proposed fragmentation pattern of [Ni(CFH)(OAc)]3H2O.
3.4 Thermogravimetric and kinetic studies
The thermogravimetric analysis tool is essential for investigating the probability of attachment of solvent molecules toward the central atom as a crystal or in a coordinate form. The TGA curves of the investigated complexes were obtained over the temperature range of 50–800 °C and exhibited several events. In most investigated complexes, the decomposition stages started at a relatively high temperature till ≈150 °C, which may reflect the high thermal stability of these complexes combined with the absence of hydrated solvent molecules. The first decomposition stage in TG curves is attributed to the expulsion of the coordinated water molecules and in good agreement with the found and the calculated percentage of the weight loss. But, the following stages appeared overlapped with each other and prohibit the exact determination of the initial and the final points of the step, which cause a difference between the found and the calculated percentage. However, the final residue is completely assigned to NiO or NiN sometimes polluted with carbon atoms. The thermal behavior of [Ni(CFH)(OAc)]3H2O and [Ni(HCAH)(OAc)(H2O)]H2O complexes is reflecting the lower thermal stability of them in comparison with others combined with the initial decomposition stage starting at ≈35 °C. The weight loss is corresponding to the removal of the hydrated molecules. The TG curve of the [Ni(HCAH)(OAc)(H2O)]H2O complex is taken as a representative example for the decomposition of these complexes. Four degradation stages are observed in the TG curve as shown in Figure 4. The mass loss concerning with the first step (30–80 °C) corresponds to the release of a hydrated water molecule of 5.20 (Calcd. 5.18) mass percentage with an activation energy of 154.6 kJ/mol (first order reaction). The second degradation stage (230–284 °C) is consistent with the elimination of the acetate moiety besides the coordinated water molecule of 22.31 (Calcd. 22.15) mass percentage with a concomitant activation energy of 275.4 kJ/mol. The third decomposition stage (471–597 °C) may be assigned to the removal of an organic part (CH3COHCH) of 16.10 (Calcd. 16.40) mass percentage. The final degradation stage (597–720 °C) is attributed to the removal of an organic residual part (C6H7N3O) attached with the Ni atom of 34.79 (Calcd. 34.80). The residual mass is in agreement with NiO species of 21.60 (Calcd. 21.47%).![TG and DTG thermograms of [Ni(CAH)(OAc)]H2O.](/content/184/2017/10/1_suppl/img/10.1016_j.arabjc.2013.01.002-fig5.png)
TG and DTG thermograms of [Ni(CAH)(OAc)]H2O.
Non-isothermal calculations were used extensively to evaluate the thermodynamic and kinetic parameters for different thermal decomposition steps in some complexes employing the Coats–Redfern (Coats and Redfern, 1964) and Horowitz–Metzger equations (Horowitz and Metzger, 1963). The results of activation enthalpy (ΔH# = E − RT); the activation entropy (ΔS# = 2.303 [log (Zh/KT)]R) and the free energy of activation (ΔG# = ΔH# − TΔS#) are given in Table 5, where Z, K and h are the pre-exponential factor, Boltzmann and Planck constants, respectively (Madhu et al., 1989). The kinetic parameters calculated by the Horowitz–Metzger method revealed no significant difference with those evaluated by the Coats–Redfern method. The activation energies could not be calculated for the overlapping or unsuitable steps. The high activation energy values (E) for some complexes indicate that the removed part is strongly bonded to the Ni(II) ion. Most complexes have negative ΔS# values suggesting that the activated complex is more ordered than the reactants and the reactions are slower than normal(Mahfouz et al., 2001). The positive value of ΔH# indicates that dissociation of the complexes is accompanied by absorption of heat and so the process is endothermic. The large positive value of ΔG# points to the fact that the dissociation process is not spontaneous (El-Asmy et al., 2008; Ma et al., 2012). E, ΔH# and ΔG# are in kJ mol−1 and ΔS# in JK mol−1.
Compound
Step
Coats–Redfern eqn.
Horowitz–Metzger eqn.
ΔS#
ΔH#
ΔG#
R
N
E
r
n
E
[Ni(CNH)(OAc)(H2O)2]
1st
0.9971
0.33
36.0
0.9959
0.33
43.6
−268.5
40.4
157.5
3rd
0.9995
2.00
91.6
0.9995
2.00
101.3
−206.3
86.0
224.2
[Ni(CBH)(OAc)(H2O)2]
3rd
0.9999
1.00
172.4
0.9990
1.00
179.0
-229.9
166.7
324.9
[Ni(CPhH)(OAc)(H2O)3]
1st
0.9941
1.00
39.0
0.9931
1.00
42.8
−274.0
34.9
169.4
2nd
1.0000
0.33
73.4
0.9998
0.33
87.7
−242.5
67.7
234.0
[Ni(CFH)(OAc)]3H2O
1st
0.9996
1.00
154.6
0.9891
1.00
162.6
−139.0
250.1
177.0
2nd
1.0000
2.00
275.4
0.9999
2.00
283.3
2.4
265.8
266.6
[Ni(HCAH)(OAc)(H2O)]H2O
1st
0.9983
0.33
77.1
0.9990
0.33
86.1
-234.7
72.6
199.8
3.5 Electrochemical measurements
Electrochemistry of [Ni(CFH)(OAc)]3H2O, [Ni(CBH)(OAc)(H2O2] [Ni(HCAH)(OAc)(H2O)]H2O [Ni(CNH)(OAc)(H2O)2] and [Ni(CMH)(OAc)(H2O)] complexes was studied using CV in DMSO (0.1 mol L−1 TBATFB). The complexes showed similar features in the investigated potential range of −1.2 to 1.4 V, and displayed two well-defined electrode couples. The results are summarized in Table 6. A representative voltammogram is shown in Figure 5. The complexes showed two successive one electron processes. The first reduction wave of the complexes is safely assigned to the irreversible couple Ni(II)/Ni(I) with E1/2 of (−0.49)–(−1.25) V (ΔEp = 0.27–0.85 V) and represented as follows: NiIIL + e− ↔ NiIL. The second couple with E1/2 of (−0.82)–(−1.1) V is assigned to the irreversible electrode couple NiII/NiIII by comparison with analogous Ni(II) complexes (El-Shahawi and Smith, 1994). The ratio ip,c/ip,a > 1 at the sweep rate 20–200 mV confirms the irreversible nature of the electrode couple (Paramanik and Bhatacharya, 1997). The irreversible nature of this couple is also confirmed by the linear dependence of the cathodic peak potential (Ep,c) with sweep rate (log υ) as shown in Figure 6A. The product of the number of electrons involved in the reduction process (n) and the corresponding charge transfer coefficient (α) can be determined from the slope. The dependence of the cathodic peak current (ip,c) of the electrode couple NiII/NiIII on the square route of the sweep rate (υ1/2) suggests a diffusion-controlled electrochemical process (Figure 6B). The peak–peak potential separation (ΔEp) of the electrode couple NiII/NiIII increased with increasing the scan rate confirming the occurrence of a slow chemical reaction and a limited mass transfer following the electrode process. Thus, the electron transfer process is irreversible and the species that initially formed in the electrode process may also react further to give products that are not reoxidized at the same potential as in the first formed species (Huges and Macero, 1974). The dependence of the voltammetric response of NiII/NiIII on the sweep rate, the depolarizer concentration of the analyte as well as the decrease in ip,c/υ1/2 is typical of an ECE (electrochemical reaction coupled between two charge processes) type mechanism in which an irreversible first-order chemical reaction is interposed between two successive one-electron charge transfers.
Complex
First electrode couple
Second electrode couple
Ep,a
Ep,c
ΔEp
E1/2
Ep,a
Ep,c
ΔEp
E1/2
[Ni(CNH)(OAc)(H2O)2]
−0.22
−0.90
0.68
−0.56
0.92
0.78
0.14
0.85
[Ni(CBH)(OAc)(H2O)2]
−0.60
−1.08
0.48
−0.84
1.12
0.83
0.29
0.97
[Ni(CMH)(OAc)(H2O)]
−0.72
−1.07
0.35
−0.89
1.19
0.99
0.20
1.09
[Ni(CFH)(OAc)]3H2O
−1.02
−1.37
0.35
−1.19
1.27
0.92
0.35
1.09
[Ni(HCAH)(OAc)(H2O)]H2O
−0.81
−1.19
0.38
−1.00
1.20
1.17
0.03
1.18
![Cyclic voltammogram of [Ni(CBH)(OAc)(H2O)2] in DMF - TBA + BF 4 - at 100 mV/s vs. Ag/AgCl electrode.](/content/184/2017/10/1_suppl/img/10.1016_j.arabjc.2013.01.002-fig6.png)
Cyclic voltammogram of [Ni(CBH)(OAc)(H2O)2] in
at 100 mV/s vs. Ag/AgCl electrode.
![The dependence of the cathodic peak potential Ep,c (A) and the peak currents ip,c or ip,a (B) of the electrode couple NiII/NiI of the complex [Ni(CBH)(OAc)(H2O)2].](/content/184/2017/10/1_suppl/img/10.1016_j.arabjc.2013.01.002-fig7.png)
The dependence of the cathodic peak potential Ep,c (A) and the peak currents ip,c or ip,a (B) of the electrode couple NiII/NiI of the complex [Ni(CBH)(OAc)(H2O)2].
3.6 pH-metric studies
3.6.1 Acid dissociation constants
The average acid dissociation constant of the ligands at different pH values,
, were calculated from the titration curves of acid in the absence and presence of ligands. Thus, the formation curves
vs. pH) give the proton-ligand formation constants (log K1 and/or log K2). Different computational methods (Zidan, 2004) were applied to evaluate the stepwise dissociation constants. The average values obtained are listed in Table 7. The data reveal that: HCNH > H2CAH > HCphH > HCMH > H2CBH > HCFH according to the pK1 values referring to the direct relation between the electron withdrawing character of the neighboring group and the ionization facility. The electron withdrawing character decreases the electron density on the azomethine moiety and enhances deprotonation. Thus, HCFH is less basic (lower log K) than HCNH.
Compound
H+
Ni(II)
pK1
pK2
β1
β2
β3
β⁎
HCNH
11.20 (11.00)
–
5.93 (6.85)
(6.29)
4.04 (3.89)
(17.03)
HCBH
8.93 (9.00)
–
8.00 (8.01)
7.41
5.47 (5.35)
20.88
HCPhH
9.92 (9.93)
–
8.97 (9.01)
7.82
4.89 (4.76)
21.68
HCMH
9.90 (9.80)
–
7.90 (7.42)
6.87 (6.07)
4.04
18.72
HCFH
8.89 (8.87)
–
10.15 (10.27)
7.01 (8.20)
4.93
22.09
H2CAH
11.09 (10.94)
7.15 (7.34)
7.03 (6.39)
6.18 (5.53)
–
–
H2CSH
7.75 (7.87)
5.20 (4.96)
8.52 (9.01)
6.26 (6.59)
5.83 (5.12)
20.61 (20.72)
3.6.2 Complex stability constants
The formation curves for the Ni(II) complexes were obtained by plotting the average number of ligands attached per metal ion (−n) vs. the free ligand exponent (pL), according to the Irving and Rossotti method (Irving and Rossotti, 1954). These curves were analyzed and the successive stability constants were determined using different computational methods. The stability constants log K1 and/or log K2 are given in Table 7. The following general remarks are: (i) the maximum values in all cases were found to be ≈2, revealing that ML of complexes are formed in solution; (ii) no precipitate was observed in the titration vessel, indicating that the possibility of metal hydroxide formation is excluded; (iii) the data revealed that, log K1 is higher than log K2 or log K3 for the same complex assuming that the vacant sites of the Ni(II) ion are more freely available for binding the first ligand than the second or the third and (iv) the overall stability constants for the Ni(II) complexes are in the order: HCFH–Ni(II) > HCphH–Ni(II) (II) > HCBH–Ni > HCMH–Ni(II) > HCNH–Ni(II).
3.7 Molecular modeling
An attempt to gain a better insight into the molecular structure of the ligands and their Ni(II) complexes geometry optimization and conformational analysis have been performed by the use of a MM+ force field implementing hyperchem 7.5 (HyperChem, 2002). The drawn modeling structures of the complexes displaying the stable stereo structure include the lowest energy level. The total energy calculated for all complexes is as follows: =44.974 for Ni–CNH, =40.9722 for Ni–CBH, =34.721 for Ni–CPhH, = 47.153 for Ni–CMH, =41.6326 for Ni–CFH, =54.6016 for Ni–HCAH and =45.4202 kcal/mol for Ni–CSH complexes (Figure 7). The total energy content calculated for the investigated complexes support the previous discussion concerning with the pH metric study for the complexes’ stability constants. The total energy content calculated reveal that the Ni(II)–CPhH is the most stable complex isolated. However, the Ni(II)–HCAH complex is the less stable one. This may be due to the essential difference between the two tools as the molecular modeling program is implemented on the isolated solid complexes but the pH metric studies were carried out in solution.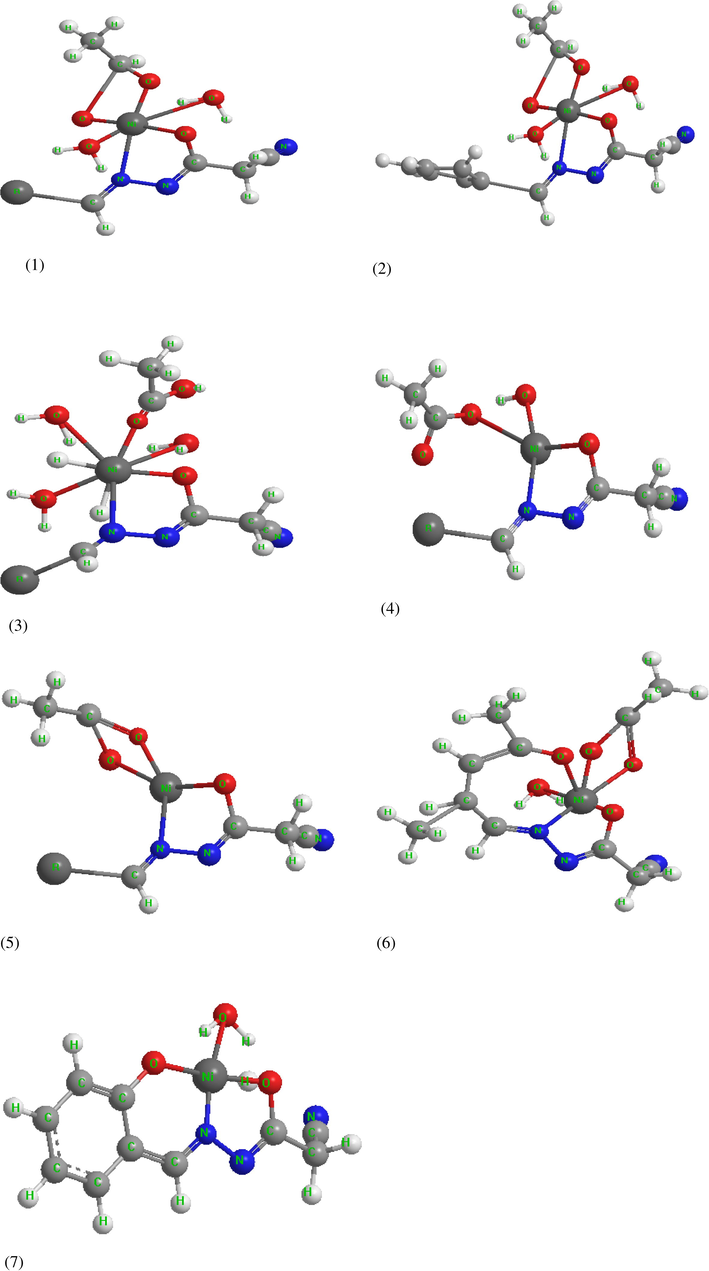
The modeling structures of the investigated complexes.
References
- Trans. Met. Chem.. 2007;32:828.
- Polyhedron. 1993;12:241.
- J. Coord. Chem.. 2005;58:713.
- Polyhedron. 1987;6:1074.
- J. Indian Chem. Soc.. 1998;75:395.
- Comprehensive Inorganic Chemistry. Vol vol. 3. Oxford: Pergamon Press; 1975. p. 1088
- New J. Chem.. 2003;27:1753.
- Inorg. Chim. Acta. 1976;17:157.
- Nature. 1964;201:68.
- Pure Appl. Chem.. 1993;65:1251.
- J. Indian Chem. Soc.. 1993;70:987.
- Coord. Chem. Rev.. 1976;21:29.
- Indian J. Chem.. 1973;11A:1300.
- Spectrochim. Acta A. 2008;71:39.
- Spectrochim. Acta A. 2010;75:1516.
- Analyst. 1994;119:327.
- Introduction to Ligand Field. New York: Wiley; 1966. p. 203
- Science. 1952;116:129.
- Anal. Chem.. 1963;35:1464.
- Inorg. Chem.. 1974;3:2739.
- HyperChem Professional 7.5, Hypercube, Inc., Gainesville, FL 32601, USA, 2002. Available from: <http://www.hyper.com>.
- J. Chem. Soc 1954:2904.
- Pharm. Bull.. 1956;4:4.
- Katyal, M., McBryde, W.A.E., 1978. Technical News Service, Part I & II, Sarabai M. Chemicals, Baroda.
- Inorganic Electronic Spectroscopy (second ed.). Amsterdam: Elsevier; 1984.
- J. Sun, Dyes Pigm.. 2012;93:1441.
- Thermochim. Acta. 1989;29:400.
- Synth. React. Inorg. Met. -Org. Chem. 2001;31:1873.
- J. Inorg. Biochem.. 2004;98:313.
- J. Med. Chem.. 1970;13:335.
- Transition Met. Chem.. 2000;25:470.
- Synth. React. Inorg. Met.-Org. Chem.. 2000;30:931.
- Bioinorganic Chemistry. Boston: Alln and Bacon; 1977.
- Synth. React. Inorg. Met.-Org. Chem.. 2002;32:663.
- Polyhedron. 1997;16:1761.
- Eur. J. Med. Chem.. 2010;45:1898.
- Bioorg. Med. Chem.. 2002;10:2193.
- Bioorg. Med. Chem. Lett.. 2005;15:4502.
- J. Nat. Cancer Inst.. 1973;51:139.
- A Text Book of Quantitative Inorganic Analysis. London: Longmans; 1972.
- Polyhedron. 1995;14:1681.
- Polyhedron. 2000;19:1295.
- Inorg. Chem. Acta. 2003;349:30.
- Synth. React. Inorg. Met.-Org. Chem.. 2004;34:743.


