

Translate this page into:
Molecular modeling studies of quinoline derivatives as VEGFR-2 tyrosine kinase inhibitors using pharmacophore based 3D QSAR and docking approach
⁎Corresponding author. Tel.: +91 8806621544; fax: +91 1881263655. hpatel_38@yahoo.com (Harun M. Patel)
-
Received: ,
Accepted: ,
This article was originally published by Elsevier and was migrated to Scientific Scholar after the change of Publisher.
Peer review under responsibility of King Saud University.

Abstract
Pharmacophore modeling studies were undertaken for a series of quinoline derivatives as VEGFR-2 tyrosine kinase inhibitors. A five-point pharmacophore with two hydrogen bond acceptors (A), one hydrogen bond donor (D), and two aromatic rings (R) as pharmacophore features was developed. The pharmacophore hypothesis yielded a statistically significant 3D-QSAR model, with a correlation coefficient of r2 = 0.8621 for training set compounds. The model generated showed excellent predictive power, with a correlation coefficient of q2 = 0.6943 and for a test set of compounds. Furthermore, the structure–activity relationships of quinoline derivatives as VEGFR-2 tyrosine kinase inhibitors were elucidated and the activity differences between them discussed. Docking studies were also carried out wherein active and inactive compounds were docked into the active site of the VEGFR-2 crystal structure to analyze drug-receptor interactions. Further we analyzed all the compounds for Lipinski’s rule of five to evaluate drug likeness and established in silico ADME parameters using QikProp. The results provide insights that will aid the optimization of these classes of VEGFR-2 inhibitors for better activity, and may prove helpful for further lead optimization and virtual screening.
Keywords
VEGFR-2 tyrosine kinase inhibitors
3D QSAR, docking
Lipinski’s rule of five

1 Introduction
Angiogenesis is an important component of certain normal physiological processes such as embryogenesis, wound healing, and the female reproductive cycle and also contributes to some pathological disorders and in particular to tumor growth (Fan et al., 1995; Folkman et al., 1995). Vascular endothelial growth factor (VEGF) and its receptor tyrosine kinases VEGFR-1 (Flt-1) and VEGFR-2 (KDR) are critical regulators of angiogenesis (Shawver et al., 1997). It is also important that the specific binding of VEGF to the vascular cell surface expressed VEGFR-2, triggers effective downstream cell proliferation signaling pathways and leads to tumor vascularization (Ferrara, 2002; Carmeliet and Jain, 2000). Moreover VEGF proteins as well as mRNA for the VEGF receptors Flk-1/KDR have been identified in primary tumors of the breast (Anan et al., 1996; Yoshiji et al., 1996), colon (Brown et al., 1993; Takahashi et al., 1995) and those of renal origin.
The blockage of VEGFR-2 signaling by small molecule inhibitors to the VEGFR-2 kinase domain has been shown to inhibit angiogenesis, tumor progression, and dissemination in a number of preclinical and clinical studies (Baka et al., 2006; Sepp-Lorenzino and Thomas, 2002; Klebl and Muller, 2005; Supuran and Scozzafava, 2004; Holmes et al., 2007), such as sorafenib (a dual Raf−KDR inhibitor) (Scanga and Kowdley, 2009; Escudier et al., 2009) and sunitinib (a multitarged kinase) (Motzer et al., 2006), have been approved for treatment of cancers. Up to now, there has been a lot of research focusing on the development of novel inhibitors of KDR as vandetanib (ZD6474), orally bioavailable in phase III, considered to be a dual tyrosine kinase inhibitor targeting EGFR and VEGFR-2 (Ryan and Wedge, 2005; Ciardiello et al., 2004; Morabito et al., 2009). Therefore, inhibition of the VEGFR-2 has become an attractive strategy in the treatment of cancers (Ferrara et al., 2004).
The development of VEGFR-2 inhibitors has therefore become an active area of research in pharmaceutical science. One could not, however, confirm that the compounds synthesized would always possess good inhibitory activity to VEGFR-2, while experimental assessments of inhibitory activity of these compounds are time-consuming and expensive. Consequently, it is of interest to develop a prediction method for biological activities before the synthesis. Quantitative structure activity relationship (QSAR) searches for information relating chemical structure to biological and other activities by developing a QSAR model. Using such an approach one could predict the activities of newly designed compounds before a decision is being made whether these compounds should be really synthesized and tested.
With the above facts and in continuation of our research for newer anti-cancer agents (Noolvi and Patel, 2010; Noolvi et al., 2011a,b,c, 2012a,b) in the present study, we reported molecular modeling studies of VEGFR-2 inhibitors using a three dimensional quantitative structure activity relationship (3D QSAR) and docking approach to provide further insight into the key structural features required to design potential drug candidates of this class. The excellent agreement between the QSAR and docking fields indicates that the binding mode hypothesis is mostly fairly close to the biological binding mode, therefore offering a relevant basis for proposing improvements for the further development of the series.
2 Materials and methods
The 3D-QSAR studies were carried out using PHASE (2007) (Dixon et al., 2006), version 3.0, Schrodinger, LLC, New York, USA, 2008 and all the steps are depicted in (Fig. 1). Pharmacophore modeling presents a qualitative picture of the geometry of the active site by identifying the chemical features for the binding of ligands and their spatial arrangements in 3D space (Axe et al., 2006; Prathipati and Saxena, 2005). In the present study, pharmacophore modeling was carried out using Pharmacophore Alignment and Scoring Engine PHASE. It performs systematic explorations of rotatable bonds and calculates the associated conformational energies, retaining only the most reasonable energy conformers. PHASE determines how molecular structure affects drug activity by dividing space into a fine cubic grid, encoding atom type occupation as numerical information, and performing a partial least-squares (PLS) regression, resulting in the prediction of a significant model (Dixon et al., 2006). This pharmacophore based alignment obtained from PHASE was utilized for QSAR model development. Further we analyzed all the compounds for Lipinski’s rule of five to evaluate drug likeness and established in silico ADME parameters using QikProp. All the docking studies were performed using a graphical user interface SP-docking mode of the program Maestro 8 (Halgren et al., 2004; Friesner et al., 2004; Sherman et al., 2006). The protein structure of a complex VEGFR-2 was obtained from the RCSB Protein Data Bank (PDB) as entry 2XV7 (http://www.rcsb.org/pdb/explore/explore.do?structureId=2XV7).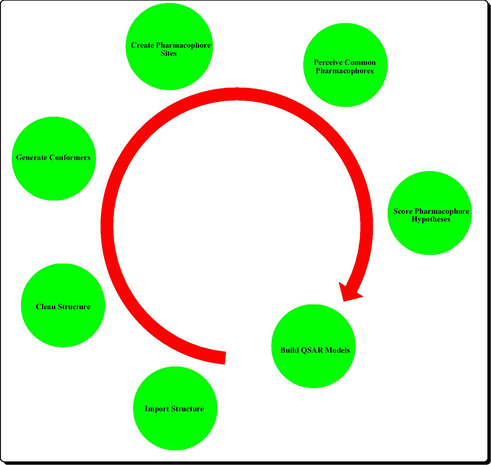
Steps in PHASE 3D QSAR.
2.1 Phase methodology
2.1.1 Data set
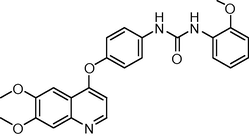
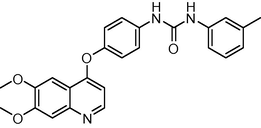
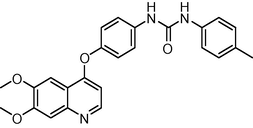
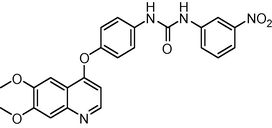
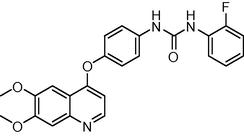
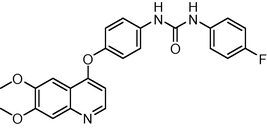
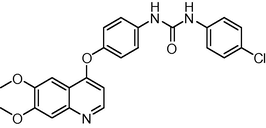
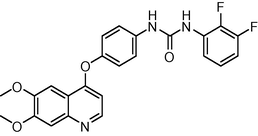
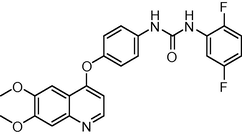
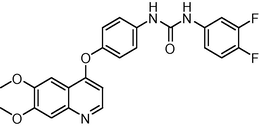
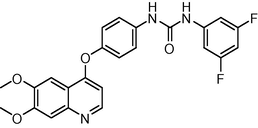
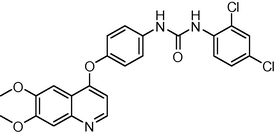
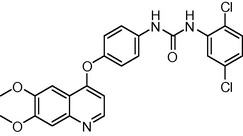
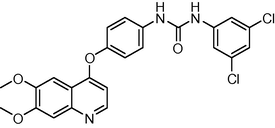
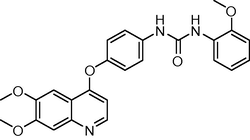
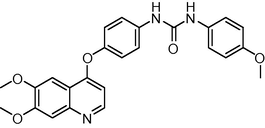
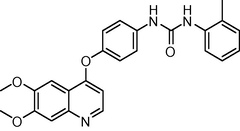
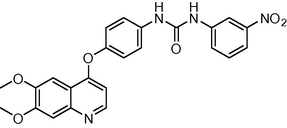
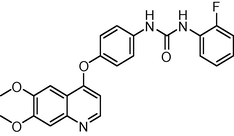
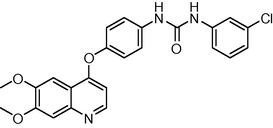
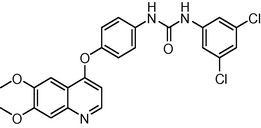
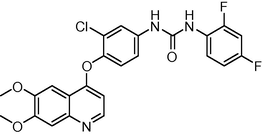
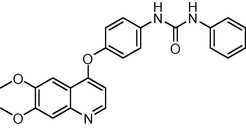
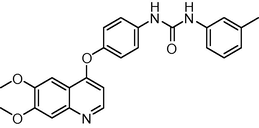
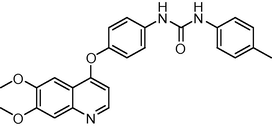
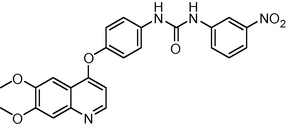
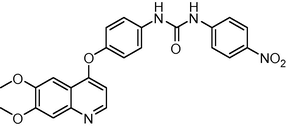
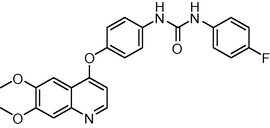
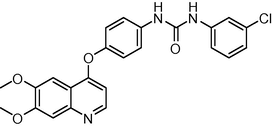
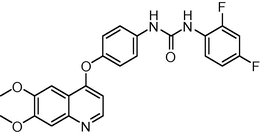
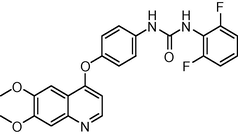
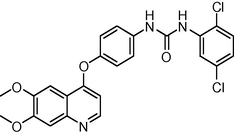
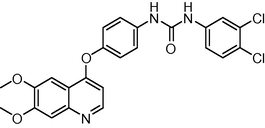
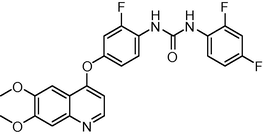
The novel 26 quinoline derivatives were taken from the literature (Kubo et al., 2005). The IC50 values were converted to pIC50 using the formula (pIC50 = −log IC50). Since some compounds exhibited insignificant/no inhibition, such compounds were excluded from the present study. The structures of all the compounds along with their actual and predicted biological activities are presented in Table 1. Expt. = experimental activity, Pred. = predicted activity. T = test set.
Sr. No.
Compounds
IC50 (nm)
pIC50
Residual
Exp.
Pred.
1

0.2
0.699
0.728
0.29
2
0.2
0.699
0.781
−0.082
3T

1.1
0.041
0.592
−.0551
4

2.3
0.362
0.501
−0.139
5
0.2
0.699
0.652
0.047
6T
0.5
0.301
0.285
0.016
7
1.1
0.049
0.701
−0.652
8T

5.6
0.748
0.850
−0.102
9
0.5
0.301
0.442
−0.141
10

1.2
0.079
0.091
−0.012
11T
0.4
0.398
0.401
−0.003
12

1.6
0.204
0.287
−0.083
13
0.2
0.699
0.582
0.117
14T
0.7
0.155
0.189
−0.034
15

0.7
0.155
0.178
−0.023
16
0.4
0.398
0.321
0.077
17

1.8
0.255
0.291
−0.036
18
1.1
0.041
0.048
0.007
19T
1.8
0.255
0.271
−0.016
20
5.6
0.748
0.789
−0.041
21
6
0.778
0.781
−0.003
22

3.7
0.568
0.584
−0.016
23
2.6
0.414
0.439
−0.025
24

0.9
0.045
0.055
−0.01
25

0.4
0.398
0.371
0.027
26

8.9
0.949
0.881
0.068
2.1.2 Ligand preparation
Three-dimensional (3D) conversion and minimization was performed using LigPrep (MMFFs force field) (Halgren, 1996) incorporated in PHASE. Conformers were generated using a rapid torsion angle search approach followed by minimization of each generated structure using the MMFFs force field, with an implicit GB/SA solvent model. A maximum of 1000 conformers were generated per structure using a pre-process minimization of 1000 steps and post process minimization of 500 steps. Each minimized conformer was filtered through a relative energy window of 50 kJ mol−1 and a minimum atom deviation of 1.00 Å (Phase 1.0; 2005; Narkhede and Degani, 2007; Tawari et al., 2008). This value (50 kJ mol−1) sets an energy threshold relative to the lowest-energy conformer. Conformers that are higher in energy than this threshold are discarded. All distances between pairs of corresponding heavy atoms must be below 1.00 Å for two conformers to be considered identical. This threshold is applied only after the energy difference threshold, and only if the two conformers are within 1 kcal mol−1 of each other.
2.1.3 Training and test set selection
The training set was selected randomly with random seed value of zero for selecting leave-n-out subsets, ensuring that the assignment is always random. The total set of inhibitors was divided randomly into a training set (19 compounds) for the generation of 3D-QSAR models and a test set (7 compounds) for validation of the developed model.
The training set molecules were selected in such a way that they contained information in terms of both their structural features and biological activity ranges. The most active molecules, moderately active, and less active molecules were included, to spread out the range of activities (Golbraikh et al., 2003). In order to assess the predictive power of the model, a set of 7 compounds was arbitrarily set aside as the test set. The test compounds were selected in such a way that they truly represent the training set.
2.1.4 Creating pharmacophore sites
Each compound structure is represented by a set of points in 3D space, which coincide with various chemical features that may facilitate noncovalent binding between the compound and its target receptor. PHASE provides a built-in set of six pharmacophore features, hydrogen bond acceptor (A), hydrogen bond donor (D), hydrophobic group (H), negatively ionizable (N), positively ionizable (P), and aromatic ring (R). The rules that are applied to map the positions of pharmacophore sites are known as feature definitions, and are represented internally by a set of SMARTS (Dixon et al., 2006) patterns. Each pharmacophore feature is defined by a set of chemical structure patterns. All user defined patterns are specified as SMARTS queries and assigned one of three possible geometries, which define physical characteristics of the site:
-
Point: the site is located on a single atom in the SMARTS query.
-
Vector: the site is located on a single atom in the SMARTS query, and will be assigned directionality according to one or more vectors originating from the atom.
-
Group: the site is located at the centroid of a group of atoms in the SMARTS query. For aromatic rings, the site is assigned directionality defined by a vector that is normal to the plane of the ring.
A default setting having a hydrogen bond acceptor (A), donor (D), hydrophobic (H), negative (N), positive (P), and aromatic ring (R) was used to create pharmacophore sites.
2.1.5 Scoring hypotheses
These common pharmacophore hypotheses were examined using a scoring function to yield the best alignment of the active ligands using an overall maximum root mean square deviation (RMSD) value of 1.2 Å with default options for distance tolerance. The quality of alignment was measured by a survival score, defined as: where W are weights and S are scores; Ssite represents alignment score, the RMSD in the site point position; Svec represents vector score, and averages the cosine of the angles formed by corresponding pairs of vector features in aligned structures; Svol represents volume score based on overlap of van der Waals models of non-hydrogen atoms in each pair of structures; and Ssel represents selectivity score, and accounts for what fraction of molecules are likely to match the hypothesis regardless of their activity toward the receptor. Wsite, Wvec, Wvol, and Wrew have default values of 1.0, while Wsel has a default value of 0.0. In hypothesis generation, default values have been used. Wm rew represents reward weights defined by m−1, where m is the number of actives that match the hypothesis.
Scoring of the pharmacophore with respect to activity of the ligand was conducted using default parameters for site, vector, and volume terms. These common pharmacophore hypotheses were examined using a scoring function to yield the best alignment of the active ligands using overall maximum root mean square categories according to a simple set of rules: hydrogens attached to polar atoms are classified as hydrogen bond donors (D); carbons, halogens, and C–H hydrogens are classified as hydrophobic/non-polar (H); atoms with an explicit negative ionic charge are classified as negative ionic (N); atoms with an explicit positive ionic charge are classified as positive ionic (P); non-ionic atoms are classified as electron-withdrawing (W); and all other types of atoms are classified as miscellaneous (X). For purposes of QSAR development, van der Waals models of the aligned training set molecules were placed in a regular grid of cubes, with each cube allotted zero or more ‘bits’ to account for the different types of atoms in the training set that occupy the cube. This representation gives rise to binary-valued occupation patterns that can be used as independent variables to create partial least-squares (PLS) QSAR models. Pharmacophore based QSAR models were generated for all hypotheses using the 19 member training set using a grid spacing of 1.0 Å. The best QSAR model was validated by predicting activities of the seven test set compounds.
2.1.6 Building 3D-QSAR models using partial least square (PLS) analysis
The QSAR models were developed from a series of molecules, of varying activity, that have all been aligned to a common pharmacophore hypothesis (CPH) that is associated with a single reference ligand. All hypotheses that successfully generated and scored were then used to build pharmacophore-based 3D-QSAR models with grid spacing 1.0 Å, random seed value of zero, and 1–5 PLS factors. Statistics on the correlation of predicted with actual activity were performed for the top ten scoring hypothesis, by the default hypotheses scoring functions.
Partial least-squares (PLS) regression analysis was applied to obtain the QSAR model. The independent variables in the regression were the binary-valued occupancies (bits) of the cubes by pharmacophore feature and the dependent variable was the inhibitory activity. The independent variables were filtered using a t value filter and a default value of 2.0 to eliminate independent variables whose regression coefficients are too sensitive to small changes in the training set composition. The maximum number of PLS factors were 5. PHASE QSAR models do not use internal cross-validation techniques, but rather use distinct training and test sets. PHASE supports only external validation, using a factual test set whose structures and activities are not considered when QSAR models are developed. Each of the developed 3D-QSAR models was validated by predicting activities of seven test set molecules (q2). The predictive ability of the models was measured by means of the Pearson-R value. To overcome the over-fitting problem, the run was performed using 1–5 PLS factors, in which the standard deviation of regression was approximately equal to the experimental error. The stability value was used to check the strength of the resulting 3D QSAR model and compare models from different hypothesis.
2.2 Docking studies
The molecular docking tool, GLIDE (Schordinger Inc., USA) (2008) was used for ligand docking studies into VEGFR-2 tyrosine kinase receptor binding pocket. The crystal structure of VEGFR-2 tyrosine kinase was obtained from the protein data bank (PDB ID: 2XV7). The protein preparation was carried out using the ‘protein preparation wizard’ in Maestro 8.0 in two steps, preparation and refinement. After ensuring chemical correctness, water molecules in the crystal structures were deleted and hydrogens were added, where they were missing. Using the OPLS 2005 force field energy of crystal structure was minimized (Zhong et al., 2009). Grids were defined centering them on the ligand in the crystal structure using the default box size. The ligands were built using maestro build panel and prepared by a Ligprep 2.2 module which produce the low energy conformer of ligands using OPLS 2005 force field. The low energy conformation of the ligands was selected and was docked into the grid generated from protein structures using a standard precision (SP) docking mode. The final evaluation is done with the glide score (docking score) and the single best pose is generated as the output for a particular ligand.
2.3 Lipinski’s rule for drug likeliness and in silico ADME prediction
We further analyzed physically significant descriptors and pharmaceutically relevant properties of all synthesized compounds, among which were molecular weight, log p, H-bond donors, and H-bond acceptors according to the Lipinski’s rule of five. Lipinski’s rule of five is a rule of thumb to evaluate drug likeness, or determine if a chemical compound with a certain pharmacological or biological activity has properties that would make it a likely orally active drug in humans. The rule describes molecular properties important for drug pharmacokinetics in the human body, including its ADME. These compounds were further evaluated for their drug-like behavior through the analysis of pharmacokinetic parameters required for absorption, distribution, metabolism and excretion (ADME) by use of QikProp version 9.0 (2010), Lipinski et al. (2001).
3 Results and discussion
The training set was used to identify the common pharmacophore hypothesis (CPH) by following tree-based partition algorithms. For finding the common pharmacophore hypotheses, the dataset was divided into active and inactive sets depending upon the observed activity; active ligands are those with IC50 below 1.8 nm and inactive above 1.8 nm. Based on sites, maximum of five features were allowed to develop hypotheses and a number of CPHs were reported common in all 26 molecules. There were 147 hypotheses; five hypotheses were selected for molecular alignment based upon the survival score. PLS analyses were conducted using five factors with a grid spacing 1 Å and five regression models were derived. The best fitted Model-I AADRR.55 (r2 = 0.8621, q2 = 0.6943, F = 34.66) along with the regression summary are given in Table 2. The selected pharmacophore hypothesis is displayed in Fig. 2. Red ball shows hydrogen bond acceptor site, blue ball indicates hydrogen bond donor while the brown ring demonstrates the R (ring) feature pharmacophore (Fig. 2). r2 = Coefficient of determination; q2 = cross validated r2, F = F test score; Pearson R = correlation between experimental and predicted activity for the test set.
Model
Hypothesis ID
Factor
SD
r2
F
Stability
RMSE
q2
Pearson R
Model-1
AADRR.55
5
0.4412
0.8621
34.66
0.8246
0.4287
0.6943
0.8462
Model-2
ADHRR.60
5
0.4804
0.8234
28.67
0.7842
0.5278
0.6328
0.7886
Model-3
AHRRR.27
5
0.5572
0.7668
26.45
0.7256
0.5852
0.5924
0.7246
Model-4
AHRRR.74
5
0.5534
0.7051
22.22
0.6874
0.6128
0.5424
0.6624
Model-5
ADHRR.63
5
0.5823
0.6834
18.56
0.5173
0.6238
0.4982
0.6182
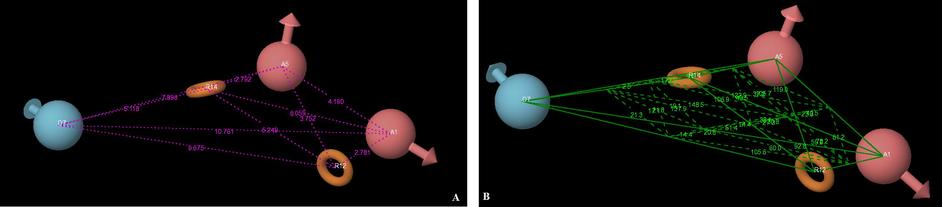
Pharmacophore hypothesis (AADRR.55), where the red ball shows hydrogen bond acceptor site, blue ball indicates hydrogen bond donor while the brown ring demonstrates the R (ring) feature; pharmacophore distances (A) and angles (B) between pharmacophoric sites.
The pharmacophore hypothesis labeled as Models 1–5, together with their statistical scores, is listed in Table 2. Reliable predictions can only come from statistically valid QSAR models. There are several statistical parameters, such as r2, q2, SD, RMSE, and F, that can be used to evaluate the robustness of a QSAR model. According to Tropsha (Tropsha, 2005), high r2 is a necessary but not sufficient condition for a predictive QSAR model. Besides the consideration of high r2, the best QSAR model should be chosen based on its predictive ability q2. The r2 and q2 values of Model 1 are much higher than those of Models 2, 3, 4 and 5 suggesting that Model 1 is the best model. Additionally, Model 1 has the lowest RMSE value and highest Pearson-R value of all the models. Further, five different combinations of training and test sets were generated and analyzed by PHASE PLS analysis. Good and consistent predictivity was observed for Model 1 for each combination compared to the other models. Considering the flexibility of all the molecules, the predictive qualities of the QSAR models are satisfactory. Overall, based on r2, q2, SD and RMSE, as well as on the highest value on the Pearson-R, the best model was Model 1. This pharmacophore model includes two hydrogen bond acceptors, two ring residues and one hydrogen bond donor. The pharmacophore model hypothesis of distances and angles as well as the alignment of active compounds is shown in Figs. 2 and 3 respectively. The distances and angles between the five features are shown in Table 3.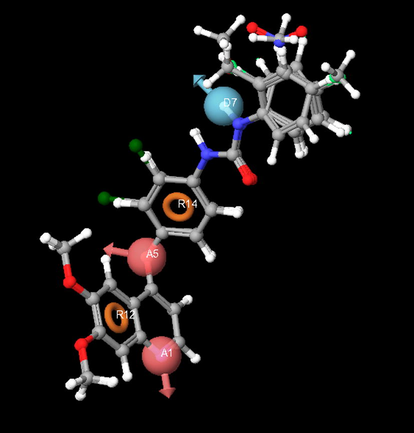
The common pharmacophore based alignment of molecules in 3D QSAR.
Hypothesis
Site 1
Site 2
Distance (Å)
Hypothesis
Site 1
Site 2
Site 3
Angles (Degree)
Hypothesis
Site 1
Site 2
Site 3
Angles (Degree)
Hypothesis
Site 1
Site 2
Site 3
Angles (Degree)
AADRR.55
A1
A5
4.19
AADRR.55
A5
A1
D7
38.1
AADRR.55
D7
A5
R14
4.6
AADRR.55
A1
R12
R14
92.8
AADRR.55
A1
D7
10.761
AADRR.55
A5
A1
R12
61.2
AADRR.55
R12
A5
R14
105.7
AADRR.55
A5
R12
D7
51.4
AADRR.55
A1
R12
2.781
AADRR.55
A5
A1
R14
23.8
AADRR.55
A1
D7
A5
19.1
AADRR.55
A5
R12
R14
30.8
AADRR.55
A1
R14
6.059
AADRR.55
D7
A1
R12
60.0
AADRR.55
A1
D7
R12
14.4
AADRR.55
D7
R12
R14
20.8
AADRR.55
A5
D7
7.896
AADRR.55
D7
A1
R14
14.4
AADRR.55
A1
D7
R14
17.1
AADRR.55
A1
R14
A5
37.2
AADRR.55
A5
R12
3.752
AADRR.55
R12
A1
R14
59.9
AADRR.55
A5
D7
R12
21.8
AADRR.55
A1
R14
D7
148.5
AADRR.55
A5
R14
2.792
AADRR.55
A1
A5
D7
122.9
AADRR.55
A5
D7
R14
2.5
AADRR.55
A1
R14
R12
27.3
AADRR.55
D7
R12
9.675
AADRR.55
A1
A5
R12
40.5
AADRR.55
R12
D7
R14
21.3
AADRR.55
A5
R14
D7
172.9
AADRR.55
D7
R14
5.118
AADRR.55
A1
A5
R14
119.0
AADRR.55
A1
R12
A5
78.2
AADRR.55
A5
R14
R12
43.5
AADRR.55
R12
R14
5.249
AADRR.55
D7
A5
R12
106.9
AADRR.55
A1
R12
D7
105.6
AADRR.55
D7
R14
R12
137.9
For Model-1, the training set correlation is characterized by PLS factors (r2 = 0.8621, SD = 0.4412, F = 34.66, P = 0.8462). The test set correlation is characterized by PLS factors (q2 = 0.6943, RMSE = 0.4287, Pearson-R = 0.8462). The contribution maps obtained from model-I AADRR.55 show how 3D-QSAR methods can identify features important for the interaction between ligands and their target protein. Such maps allow the identification of those positions that require a particular physicochemical property to enhance the bioactivity of a ligand. A pictorial representation of the contours generated on the most active ligand (compound 5) and the less active ligand (compound 26) is shown in Fig. 4a and b. In these representations, blue cubes indicate positive coefficients which are favorable while red cubes indicate negative coefficients which are unfavorable regions for activity. Graphs of observed versus predicted biological activity of training and test sets are shown in Fig. 5.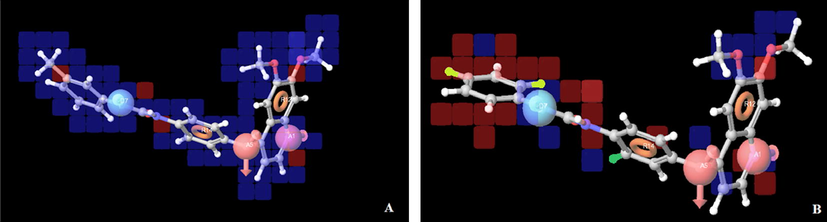
Pictorial representation of the cubes generated using the QSAR model. Blue cubes indicate favorable regions, while red cubes indicate unfavorable regions for the activity. Atom-based 3D QSAR model visualized in the context of the most active (a-compound 5) and least active (b-compound 23) in the training set.
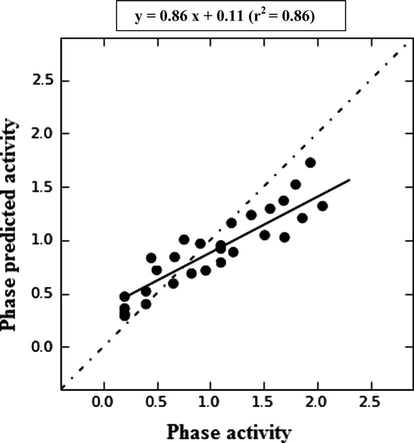
Scatter plots for the QSAR model applied to all compounds in the training and test set.
The comparison of the most significant favorable and unfavorable interactions, which arise when the 3D-QSAR model was applied to the most active reference ligand (compound 5) and the least active ligand (compound 26), which are shown in Fig. 4a and b, respectively. The blue cubes around the hydrogen bond donor suggest that these features are important for the activity, while some unfavorable regions indicated by the reference ligand, can be justified by examining the less active molecule (compound 26). The blue cubes were observed at the position-4 of quinoline ring near the hydrogen bond acceptor (A5) vector which indicated that for better activity the electron rich element like oxygen should be present at the 4th position. Nitrogen atom of the quinoline ring serves as hydrogen bond acceptor (A1) in drug receptor interaction as it is proved by the docking study where it is showing hydrogen bonding interaction with the CYS-919 amino acid residue. Ring residue (R12) in this model occupies much of the favorable blue cubes due to the presence of the hydrophobic quinoline ring. Similarly ring residue (R14) in diphenylurea at the 4th position of the quinoline ring suggests that the bulky substituent is essential at the 4th position of the quinoline ring for producing VEGFR-2 kinase inhibition, it is also inferred from the docking results that the bulky moiety is located in a deep hydrophobic pocket formed by VAL-845, LYS-868, VAL-899, ILE-1044, PHE-1047, LEU-889 and ILE-888.
Furthermore, Fig. 4a and b compares the most significant favorable and unfavorable features at position-4 which indicated that electron donating groups such as CH3, OCH3 on diphenylurea favors the activity as compared to the electron withdrawing groups. It is also observed that kinase inhibitory activity is inversely proportional with the electron withdrawing group present over diphenylurea; as the aromatic ring is getting substituted with more number of electron withdrawing groups the activity decreases as is evident from compounds 20, 21, 22 and 26.
It is also concluded by observing the blue cubes at the 6th and 7th positions of the quinoline ring that an electron donating substituent such as methoxy is favorable for VEGFR-2 inhibition activity.
Docking study was carried out for the target compounds into VEGFR-2 tyrosine kinase using GLIDE (Schordinger Inc., USA) (2006). The crystal structure of the enzyme with a co-crystallized ligand (2XV7) was obtained from the protein data bank PDB. Our compounds were modeled by positioning them in the co-crystallized ligand’s binding site. The entire complex was then subjected to alternate cycles of minimization and dynamics. We redocked the co-crystallized ligand into the active site of the enzyme and then replaced it with our compounds in order to compare the binding mode of both the co-crystallized ligand and quinoline derivatives.
These docking studies have revealed that the quinoline ring binds to a narrow hydrophobic pocket in the N-terminal domain of VEGFR-2 tyrosine kinase where N- of the quinoline ring interacts with H-atom of the amino acid backbone of CYS-919 via a hydrogen bond (Fig. 6). These interactions underscore the importance of both nitrogen atoms for binding and the subsequent inhibitory capacity. The importance of nitrogen in drug receptor interaction is also inferred from a common pharmacophore hypothesis developed from 3D QSAR where nitrogen is acting as the hydrogen bond acceptor (A1) as shown in Fig. 2.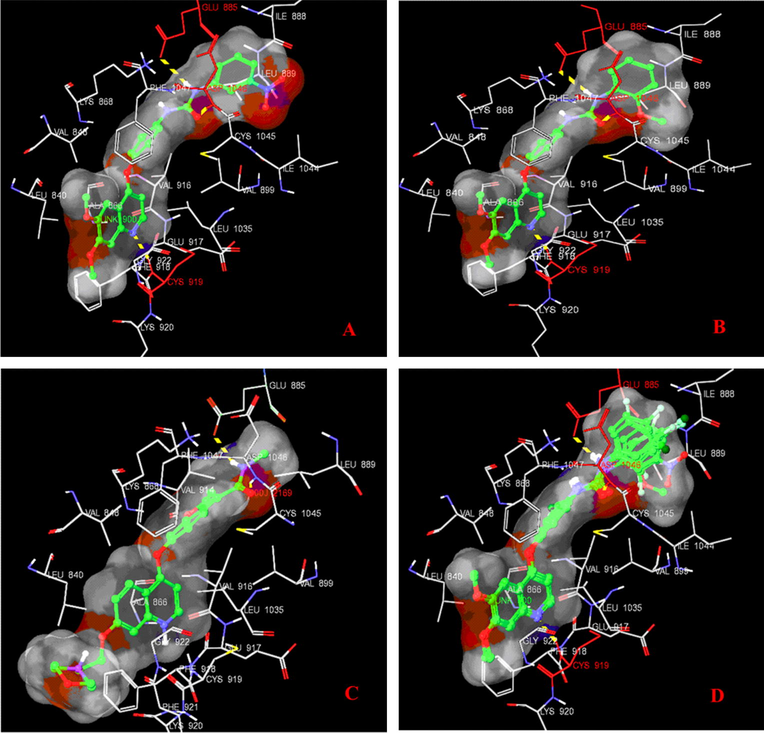
Binding interaction of ligands with VEGFR-2 tyrosine kinase (PDB: 2XV7) domain; (A) Binding pose of the highest scoring compound 7, (B) Binding mode of the most active compound 2, (C) Binding mode of co-crystallized ligand, and (D) Binding mode of the all ligands in VEGFR-2 tyrosine kinase. Dotted yellow bond showing H-bond interaction with site residue.
Quinoline ring is surrounded by hydrophobic residues such as LYS-920, GLY-922, PHE-918, GLU-917, LEU-1035, LEU-840, and VAL-916 indicating its role in hydrophobic interaction; ring residue (R12) in 3D QSAR model also suggests the same thing.
The diphenylurea moiety at the C-4 position of quinoline is observed to be inserted deeply in the cavity, interacting with VAL-845, LYS-868, VAL-899, ILE-1044, PHE-1047, LEU-889, ILE-888 and GLU-885 through hydrophobic and H-bond contacts, respectively. This deep cavity is very well conserved in all tyrosine kinase isoforms, and coincides with the ATP-binding site region; hydrophobic interaction of diphenylurea moiety is also confirmed by the ring residue (R14) in 3D-QSAR studies. The co-crystallized ligand forms hydrogen bonding with GLU-885 via –NH– of carboxamide group (–CONH–) and a similar hydrogen bonding interaction is also shown by –NH– of urea (–NHCONH–) with GLU-885 of all quinoline derivatives.
As a measure of docking reliability, the docking results were evaluated in terms of glide dock score values by comparison of the docked poses of the co-crystallized ligand as shown in Table 4. The minimum glide score of −12.479295 and −12.105129 kcal/mol of compound 2 and 7 having methoxy and nitro derivatives proves that both electron donating and withdrawing groups favors the VEGFR-2 inhibition activity; but as the number of electron withdrawing groups increases the diphenylurea moiety activity decreases as is obvious from docking scores of compounds 24, 25 and 26.
Sr. No.
Compounds
Docking Score
Glide Energy (kcal/mol)
Hydrophobic Interaction (within 5 A°)
H-bond interaction
1

−11.5506
−66.8608
LEU-840, VAL-845, LYS-868, PHE-1047, ILE-888, CYS-1045, ILE-1044, VAL-899, VAL-916, LEU-1035, GLU-917, LYS-920
N- of quinoline and H atom of amino acid backbone of CYS-919
NH of urea and amino acid backbone of GLU-885
2
−12.105129
−71.5388
LEU-840, VAL-845, LYS-868, PHE-1047, ILE-888, CYS-1045, ILE-1044, VAL-899, VAL-916, LEU-1035, GLU-917, LYS-920
N- of quinoline and H atom of amino acid backbone of CYS-919
NH of urea and amino acid backbone of GLU-885
3
−11.237536
−60.2845
LEU-840, VAL-845, LYS-868, PHE-1047, ILE-888, CYS-1045, ILE-1044, VAL-899, VAL-916, LEU-1035, GLU-917, LYS-920
N- of quinoline and H atom of amino acid backbone of CYS-919
NH of urea and amino acid backbone of GLU-885
4
−11.181321
−67.9674
LEU-840, VAL-845, LYS-868, PHE-1047, ILE-888, CYS-1045, ILE-1044, VAL-899, VAL-916, LEU-1035, GLU-917, LYS - 920
N- of quinoline and H atom of amino acid backbone of CYS-919
NH of urea and amino acid backbone of GLU-885
5

−11.770905
−68.5487
LEU-840, VAL-845, LYS-868, PHE-1047, ILE-888, CYS-1045, ILE-1044, VAL-899, VAL-916, LEU-1035, GLU-917, LYS - 920
N- of quinoline and H atom of amino acid backbone of CYS-919
NH of urea and amino acid backbone of GLU-885
6

−11.63571
−67.8791
LEU-840, VAL-845, LYS-868, PHE-1047, ILE-888, CYS-1045, ILE-1044, VAL-899, VAL-916, LEU-1035, GLU-917, LYS-920
N- of quinoline and H atom of amino acid backbone of CYS-919
NH of urea and amino acid backbone of GLU-885
7
−12.479295
−73.1296
LEU-840, VAL-845, LYS-868, PHE-1047, ILE-888, CYS-1045, ILE-1044, VAL-899, VAL-916, LEU-1035, GLU-917, LYS-920
N- of quinoline and H atom of amino acid backbone of CYS-919
NH of urea and amino acid backbone of GLU-885
8

−11.23191
−67.2231
LEU-840, VAL-845, LYS-868, PHE-1047, ILE-888, CYS-1045, ILE-1044, VAL-899, VAL-916, LEU-1035, GLU-917, LYS-920
N- of quinoline and H atom of amino acid backbone of CYS-919
NH of urea and amino acid backbone of GLU-885
9
−11.262384
−67.2369
LEU-840, VAL-845, LYS-868, PHE-1047, ILE-888, CYS-1045, ILE-1044, VAL-899, VAL-916, LEU-1035, GLU-917, LYS-920
N- of quinoline and H atom of amino acid backbone of CYS-919
NH of urea and amino acid backbone of GLU-885
10

−11.859276
−66.5956
LEU-840, VAL-845, LYS-868, PHE-1047, ILE-888, CYS-1045, ILE-1044, VAL-899, VAL-916, LEU-1035, GLU-917, LYS-920
N- of quinoline and H atom of amino acid backbone of CYS-919
NH of urea and amino acid backbone of GLU-885
11

−11.726688
−67.1874
LEU-840, VAL-845, LYS-868, PHE-1047, ILE-888, CYS-1045, ILE-1044, VAL-899, VAL-916, LEU-1035, GLU-917, LYS-920
N- of quinoline and H atom of amino acid backbone of CYS-919
NH of urea and amino acid backbone of GLU-885
12
−11.844542
−69.988
LEU-840, VAL-845, LYS-868, PHE-1047, ILE-888, CYS-1045, ILE-1044, VAL-899, VAL-916, LEU-1035, GLU-917, LYS-920
N- of quinoline and H atom of amino acid backbone of CYS-919
NH of urea and amino acid backbone of GLU-885
13

−11.679257
−68.7645
LEU-840, VAL-845, LYS-868, PHE-1047, ILE-888, CYS-1045, ILE-1044, VAL-899, VAL-916, LEU-1035, GLU-917, LYS-920
N- of quinoline and H atom of amino acid backbone of CYS-919
NH of urea and amino acid backbone of GLU-885
14

−10.000164
−66.9048
LEU-840, VAL-845, LYS-868, PHE-1047, ILE-888, CYS-1045, ILE-1044, VAL-899, VAL-916, LEU-1035, GLU-917, LYS-920
N- of quinoline and H atom of amino acid backbone of CYS-919
NH of urea and amino acid backbone of GLU-885
15

−10.14931
−65.6382
LEU-840, VAL-845, LYS-868, PHE-1047, ILE-888, CYS-1045, ILE-1044, VAL-899, VAL-916, LEU-1035, GLU-917, LYS-920
N- of quinoline and H atom of amino acid backbone of CYS-919
NH of urea and amino acid backbone of GLU-885
16

−9.737217
−67.7536
LEU-840, VAL-845, LYS-868, PHE-1047, ILE-888, CYS-1045, ILE-1044, VAL-899, VAL-916, LEU-1035, GLU-917, LYS-920
N- of quinoline and H atom of amino acid backbone of CYS-919
NH of urea and amino acid backbone of GLU-885
17

−9.506826
−61.0352
LEU-840, VAL-845, LYS-868, PHE-1047, ILE-888, CYS-1045, ILE-1044, VAL-899, VAL-916, LEU-1035, GLU-917, LYS-920
N- of quinoline and H atom of amino acid backbone of CYS-919
NH of urea and amino acid backbone of GLU-885
18

−10.055614
−68.0649
LEU-840, VAL-845, LYS-868, PHE-1047, ILE-888, CYS-1045, ILE-1044, VAL-899, VAL-916, LEU-1035, GLU-917, LYS-920
N- of quinoline and H atom of amino acid backbone of CYS-919
NH of urea and amino acid backbone of GLU-885
19

−10.469236
−56.8363
LEU-840, VAL-845, LYS-868, PHE-1047, ILE-888, CYS-1045, ILE-1044, VAL-899, VAL-916, LEU-1035, GLU-917, LYS-920
N- of quinoline and H atom of amino acid backbone of CYS-919
NH of urea and amino acid backbone of GLU-885
20

−10.21120
−61.3390
LEU-840, VAL-845, LYS-868, PHE-1047, ILE-888, CYS-1045, ILE-1044, VAL-899, VAL-916, LEU-1035, GLU-917, LYS-920
N- of quinoline and H atom of amino acid backbone of CYS-919
NH of urea and amino acid backbone of GLU-885
21

−10.34212
−63.0922
LEU-840, VAL-845, LYS-868, PHE-1047, ILE-888, CYS-1045, ILE-1044, VAL-899, VAL-916, LEU-1035, GLU-917, LYS-920
N- of quinoline and H atom of amino acid backbone of CYS-919
NH of urea and amino acid backbone of GLU-885
22

−11.11231
−67.1897
LEU-840, VAL-845, LYS-868, PHE-1047, ILE-888, CYS-1045, ILE-1044, VAL-899, VAL-916, LEU-1035, GLU-917, LYS-920
N- of quinoline and H atom of amino acid backbone of CYS-919
NH of urea and amino acid backbone of GLU-885
23
−11.11281
−66.0126
LEU-840, VAL-845, LYS-868, PHE-1047, ILE-888, CYS-1045, ILE-1044, VAL-899, VAL-916, LEU-1035, GLU-917, LYS-920
N- of quinoline and H atom of amino acid backbone of CYS-919
NH of urea and amino acid backbone of GLU-885
24

−9.366237
−66.7524
LEU-840, VAL-845, LYS-868, PHE-1047, ILE-888, CYS-1045, ILE-1044, VAL-899, VAL-916, LEU-1035, GLU-917, LYS-920
N- of quinoline and H atom of amino acid backbone of CYS-919
NH of urea and amino acid backbone of GLU-885
25

−8.743855
−70.2198
LEU-840, VAL-845, LYS-868, PHE-1047, ILE-888, CYS-1045, ILE-1044, VAL-899, VAL-916, LEU-1035, GLU-917, LYS-920
N- of quinoline and H atom of amino acid backbone of CYS-919
NH of urea and amino acid backbone of GLU-885
26
−6.565878
−49.8362
LEU-840, VAL-845, LYS-868, PHE-1047, ILE-888, CYS-1045, ILE-1044, VAL-899, VAL-916, LEU-1035, GLU-917, LYS-920
N- of quinoline and H atom of amino acid backbone of CYS-919
NH of urea and amino acid backbone of GLU-885
Residues within 5 Å areas of co-crystallized ligand and quinoline derivatives are shown in Fig. 6. Some common residues involved in this type of interaction within 5 Å area are LEU-840, VAL-845, LYS-868, PHE-1047, ILE-888, CYS-1045, ILE-1044, VAL-899, VAL-916, LEU-1035, GLU-917, LYS – 920 as shown in Table 4.
For the 26 compounds, the partition coefficient (QPlogPo/w) and water solubility (QPlogS), critical for the estimation of absorption and distribution of drugs within the body ranged between 3.712 to 5.392 and −7.313 to −4.825. Cell permeability (QPPCaco), a key factor governing drug metabolism and its access to biological membranes, ranged from 128.056 to 1470.581, QPMDCK ranges from 78.8 to 4995.235. Overall, the percentage human oral absorption for the compounds ranged from 86.397% to 100%. All these pharmacokinetic parameters are within the acceptable range defined for human use (see Table 5 footnote), thereby indicating their potential as drug-like molecules.
Criteria
Compounds
Molecular weight
Lipinski’s rule of five (Drug Likeliness)
In Silico ADME by QikProp, Schordinger 9.0
Sr. No.
QPlogP O/W a
H-bond donor
H-bond acceptor
QPlogS b
QPlogHERG c
QPPCaco d
QPMDCK e
% Human Oral Absorption f
1
415.448
4.407
02
5
−5.834
−5.728
1075.467
781.224
100
2

445.474
4.571
02
5.75
−6.027
−5.583
1238.645
900.151
100
3

445.474
4.508
02
5.75
−6.073
−5.624
1072.379
781.101
100
4

429.474
4.745
02
5
−6.223
−5.555
1477.538
1057.12
100
5
429.474
4.714
02
5
−6.4
−5.63
1074.461
781.015
100
6
429.474
4.716
02
5
−6.409
−5.636
1075.387
781.156
100
7
460.445
3.712
02
5
−5.997
−5.637
128.056
78.8
86.397
8
460.445
3.715
2
6
−6.01
−5.643
128.239
78.671
86.426
9

433.438
4.593
02
5
−6.005
−5.568
1174.34
1297.045
100
10

433.438
4.643
02
5
−6.204
−5.606
1075.577
1411.029
100
11
433.438
4.642
02
5
−6.198
−5.599
1075.433
1413.694
100
12
449.893
4.9
02
5
−6.576
−5.639
1075.284
1924.823
100
13

449.893
4.898
02
5
−6.569
−5.631
1075.436
1928.785
100
14

451.429
4.357
02
5
−4.825
−4.683
679.825
1126.228
100
15
451.429
4.828
02
5
−6.369
−5.44
1173.86
2346.659
100
16

451.429
4.833
02
6
−6.376
−5.43
1204.462
2380.719
100
17
451.429
4.833
02
5
−6.332
−5.444
1297.433
2401.246
100
18

451.429
4.944
02
5
−6.832
−5.73
1072.441
2392.33
100
19

451.429
4.884
02
5
−6.576
−5.465
1106.857
2594.467
100
20

484.338
5.344
2
5
−7.014
−5.463
1230.912
4612.511
100
21
484.338
5.356
2
5
−7.051
−5.479
1270.107
4767.897
100
22
484.338
5.334
2
5
−7.191
−5.537
1102.199
4068.785
100
23

484.338
5.392
2
5
−7.313
−5.537
1074.893
4745.769
100
24
469.419
5.015
02
5
−6.514
−5.258
1306.584
3975.17
100
25

485.874
5.25
02
5
−6.726
−5.251
1388.316
5481.041
100
26
485.874
5.119
02
5
−6.6
−5.114
1174.475
4275.884
100
4 Conclusion
A series of quinoline derivatives with VEGFR-2 tyrosine kinase inhibitory activity were subjected to a 3D-QSAR study. All the developed 3D-QSAR models have shown good predictabilities and statistical validation. Model-1 (AADRR.55) was significantly more accurate than other models, which is characterized by PLS factors (r2 = 0.8621, SD = 0.4412, F = 34.66, P = 0.8462) and the test set correlation is characterized by PLS factors (q2 = 0.6943, RMSE = 0.4287, Pearson-R = 0.8462). The resulting 3D-QSAR contour maps have provided useful insights into active-structure relationship, allowing a discussion in terms of drug design. Nitrogen atom of the quinoline ring serves as hydrogen bond acceptor (A1) in drug receptor interaction as it is proved by docking studies where it is showing a hydrogen bonding interaction with the CYS-919 amino acid residue. Ring residue (R12) in this model occupies much of the favorable blue cubes due to the presence of the hydrophobic quinoline ring. Similarly ring residue (R14) in diphenylurea at the 4th position of the quinoline ring suggests that the bulky substituent is essential at the 4th position of the quinoline ring for producing VEGFR-2 kinase inhibition, it is also inferred from the docking results that the bulky moiety is located in a deep hydrophobic pocket formed by VAL-845, LYS-868, VAL-899, ILE-1044, PHE-1047, LEU-889 and ILE-888. Furthermore, at position-4 (diphenylurea) of the quinoline ring electron donating groups such as CH3, OCH3 favors the activity as compared to the electron withdrawing groups. It is also observed that kinase inhibitory activity is inversely proportional with the electron withdrawing group present over diphenylurea. It is also concluded by observing the blue cubes at 6th and 7th positions of the quinoline ring that an electron donating substituent such as methoxy is favorable for VEGFR-2 inhibition activity. Docking studies have revealed that the quinoline ring binds to a narrow hydrophobic pocket in the N-terminal domain of VEGFR-2 tyrosine kinase where N- of the quinoline ring interacts with the H-atom of the amino acid backbone of CYS-919 via a hydrogen bond. These interactions underscore the importance of both nitrogen atoms for binding and the subsequent inhibitory capacity. The diphenylurea moiety at the C-4 position of quinoline is observed to be inserted deeply in the cavity, interacting with VAL-845, LYS-868, VAL-899, ILE-1044, PHE-1047, LEU-889, ILE-888 and GLU-885 through hydrophobic and H-bond contacts, respectively. In summary, the ligand-based 3D-QSAR model based on pharmacophore conformations, docking study and drug-like filters (ADMET and Lipinski’s rule of five) presented in this study could be very useful for further development of VEGFR-2 tyrosine kinase inhibitors.
Acknowledgement
The authors would like to thank Mr. R.R. Patil for his valuable guidance and suggestions during the study.
References
- Vascular endothelial growth factor and platelet-derived growth factor are potential angiogenic and metastatic factors in human breast cancer. Surgery. 1996;119:333-339.
- [Google Scholar]
- Three-dimensional models of histamine H3 receptor antagonist complexes and their pharmacophore. J. Mol. Graph Model.. 2006;24:456-464.
- [Google Scholar]
- A review of the latest clinical compounds to inhibit VEGF in pathological angiogenesis. Expert Opin. Ther. Targets. 2006;10:867-876.
- [Google Scholar]
- Expression of vascular permeability factor (vascular endothelial growth factor) and its receptors in adenocarcinomas of the gastrointestinal tract. Cancer Res.. 1993;53:4727-4735.
- [Google Scholar]
- Antitumor activity of ZD6474, a vascular endothelial growth factor receptor tyrosine kinase inhibitor, in human cancer cells with acquired resistance to antiepidermal growth factor receptor therapy. Clin. Cancer Res.. 2004;10:784-793.
- [Google Scholar]
- PHASE: a new engine for pharmacophore perception, 3D QSAR model development, and 3D database screening: 1. Methodology and preliminary results. J. Comput.-Aided Mol. Des.. 2006;20:647-671.
- [Google Scholar]
- Sorafenib in advanced clearcell renal-cell carcinoma. N. Eng. J. Med.. 2009;49:332-334.
- [Google Scholar]
- Controlling the vasculature: angiogenesis, anti-angiogenesis, and vascular targeting of gene therapy. Trends Pharmacol. Sci.. 1995;16:57-66.
- [Google Scholar]
- VEGF and the quest for tumour angiogenesis factors. Nat. Rev. Cancer. 2002;2:795-803.
- [Google Scholar]
- Discovery and development of bevacizumab, an anti-VEGF antibody for treating cancer. Nat. Rev. Drug Discov.. 2004;3:391-400.
- [Google Scholar]
- Angiogenesis in cancer, vascular, rheumtoid and other disease. Nat. Med.. 1995;1:27-31.
- [Google Scholar]
- Glide: a new approach for rapid, accurate docking and scoring. 1. Method and assessment of docking accuracy. J. Med. Chem.. 2004;47:1739-1749.
- [Google Scholar]
- Rational selection of training and test sets for the development of validated QSAR models. J. Comput. Aided Mol. Des.. 2003;17:241-253.
- [Google Scholar]
- MMFF94 van der Waals and Electrostatic Parameters for Intermolecular Interactions. J. Comput. Chem.. 1996;17:520.
- [Google Scholar]
- Glide: a new approach for rapid, accurate docking and scoring. 2. Enrichment factors in database screening. J. Med. Chem.. 2004;47:1750-1759.
- [Google Scholar]
- Vascular endothelial growth factor receptor-2: structure, function, intracellular signalling and therapeutic inhibition. Cell Signal.. 2007;19:2003-2012.
- [Google Scholar]
- Novel potent orally active selective VEGFR-2 tyrosine kinase inhibitors: synthesis, structure activity relationships, and antitumor activities of N-phenyl-N′-{4-(4-quinolyloxy) phenyl} ureas. J. Med. Chem.. 2005;48:1359-1366.
- [Google Scholar]
- Experimental and computational approaches to estimate solubility and permeability in drug discovery and development settings. Adv. Drug Deliv. Rev.. 2001;23:3.
- [Google Scholar]
- Vandetanib (ZD6474), a dual inhibitor of vascular endothelial growth factor receptor (VEGFR) and epidermal growth factor receptor (EGFR) tyrosine kinases: current status and future directions. Oncologist. 2009;14:378-390.
- [Google Scholar]
- Activity of SU11248, a multitargeted inhibitor of vascular endothelial growth factor receptor and platelet-derived growth factor receptor, in patients with metastatic renal cell carcinoma. Clin. Oncol.. 2006;24:16-24.
- [Google Scholar]
- Pharmacophore Refinement and 3D-QSAR Studies of Histamine H3 Antagonists. QSAR Comb. Sci.. 2007;26:744-753.
- [Google Scholar]
- 2D QSAR Studies on aseries of quinazoline derivatives as tyrosine kinase (EGFR) inhibitor: An approach to design anti-cancer agents. Lett. Drug Design Dis.. 2010;7:556-586.
- [Google Scholar]
- Synthesis and anticancer evaluation of novel 2-cyclopropylimidazole[2,1-b][1,3,4]-thiadiazole derivatives. Eur. J. Med. Chem.. 2011;46:4411-4418.
- [Google Scholar]
- A comparative QSAR analysis of quinazoline analogues as tyrosine kinase (erB-2) inhibitors. Med. Chem.. 2011;7:200-212.
- [Google Scholar]
- Synthesis and in vitro antitumor activity of substituted quinazoline and quinoxaline derivatives: search for anticancer agent. Eur. J. Med. Chem.. 2011;46:2327-2346.
- [Google Scholar]
- Eur. J. Med. Chem.. 2012;56:56-69.
- Phase 1.0 (2005) User manual. Schrodinger, New York.
- Characterization of b3-adrenergic receptor: determination of pharmacophore and 3D QSAR model for β3-adrenergic receptor agonism. J. Comput. Aided Mol. Des.. 2005;19:93-110.
- [Google Scholar]
- QikProp, version 9.0, Schrodinger, LLC., New York, NY, 2010.
- Sorafenib: a glimmer of hope for unresectable hepatocellular carcinoma? Hepathology. 2009;49:332-334.
- [Google Scholar]
- Antiangiogenic agents targeting vascular endothelial growth factor and its receptors in clinical development. Expert Opin. Invest. Drugs. 2002;11:1447-1465.
- [Google Scholar]
- Receptor tyrosine kinases as targets for inhibition of angiogenesis. Drug Discov. Today. 1997;2:50-63.
- [Google Scholar]
- Novel Procedure for Modeling Ligand/Receptor Induced Fit Effects. J. Med. Chem.. 2006;49:534-553.
- [Google Scholar]
- Protein tyrosine kinase inhibitors as anticancer agents. Expert Opin. Ther. Pat.. 2004;14:35-53.
- [Google Scholar]
- Expression of vascular endothelial growth factor and its receptor, KDR correlates with vascularity, metastasis, and proliferation of human colon cancer. Cancer Res.. 1995;55:3964-3968.
- [Google Scholar]
- Pharmacophore mapping of a series of pyrrolopyrimidines, indolopyrimidines and their congeners as multidrug resistance-associated protein (MRP1) modulators. J. Mol. Model.. 2008;14:911-921.
- [Google Scholar]
- Oprea T.I., ed. Chemoinformatics in drug discovery. Weinheim: Wiley; 2005. p. :437-455.
- Expression of vascular endothelial growth factor, its receptor, and other angiogenic factors in human breast cancer. Cancer Res.. 1996;56:2013-2016.
- [Google Scholar]
- Induced-fit docking studies of the active and inactive states of protein tyrosine kinases. J. Mol. Graph. Mod.. 2009;28:336-346.
- [Google Scholar]


