Translate this page into:
Ganmaidazao decoction alleviated cognitive impairment on Alzheimer's disease rats by regulating gut microbiota and their corresponding metabolites
⁎Corresponding authors at: China Medical University (B. Wei) and Hubei Three Gorges Polytechnic (Y. Xie). xy_1021@163.com (Yao Xie), cmubbwei@126.com (Binbin Wei)
-
Received: ,
Accepted: ,
This article was originally published by Elsevier and was migrated to Scientific Scholar after the change of Publisher.
Peer review under responsibility of King Saud University.
Abstract
Traditional Chinese medicine targeted at gut microbiota has good effects in relieving the clinical manifestation of Alzheimer's disease, and intestinal metabolites are considered as a bridge of communication between the brain-gut axis. In order to explore the molecular mechanism of Ganmaidazao decoction treatment, first, the model rats induced by Aβ25-35 and d-gal were used to test the therapy of Ganmaidazao extract using the Morris Water Maze, Western Blot and Elisa. Then the 16S rDNA gene sequencing of the gut microbiota as well as UPLC-QTOF/MS-based metabolomic analysis of feces were carried out. Last, the relationship between Alzheimer's disease, gut microbiota and metabolites was analyzed. Results showed that the abundance and diversity of gut microbiota were rescued and the changes of fecal metabolites in rats with Alzheimer's disease were reversed after Ganmaidazao decoction administration, which were mainly related to lipid metabolism, steroid hormone metabolism, energy metabolism, amino acid metabolism and bile acid metabolism. After associating with Spearman’s correlation analysis, we concluded that gut microbiota and metabolites were closely related and Ganmaidazao decoction could interfere with the balance of gut microbiota and their corresponding metabolites to exert anti- Alzheimer’s disease effect. Combined with PICRUSt2 functional prediction of gut microbiota and metabolomics results, phenylalanine metabolism has been focused as a key metabolic pathway, and Ganmaidazao decoction can reduce the abnormal accumulation of phenylalanine and phenylpyruvate and promote their metabolism by restoring the activity of phenylalanine hydroxylase. This integrated omics approach has potential roles in understanding the complex mechanisms of Ganmaidazao decoction in treating Alzheimer’s disease.
Keywords
Metabolomics
Gut microbiota
Alzheimer’s disease
Ganmaidazao decoction
16S rDNA sequencing
Phenylalanine metabolism
1 Introduction
Alzheimer’s disease (AD) is a neurodegenerative disease that progressively and severely affects the lives of the elderly. Despite numerous investments in the war against AD, there are currently no available treatments to prevent or cure the disease (Gu, 2021). Undoubtedly, the complex etiology of AD is the biggest challenge to overcome this problem. The main pathological process of AD is the diffuse extracellular deposition of β-amyloid protein (Aβ) to form neurite plaques, and the accumulation of hyperphosphorylated tau protein in neurites to form neurofibrillary tangles (Duyckaerts et al., 2009). Although a few anti-AD drugs have been developed globally, they are targeted at single molecules like acetylcholinesterase, which are not the best choice for AD patients with multiple pathogeneses.
Widely application of traditional Chinese medicine (TCM) is to treat cognitive disorders including AD, which can produce a synergistic effect on each target. The Ganmaidazao decoction (GMDZ) containing Glycyrrhiza Tourn. ex L.(licorice), Triticum aestivum L. (wheat) and Ziziphus jujuba Mill. (jujube), first appeared in ‘Jin Gui Yao Lve’ to treat various central nervous system diseases by effecting levels of neurohormones, cytokines, behavioral changes, and the autonomic nervous system (Kim, 2017). It has been confirmed that GMDZ decoction exerts an anti-anxiety effect by regulating the GABA and 5-HT system (Chen, 2018) and a rapid anti-depressant effect by restraining signal transduction of the NMDA/NO/cGMP pathway (Zhang, 2020). These pathways are closely in connection with the pathogenesis of AD. Excessive NMDAR activity leads to excitotoxicity, prompting cell death, a potential neurodegenerative mechanism in AD (Wang and Reddy, 2017). The NO/cGMP signaling pathway plays a vital role in memory and learning (Dubey et al., 2020). Various studies have identified flavonoids, saponins, triamides, alkaloids, terpenes, phenolic acids, anthocyanins and carotenoids in GMDZ decoction. Glycyrrhizic acid and glycyrrhetinic acid are the main active ingredients in licorice. Glycyrrhizic acid has neuroprotective effects and can improve cognitive impairment induced by scopolamine (Ban et al., 2020). Flavonoids in natural medicines have become alternative candidates for AD treatment because of their antioxidant, anti-inflammatory and anti-amyloidogenic properties receiving widespread attention (Uddin, 2020). The above researches show that these components in GMDZ decoction may perform anti-AD functions. However, the molecular mechanism and integrative effect of the interaction between GMDZ decoction and AD remains to be clarified.
The gut microbiota (GM) is increasingly being used to elucidate the relationship between Chinese medicine and diseases (Feng, 2021; Hua et al., 2021). Wang (Wang, 2021) found that berberine can promote the l-dopa synthesis of Enterococcus faecium to improve Parkinson’s disease. Huang confirmed that theabrownin from Pu-erh tea could suppress gut microbiota associated with bile-salt hydrolase (BSH) activity, increase the levels of BAs, and reduce hepatic cholesterol (Huang, 2019). Recently, increasing clinical and experimental evidence indicates the gut microbiota plays an important role in neurodegenerative disease, including Parkinson’s diseases (PD), autism spectrum disorder (ASD), and AD (Zhou, 2019). AD has also been described as being associated with changes in gut microbial profiles, with reduced richness and diversity found in early stage of AD and differences in the Firmicutes: Bacteroidetes ratio (Long-Smith, 2020). Gut microbiota may participate in the development of Aβ deposition and changes in the levels of SCFAs in APPPS1 mice (Zhang, 2017). Therefore, the link between gut microbiota and AD can be established through the gut microbiota-brain-gut axis, and gut microbiota can also serve as a potential new target for AD therapy.
Metabolomics analysis provides a tool for revealing the metabolic pathways of AD (Gonzalez-Dominguez et al., 2015). For instance, metabolomics analysis showed changes in ether phosphatidylcholine and sphingomyelin occur in the early clinical stage of AD, while changes in acylcarnitine and amino acids occur during the development of AD (Toledo, 2017). 16S rDNA high-throughput sequencing is to identify all bacteria in specific environmental (or specific habitat) samples and study the composition of microbial populations, interpret the diversity, richness and group structure of microbial populations, and finally explore the relationships among microorganisms, the environment and the host. The combination of 16S rDNA sequencing and metabolomics will supply a new perspective into the explore of the relationship between gut microbiota and CNS diseases, as previously studied (Yu, 2017).
Our earlier study found that GMDZ decoction can effectively treat AD by improving the plasma metabolism disorder in d-gal and Aβ-induced AD rats (Meirong Cui and Shuo Gu, 2022). Most of the active ingredients were found in feces, and several active ingredients were found in blood (See Table S1 and S2 for details). Fecal active ingredients may serve as potential substrates for gut microbiota. In this study, we firstly explored the potential mechanism of GMDZ decoction in the treatment of AD using UPLC-QTOF/MS-based metabolomics, integrating a new strategy of 16S rDNA sequencing technology. We then analyzed the relationship between the gut microbiota, metabolites, and AD by establishing the gut microbiota-brain-gut axis and screened out key metabolic pathway, which will ultimately help to reveal the mechanism of GMDZ decoction on AD.
2 Materials and methods
2.1 Experimental materials and preparation
Standard compounds (phenylalanine, tyrosine, phenylpyruvic acid) and internal standard (4-amino-2-hydroxybenzoic acid) were purchased from Shenyang chromatography scientific instrument Co., ltd.
Licorice, jujube and wheat in GMDZ decoction were purchased from Tianyitang Pharmacy, and they were certified to be in compliance with pharmacopeia standards.
According to the National Traditional Chinese Medicine Information Platform (https://www.cntcm.com.cn/), GMDZ decoction consists of licorice (9 g), wheat (15 g), and jujube (30 g). The appropriately proportioned GMDZ decoction mixture (3: 5: 10, w: w: w) was soaked in water for 60 min at ratio of 1: 8 (w: w) and boiled for 2 h. Subsequently, the solution was filtered and collected. This procedure was repeated twice. All collected solutions were distilled under reduced pressure at 60℃ to proximate dry, lyophilized, and dissolved at a concentration of 1 g / mL GMDZ solution in water.
2.2 Animals and modeling
2.2.1 Animal Ethics
Adult male SD rats (weight: 200–300 g, age: 8-week-old,) were obtained from the experimental animal center of China Medical University. The experiment was carried out in accordance with the Guidelines for Animal Experimentation of China Medical University [Experimental Ethics No. (CMU2022036)], and the project got the approval of the Animal Ethics Committee of the institution.
2.2.2 Experimental design
24 rats screened by swimming were adaptively fed for one week, and were divided into four groups (n = 6) randomly: control, AD model group (AD), GMDZ decoction-treated group (GMDZ) and Huperzine A-treated group (Hup-A). From the 1st to the 10th week, d-gal (150 mg/kg/d) were intraperitoneally injected into rats in the model, GMDZ and Hup-A groups every day. At week 11, 10 μg Aβ25–35 was injected into both sides of the rats’ hippocampus. The control group was treated with saline in the same manner. Drug intervention started at week 3 and continued through week 12. 30 µg/kg/d Hup-A was given to Hup-A rats; 6.3 g/kg/d GMDZ decoction, calculated based on the human clinical amount (0.9 g/kg/d, 60 kg), was given to GMDZ rats, orally administrated. Feces and brain samples were collected during the experiment.
2.3 The Morris water Maze test
At week 12, spatial learning and memory of all rats were assessed using the Morris Water Maze (MWM) test, according to Vorhees & Williams (Vorhees and Williams, 2006).
2.4 Western blot (WB) analysis
Half of the rat brain tissue was homogenized with methanol for subsequent experiments. RIPA lysis buffer with fresh proteinase inhibitors was added to the brain homogeneity. Centrifugating for 15 min, 15300 g, the concentration of Aβ protein was calculated with a bicinchoninic acid (BCA) protein quantitation kit. 60 μg protein per hole was separated by 12.5 % SDS-PAGE electrophoresis and transferred to PVDF membrane. Then the blot was sealed with 8 % nonfat milk for 1.5 h(RT). The blot was incubated with specific primary antibodies, which refer to Amyloid-β (1: 1000, Bioss Antibodies, beijing)) overnight at 4℃. Next day, the blots were incubated with corresponding secondary antibodies for 2 h, RT. The blots were visualized by Gel-Imaging using, a chemiluminescence detection kit.
2.5 Enzyme-Linked immunosorbent Assay analysis of Tumor Necrosis Factor-α, Interleukin-18, Interleukin-1β and phenylalanine hydroxylase
According to the instructions, IL-1β, IL-18, and TNF-α concentrations of the same rat brain homogeneity were measured using ELISA kits (Chenglinshengwu, beijing), and rats’ feces were homogenized for measuring phenylalanine hydroxylase activity. The standard curve was established for calculating the levels of TNF-α, IL-18, IL-1β or phenylalanine hydroxylase in the tissues.
2.6 16S rDNA sequencing and data processing
Microbial DNA extraction: DNA extraction kits were available for different types of samples to ensure DNA extraction efficiency and quality. (OMEGA Stool DNA Kit).
Construction of target fragment library and sequencing: The PCR primer was designed against the conserved region to target at the variable region of the 16S rDNA gene. After 35 PCR cycles, barcodes and sequencing adapters were added for amplification. PCR amplification products were detected by 1.5 % agarose gel electrophoresis. The target fragments were recovered using the AxyPrep PCR Cleanup Kit. The PCR product was further purified using a Quant-iT PicoGreen dsDNA Assay Kit. The library was quantified using a Promega QuantiFluor fluorescence quantification system. The pooled library was loaded on an Illumina platform using a paired-end sequencing protocol (2 × 250 bp).
Data Processing: Paired-end reads were assigned to samples by their unique barcodes and truncated by cutting off the barcode and primer sequences. Paired-end reads were pooled using FLASH (v1.2.8) (for 16S rRNA). Raw reads were quality filtered under specific filtering conditions, resulting in high-quality clean labels according to fqtrim (v0.94). Chimeric sequences were filtered with the Vsearch software (v2.3.4). After using DADA2 for dereplication, the feature table and feature sequence were obtained. Alpha diversity and beta diversity were calculated using QIIME2, where the number of sequences was reduced to the minimum of some samples and the same number of sequences were randomly extracted, and then the relative abundance (X bacteria count/total count) was calculated for bacterial taxonomy. Alpha diversity and beta diversity were analyzed using the QIIME2 process, and use R (v3.5.2) to draw pictures. The sequence alignment of species annotation was performed using BLAST in SILVA and NT-16S alignment database.
2.7 Untargeted metabolomics analysis
2.7.1 Sample processing
The fecal sample was retrieved from −80℃, and 50 mg was weighed, 1000 μL of 50 % methanol was added to each sample, homogenized at 60 Hz for 30 s, the steel balls (2–3) were removed, and vortexed for 1 min to precipitate the protein. The samples were then placed in an environment of 20℃ for 30 min, and then centrifuged at 15,300 g, 4℃ for 10 min, and the supernatant was taken. Repeat this twice. All samples were then filtered with a 0.22 μm organic microporous membrane, and the supernatant was collected for analysis.
2.7.2 UPLC Q-TOF/MS based untargeted metabolomics analysis
The mobile phase A was acetonitrile and the mobile phase B was water containing 0.1 % (v/v) formic acid (B) for feces metabolomics in positive mode, while the mobile phase A consisted of acetonitrile and the mobile phase B consisted of water for fecal metabolomics in negative mode using a gradient of 5 % A at 0–2 min, 5 %-20 % A at 2–3 min, 20 % −80 %A at 3–16 min, 80 %-95 % A at 16–17 min. The volume of injection was 3 μL, and the sample temperature was 4 ℃.
Reversed-phase chromatography column (ACQUITY HSS T3, 2.1 × 100 mm, 1.8 µm, Waters) at 40℃ was used to separate feces sample at a flow rate of 0.40 mL min−1. Mass data were monitored in positive and negative ion modes. Refer to our previous study for instrument models and mass spectrometry conditions (Meirong Cui and Shuo Gu, 2022).
Quality control (QC) samples were prepared by mixing 100 μL of all brain or fecal samples to ensure system consistency during sample acquisition. At first, we ran ten QC to equilibrate the system, and ran QC periodically during the analysis to further test the system’s stability.
2.7.3 Untargeted metabolomics data processing
All raw LC-MS data were converted by data processing software Progenesis QI V 2.3 (Waters). The raw data undergo peak alignment, peak extraction, normalization, data filtering, compound identification, and then was exported to EZinfo 3.0 for statistical analysis, compound verification and correlation analysis. Based on MS/MS data measured on the Q-TOF platform, the human metabolome database (https://www.hmdb.ca/) was selected for metabolite identification using accurate molecular mass (mass error < 10 ppm). The identified compounds were exported to EZinfo 3.0 for principal component analysis (PCA) and orthogonal partial least squares discriminant analysis (OPLS-DA). Compounds with VIP > 1, CV ≤ 30 % and p < 0.05 were considered as potential differential metabolites, and MetaboAnalyst 5.0 (https://www.metaboanalyst.ca/) was used for their pathway analysis.
2.8 Targeted metabolomics analysis
The feces sample pre-processing of the targeted analysis is the same as that in 2.6.1. Internal standard was added before detection in the same proportion. PABA (4-amino-2-hydroxybenzoic acid) was used as internal standard (IS) for the determination of phenylalanine, phenylpyruvate and tyrosine in feces (Ma, 2021). The standard curve concentration of each endogenous metabolite is shown in the table S3.
Samples were separated on an ACQUITY HSS T3 column (2.1 × 100 mm,1.8 μm, Waters) at a temperature of 40℃ and analyzed on a Triple Quad 3500 MS/MS system (AB Sciex, Foster City, CA, USA) coupled to an Agilent 1290 system (Agilent, CA, USA). The mobile phase was consisted by water (A) and methanol (B), and delivered at a flow rate of 0.4 mL/min. The gradient was as follows: 97 %A (0–2 min), 97–40 %A (2–4 min), 40–10 %A (4–5 min), 10–97 %A (5–5.1 min) and 97 %A (5.1–7 min). The injection volume was 5 μL. The data was collected in positive mass mode. The other ionization parameters were as follows: curtain gas, 30 (arbitrary units); ion source gas 1, 50 (arbitrary units); ion source gas 2, 50 (arbitrary units); source temperature, 550℃; and entrance potential, 10 V. The dwell time for each multiple reaction monitoring transition was 50 ms.
2.9 Statistical analysis
All data are expressed as mean ± SD. Statistics significance was assessed by ordinary-one-way ANOVA analyst test using GraphPad Prism 8.0.1. The confidence level was 95 % to determine the significance of the differences (p < 0.05). Spearman correlation analysis of gut microbiota and endogenous metabolites was performed using the OmicStudio tools at https://www.omicstudio.cn/tool.
3 Results
3.1 GMDZ decoction alleviated cognitive impairment of AD rats
Effect of GMDZ decoction on the ability of learning and memory in AD rats was tested using the Morris Water Maze. In the positioning-avigation experiment, the escape latency of rats was similar on the first day, but gradually shorted over the next 4 days (Fig. 1a). The escape latency in AD group on the day 5 was significantly longer than that in control group. After treatment with GMDZ decoction or Hup-A, the escape latencies of AD rats were significantly shortened. Fig. 1b recorded a route map of the rat's trajectory in the probe trial. The distance in Qua1, time in Qua1, and times across the platform in the target quadrant were used to evaluate rats’ space detection ability (Fig. 1c, d, e). AD rats have poor spatial exploration ability and severely impaired cognitive ability, which are reversed by GMDZ decoction and Hup-A.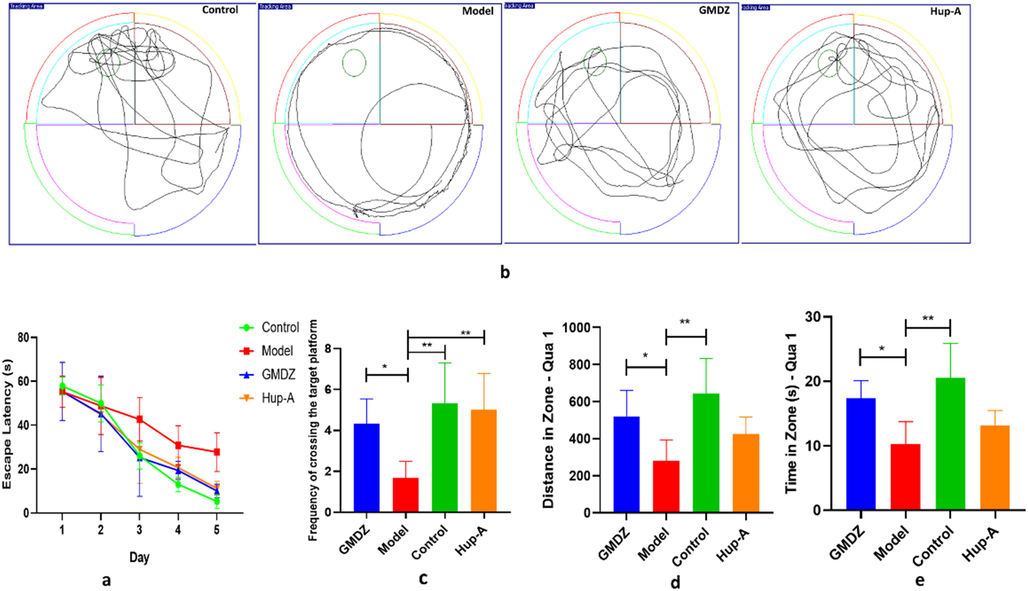
Effects of GMDZ decoction on Aβ-induced memory impairments of AD rats in the MWM test (a, line graph of the escape latency of rats in 5 days in the directional navigation experiment; b, trajectory tracking graph; c, times across the platform in the space detection test; d, the percentage of distance in Qua1 in the space detection test; e, the percentage of time in Qua1 in the space detection test).
3.2 GMDZ decoction alleviated pathological changes of AD rats
The pathological features of AD, including Aβ protein deposition and neuroinflammation, were examined after behavioral testing. First, the expression of Aβ was detected by western blot. Fig. 2a, b showed that Aβ deposition in AD rats’ brains were revised after GMDZ decoction administration.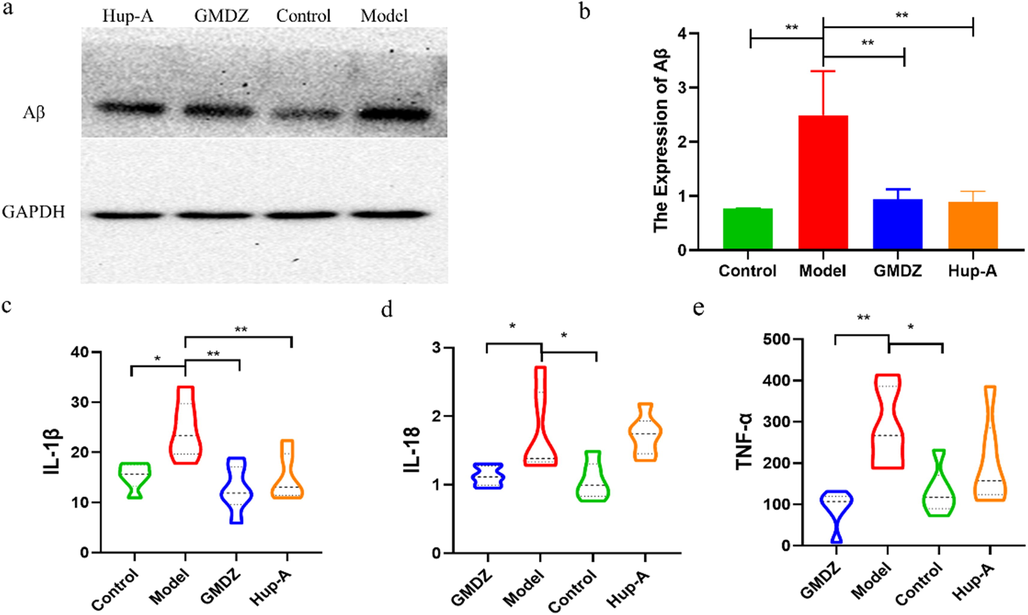
GMDZ decoction reversed the histopathological changes in AD rats. (a, the difference of Aβ content in the rats of Hup-A, GMDZ, model and control group; b, expression level analysis of Aβ in Hup-A, GMDZ, model and control group; c, level of IL-1β in the brain; d, level of IL-18 in the brain; e, level of Tumor Necrosis Factor-α in the brain).
Inflammation is an early event in the brain of AD, predating senile plaques and nerve absorption into tangles. The inflammatory response in AD is the result of the interaction between Aβ and mononuclear phagocytes, including microglia and peripheral mononuclear cells (Minter et al., 2016; Wu, 2019). Therefore, the content of cytoinflammatory factors in the brain were assessed by ELISA. Compared with the control, the levels of TNF-α, IL-18 and IL-1β in AD rats were significantly higher (Fig. 2c, d, e). Taking GMDZ decoction reversed the above histopathological changes, the same as the effect of Hup-A.
3.3 Gut microbiota composition changes after GMDZ decoction treatment
To understand the composition of gut microbiota in AD rats and the changes of GMDZ after administration, 16S rDNA sequencing was employed to monitor fecal microbiota composition in the control, AD and GMDZ groups. After removing background noise, the feature quantities of gut microbiota in different groups were obtained, as shown in Fig. 3a (4357 in model group; 6792 in control group; 4666 in GMDZ group). Alpha diversity is the diversity in a given environment or ecosystem, mainly used to react characteristics such as species richness, uniformity, and sequencing depth. The bacterial richness and α-diversity in AD group were significantly lower than that in control or GMDZ group, as demonstrated by Chao1 index, Shannon index and observed-otus rarefaction curve (Fig. 3b, c, d). PCoA analysis was performed to observe the differences between these groups. In this study (Fig. 3e), the fecal microbiota composition of the control, AD and GMDZ groups was well separated (p < 0.05).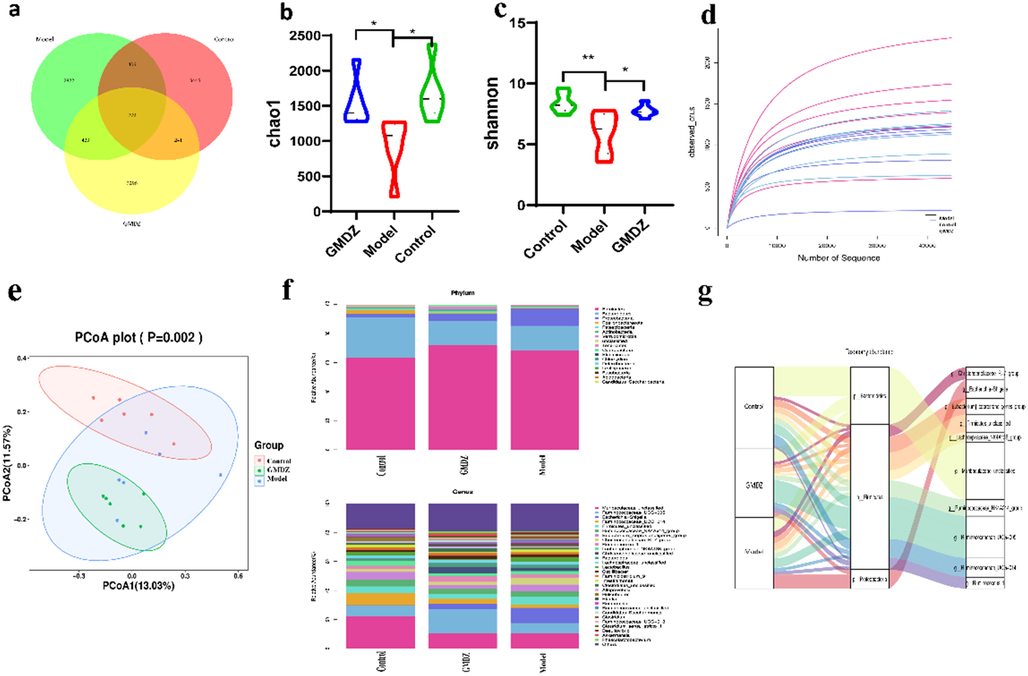
The Changes in the Relative Abundance and Diversity of the gut microbiota in the control, AD, GMDZ groups (a, venn_diagrams of GM feature in three group; b, chao1 index of three groups; c, shannon index of three groups; d, observed_otus rarefaction curve of three groups; e, PCoA plot of samples in three groups; f, relative abundance of TOP30 gut microbiota at the phylum level and genus level; g, Sankey plot of gut microbiota in three group).
According to the results of species annotation, the gut microbiota was analyzed in levels of different taxonomic. At the phylum level, unlike the results of previous studies, no significant difference in the F/B ratio was found. However, we found that the abundance of Proteobacteria phylum in the AD group significantly rose compared to the control group, and was reversed after GMDZ decoction administration (Fig. 3f). At the genus level, we compared the TOP30 gut microbiota and found that the relative abundances of Ruminococcaceae_UCG-014, Muribaculaceae in AD rats were reduced, while the relative abundances of Escherichia-Shigella, Christensenellaceae_R-7_group, Lactobacillus were increased compared with control rats. Among them, Escherichia-Shigella is the main reason for the elevation of Proteobacteria phylum (Fig. 3g). The above results indicated that diversity and richness of the gut microbiota in the AD rats were disrupted, which was significantly improved after GMDZ decoction administration.
3.4 Target bacteria and their association with AD
Linear discriminant analysis Effect Size (LEfSe) analysis, which can search for statistically different biomarkers, is often used to identify high-dimensional markers in gut microbiota between different groups. As shown in Fig. 4a, b, 48 distinguishing components at different taxon levels were identified, including 12 species enriched in AD rats, 25 species enriched in GMDZ rats and 11 species enriched in the control rats (LDA > 3, P < 0.05).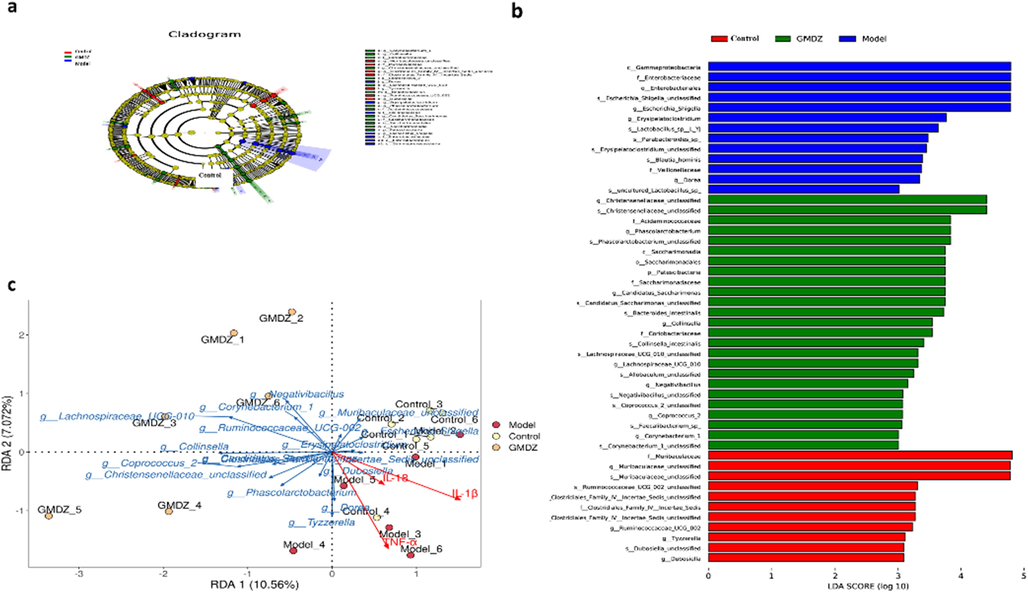
(a, b) LEfSe analysis, the circles radiated from the inside to the outside of the cladmap represent taxonomic levels from phylum to species, the diameter of small circles is proportional to the relative abundance, different colors represent different groups, and nodes with different colors represent gut microbiota that play an important role in the group; (c) analysis of RDA correlation between inflammatory factors and gut microbiota genus where the dots represent the 18 samples (n = 6). Red rays represent the two environmental factors, and blue rays represent different species. The length of the rays represents the degree of their influence on the sample communities, and the direction of the rays represents the direction of increasing abundance. If the angle between the two rays is acute, it means there is a positive correlation; if it is obtuse, then there is a negative correlation; and if it is right angle, there is no correlation.
Host environmental factors are highly correlated with changes in fecal microbiota (Wu, 2019), altered gut microbiota affects normal physiological balance, contributing to diseases’ pathogenesis like AD. The redundancy analysis (RDA) was used to study the relationship between the levels of host environmental factors (IL-1β, IL-18 and TNF-α) and gut microbiota of rats in different group. Explanation weights for differences in sample composition are expressed as percentages on the abscissa and ordinate. As shown in Fig. 4c, the samples aggregated well within the groups and separated from each other. Combining the correlation results of RDA and Spearman results concluded that bacteria in the AD group showed a positive correlation to inflammatory cytokines, while bacteria in GMDZ group showed a negative correlation to the cytokines.
3.5 Effect of GMDZ decoction on the metabolism of AD rats
As a bridge of the gut microbiota-brain-gut axis, metabolites can be used to understand the mechanism of intestinal microflora. Here, metabolite profiles of feces samples were analyzed using UPLC-QTOF/MS. As shown in Fig. 5a, 5b, the collected QC samples demonstrated the stability of the instrument and the repeatability of the acquisition method. In the fecal PCA plots, it was observed that the AD group and the control group had a clear trend of separation, indicating that the AD model was successfully induced and there were severe metabolic disorders in the AD rats. In addition, the GMDZ group, distinctly separated from the AD group but infinitely close to the control group, showed the therapeutic effect on AD rats.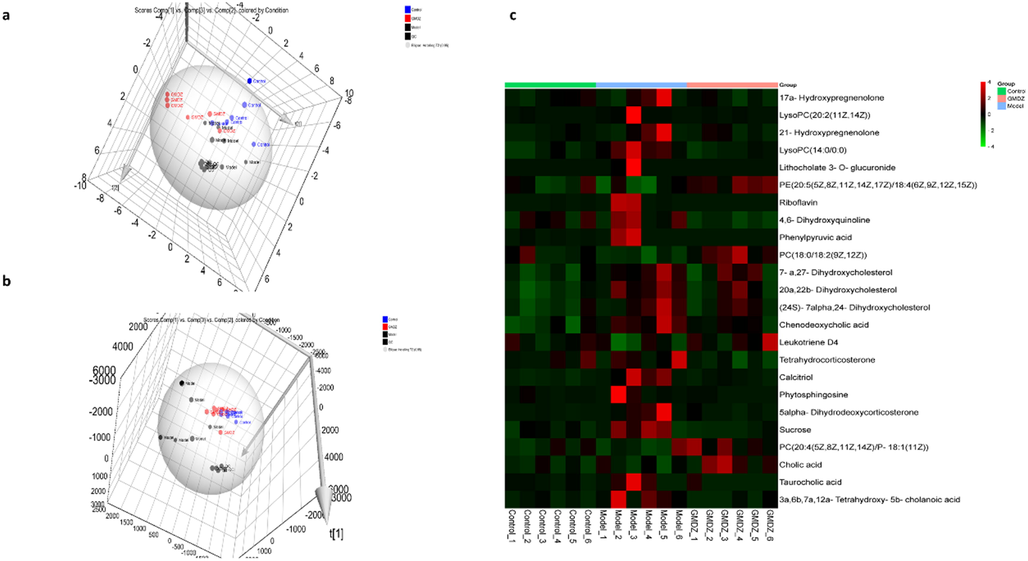
PCA Plot and Heat Maps (a, PCA 3D plot of three groups in feces in positive mode; b, PCA 3D plot of three groups in feces in negative mode c, heat map of differential metabolites of three groups in the feces).
Supervised OPLS-DA pattern recognition was performed to identify the metabolic differences between each two groups. As shown in Fig.S1, a significant separation of the control and model groups, as well as the model and GMDZ groups, was noted, showing significant metabolic perturbations in fecal samples. Furthermore, the R2 and Q2 values in the OPLS-DA model are both close to 1, representing good predicting ability and fitting ability of modeling. The compounds with p < 0.05, CV ≤ 30 % and VIP > 1.0 in OPLS-DA were selected as differential metabolites. These differential compounds were authenticated in the HMDB database. As a result, totally 24 endogenous metabolites in the feces sample were identified as potential biomarkers, and its changing trend was shown in Fig. 5c, Table 1. Through pathway enrichment analysis, we found multiple metabolic pathways including lipid metabolism, steroid hormone metabolism, amino acid metabolism, energy metabolism and bile acid metabolism are abnormal in the feces (Fig. 6a). The relationship between various metabolic pathways is shown in Fig. 6b.
Number
c
Pathway
Adducts
Formula
Mass Error (ppm)
Description
m/z
Retention time (min)
Anova (p)
q Value
FC_
BVSM
FC_
GMDZVSM
1
HMDB0000363
Steroid hormone biosynthesis
M + H
C21H32O3
1.6604
17a-Hydroxypregnenolone
333.2430
8.44
0.6861
0.1455
1.88
0.39
2
HMDB0010392
Glycerophospholipid metabolism
M + NH4
C28H54NO7P
(3.2503)
LysoPC(20:2(11Z,14Z))
565.3958
7.44
0.0003
0.0007
39.17
0.03
3
HMDB0004026
Steroid hormone biosynthesis
M + H
C21H32O3
0.8212
21-Hydroxypregnenolone
333.2427
7.35
0.8121
0.1663
3.45
0.33
4
HMDB0010379
Glycerophospholipid metabolism
M + H
C22H46NO7P
0.6201
LysoPC(14:0/0:0)
468.3088
6.25
0.0000
0.0001
2.09
0.50
5
HMDB0002513
Pentose and glucuronate interconversions
M + NH4
C30H48O9
4.9274
Lithocholate 3-O-glucuronide
570.3664
6.20
0.0047
0.0047
29.24
0.04
6
HMDB0009459
Glycerophospholipid metabolism
M + Na
C43H68NO8P
0.8363
PE(20:5(5Z,8Z,11Z,14Z,17Z)/18:4(6Z,9Z,12Z,15Z))
780.4581
5.58
0.0004
0.0008
0.86
1.53
7
HMDB0000244
Riboflavin metabolism
M + H
C17H20N4O6
2.6810
Riboflavin
377.1466
4.51
0.0252
0.0152
11.87
0.08
8
HMDB0004077
Tryptophan metabolism
M + H
C9H7NO2
0.2708
4,6-Dihydroxyquinoline
162.0550
4.23
0.0033
0.0037
1.68
0.13
9
HMDB0000205
Phenylalanine metabolism
M + H
C9H8O3
(2.1748)
Phenylpyruvic acid
165.0543
3.86
0.0031
0.0035
16.88
0.01
10
HMDB0008039
Glycerophospholipid metabolism
M + H
C44H84NO8P
(0.7795)
PC(18:0/18:2(9Z,12Z))
786.6001
19.71
0.0045
0.0046
0.83
1.46
11
HMDB0006281
Primary bile acid biosynthesis
M + H
C27H46O3
(0.5989)
7-a,27-Dihydroxycholesterol
419.3517
17.03
0.0552
0.0261
2.03
0.79
12
HMDB0006763
Steroid hormone biosynthesis
M + H
C27H46O3
(1.4945)
20a,22b-Dihydroxycholesterol
419.3513
16.82
0.0011
0.0017
1.89
0.76
13
HMDB0060136
Primary bile acid biosynthesis
M + H
C27H46O3
(3.7814)
(24S)-7alpha,24-Dihydroxycholesterol
419.3504
16.65
0.0105
0.0084
1.86
0.76
14
HMDB0000518
Primary bile acid biosynthesis
M + H
C24H40O4
(1.2247)
Chenodeoxycholic acid
393.2995
16.17
0.0005
0.0010
2.11
0.66
15
HMDB0003080
Arachidonic acid metabolism
M + H
C25H40N2O6S
4.4347
Leukotriene D4
497.2702
15.11
0.0176
0.0121
0.69
1.92
16
HMDB0000268
Steroid hormone biosynthesis
M + H
C21H34O4
(2.4260)
Tetrahydrocorticosterone
351.2521
13.63
0.0688
0.0303
1.31
0.42
17
HMDB0001903
Steroid biosynthesis
M + H
C27H44O3
(2.0349)
Calcitriol
417.3355
12.94
0.0012
0.0018
2.78
0.45
18
HMDB0004610
Sphingolipid metabolism
M + H
C18H39NO3
4.7751
Phytosphingosine
318.3018
11.43
0.2980
0.0810
5.09
0.09
19
HMDB0060407
Steroid hormone biosynthesis
M + H
C21H32O3
0.9905
5alpha-Dihydrodeoxycorticosterone
333.2428
10.78
0.0507
0.0245
6.95
0.15
20
HMDB0000258
Starch and sucrose metabolism
M + Na
C12H22O11
1.8670
Sucrose
365.1061
0.59
0.0127
0.0097
2.30
0.37
21
HMDB0008457
Glycerophospholipid metabolism
M−H, M + FA-H, M + Cl
C46H82NO7P
4.4296
PC(20:4(5Z,8Z,11Z,14Z)/P-18:1(11Z))
836.5842
5.84
0.0011
0.0097
1.02
1.33
22
HMDB0000619
Primary bile acid biosynthesis
M−H, M + Cl
C24H40O5
(0.7355)
Cholic acid
407.2800
8.41
0.0121
0.0489
1.11
2.13
23
HMDB0000036
Taurine and hypotaurine metabolism
M−H
C26H45NO7S
(0.7169)
Taurocholic acid
514.2840
7.94
0.0006
0.0054
4.50
0.02
24
HMDB0000399
Fructose and mannose metabolism
M−H
C24H40O6
(1.6501)
3a,6b,7a,12a-Tetrahydroxy-5b-cholanoic acid
423.2745
6.58
0.0464
0.1105
6.96
0.19
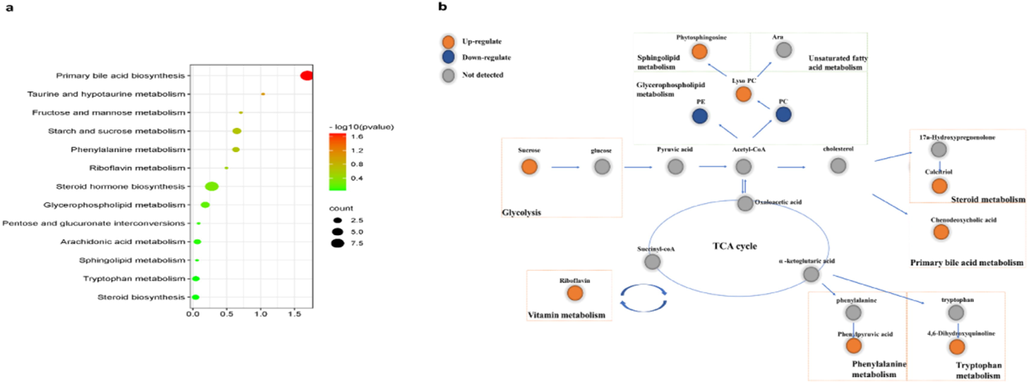
Metabolic pathway map in the brain and feces (a, KEGG pathways of feces; b, the relationship between various metabolic pathways).
3.6 Potential relationship among AD, the gut microbiota and metabolites
In order to further explore the potential relationship among inflammatory factors, the gut microbiota and metabolites, Spearman analysis was used to analyze the correlation between biomarker bacteria, inflammatory factors and the differential metabolites in the feces (Table S4). It can be seen in Fig. 7 that inflammatory factors are closely related to metabolites, and metabolites play critical roles in the microbiota-metabolite-inflammatory factors network. In particular, IL-1β and TNF-α were negatively related with most of the metabolites, and negatively related with g__Lachnospiraceae_UCG-010, g__Collinsella and g__Negativibacillus, which were specific bacteria from control and GMDZ groups. g__Escherichia-Shigella and g_Erysipelatoclostridium, the harmful bacteria from model group, showed positive relationship with 20a,22b-Dihydroxycholesterol, (24S)-7alpha,24-Dihydroxycholesterol and Calcitriol, were related to the disorder of steroid and bile acid metabolism. Interestingly, phenylpyruvate (PPA) was negatively relevant to Christensenellaceae, Lachnospiraceae and Coprococcus from GMDZ group. The increase of phenylpyruvate in feces was inhibited after GMDZ decoction administration, suggesting that GMDZ decoction may exert anti-AD effect by interfere with gut microbiota and intestinal metabolites.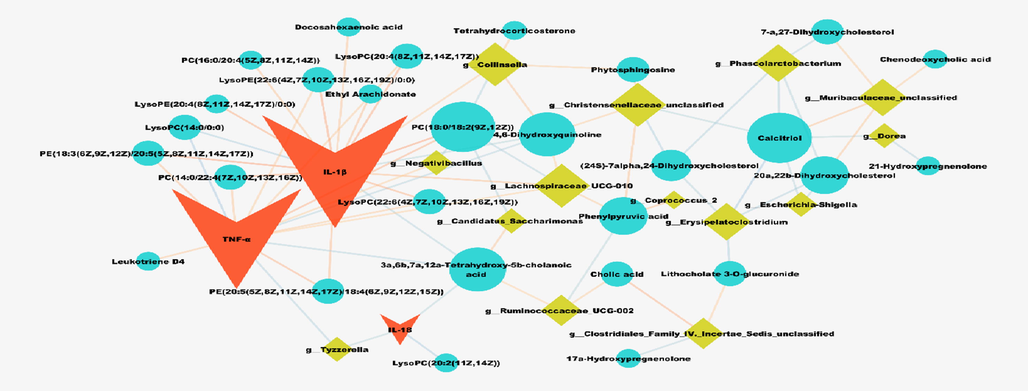
Correlations of inflammatory factors, the gut microbiota and metabolites. V shape represents inflammatory factors, round shape in blue represents metabolites in the feces, diamond shape represents the gut microbiota, line in orange represents negative correlation, line in blue represents positive correlation.
3.7 Detection of phenylalanine metabolic pathway in Alzheimer’s disease
Combining PICRUSt2 functional prediction of gut microbiota (Fig. S2) and metabolomics results, we found that phenylalanine metabolism was a significant metabolic pathway and focused on it for latter research (Fig. 8a). Phenylpyruvate, a secondary metabolite of phenylalanine, was significantly correlated with various types of GMDZ decoction-responsive bacteria in the microbiota-metabolite-inflammatory factors network. These results followed that phenylalanine metabolic pathway was severely affected in AD pathology, and Ganmaidazao decoction made a difference. It has been found phenylalanine and phenylpyruvate accumulate abnormally in the brain of Alzheimer's patients (Wu, 2019). Exposure to phenylalanine in cell cultures showed that high levels of this amino acid impair mitochondrial bioenergetics, triggering changes in oxidation and inflammatory states, and inducing apoptosis (Wyse, 2021). In our research, on the one hand, we found phenylalanine and phenylpyruvate increased significantly in feces of AD rats in Fig. 8b; on the other hand, we tested the key phenylalanine hydroxylase (Fig. 8c), and the results showed that the activity of phenylalanine hydroxylase in AD rats’ feces were significantly suppressed. Therefore, taking Ganmaidazao decoction could interfere with the responsive bacteria to reduce the abnormal accumulation of phenylalanine and phenylpyruvate in feces and alleviate cognitive abnormalities.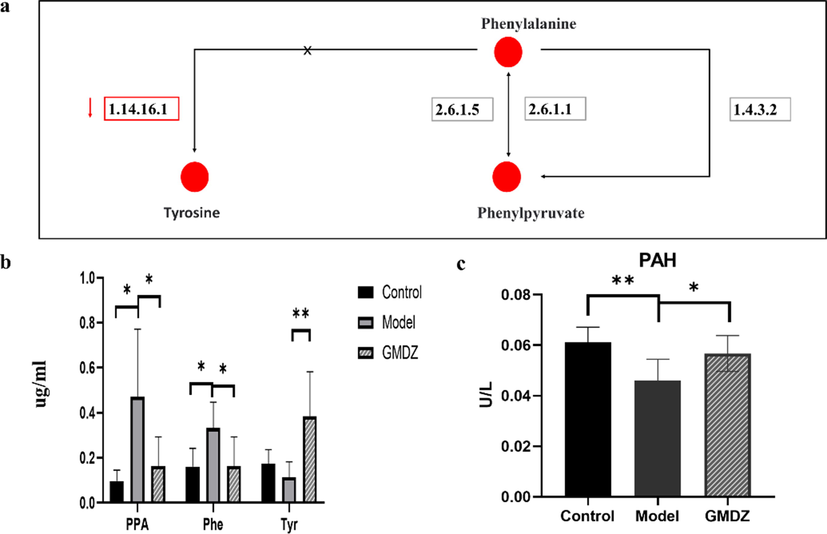
Detection of Phenylalanin Metabolic Changes as Key Pathway in AD (a, phenylalanine metabolic pathway; b, targeted detection of phenylalanine metabolic pathway; c, detection of phenylalanine hydroxylase activity by Elisa).
4 Discussion
Growing evidence suggests altered gut microbiota affects normal physiological balance, contributing to diseases’ pathogenesis like AD. Gut microbiota can communicate with the central nervous system (CNS) by means of the microbiota-gut-brain axis. The communication is mediated by microbial secretions, metabolic interventions, and neural stimulation. Microbiota metabolites can modulate the biosynthesis of neurotransmitters and their associated metabolites, thereby affecting the microbiota-gut-brain axis through neuroendocrine pathways. A recent study found the level of SCFAs are influenced by factors such as the abundance and composition of the microbiota, and the metabolic flux of SCFAs. The dysregulation of gut microbiota is associated with the change of SCFA (Kong et al., 2018; Hoffman, 2019). Furthermore, gut microbiota can regulate the innate immune system (Lathrop, 2011). For example, the persistent reduction of Akkermansia in the gut with aging may lead to thin intestinal mucosa and weakened of the intestinal barrier function, which in turn leads to the translocation of endotoxins and other proinflammatory bacterial products (Bodogai, 2018). In our results, we discovered that the diversity and richness of the gut microbiota in the AD rats were severely damaged, and they were closely related to elevated inflammatory factors (IL-18, TNF), which can be corrected by GMDZ decoction. In addition, we also identified eight GMDZ decoction-responsive bacteria genus by LEfSe analysis, which may be potential targets for the role of GMDZ decoction. Among them, Christensenellaceae is significantly negatively correlated with metabolic diseases such as BMI and inflammation, such as fat deposition, IBD and metabolic syndrome, etc (Nohr, 2013). Jillian L. reported a strong association of Christensenellaceae with low triglyceride levels and elevated high-density lipoprotein (HDL, or “good cholesterol”) levels (Fu, 2015). It has been demonstrated Candidatus_Saccharimonas can reduce TNF production in macrophages, suggesting its potential capacity for immune suppression (Nohr, 2013). In addition, Lachnospiraceae, Phascolarctobacterium, and Collinsella are also closely related to neurological diseases (Dan, 2020; Ding, 2020).
In the researches involving gut-brain interactions, there is growing evidence that microbial metabolites responsible for regulating the physiological state of the brain are important messengers of the gut microbiota. The metabolomics results showed that AD rats had serious metabolic disorders, mainly displayed lipid, amino acid, steroid hormones, bile acid, and energy metabolism disorders.
Altered PL metabolism appears to be multifactorial, including the hyperactivation of phospholipases, increased lysophospholipid synthesis, peroxisomal dysfunction, imbalance of saturated/unsaturated FAs levels in the PL structure, and oxidative stress (Gonzalez-Dominguez et al., 2014). Choline in PC can be utilized by many gut bacteria to convert to free choline, eventually metabolized to trimethylamine (TMA) (Chittim et al., 2019). TMAO, oxidation products of TMA, can induce neuronal aging, increase oxidative stress, damage mitochondrial function and increase the number of aging cells, which is one of the factors to induce AD. Studies have identified the phospholipase D in PC was involved in gut microbiota metabolism, indicating that the gut microbiota is a potential target for phospholipid metabolism. In this study, multiple lipid metabolites in the feces including steroid are affected by gut microbiota.
Wissmann et al. (Wissmann, 2013) reported that higher concentrations of phenylalanine have been observed in AD and are associated with chronic immune activation. The gut microbiota abnormal production of phenylalanine can promote peripheral Th1 cells through blood circulation into the brain. Infiltrated peripheral Th1 cells may interact locally with M1 microglia in the brain, causing pathological neuroinflammation and cognitive impairment (Wang, 2019). Phenylpyruvate can also induce direct and indirect damage to nerve cells. Oxidative stress is involved in the pathophysiology of various metabolic disorder, including PKU, and this role has been attributed to the toxicity generated by the accumulation of phenylalanine and phenylpyruvic acid (Liu, 2021). In addition, phenylalanine is a synthetic precursor of monoamine neurotransmitters, and its abnormal metabolism will lead to metabolic disorders of dopamine and norepinephrine in the brain, resulting in neurological signal transmission disorders and cognitive dysfunction (Fernstrom et al., 2007). The negative correlation between the responsive bacteria of Ganmaidazao decoction and phenylpyruvate indicate the neuroprotective effect of Ganmaidazao decoction through the brain-gut axis. Tryptophan is an essential amino acid that leads to the production of kynurenine. A previous study has showed that higher plasma and serum kynurenine to tryptophan (KYN/TRP) ratios were associated with the risk of incident dementia in AD patients compared with controls (Zhang, 2019). We discovered that the metabolic level of 4,6-Dihydroxyquinoline increased, one of the kynurenine metabolites. However, no changes in tryptophan metabolism were observed. After GMDZ decoction treatment, the 4,6-Dihydroxyquinoline concentration in the feces returned to the level similar to that of the control group, suggesting that GMDZs have a preventive effect on AD by restoring tryptophan imbalance.
Recent studies have shown AD and BA are closely related in clinical and basic research. In AD patients, Marksteiner et al. found that the level of secondary plasma BA, such as lithocholic acid (LCA), was found to be significantly different between AD patients and healthy controls (Marksteiner, 2018). In our study, the primary bile acid level in the feces of AD rats was significantly higher than that in the control group. This may be related to the involvement of bile acids in the inflammatory response of the nervous system and the regulation of energy metabolism (Spichak, 2021). These insights into the pathogenesis of AD may provide a novel therapeutic approach to support anti-neuroinflammatory responses by restoring the intestinal flora.
5 Conclusions
In summary, GMDZ decoction can effectively improve cognitive impairment, Aβ deposition and neuroinflammation in the brain of AD rats by affecting the diversity and abundance of gut microbiota and the metabolism of glycerophospholipids, amino acids, bile acids, steroids, and so on (Fig. 9). Phenylalanine metabolism is a key metabolic pathway worthy of attention, GMDZ Decoction can reduce the abnormal accumulation of phenylalanine and phenylpyruvate and promote their metabolism by restoring phenylalanine hydroxylase activity. This integrated omics technique establishes the brain-gut axis, which plays an important role in understanding the molecular mechanism of GMDZ decoction.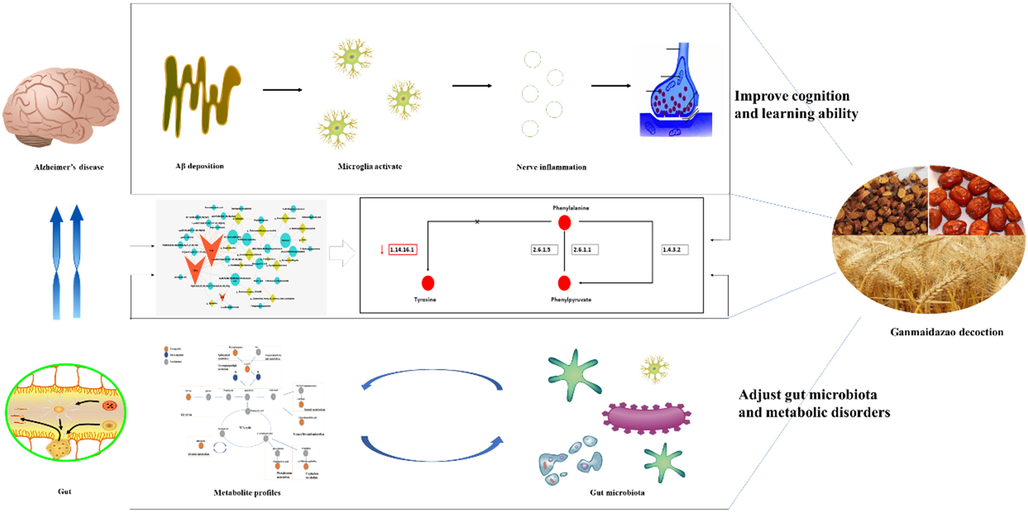
GMDZ decoction alleviates cognitive impairment in AD rats by regulating the gut microbiota and metabolites.
Author Contribution Statement
WB, XX and CMR designed the experiment; CMR, SX, YYM, ZTT, SY, HWQ, WZW, CYF conducted experiments; CMR analyzed the data and completed the manuscript. All authors read and approved the final manuscript.
Statements and Declarations
Ethical approval: All applicable international, national, and/or institutional guidelines for the care and use of animals were followed.
Funding
This work was supported by the National Science Foundation of China (No. 81703519 &No. 81903793), Shenyang city Science and Technology Program (No: 21-108-9-12) and Natural Science Foundation of Liaoning Province (No: 2022-MS-407).
Declaration of interests
Binbin wei reports financial support was provided by the National Science Foundation of China. Binbin wei reports financial support was provided by Shenyang city Science and Technology Program. Binbin wei reports financial support was provided by Natural Science Foundation of Liaoning Province.
References
- Effect of Glycyrrhizic acid on scopolamine-induced cognitive impairment in mice. Int. Neurourol. J.. 2020;24(Suppl 1):S48-S55.
- [Google Scholar]
- Commensal bacteria contribute to insulin resistance in aging by activating innate B1a cells. Sci. Transl. Med.. 2018;10(467)
- [Google Scholar]
- GABA and 5-HT Systems Are Involved in the Anxiolytic Effect of Gan-Mai-Da-Zao Decoction. Front. Neurosci.. 2018;12:1043.
- [Google Scholar]
- Gut bacterial phospholipase Ds support disease-associated metabolism by generating choline. Nat. Microbiol.. 2019;4(1):155-163.
- [Google Scholar]
- Altered gut microbial profile is associated with abnormal metabolism activity of Autism Spectrum Disorder. Gut Microbes. 2020;11(5):1246-1267.
- [Google Scholar]
- Gut microbiota changes in patients with autism spectrum disorders. J. Psychiatr. Res.. 2020;129:149-159.
- [Google Scholar]
- Alzheimer's Disease: A Contextual Link with Nitric Oxide Synthase. Curr. Mol. Med.. 2020;20(7):505-515.
- [Google Scholar]
- Classification and basic pathology of Alzheimer disease. Acta Neuropathol.. 2009;118(1):5-36.
- [Google Scholar]
- Integration of gut microbiota and metabolomics for chinese medicines research: opportunities and challenges. Chin. J. Integr. Med. 2021
- [Google Scholar]
- Fernstrom, J.D., Fernstrom, M.H., 2007. Tyrosine, phenylalanine, and catecholamine synthesis and function in the brain. J. Nutr., 137(6 Suppl 1): p. 1539S-1547S; discussion 1548S.
- The Gut Microbiome Contributes to a Substantial Proportion of the Variation in Blood Lipids. Circ. Res.. 2015;117(9):817-824.
- [Google Scholar]
- Combination of metabolomic and phospholipid-profiling approaches for the study of Alzheimer's disease. J. Proteomics. 2014;104:37-47.
- [Google Scholar]
- Metabolite profiling for the identification of altered metabolic pathways in Alzheimer's disease. J. Pharm. Biomed. Anal.. 2015;107:75-81.
- [Google Scholar]
- Huanglian Jiedu decoction remodels the periphery microenvironment to inhibit Alzheimer's disease progression based on the “brain-gut” axis through multiple integrated omics. Alzheimers Res. Ther.. 2021;13(1):44.
- [Google Scholar]
- Dietary inulin alters the gut microbiome, enhances systemic metabolism and reduces neuroinflammation in an APOE4 mouse model. PLoS One. 2019;14(8):e0221828.
- [Google Scholar]
- Ziziphus jujuba Mill. var. spinosa (Bunge) Hu ex H. F. Chou seed ameliorates insomnia in rats by regulating metabolomics and intestinal flora composition. Front. Pharmacol.. 2021;12:653767
- [Google Scholar]
- Theabrownin from Pu-erh tea attenuates hypercholesterolemia via modulation of gut microbiota and bile acid metabolism. Nat. Commun.. 2019;10(1):4971.
- [Google Scholar]
- Effects of Herbal Medicine (Gan Mai Da Zao Decoction) on Several Types of Neuropsychiatric Disorders in an Animal Model: A Systematic Review: Herbal medicine for animal studies of neuropsychiatric diseases. J. Pharmacopuncture. 2017;20(1):5-9.
- [Google Scholar]
- Gut microbiota influences Alzheimer's disease pathogenesis by regulating acetate in Drosophila model. Future Microbiol.. 2018;13:1117-1128.
- [Google Scholar]
- Peripheral education of the immune system by colonic commensal microbiota. Nature. 2011;478(7368):250-254.
- [Google Scholar]
- Phenylalanine Metabolism Is Dysregulated in Human Hippocampus with Alzheimer's Disease Related Pathological Changes. J. Alzheimers Dis.. 2021;83(2):609-622.
- [Google Scholar]
- Microbiota-Gut-Brain Axis: New Therapeutic Opportunities. Annu. Rev. Pharmacol. Toxicol.. 2020;60:477-502.
- [Google Scholar]
- Determination and Application of Nineteen Monoamines in the Gut Microbiota Targeting Phenylalanine, Tryptophan, and Glutamic Acid Metabolic Pathways. Molecules. 2021;26(5)
- [Google Scholar]
- Bile acid quantification of 20 plasma metabolites identifies lithocholic acid as a putative biomarker in Alzheimer's disease. Metabolomics. 2018;14(1):1.
- [Google Scholar]
- Integrated approach on UPLC-QTOF/MS based active plasma component and metabolomics analysis of Gan Mai Da Zao decoction on the treatment of Alzheimer’s disease in rats plasma and urine. Arab. J. Chem. 2022
- [Google Scholar]
- The contribution of neuroinflammation to amyloid toxicity in Alzheimer's disease. J. Neurochem.. 2016;136(3):457-474.
- [Google Scholar]
- GPR41/FFAR3 and GPR43/FFAR2 as cosensors for short-chain fatty acids in enteroendocrine cells vs FFAR3 in enteric neurons and FFAR2 in enteric leukocytes. Endocrinology. 2013;154(10):3552-3564.
- [Google Scholar]
- Mining microbes for mental health: Determining the role of microbial metabolic pathways in human brain health and disease. Neurosci. Biobehav. Rev.. 2021;125:698-761.
- [Google Scholar]
- Metabolic network failures in Alzheimer's disease: A biochemical road map. Alzheimers Dement.. 2017;13(9):965-984.
- [Google Scholar]
- Molecular insight into the therapeutic promise of flavonoids against Alzheimer's Disease. Molecules. 2020;25(6)
- [Google Scholar]
- Morris water maze: procedures for assessing spatial and related forms of learning and memory. Nat. Protoc.. 2006;1(2):848-858.
- [Google Scholar]
- Sodium oligomannate therapeutically remodels gut microbiota and suppresses gut bacterial amino acids-shaped neuroinflammation to inhibit Alzheimer's disease progression. Cell Res.. 2019;29(10):787-803.
- [Google Scholar]
- Oral berberine improves brain dopa/dopamine levels to ameliorate Parkinson's disease by regulating gut microbiota. Signal Transduct. Target. Ther.. 2021;6(1):77.
- [Google Scholar]
- Role of Glutamate and NMDA Receptors in Alzheimer's Disease. J. Alzheimers Dis.. 2017;57(4):1041-1048.
- [Google Scholar]
- Immune activation in patients with Alzheimer's disease is associated with high serum phenylalanine concentrations. J. Neurol. Sci.. 2013;329(1–2):29-33.
- [Google Scholar]
- Microglia and amyloid precursor protein coordinate control of transient Candida cerebritis with memory deficits. Nat. Commun.. 2019;10(1):58.
- [Google Scholar]
- Insights from animal models on the pathophysiology of hyperphenylalaninemia: role of mitochondrial dysfunction, oxidative stress and inflammation. Mol. Neurobiol.. 2021;58(6):2897-2909.
- [Google Scholar]
- Variations in gut microbiota and fecal metabolic phenotype associated with depression by 16S rRNA gene sequencing and LC/MS-based metabolomics. J. Pharm. Biomed. Anal.. 2017;138:231-239.
- [Google Scholar]
- Altered Gut Microbiota in a Mouse Model of Alzheimer's Disease. J. Alzheimers Dis.. 2017;60(4):1241-1257.
- [Google Scholar]
- UHPLC-QTOF/MS-based metabolomics investigation for the protective mechanism of Danshen in Alzheimer's disease cell model induced by Abeta1-42. Metabolomics. 2019;15(2):13.
- [Google Scholar]
- Yueju-Ganmaidazao Decoction confers rapid antidepressant-like effects and the involvement of suppression of NMDA/NO/cGMP signaling. J. Ethnopharmacol.. 2020;250:112380
- [Google Scholar]
- Xanthoceraside could ameliorate Alzheimer's disease symptoms of rats by affecting the gut microbiota composition and modulating the endogenous metabolite levels. Front. Pharmacol.. 2019;10:1035.
- [Google Scholar]
Appendix A
Supplementary material
Supplementary data to this article can be found online at https://doi.org/10.1016/j.arabjc.2023.104688.
Appendix A
Supplementary material
The following are the Supplementary data to this article:Supplementary data 1
Supplementary data 1


