

Translate this page into:
Based on machine learning model for prediction of CO2 adsorption of synthetic zeolite in two-step solid waste treatment
⁎Corresponding author. tdxjwang@163.com (XiaoJing Wang)
-
Received: ,
Accepted: ,
This article was originally published by Elsevier and was migrated to Scientific Scholar after the change of Publisher.
Peer review under responsibility of King Saud University.
Abstract
The rising environmental issues caused by carbon dioxide emissions and accumulation of industrial solid waste accelerate the development of carbon capture utilization and storage (CCUS), especially the technology using industrial solid waste as a raw material to prepare environmentally friendly and sustainable porous materials to capture CO2. This study developed four models including support vector regression(SVR), multivariate adaptive regression spline(Mars), random forest(RF), and gradient boosting machine(GBM) based on 762 CO2 adsorption datasets of zeolites synthesized from five different industrial solid waste materials to predict the CO2 adsorption capacity and analyze impact of various factors on CO2 adsorption performance during synthesis and adsorption processes. The results suggested that gradient boosting machine(GBM) and the support vector regression(SVR) have good accuracy and generalization performance. The R2 of the model reached 0.99 and 0.96 respectively, which is in good agreement with the laboratory data. In general, the specific surface area(S) and adsorption pressure(P) during the adsorption process of zeolite have a great influence on the final adsorption performance. The correlation between the specific surface area(S) and the hydrothermal reaction temperature(T2) is the largest, and its Pearson Correlation Coefficient is 0.61. This study paved a new approach for the accumulation treatment of industrial solid waste and low-carbon industry via statistical analysis and machine learning method, which is beneficial to environmental protection and sustainable development.
Keywords
Zeolite synthesis
Machine learning
CO2 adsorption performance prediction
Alkali fusion
Hydrothermal method

1 Introduction
Global warming caused by the emission of greenhouse gasses is one of the major environmental problems facing the world today, and its main cause is human activity, especially the burning of fossil fuels(Rahman et al., 2017, Letcher, 2019). The Intergovernmental Panel on Climate Change (IPCC)(Vinoba et al., 2017) mentioned in a report that CO2 levels in the atmosphere will increase to 450 ppm by 2035, resulting in a global temperature increase of 2℃. This will lead to serious environmental problems such as severe heat waves, droughts, melting glaciers, and sea level rise, posing a threat to human health, global species, and global ecological security(Chu et al., 2017, Yoro and Daramola, 2020). Based on this situation, the Carbon Capture Utilization and Storage (CCUS) technology was launched(Cozier, 2019, Zhang, 2020, Luo et al., 2023). Carbon Capture Storage (CCS) and Carbon Capture Utilization and Storage (CCUS) are currently recognized in many countries as effective methods to reduce carbon dioxide gas, which can reduce up to 20 % of CO2 emissions. The CCUS method focuses on capturing and storing CO2 emitted from power plants, cement plants, oil refineries, and steel mills in porous materials and eventually reusing it to achieve the goal of reducing carbon dioxide emissions. The most critical aspect of carbon dioxide capture and collection technology is to produce materials that are low cost, low energy consuming, and have good carbon dioxide capture and selection performance(Zhou et al., 2019, Abd et al., 2021). At present, materials for adsorption of carbon dioxide include activated carbon(Mukherjee et al., 2019), metal oxides(Gopalan et al., 2022), zeolites(Aniruddha and Sreedhar, 2021), metal–organic frameworks (MOFs)(ALOthman and Shahid, 2022), etc. Among them, zeolite plays an irreplaceable role in CO2 adsorption and separation, as it is inexpensive, easy to produce, and provides good adsorption performance even at high temperatures.
The industrial accumulation of solid waste such as fly ash, bauxite waste, and lithium slag causes environmental pollution and even affects human health. Their effective disposal methods are also a worldwide problem(Wu et al., 2019, Ren et al., 2021, Gao et al., 2022, Miao et al., 2022). Due to the high content of silica and alumina in these solid wastes, zeolites can be produced from these solid wastes by a relatively cheap and fast conversion process. Asifa Iqbal et al.(Iqbal et al., 2019) used fly ash as raw material for the synthesis of 4A zeolite in pure phase. The results showed that the induction time helps to catalyze the formation of primary and secondary gels during the synthesis process, which controls the formation of a single phase with high crystallinity and small crystallite size. The synthetic zeolite was also compared with commercial 4A zeolite and it was confirmed that the synthetic zeolite has only one crystalline phase with small crystallite size and 82 % crystallinity, which is higher than 75 % of commercial zeolite. Binyu Wang et al.(Wang et al., 2022) proposed a method for mild activation of lithium slag to synthesize highly crystalline A-type zeolite with good selectivity for the radioactive isotope 90Sr in aqueous solution. The results showed that the static water absorption capacity of the zeolite was higher than the national standard for commercial A-type zeolite in China, and the removal rate of Sr2+ in water is greater than 99 %. In addition, many scientists have focused on the CO2 adsorption performance of zeolites that use solid waste as a raw material. Zhiqin Qiang et al.(Qiang et al., 2019) successfully synthesized X zeolite by simple hydrothermal treatment using bauxite waste as raw material and investigated the CO2 adsorption capacity of the zeolite. The maximum CO2 adsorption capacity of the X zeolite is 6.4 mmol/g in the pressure range of 0 ∼ 101.325 KPa and at 298 K, which is 1.64 times that of the synthetic feldspar zeolite. Cui Quan et al.(Quan et al., 2022) prepared molecular sieve MCM-41 and amine-modified MCM-41 from coal gangue for the separation of carbon dioxide. The results showed that both pH and calcination temperature affected adsorption performance. Amine modification improved the CO2 binding capacity of MCM-41. The above methods of producing zeolite with adsorption value from solid waste as raw materials all show that synthetic zeolite has good CO2 adsorption performance and also effectively solves the problem of solid waste accumulation and disposal.
Machine learning (ML), a byproduct of the interdisciplinary fields of statistics and computer science, is often used to automatically learn, identify, and improve the regularities in a given data set to create a black box model that can accurately represent the operation of the original model(Moges et al., 2022, Yin et al., 2022, Huang et al., 2023). Therefore, machine learning models are also frequently used in the study of the properties of zeolites. Liberty L. Mguni et al.(Mguni et al., 2022) used multiple linear regression (MLR) and random forest (RF) to investigate the adsorption desulfurization performance of zeolites for hydrocarbon fuels using literature data. This work demonstrates the effectiveness of machine learning and literature data as low-cost substitutes for experiments. Seyed Mehdi Seyed Alizadeh et al.(Alizadeh et al., 2022) used an artificial neural network to predict the hydrogen absorption capacity of 28 zeolites. The research results showed that the regression factor of the experimental data predicted by the neural network model was 0.99. Mojtaba Raji et al.(Raji et al., 2022) used different machine learning training algorithms to predict the CO2 adsorption performance of different types of zeolites. The results showed that the established machine learning model is more conducive to the design and analysis of the adsorption process.
Although machine learning models are mature in predicting zeolite performance, there are relatively few studies on zeolite CO2 adsorption performance based on machine learning models(Wanyonyi et al., 2021, Alizadeh et al., 2022, Ducamp and Coudert, 2022, Mguni et al., 2022). In particular, the effects of zeolite fusion conditions, Hydrothermal conditions and adsorption conditions on the amount of carbon dioxide adsorbed were not adequately considered. Therefore, this study investigates the CO2 adsorption capacity of zeolites prepared by a two-step process (Alkali Fusion and Hydrothermal) using various solid wastes as raw materials, and trains various machine learning models based on literature data. Finally, the model with high precision and strong generalization performance was built to explain the factors affecting CO2 adsorption capacity during the zeolite synthesis process and adsorption process. This opens a new path for industrial waste treatment and low-carbon industry, and provides a theoretical basis for waste resource utilization conducive to environmental protection and sustainable development. Fig. 1 shows the general process flow of this study.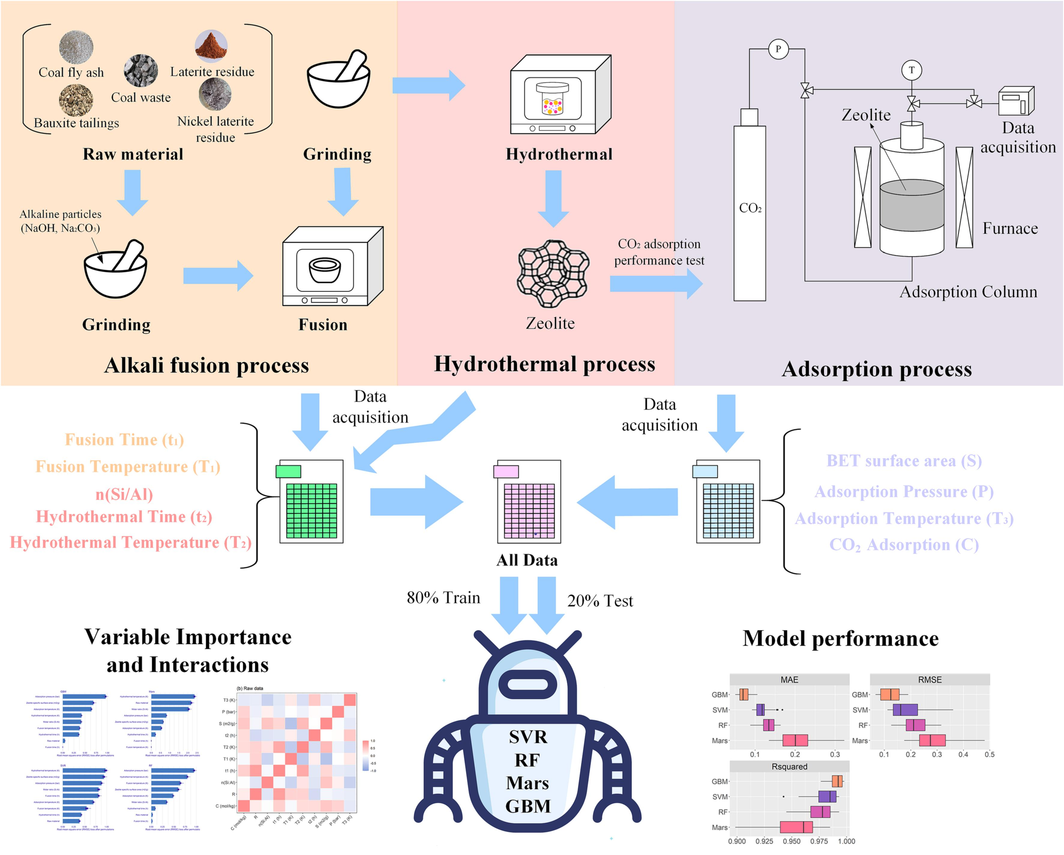
Flow chart of this study.
2 Method
2.1 Data acquisition
In this study, five different solid wastes (Coal fly ash, Bauxite tailings, Coal waste, Laterite residue and Bauxite, Nickel laterite residue) were selected as raw materials, and zeolites were synthesized by two-step of alkali fusion and hydrothermal processes. The types of zeolites synthesized were NaA, 4A, FAU, LTA, X-Type (NaX, Ca-NaX), P-Type, and A-X- Type. It should be noted that the synthesis of zeolite by alkali fusion / hydrothermal method is a complex phenomenon, which involves many variables affecting the adsorption performance of zeolite for carbon dioxide adsorption. For the preparation process of zeolite, the different oxide content of the selected raw materials, the alkali source content in the alkali fusion process, the temperature and time of alkali fusion, the temperature and time of hydrothermal, the aging time and different cationic modification will indirectly cause differences in the formation of zeolites, and these differences will ultimately affect the adsorption performance of carbon dioxide by zeolite. In addition, the structural of the zeolite, such as the specific surface area of the zeolite, the outer surface, the average micropore and mesopore diameter of the micropore, will directly determine the amount of carbon dioxide adsorbed by the zeolite. The main objective of this study is to investigate the effects of some parameters in alkali fusion process, hydrothermal process and adsorption process on the carbon dioxide adsorption performance of zeolites. And because of the independence of different literature data, it is impossible to comprehensively consider all the influencing factors.
Therefore in this study, the types of raw materials, synthesis conditions, adsorption conditions and carbon dioxide adsorption performance of zeolite were used as research data. A total of 762 sets of data points were extracted from 11 literature(Lee and Jo, 2010, Liu et al., 2011, Du et al., 2014, Liu et al., 2014, Zgureva, 2016, Jung et al., 2018, Qiang et al., 2019, Qiang et al., 2019, de Aquino et al., 2020, Verrecchia et al., 2020, Boycheva et al., 2021). As shown in Table 1 for details. The conditions for two-step zeolite synthesis, and conditions for CO2 adsorption are used as inputs to the model, and conditions for zeolite synthesis are divided into conditions for alkali fusion and hydrothermal conditions. Alkali fusion conditions include raw material (R), fusion time (t1), fusion temperature (T1), and silicon-aluminum molar ratio n(Si:Al) in the synthetic precursor. Hydrothermal conditions include hydrothermal time (t2) and hydrothermal temperature (T2). Adsorption conditions include the specific surface area of synthetic zeolite (S), the adsorption pressure (P), and the adsorption temperature (T3). The output of the model indicates the amount of adsorbed carbon dioxide (C). Most literature gives the elemental content in the raw material, but not directly the molar ratio of silicon-aluminum in the precursor n(Si:Al), so the data in the literature must be converted. To obtain a highly accurate and verified model, all data are randomly divided into a training set (80 % of the data) and a test set (20 % of the data). The data in the training set is used to train and build the machine learning model, and the data in the test set is used to verify the generalization performance of the model. It should be noted that the training set and test set in this research are obtained from the same paper. Hence, the real predictive performance of the learning models may be overoptimized since there are no intrinsic generalizations of models from different data sets. More different data sets from the various research projects can be combined together to provide more robust analysis in the future research.
Alkali fusion conditions
Hydrothermal conditions
Adsorption conditions
CO2 Adsorption (C, mol/Kg)
Numbers of data
Raw material (R)
Time (t1, h)
Temperature (T1, K)
n(Si:Al)
Time (t2, h)
Temperature (T2, K)
BET surface area (S, m2/g)
Pressure (P, bar)
Temperature (T3, K)
Coal fly ash
1
433–1023
0.88–3.63
2–24
353–373
30–498
0.0034–1.12
273–673
0.020–4.972
515
Bauxite tailings
2
773.15
2.83
16
383.15
571, 736
0.05–1.01
273–303
0.977–7.023
100
Coal waste
2
1123.15
1.76
3
363.15
28.67
0.0021–1.0072
298
0.690–3.294
49
Laterite residue and Bauxite
2
873.15
2.82
6
373.15
486
0.0057–0.94
273, 303
0.530–3.998
57
Nickel laterite residue
2
823.15
1.76
8
373.15
31
0.050–0.96
273, 298
1.719––3.462
41
2.2 Model description
In this study, four different machine learning models were used to predict CO2 adsorption performance of two-step synthetic zeolites, and the optimized fitting results were used to guide the green recycling pathway of zeolites synthesized from various solid wastes to obtain high CO2 adsorption performance in a green and cost-effective manner. Support Vector Regression (SVR), Multivariate Adaptive Regression Spline (Mars), Random Forest (RF), and Gradient Boosting Machine (GBM) are all created by the CARET in R, which is a collection of more than 25 other packages. This package can automatically split and preprocess the model and optimize it by resampling and cross-validation methods, which helps to diagnose overfitting and make the fitting result more accurate and reliable. Fig. 2 shows the schematic diagram of the four principles of machine learning, and the principles and methods of each machine learning are described in detail below.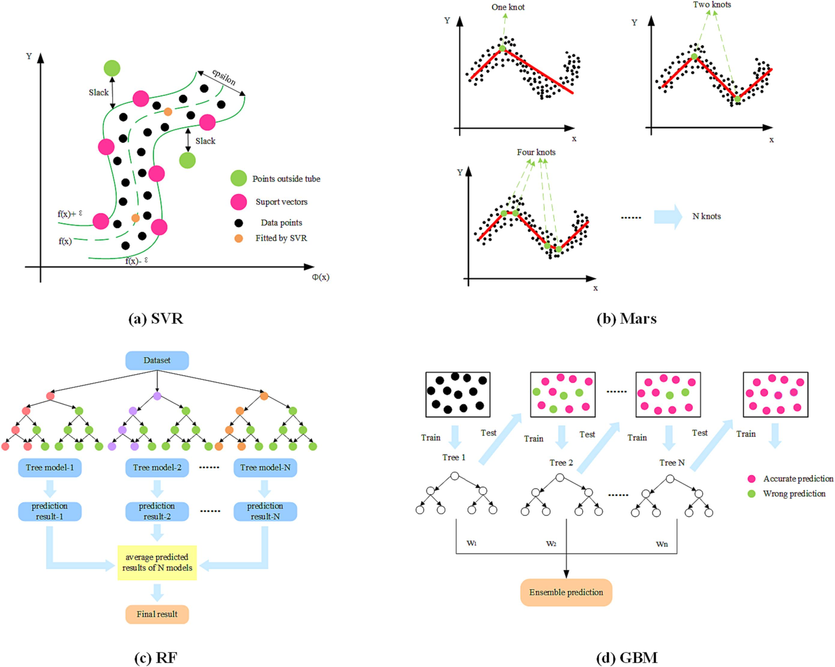
Graphical schematic of four machine learning models (()).
adapted from Kriner, 2007, Lahiri and Ghanta, 2008, Zhang et al., 2021, Huo et al., 2022
2.2.1 Support vector regression model
The Support Vector Machines (SVM) are one of the most popular supervised learning-based machine learning models. Their basic principle is to find the hyperplane that forms the largest interval in the feature space to discriminate between different types of data sets(Cortes and Vapnik, 1995). Therefore, this model was originally used to solve two-class classification problems(Suthaharan, 2016, Sunitha and Raju, 2021). For the regression problem, support vector regression (SVR) is used which is based on the support vector machine principle. The schematic diagram of the algorithm is shown in Fig. 2 (a). By continuously optimizing the hyperparameter combinations, it is acceptable to find a large number of points that are matched in the SVR and the remaining points as close as possible to within a certain error range (epsilon band in the figure), which is within a certain distance from the true value. Moreover, the introduction of various kernel functions φ(x, y) maps the low-dimensional sample space to the high-dimensional space, making it linearly separable to handle nonlinear regression problems. Therefore, different kernel functions may have a certain impact on the prediction performance of the final model(Ma et al., 2015). The current mainstream kernel functions are linear kernel, Gaussian kernel, radial basis kernel, etc. The choice of the hyperparameters on the SVR are explained in section 2.3.1.
2.2.2 Multivariate adaptive regression splines model
The multivariate adaptive regression spline (Mars) is a data analysis method proposed by American statistician Jerome Friedman in 1991(Friedman, 1991). The method uses the tensor product of the spline function as the basis function and is divided into three steps: Forward process, backward pruning process and model selection. The basic principle of the algorithm is shown in Fig. 2(b). The data is segmented by adaptively selecting nodes, and two new linear basis functions are generated by selecting each node. When the forward process is complete, N + 1 linear basis functions are used to generate an overfitting model. Under the premise of ensuring the accuracy of the model, the basis functions that contribute little to the model in the overfitting model are deleted backward. Finally, an optimal model is selected as the regression model. The choice of the hyperparameters on Mars are explained in section 2.3.1.
2.2.3 Random forest model
The random forest (RF) is an integrated model based on the Bagging algorithm and consists of basic units of decision trees. The so-called integrated model is used to obtain a learner with better generalization performance. By training several individual learners and combining certain combination strategies, the single learner model with poor performance eventually becomes a strong learner model(Cutler et al., 2012, González et al., 2015). The basic principle of the random forest model is shown in Fig. 2(c). The RF model randomly samples the original dataset to form N different sample datasets, and then builds N different decision tree models based on these datasets. Finally, the final result is obtained based on the average of these decision tree models (for the regression model) or the voting situation (for the classification model), and the final random forest model is output based on the evaluation results. The choice of the hyperparameters on RF are explained in section 2.3.1.
2.2.4 Gradient boosting machine model
Gradient Boosting Machine (GBM) is another type of integrated learning that differs from Random Forest. Although both models consist of basic decision trees, the GBM is based on the boosting algorithm(Ayyadevara, 2018, Konstantinov and Utkin, 2021). Its main principle is shown in Fig. 2(d). It consists of building a collection of shallow and weak continuous trees sequentially, where each tree learns and improves the previous tree and continuously adds new models to the collection. Thus, at each specific iteration, a new weak-base learner model is trained based on the errors of the entire ensemble learned so far. This continuously increases the accuracy of the model, which is usually difficult to beat by other algorithms. The choice of the hyperparameters on GBM are explained in section 2.3.1.
2.3 Model construction and performance evaluation
2.3.1 Model training and testing
In this study, four machine learning models were built and the hyperparameters were adjusted to optimize the model accuracy and improve the generalization ability of the model. Hyperparameter grid search in the package of CARET(Kuhn et al., 2021) randomly matches the selected hyperparameter combinations, determines different hyperparameter combinations, and trains machine learning models of different hyperparameter combination schemes that help find reasonable values for tuning parameters. At the same time, triple independent 10-fold cross-validation was used as a resampling scheme to avoid final overfitting of the model. Minimize the error between the predicted value and the experimental value with such a method. Table 2 contains all hyperparameters considered by the four machine learning models and their meaning.
Model
Dependent packages in caret
Parameters
Implication
SVR
kernlab
kernel
Kernel function of SVR
Cost
Regularisation parameter
Sigma
Bandwidth of kernel function
RF
randomForest
mtry
Number of variables to randomly sample as candidates at each split
ntrees
Number of decision trees
Mars
earth
degree
Maximum degree of interaction
nprune
Number of terms to retain
GBM
gbm, plyr
interaction depth
Maximum nodes per tree
shrinkage
Learning Rate
ntrees
Number of decision trees
2.3.2 Model performance evaluation
For the performance evaluation of four regression prediction model, the following three indexes are mainly investigated: root mean squared error (RMSE), mean absolute error (MAE), coefficient of determination (R2). The RMSE and MAE are indicators for evaluating model errors. The smaller the value is, the stronger the prediction accuracy of the model. On the contrary, the R2 represents the proximity between the predicted value of the model and the measured value, and the closer the value is to 1, the higher the prediction accuracy of the model. The calculation formulas for these three indicators are as follows.
Where, YTure,i, YModel,i, and denote the ith sample’s experimental value, the ith sample’s predicted value and the average value of all experimental values; N indicates the total number of samples.
3 Results and discussion
3.1 Accuracy and optimization of machine learning models
3.1.1 Optimization of support vector machines
Fig. 3 compares the predictive performance of support vector regression models with three different kernels, including the Gaussian kernel function, the linear kernel function, and the radial basis function. The SVR of these three kernels all uses tuneLength = 5 to train the model. What needs to be explained is that the meaning of tuneLength is different for the different machine learning models. For SVR, tuneLength = 5, which means you try 5 different sigma and cost values to train the model. From Section 2.3.2, the smaller MAE and RMSE values denote the better models, while the higher R2 means the better models. Therefore, the SVR model whose kernel is a radial basis kernel function has the best predictive performance among the three kernels, and the value of R2 reaches 0.97. The SVR models with linear kernels and Gaussian functions do not perform well. The MAE value of the SVR model of the radial basis kernel function is 0.26, while the MAE value of the Gaussian kernel function is about 1.7 times that of the radial basis kernel function. The MAE of the linear kernel function is about 1.5 times that of the radial basis function. Compared to the radial basis function model, the RMSE of the linear kernel function and the Gaussian kernel function are 1.6 times, respectively. From the above, it can be seen that the radial basis kernel function has better accuracy than the others. At this point, the optimal value of Cost and Sigma obtained by the random search are 4 and 0.16, respectively.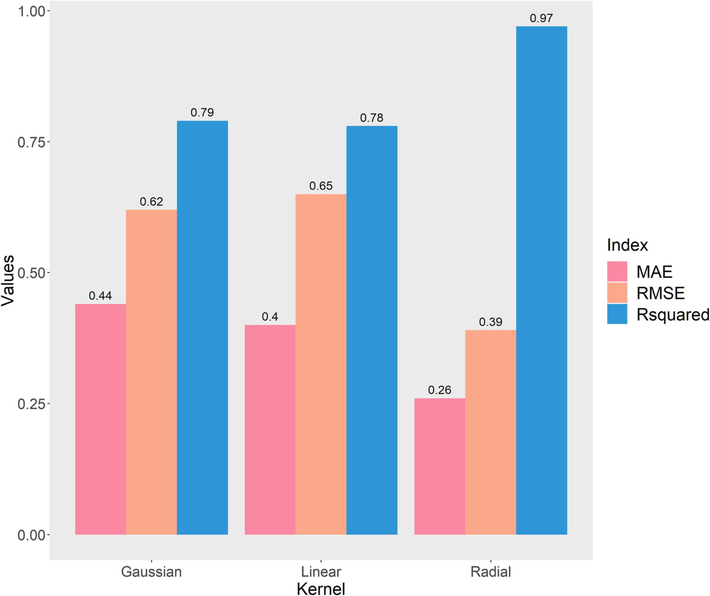
Accuracy of SVR for different kernel functions.
To further investigate and verify the influence of the value of Cost and Sigma on the accuracy of the SVR model with radial basis kernel function, the performance indicators of the SVR model under 35 sets of different Cost and Sigma value hyperparameter combinations are evaluated in Fig. 4. The meanings of the Cost and Sigma are given in Table 2. The values of Cost control the trade-off between achieving a low error on the training data and minimizing the norm of the weights. As the Cost value continues to increase, it means that the tolerance range of the model is gradually expanding and the accuracy of the model is improving, but it is also prone to overfitting. It can be seen from the figure that the accuracy of the model improves significantly as the value of Cost increases from 1 to 100. As the value of Cost continues to increase, the improvement in the model performance index becomes gradually apartment. The sigma serves as another hyperparameter defining the range of influence of a single training example. For the R2 index in the SVR model, when Sigma is 0.05, the performance indicators of the model are smaller than when Sigma is 0.1. This is because the SVR model boundary at low values of Sigma is essentially based on the point closest to the boundary, ignoring the more distant points that do not exactly fit all the data, and the model boundary will be smoother. When the Sigma is greater than 0.1, the performance index of the model does not improve significantly, and the larger Sigma may lead to over-fitting of the model. The optimal combination of hyperparameters for the SVR model is shown in Table 3.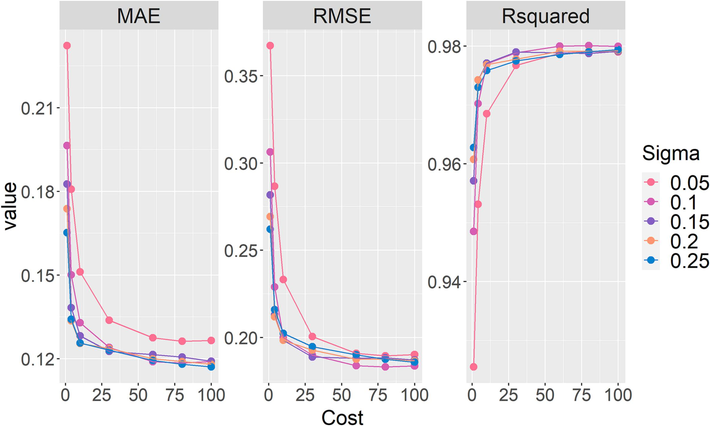
Optimization of Sigma and Cost to accuracy of radial basis function based SVR.
Model
Combination of hyperparameters
Time (s)
RMSE
RSquared
MAE
SVR
Kernel function: radial basis
Sigma = 0.1
Cost = 8010.11
0.18
0.98
0.12
Mars
degree = 2
nprune = 308.49
0.29
0.95
0.20
RF
mtry = 8
ntrees = 5014.78
0.22
0.97
0.13
GBM
shringkage = 0.15
ntrees = 400
interaction depth = 99.58
0.12
0.99
0.073
3.1.2 Optimization of multivariate adaptive regression splines model
Fig. 5 shows the optimization of the accuracy considering the combination of the two hyperparameters degree and nprune. The parameter degree specifies the maximum degree of interaction, while the parameter nprune specifies the number of terms to be preserved in the final model. The degree parameter is set to 1 by default, which means that the interaction term is not considered when creating the MARS model. Although the generalizability of the model can be tested by selecting more interaction elements, an upper limit should be set on the degree of interaction. A lower degree of interaction can not only save the time needed to run the model, but also help explain the final model(Friedman et al., 2001). It can be seen from the figure that the overall generalization of the model is poor when the interaction element is not considered, and R2 can only reach about 0.8. When the value of degree is 2, the R2 increases by about 18 %, but as the degree increases, the more interaction elements are considered, the less the accuracy of the model improves. In addition, the performance of the model is also significantly improved by increasing the value of nprune. When the degree is 2 and nprune is 20, the R2 can reach the highest value of 0.954, and the RMSE and MAE are 0.29 and 0.20, respectively. When nprune continues to increase from 20, the performance of the model will not change. The optimal combination of hyperparameters for the Mars model is shown in Table 3.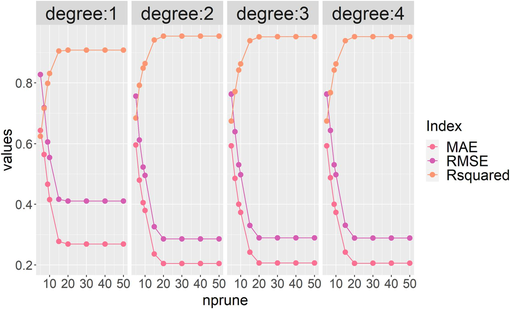
Optimization of nprune and degree to accuracy of Mars.
3.1.3 Optimization of random forest model
Fig. 6 shows the optimization of the RF model by the two hyperparameters ntrees and mtry. The mtry represents the number of variables to randomly sample as candidates at each split. When the value of mtry is larger, it means that the decision tree is more likely to select important features that are related to the outcome variables of most splits. The ntrees represent the number of trees. When the value of mtry increases from 2 to 6, the R2 increases significantly. If mtry continues to increase, the accuracy of the model does not change significantly. Increasing the number of trees in the RF model within the first 20 will better fit the model's performance, but further increasing the number of trees from 20 will not significantly change the model's performance. The optimal combination of hyperparameters for the RF model is shown in Table 3.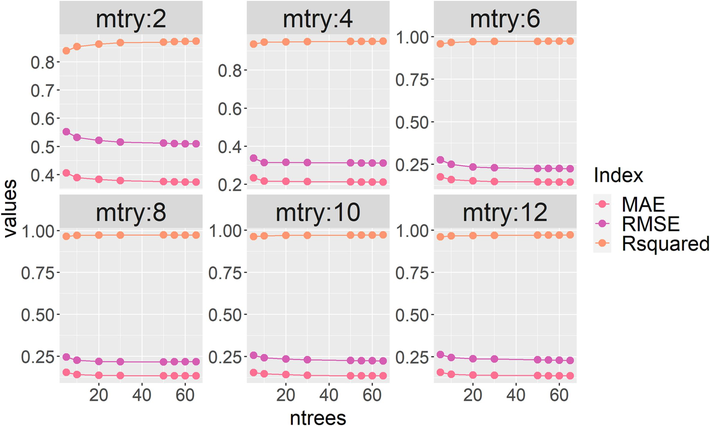
Optimization of ntrees and mtry to accuracy of RF.
3.1.4 Optimization of gradient boosting machine model
Fig. 7 shows the optimization of the GBM Model accuracy for the three hyperparameters shrinkage, ntrees, and interaction depth. As can be seen from Table 2, ntrees is the number of decision trees representing the basic unit of GBM. In Fig. 7, the accuracy of the model is greatly improved when the number of trees increases to 200, and when the number of trees exceeds 200, it has little effect on the accuracy of the model. The shrinkage is considered as a learning rate in the GBM model, which is used for reducing, or shrinking, the impact of each additionally fitted base-learner (decision tree). It reduces the size of incremental steps and thus penalizes the importance of each consecutive iteration. From Fig. 7, it can be seen that with a shrinkage of 0.35, the number of trees required to achieve stability is less than 0.05. Moreover, the interaction depth is the maximum number of nodes in each tree. When the interaction depth is 1, the accuracy of model is the poorest and R2 is only 0.90–0.95. When shrinkage is 0.05, the accuracy increases significantly with increasing number of trees and increasing interaction depth. The optimal combination of hyperparameters for the GBM model is shown in Table 3.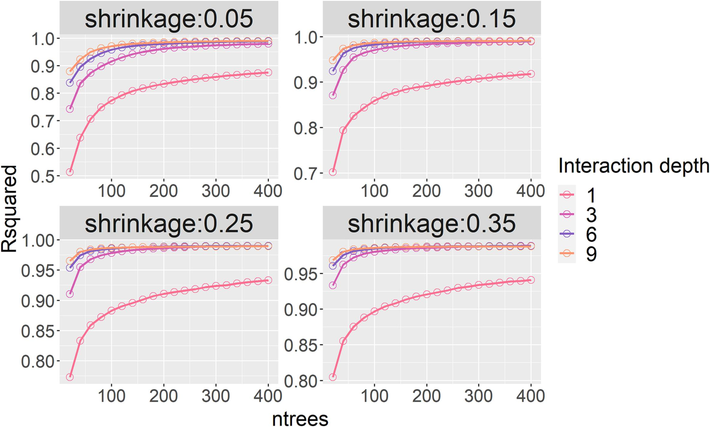
Optimization of three hyperparameters to accuracy of GBM.
3.1.5 Comparison of accuracy and predictive performance of different machine learning models
Table 3 shows the best accuracy obtained by four optimal hyperparameter combinations of machine learning models, and Fig. 8 presents the comparison of the accuracy of the different machine learning models. Table 3 shows that the GBM model has the highest R2 of 0.99 for the following combination of hyperparameters: shrinkage = 0.15, ntrees = 400, and interaction depth = 9. In addition, the time cost of the GBM model is about 35 % lower than that of the RF model. The SVR model is second only to the GBM model, and its R2 can also reach 0.98. Of the four machine learning models, the Mars model has the lowest accuracy. When the hyperparameter combination is: degree = 2, nprune = 30, its R2 is only 0.95, and RMSE and MAE are 0.29 and 0.20, respectively. But the Mars model is the most time efficient and cost effective of the four models.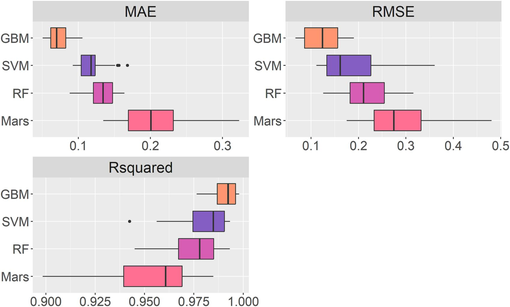
Comparison of accuracy of different machine learning models.
Fig. 9 is a comparison of the generalization performance of four machine learning models that predict data with experimental data. It can be seen from the figure that most of the data points generated by the GBM model and the SVR model lie on the 45°diagonal. Except for the Mars model and the RF model, the data points generated by other models are very near the center line and essentially situated within a 15 % error region. The generalization ability of the GBM model is also the best among the four machine learning models. The value of R2 can reach up to 0.96 but differs from the performance of the model in the training dataset, which shows that the GBM model has overfitting. The generalization performance of the SVR model is second only to the GBM model and the value of R2 is 0.95. The generalization performance of the Mars and RF models is poor and their R2 is only 0.91. The prediction results are essentially similar to the accuracy results of the model presented in the previous Section 3.1.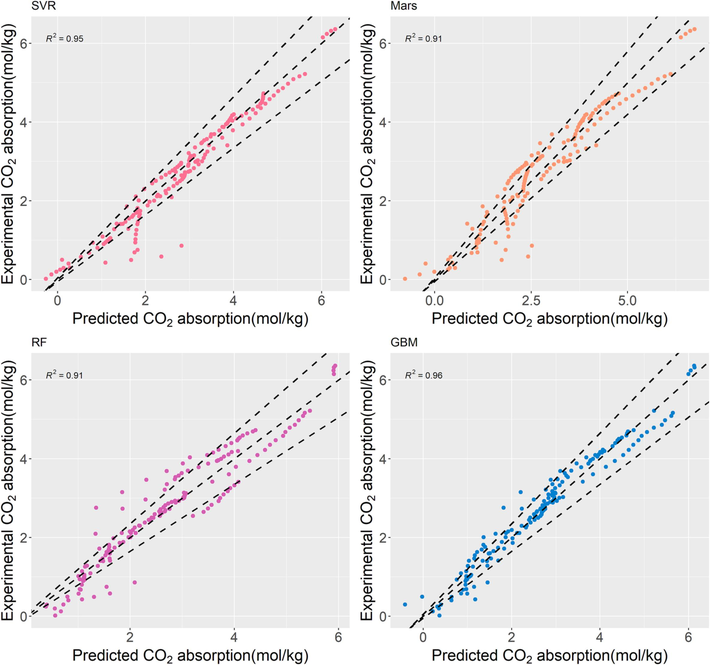
Comparison of predictive performance of different machine learning models.
Therefore, the SVR model and the GBM model both have good accuracy and generalization performance, which can not only predict well the CO2 adsorption performance of zeolites synthesized from different solid wastes but also overcome some deficiencies of traditional adsorption isotherm models (e.g., Langmuir model). This is because the machine learning model cannot be constrained by various factors such as the type of raw material and adsorption conditions, and the model can be built directly from actual experimental data without considering some implicit assumptions in traditional models(Meng et al., 2019, Zhu et al., 2020). Thus, the machine learning model constructed in this study is applied to the research of CO2 adsorption performance of synthetic zeolites for different solid waste, reducing time-consuming and expensive performance testing, which is conducive to the realization of economic and efficient clean production and environmental sustainability.
3.2 Sensitivity analysis of variables affecting CO2 absorption
3.2.1 Variable importance analysis
Fig. 10 illustrates the results of a global sensitivity analysis of nine variables from the four machine learning models using permutation techniques. Fig. 11 shows nine input parameters divided into three types of variables. These include the alkali fusion conditions and hydrothermal conditions during synthesis, and the adsorption conditions during adsorption experiments. The nine variables are divided into three types, alkali fusion conditions: raw material (R), alkali fusion temperature (T1), and alkali fusion time (t1); hydrothermal conditions: hydrothermal temperature (T2), silicon aluminum molar ratio of the synthetic precursor n(Si:Al), and hydrothermal time (t2); adsorption conditions: adsorption pressure (P), adsorption temperature (T3), zeolite specific surface area (S). From Fig. 10, it can be seen that the results of the variable importance analysis of these four machine learning models are all different, and it is difficult to explain exactly which variable is closest to the experimental situation and has the greatest influence on the CO2 adsorption performance of zeolite. Some variable importance tools usually do not take into account the fact that many predictive models can fit the data almost equally well, leading to the Rashomon effect in statistics(Fisher et al., 2019, Del Giudice and Marco, 2021). Furthermore, Fig. 11 shows that the adsorption conditions have the greatest influence on the CO2 adsorption performance of zeolite, followed by the hydrothermal conditions in the four machine learning models. This is because the zeolites specific surface area (S) is a very important parameter for CO2 adsorption. These rough and irregular surfaces result from the pore filling of large cations or the partial fusion of cationic compounds during hydrothermal treatment. For many microporous structures, it should be noted that the adsorption capacity depends on the impregnated cations rather than the structure of the adsorbent and that these cations will dominate the adsorption force between the gas molecules and the solid adsorbent through bilateral interactions(Pirngruber et al., 2010, Zukal et al., 2010). At the same time, according to Le Chatelier's principle(Pourhakkak et al., 2021), the adsorption temperature and adsorption pressure change the adsorption performance of zeolite adsorbent with the change of temperature and pressure, so the adsorption amount changes with the change of adsorption temperature and pressure.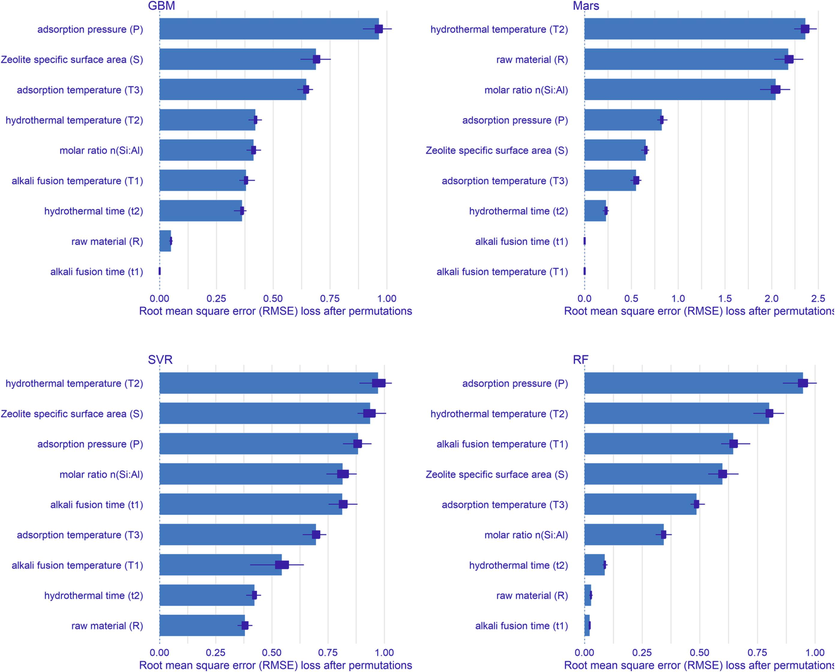
Ranking the importance of different machine learning models on the CO2 adsorption performance variables of two-step synthesized zeolites.
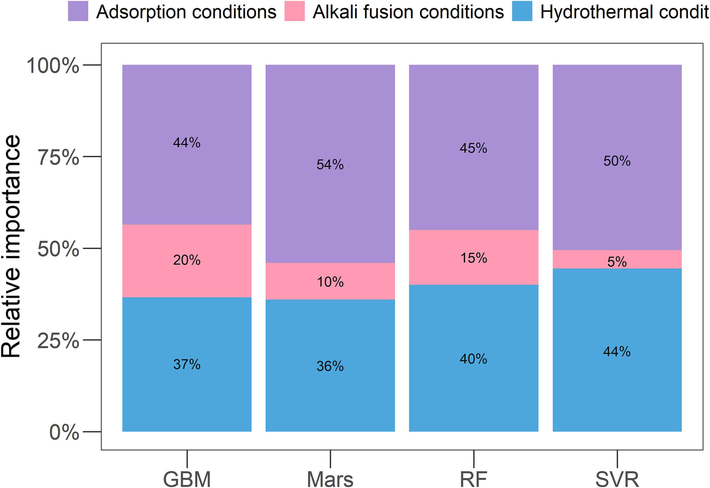
The relative importance of three types of input variables in different machine learning models.
Fig. 12 shows the values of Shapley in four machine learning models using the local sensitivity analysis method. This value is the average value calculated for the order of arrangement of ten different variables, shown in red and green, respectively, representing negative mean and positive means. The figure also summarizes the distribution of the contribution of each explanatory variable in different rankings represented by purple boxplots. From Fig. 12, it can be concluded that hydrothermal conditions are also one of the important determining factors affecting CO2 adsorption in the four machine learning models. It is worth noting that the type of raw material is not the factor that determines the adsorption performance, and that the silicon-aluminum molar ratio n(Si:Al) in the precursor may have a greater influence on the adsorption performance of zeolite. This also shows that regardless of the kind of the industrial solid waste, as long as the reaction precursor is rich in silicon aluminum content, the different silicon aluminum content in the hydrothermal will affect the pH and silicon aluminum framework structure of the synthesized zeolite, thus influencing the adsorption performance and selectivity of polar molecules. In addition, the hydrothermal temperature (T2) is also a very important parameter for determining the structure of zeolites, leading to high solubility of reactants and high values of crystallization rate constants, which cause rapid crystallization to form large crystals(Kotova et al., 2016, Tauanov et al., 2018). At the same time, the activity of water, which serves as a solvent in zeolite synthesis, increases sharply with temperature and promotes the formation of zeolites.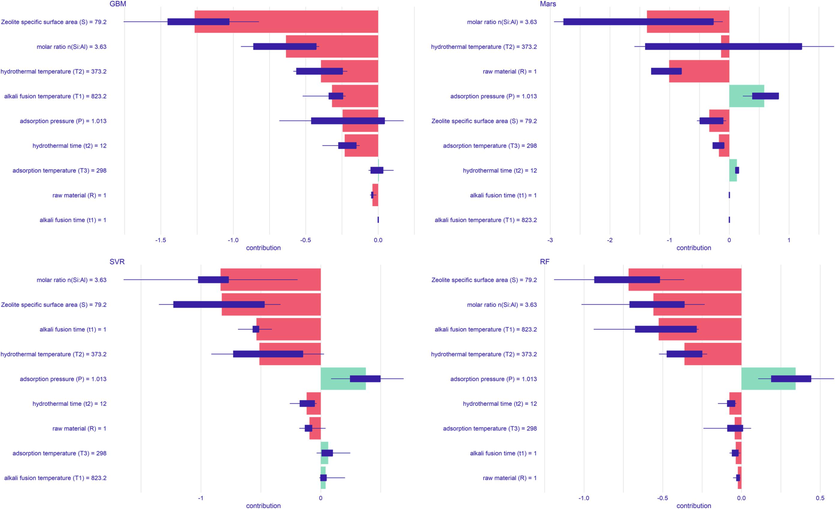
Shapley values in four machine learning models.
3.2.2 Effects of variables correlations and interactions
The GBM and SVR models with better model accuracy and generalization ability were selected to analyze the correlations between variables in this study. Fig. 13 shows that the results of the interaction of the GBM and SVR model variables are similar compared to the raw dataset. From the previous section, it is clear that the factor that strongly influences CO2 adsorption performance is zeolite specific surface area (S). Whether it is alkali fusion conditions or hydrothermal conditions, it has some influence on the specific surface area of the zeolite after crystallization. Among them, the zeolite specific surface area (S) shows a strong positive correlation with the hydrothermal temperature (T2) and is 0.61 and 0.47 for GBM and SVR, respectively, with an error of only 1.6 % and 21.6 % compared to the raw data. The hydrothermal temperature affects the hydrothermal reaction rate during zeolite synthesis, which in turn affects the autogenous pressure in the reactor and changes the zeolite crystallization products. If the hydrothermal temperature is not high enough, this will result in a low specific surface area for zeolite formation, and the rate of formation of the various crystals and the aspect ratio of the crystals will also be affected by the temperature(Bortolatto et al., 2017, Tauanov et al., 2018, Khajeh Amiri et al., 2019). Therefore, at a suitable hydrothermal temperature and hydrothermal time, zeolite crystals with relatively uniform particle size can be obtained, which affects the specific surface area of the zeolite. In addition, zeolite specific surface area (S) and fusion temperature (T1) showed a strong negative correlation, which was −0.55 and −0.45 for GBM and SVR, respectively, with errors of 8.3 % and 25 %. This is because within a certain range, too high a melting temperature of the alkalis destroys the surface structure of the zeolite, resulting in a smaller specific surface area. Fig. 13 also shows that the silicon-aluminum molar ratio n(Si:Al) and the fusion time (t1) also have a strong positive correlation with the zeolite specific surface area. The higher the n(Si:Al), the larger the zeolite specific surface area of framework finally formed, and the acidity gradually increases(Chaves et al., 2015). Fig. 14 shows the comparison of break-down plot with variables interaction of the GBM and SVR models to determine the effect of the interaction between different variables on the adsorption performance of zeolite for carbon dioxide. The interaction between each variable is included as a single bar in the figure. Since the influence of each variable cannot be disentangled, the graph uses just that single bar to represent the contribution of each variable. It can be seen from the Fig. 14 (a) that compared with the average model prediction, the specific surface area of 79.2 reduces the performance of zeolite for carbon dioxide, and the adsorption performance is further reduced at a silicon-aluminum ratio of 3.63. However, since the adsorption temperature is 298, this increases the adsorption performance of the zeolite.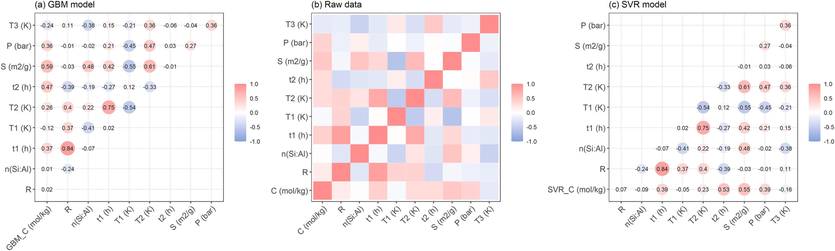
Comparison of variable correlation heatmap.
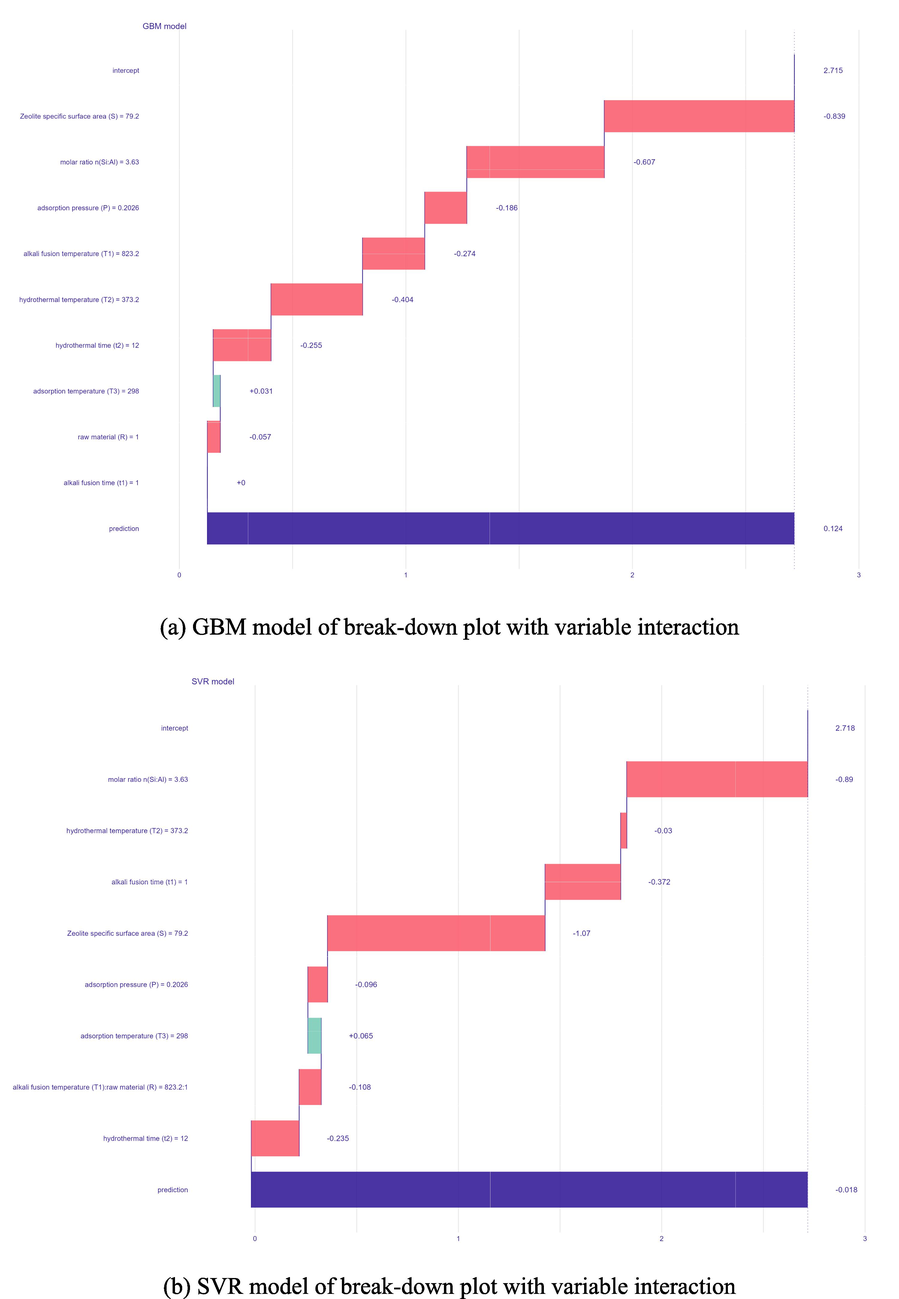
Comparison of break-down plot with variable interaction.
In both the global and local sensitivity analyses, alkali fusion conditions were found to be the weakest variable affecting zeolite adsorption performance. In the GBM model with the best generalization performance, the importance of alkali fusion time (t1) is also at the bottom. However, a large number of publications indicate that the step of alkali fusion can decompose the Silicon and aluminum rich crystalline phases and form soluble aluminates and silicates, making them highly reactive and promoting the formation of zeolites(Ayele et al., 2016, Jin et al., 2021, Lin and Chen, 2021). This is most likely due to the fact that the machine learning model is limited by the original data sources of 11 literature. The limited amount of data under alkali fusion conditions caused the model to learn incorrectly, so the final result did not match the actual situation. In addition, Fig. 13 shows an unusually strong correlation between the alkali fusion time (t1) and the type of raw material (R), again due to the small amount of data on alkali fusion conditions for each raw material in the data set. Therefore, this requires a larger amount of experimental data. In the future, the influence of alkali fusion conditions on the adsorption performance of zeolite will be further researched and evaluated to provide guidance for the cleaner process of industrial solid waste and reduce the experimental time and cost.
4 Conclusions
In this study, a dataset containing 762 experimental designs of two-step (alkali fusion and hydrothermal) synthesis zeolite for CO2 adsorption was conducted from the published literatures. Four ML models, Support Vector Regression Model (SVR), Multivariate Adaptive Regression Splines Model (Mars), Random Forest Model (RF), Gradient Boosting Machine Model (GBM), were used to predict the adsorption performance of zeolite for CO2. Based on the global and local sensitivity analysis methods, the types of input parameters with the most significant effect on the adsorption performance of zeolite were identified. Finally, through Pearson correlation coefficient to reveal the potential mutual influence of alkali fusion conditions, hydrothermal conditions and adsorption conditions on the CO2 adsorption capacity of zeolite. The following conclusions were obtained:
(1) The GBM and SVR have the best model accuracy in the four machine learning models, and the R2 reached 0.99 and 0.98 respectively. At this time, the combination of hyperparameters in the GBM model is: shrinkage = 0.15, ntrees = 400, and interaction depth = 9.
(2) The GBM and SVR also have the best generalization performance in the four machine learning models, and the R2 reached 0.96 and 0.95 respectively. However, the generalization performance of Mars and RF is poor, and the R2 is only 0.91.
(3) Based on the global and local sensitivity analysis, the importance ranking of each variable in the four machine learning models is different due to the influence of the Rashomon effect in statistics. However, it is not difficult to see that the zeolite specific surface area (S) in the adsorption conditions has the greatest impact on the zeolite CO2 adsorption performance, followed by the silicon-aluminum molar ratio n(Si:Al) of the precursor and the hydrothermal temperature in the hydrothermal conditions.
(4) Hydrothermal conditions and alkali fusion conditions both affect the zeolite specific surface area (S), but due to the lack of data on alkali fusion conditions, the learning of the ML model is somewhat misleading. The influence of alkali fusion conditions on other input features and impact on zeolite CO2 adsorption performance differ from experimental results and theoretical understanding, and further research is needed in the future.
CRediT authorship contribution statement
Haibin Wu: Methodology, Investigation, Writing – original draft. XiaoJing Wang: Methodology, Conceptualization, Supervision. Xin Wang: Formal analysis, Supervision. Wei Su: Data curation, Supervision.
Acknowledgements
This research was financially supported by the National Key Research and Development Program-China(2017YFE0127200). The authors would like to thank Tianjin University for its computational resources.
Declaration of competing interest
The authors declare that they have no known competing financial interests or personal relationships that could have appeared to influence the work reported in this paper.
References
- A review on application of activated carbons for carbon dioxide capture: present performance, preparation, and surface modification for further improvement. Environ. Sci. Pollut. Res.. 2021;28:43329-43364.
- [Google Scholar]
- Predicting the hydrogen uptake ability of a wide range of zeolites utilizing supervised machine learning methods. Int. J. Hydrogen Energy. 2022;47:21782-21793.
- [Google Scholar]
- ALOthman, Z. A. and M. Shahid, 2022. Recent advances in removal of toxic elements from water using MOFs: A critical review. Arabian Journal of Chemistry. 104319.
- Process optimization for enhanced carbon capture and cyclic stability using adsorbents derived from coal fly ash. Environ. Sci. Pollut. Res.. 2021;30:8393-8402.
- [Google Scholar]
- Conventional versus alkali fusion synthesis of zeolite A from low grade kaolin. Appl. Clay Sci.. 2016;132:485-490.
- [Google Scholar]
- Ayyadevara, V. K., 2018. Gradient boosting machine. Pro machine learning algorithms. Berlin, Springer: 117-134.
- Synthesis and characterization of Y zeolites from alternative silicon and aluminium sources. Micropor. Mesopor. Mater.. 2017;248:214-221.
- [Google Scholar]
- Comparative studies of carbon capture onto coal fly ash zeolites Na-X and Na–Ca-X. Chemosphere. 2021;271:129505
- [Google Scholar]
- As-synthesized TEA-BEA zeolite: Effect of Si/Al ratio on the Knoevenagel condensation. Micropor. Mesopor. Mater.. 2015;202:198-207.
- [Google Scholar]
- Recent developments in carbon capture utilisation and storage. Greenh. Gases: Sci. Technol.. 2019;9:613-616.
- [Google Scholar]
- Cutler, A., D. R. Cutler and J. R. Stevens, 2012. Random forests. Ensemble machine learning, Springer: 157-175.
- CO2 adsorption capacity of zeolites synthesized from coal fly ashes. Fuel. 2020;276:118143
- [Google Scholar]
- Preparation of zeolite NaA for CO2 capture from nickel laterite residue. Int. J. Miner. Metall. Mater.. 2014;21:820-825.
- [Google Scholar]
- Prediction of thermal properties of zeolites through machine learning. J. Phys. Chem. C. 2022;126:1651-1660.
- [Google Scholar]
- All models are wrong, but many are useful: Learning a variable's importance by studying an entire class of prediction models simultaneously. J. Mach. Learn. Res.. 2019;20:1-81.
- [Google Scholar]
- The elements of statistical learning. New York: Springer; 2001.
- The use of contaminated soil and lithium slag for the production of sustainable lightweight aggregate. J. Clean. Prod.. 2022;348:131361
- [Google Scholar]
- Del Giudice and Marco. 2021. The prediction-explanation fallacy: a pervasive problem in scientific applications of machine learning. PsyArXiv, Accessed 13 Dec. 2021, from http://10.31234/osf.io/4vq8f.
- González, C., J. Mira‐McWilliams and I. Juárez, 2015. Important variable assessment and electricity price forecasting based on regression tree models: Classification and regression trees, Bagging and Random Forests. IET Generation, Transmission Distribution. 9, 1120-1128.
- Insight into metal-impregnated biomass based activated carbon for enhanced carbon dioxide adsorption: A review. J. Indus. Eng. Chem.. 2022;113:72-95.
- [Google Scholar]
- Universal machine-learning algorithm for predicting adsorption performance of organic molecules based on limited data set: Importance of feature description. Sci. Total Environ.. 2023;859:160228
- [Google Scholar]
- Development of machine learning models for the prediction of the compressive strength of calcium-based geopolymers. J. Clean. Prod.. 2022;380:135159
- [Google Scholar]
- Synthesis and characterization of pure phase zeolite 4A from coal fly ash. J. Clean. Prod.. 2019;219:258-267.
- [Google Scholar]
- Synthesis and characterization of low-cost zeolite NaA from coal gangue by hydrothermal method. Adv. Powder Technol.. 2021;32:791-801.
- [Google Scholar]
- Manufacture of synthesis zeolite using coal waste and study of analysis for adsorption performance. Clean Technol.. 2018;24:21-26.
- [Google Scholar]
- Experimental, Kinetics and Isotherm Modeling of Carbon Dioxide Adsorption with 13X Zeolite in a fixed bed column. Iran. J. Chem. Eng.. 2019;16:54-64.
- [Google Scholar]
- Interpretable machine learning with an ensemble of gradient boosting machines. Knowl.-Based Syst.. 2021;222:106993
- [Google Scholar]
- Hydrothermal synthesis of zeolites from coal fly ash. Adv. Appl. Ceram.. 2016;115:152-157.
- [Google Scholar]
- Survival analysis with multivariate adaptive regression splines. Loyola Marymount University; 2007.
- Kuhn, M., J. Wing, S. Weston, et al., 2021. R caret: Classification and Regression Training. https://CRAN.R-project.org/package=caret, accessed 05-08-2021.
- The support vector regression with the parameter tuning assisted by a differential evolution technique: Study of the critical velocity of a slurry flow in a pipeline. Chem. Indus. Chem. Eng. Quarter.. 2008;14:191-203.
- [Google Scholar]
- Synthesis of zeolite from waste fly ash for adsorption of CO2. J. Mater. Cycles Waste Manage.. 2010;12:212-219.
- [Google Scholar]
- Letcher, T. M., 2019. Why do we have global warming? Managing global warming, Elsevier: 3-15.
- Resourcization and valorization of waste incineration fly ash for the synthesis of zeolite and applications. J. Environ. Chem. Eng.. 2021;9:106549
- [Google Scholar]
- Zeolite synthesis from waste fly ash and its application in CO2 capture from flue gas streams. Adsorption. 2011;17:795-800.
- [Google Scholar]
- Using one waste to tackle another: Preparation of a CO2 capture material zeolite X from laterite residue and bauxite. J. Hazard. Mater.. 2014;278:551-558.
- [Google Scholar]
- In-situ release and sequestration of CO2 in cement composites using LTA zeolites. Sci. Total Environ.. 2023;872:162133
- [Google Scholar]
- Ma, X., Y. Zhang and Y. Wang, 2015. Performance evaluation of kernel functions based on grid search for support vector regression. 2015 IEEE 7th international conference on cybernetics and intelligent systems (CIS) and IEEE conference on robotics, automation and mechatronics (RAM), IEEE.
- Adsorption characteristics of supercritical CO2/CH4 on different types of coal and a machine learning approach. Chem. Eng. J.. 2019;368:847-864.
- [Google Scholar]
- Insight into adsorptive desulfurization by zeolites: A machine learning exploration. Energy Fuels. 2022;36:4427-4438.
- [Google Scholar]
- Solving two industrial waste issues simultaneously: Coal gasification fine slag-based hierarchical porous composite with enhanced CO2 adsorption performance. Sci. Total Environ.. 2022;821:153347
- [Google Scholar]
- Development and comparative analysis of ANN and SVR-based models with conventional regression models for predicting spray drift. Environ. Sci. Pollut. Res.. 2022;30:21927-21944.
- [Google Scholar]
- Review of post-combustion carbon dioxide capture technologies using activated carbon. J. Environ. Sci.. 2019;83:46-63.
- [Google Scholar]
- The role of the extra-framework cations in the adsorption of CO2 on faujasite Y. PCCP. 2010;12:13534-13546.
- [Google Scholar]
- Fundamentals of adsorption technology. Interf. Sci. Technol. Elsevier. 2021;33:1-70.
- [Google Scholar]
- Zeolite X adsorbent with high stability synthesized from bauxite tailings for cyclic adsorption of CO2. Energy Fuels. 2019;33:6641-6649.
- [Google Scholar]
- A simple hydrothermal synthesis of zeolite X from bauxite tailings for highly efficient adsorbing CO2 at room temperature. Micropor. Mesopor. Mater.. 2019;287:77-84.
- [Google Scholar]
- Amine-modified silica zeolite from coal gangue for CO2 capture. Fuel. 2022;322:124184
- [Google Scholar]
- Pollution to solution: Capture and sequestration of carbon dioxide (CO2) and its utilization as a renewable energy source for a sustainable future. Renew. Sustain. Energy Rev.. 2017;71:112-126.
- [Google Scholar]
- Novel prosperous computational estimations for greenhouse gas adsorptive control by zeolites using machine learning methods. J. Environ. Manage.. 2022;307:114478
- [Google Scholar]
- Eco-friendly geopolymer prepared from solid wastes: A critical review. Chemosphere. 2021;267:128900
- [Google Scholar]
- Multi-class classification for large datasets with optimized SVM by non-linear kernel function. J. Phys.: Conf. Ser. IOP Publishing 2021
- [Google Scholar]
- Suthaharan, S., 2016. Support vector machine. Machine learning models and algorithms for big data classification. Berlin, Springer: 207-235.
- Hydrothermal synthesis of zeolite production from coal fly ash: A heuristic approach and its optimization for system identification of conversion. J. Clean. Prod.. 2018;182:616-623.
- [Google Scholar]
- Study of the parameters of zeolites synthesis from coal fly ash in order to optimize their CO2 adsorption. Fuel. 2020;276:118041
- [Google Scholar]
- Recent progress of fillers in mixed matrix membranes for CO2 separation: A review. Separ. Purif. Technol.. 2017;188:431-450.
- [Google Scholar]
- Facile activation of lithium slag for the hydrothermal synthesis of zeolite A with commercial quality and high removal efficiency for the isotope of radioactive 90Sr. Inorg. Chem. Front.. 2022;9:468-477.
- [Google Scholar]
- Role of pore chemistry and topology in the heavy metal sorption by zeolites: From molecular simulation to machine learning. Comput. Mater. Sci. 2021;195:110519
- [Google Scholar]
- Experimental study of the effects of stacking modes on the spontaneous combustion of coal gangue. Process Saf. Environ. Protect.. 2019;123:39-47.
- [Google Scholar]
- Machine learning method for simulation of adsorption separation: comparisons of model’s performance in predicting equilibrium concentrations. Arab. J. Chem.. 2022;15:103612
- [Google Scholar]
- Yoro, K. O. and M. O. Daramola, 2020. CO2 emission sources, greenhouse gases, and the global warming effect. Advances in carbon capture, Elsevier: 3-28.
- Carbon dioxide adsorption studies on fly ash zeolites. Coal Combust. Gasif. Prod.. 2016;8:54-59.
- [Google Scholar]
- Zhang, T., W. Lin, A. M. Vogelmann, et al., 2021. Improving convection trigger functions in deep convective parameterization schemes using machine learning. Journal of Advances in Modeling Earth Systems. 13, e2020MS002365.
- Zhang, Z., 2020. Energy and environment issues in carbon capture, utilization and storage. Energy Sources, Part A: Recovery, Utilization, Environmental Effects. 1-4.
- Adsorptive separation of carbon dioxide: from conventional porous materials to metal–organic frameworks. EnergyChem.. 2019;1:100016
- [Google Scholar]
- Machine learning exploration of the critical factors for CO2 adsorption capacity on porous carbon materials at different pressures. J. Clean. Prod.. 2020;273:122915
- [Google Scholar]
- Experimental and theoretical determination of adsorption heats of CO2 over alkali metal exchanged ferrierites with different Si/Al ratio. PCCP. 2010;12:6413-6422.
- [Google Scholar]


