

Translate this page into:
Study on thermal conversion and detoxification mechanism of fluorine during co-combustion of meager coal and spent cathode carbon block
⁎Corresponding author at: No.17923 Jingshi Road, Lixia District, Jinan, Shandong Province 250061, China. hkh@sdu.edu.cn (Kuihua Han)
-
Received: ,
Accepted: ,
This article was originally published by Elsevier and was migrated to Scientific Scholar after the change of Publisher.
Abstract
Fluoride is a toxic and harmful ingredient in the spent cathode carbon blocks (SCCB). Gaseous fluoride pollution is a significant potential pollution source in the process of boiler collaborative disposal of SCCB. In this paper, meager coal and SCCB were used as fuel, the mixing ratio and temperature were variables, the law of thermal conversion of fluorine during the co-combustion process was studied, and the properties of ash residue were discussed. At the same time, CaO was added to the furnace to reveal the influence of temperature on the effect of fluorine fixation in the furnace. The results showed that combustion was the most suitable method for removing soluble fluorine from SCCB, and the thermal conversion rate of soluble fluorine was up to 99.68–99.98%. The higher the combustion temperature, the higher the conversion of gaseous fluoride, and the worse the effect of fluorine fixation in the furnace. It is not suitable for fluorine fixation in the furnace when the furnace temperature exceeded 1100 ℃. The higher the mixing ratio of SCCB, the higher the production of gaseous fluoride, and a proper mixing ratio is vital for co-combustion. Ash residue after mixing 10% SCCB combustion belongs to general industrial solid waste. This study has important theoretical significance for determining the applicable furnace type, the appropriate mixing ratio and effective fluoride treatment measures in the co-combustion process of coal and SCCB.
Keywords
Meager coal
Spent cathode carbon block
Co-combustion
Thermal conversion of fluorine
Fluorine fixation

1 Introduction
Spent carbon cathode blocks (SCCB) are produced during the electrolytic production of primary aluminum by molten salt of alumina and has been identified as hazardous waste due to its adsorption of a large amount of soluble fluoride and a small amount of cyanide (Silveira et al., 2002). Fluoride and cyanide in SCCB are easy to dissolve or hydrolyze when exposed to water or steam, which causes serious environmental pollution to soil and water, leading to a large number of plant deaths or mutations (Chandra et al., 2005, Andrade-Vieira et al., 2018). The toxic gases (HF and HCN) produced at the same time will cause health hazards to humans. In China, the main way to deal with SCCB is through landfill. Since June 1, 2020, the landfill disposal of SCCB is carried out in accordance with the “Standard for pollution control on the hazardous waste landfill” (GB18598-2019), which sets out stricter technical requirements for the site, access standards, landfill wastewater, operation and monitoring of landfills. The construction and maintenance cost of the SCCB landfill is high while causing waste of land resources and the risk of secondary pollution. How to make harmless disposal or resource utilization of SCCB has become a prominent problem urgently to be solved in the electrolytic aluminum industry.
In recent decades, the recycling of SCCB has been reported both domestically and internationally. A variety of recovery methods have been proposed to realize the utilization of carbon or fluoride resources from SCCB. For example, leaching and flotation are used to recover fluorine (Yuan et al., 2018, Robshaw et al., 2019). However, these methods have disadvantages such as long processes, strict equipment requirements, strong corrosion, and production of a large amount of fluorine-containing wastewater, which is easy to cause secondary pollution and increases the treatment cost. At the same time, the waste residue still contains soluble fluoride, which needs to be treated by the fire method. It is a good method for the disposal of SCCB in cement kilns (Ghenai et al., 2019, Brial et al., 2021). However, cement plants and electrolytic aluminum plants are often located in different cities, which greatly limits the use of SCCB. In addition, the contents of Na and F in SCCB are high. Adding SCCB may affect the quality of cement, which is also the reason why the cement plant is unwilling to dispose of SCCB. The reduction method (Flores et al., 2019, Li et al., 2022), which replaces fluorite as a reducing agent in the steel industry, is an effective method of utilization. But it cannot completely solve this problem due to the restrictions of region and consumption. Commonly used treatment methods for SCCB are displayed in Table 1. Among them, the co-combustion method has the advantages of simple operation, low cost and heat recovery compared with other methods. Simultaneously, the resource utilization of solid waste is realized.
Methods
Advantage
Disadvantage
Ref.
Chemical leaching
Carbon and fluorine resource recovery
Severe equipment corrosion and wastewater generation
(Yang et al., 2022)
Ultrasonic assisted oxidation leaching
Fast leaching speed and high leaching rate
Severe equipment corrosion, wastewater generation, and high cost
(Liu et al., 2022)
Flotation
Joint recovery of carbon and fluorine
Complex process and high cost
(Qin et al., 2023)
High temperature roasting
Mature technology and simple process
Equipment corrosion and low processing capacity
(Hui et al., 2023)
Co-combustion
Simple operation, heat recovery, thorough treatment
Immature technology
(Zhang et al., 2023a)
The carbon content in SCCB is up to 40-70 % with a high calorific value, and has the potential to replace coal and other fossil energy as fuel. Electricity is the main energy of aluminum electrolysis, and many large coal-fired power plants are distributed around the electrolytic aluminum plants in China. If the co-combustion of coal and spent cathode carbon block can be processed through the power plant boiler, the problem can be solved fundamentally, coal can be saved and the utilization value of waste resources can be improved. Miksa D. et al. (Mika et al., 2003) conducted high-temperature heating treatment on SCCB and found that cyanide was completely decomposed at 188 ℃, and fluoride was reduced from 7.16 % to 0.07 % at 1200 ℃ for 1 h, showing obvious removal effect. The possibility of mixing SCCB with coal as fuel was also discussed, but relevant tests were not carried out. Zhang et al. studied the combustion characteristics of co-combustion of coal and SCCB by the thermogravimetric analyzer, and found that adding an appropriate amount of SCCBs was conducive to combustion (Zhang et al., 2021). The slagging characteristics of co-combustion of coal and SCCB with different mixing ratios were studied (Zhang et al., 2023b), and concluded that with the increase of mixing ratio, ash melting point decreased and sintering tendency increased. When the mixing ratio of SCCB was 5 %, the slagging property was the worst and the viscosity-temperature property was the best. The influence of CaO on ash melting point and viscosity-temperature characteristics was also discussed. In addition, CaO is commonly utilized to capture fluorine in industry, which can facilitate the conversion of fluorine. Li et al. proposed in situ capture of fluorine with CaO in a fluidized bed reactor to improve defluoridation roasting efficiency (Li et al., 2019a). Li et al. observed that fluoride reacted with CaO to form insoluble fluorite (CaF2), leading to a significant decrease in fluoride leaching concentration (Li et al., 2023). Chen et al. studied the co-combustion of pulverized coal and SCCB, and reached similar conclusions (Sun et al., 2019, Chen et al., 2021). Sun et al. studied the combustion and kinetic characteristics of SCCB under different atmospheres (Sun et al., 2019, Chen et al., 2021). All these studies reveal the feasibility of the co-combustion of coal and SCCB. SCCB contains a large amount of fluorine in the form of NaF, CaF2, Na3AlF6, etc. After mixing with coal, the content of fluorine in the mixed fuel will increase greatly with the increase of SCCB mixing amount. Due to the different forms of fluorine occurrence, whether the rule of fluorine emission changes is worthy of further study, but no relevant reports have been seen so far.
In this paper, a high-temperature tube furnace was used to conduct combustion experiments on the co-combustion process of meager coal and SCCB to study the effects of mixing ratio, temperature and additives on the thermal conversion of fluorine. The law of thermal conversion of fluorine and the effect of fluorine fixation in a furnace during co-combustion were revealed, and the properties of ash and slag were discussed. After the high-temperature combustion experiment, the ash residue of some mixed samples was characterized, and the phase composition of the ash residue was analyzed by XRD. The morphology of ash was observed by SEM, and the distribution and content of elements were measured by EDS. From the microscopic point of view, it further reveals the thermal transformation behavior of fluorine and provides the theoretical basis for the inhibition of slagging.
2 Experimental
2.1 Preparation of experimental samples
Meager coal from Taiyuan of Shanxi Province and typical SCCB from Shandong Weiqiao Aluminum Electric Co., Ltd. with a tank age of 5 years were selected as the research objects. Proximate and ultimate analyses of meager coal and SCCB are listed in Table 2 and Table 3. Proximate and ultimate analyses refer to Chinese standards (GB/T212-2008 and GB/T476-2008). The main components of meager coal are carbon, kaolinite (Al2Si2O5(OH)4), calcite (CaCO3), boehmite (AlO(OH)) and quartz (SiO2), as shown in Fig. 1(a). As depicted in Fig. 1(b), SCCB is composed of carbon, sodium fluoride (NaF), cryolite (Na3AlF6), fluorite (CaF2), and refractory (NaAl11O17). After crushing, drying (110 ℃, 4 h), grinding and screening, the samples of meager coal and SCCB were selected as experimental samples, and then the samples of meager coal and SCCB were respectively weighed by electronic analysis balance. The SCCBs were mixed according to the ratio of 0 %, 3 %, 5 % and 10 % of the total mass of the mixed sample. The mixed sample was put into an agate mortar for shock, thoroughly mixed for 30 min, and then left for 30 min to ensure the sample was evenly mixed. Pack the prepared sample into an airtight bag and place it in a glass dryer for use. The prepared mixed sample was named SCCB-X (X representing the proportion of SCCB and 1-X representing the proportion of meager coal).
Samples
Proximate analysis, ad (wt. %)
High heating value, MJ/kg
M
V
FC
A
Meager coal
1.02
15.76
55.26
27.96
24.10
SCCB
0.66
3.39
50.47
45.48
16.73
Samples
Ultimate analysis, ad (wt. %)
C
H
N
O
S
F
Meager coal
57.40
2.76
0.93
2.16
1.66
0.11
SCCB
42.84
0.27
0.35
8.41
0.18
10.98
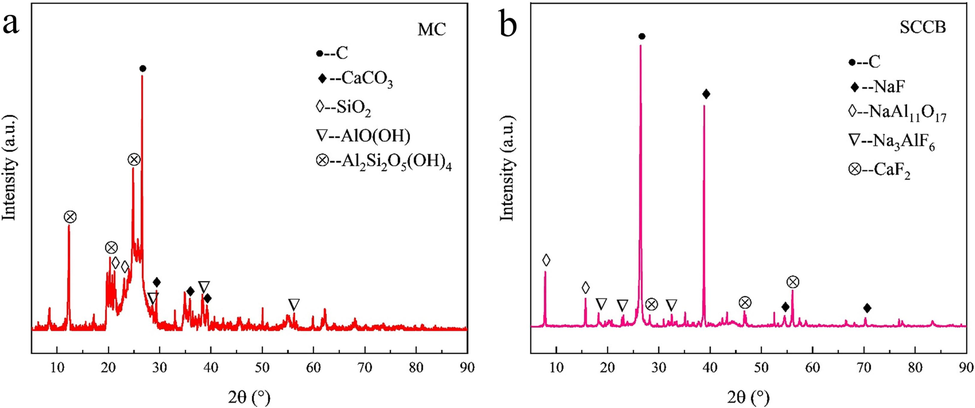
XRD spectrum of meager coal and SCCB. (a) MC, (b) SCCB.
2.2 Static test system of high-temperature tubular furnace
Fig. 2 shows the schematic diagram of the static experimental device of a high-temperature tubular furnace. As shown in Fig. 2, the device is composed of an air compressor, high-temperature tube furnace, flue gas analyzer, flue gas absorption bottle and flowmeter. The furnace tube of a high-temperature tube furnace is a high-temperature resistant quartz tube (90 mm × 3 mm), the tube length is 900 mm, and the constant temperature zone length is 200 mm, which is used to simulate the furnace device in the reaction process. Both ends are sealed by the flange through the reaction gas and exhaust gas.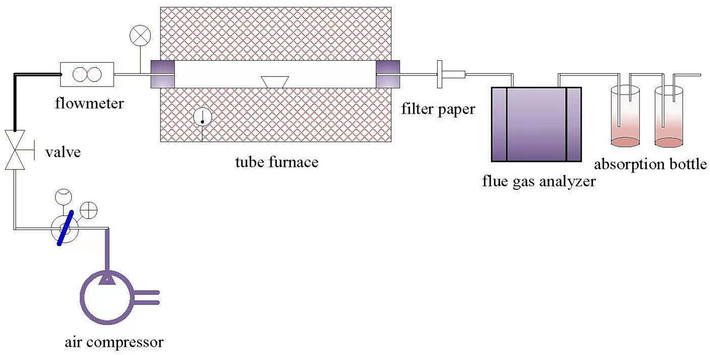
Schematic diagram of the static experimental device of a high-temperature tubular furnace.
The experimental temperature of a high-temperature tubular furnace is controlled by a temperature controller, while the actual furnace temperature is monitored by a thermocouple. Before the experiment, the furnace temperature was first raised to the set temperature of the experiment, and then the inlet side furnace tube was opened. The porcelain boat with samples was put into the constant temperature zone of the furnace tube and heated at the set temperature to carry out the static laminar combustion experiment. The weight of each sample was 2000 ± 5 mg, the combustion atmosphere was 79 vol% N2 /21 vol% O2, the flow rate was controlled at 1 L/min, the pressure was 0.1 MPa, and the sample was provided by an air compressor. The flue gas produced by combustion was first filtered by filter paper, then the real-time concentration of O2, SO2 and NOx in the flue gas analyzer is recorded and finally absorbed by the secondary 5 % sodium hydroxide solution before discharge. To ensure the absorption efficiency of HF and successfully explore the law of fluorine conversion over time, the absorption solution was changed every 10 min.
2.3 Experimental scheme
In this experiment, firstly, the mixing ratio and combustion temperature of SCCB were selected as variables to study the thermal conversion characteristics of fluorine in 16 groups of combustion conditions under four mixing ratios (0, 3 %, 5 %, 10 %) and four typical temperatures (950 ℃, 1100 ℃, 1250 ℃, 1400 ℃). Then, taking SCCB with a mixing ratio of 5 % as an example, the fluorine fixation characteristics of the CaO additive were studied. Nine groups of experiments were carried out at three appending proportions (3 %, 5 %, 10 %) and three typical temperatures (1100 ℃, 1250 ℃, 1400 ℃).
For the accuracy of the experiment, 10 groups of conditions were randomly extracted to carry out repeated experiments. In this experiment, the flue gas analyzer was used not only to detect the concentration of O2, SO2 and NOx in the flue gas but also to judge the end time of the experiment under each condition. What’s more, experimental data unrelated to the thermal conversion characteristics of fluorine were not analyzed.
2.4 Detection and characterization
2.4.1 Detection of fluorine
Gaseous fluoride and dust fluoride were detected by referring to the “Determination of fluoride in Air stationary Pollution Sources-ion Selective Electrode Method” (HJ/T67-2001). Soluble fluorine was detected by referring to “Solid waste leaching toxicity leaching Method Level shock Method” (HJ557-2010) and “Determination of solid waste fluoride ion Selective electrode method” (GB/T15555.11–1995). The total fluoride in the samples was determined by using a Shanghai Yidian PXSJ-216F ion meter with reference to “Determination of Water Soluble fluoride and total Fluoride in Soil” (HJ 873–2017).
2.4.2 Heavy metal detection
Lead, nickel, cadmium and chromium were detected by inductively coupled plasma atomic emission spectrometry (iCAP7000SERIES) based on Appendix A of Leaching Toxicity Identification Standard for Hazardous Waste (GB 5085.3–2007). Mercury and arsenic were detected by Beijing Jitian AFS-933 atomic fluorescence photometer with reference to “Determination of Mercury, Arsenic, Selenium, bismuth and antimony in Solid wastes by microwave digestion/atomic fluorescence method”. Each sample was tested 3 times and then averaged.
2.4.3 Characterization
At the end of the experiment, the ash generated by combustion in some working conditions was characterized and analyzed. The phase analysis of the sample was carried out by the SmartLab (3KW) X-ray diffractometer (XRD) of Nippon Shiko Corporation. The surface morphology of corroded samples was observed by Zeiss SUPRATM55 electron scanning microscope (SEM), and the distribution and content of elements in the corroded layer were tested by Oxford INCA sight X energy dispersive spectrometer (EDS).
2.5 Thermal decomposition kinetics of fluorinated minerals
According to the view of Garcia-Labiano, the process of fluorine emission in coal is a process of direct conversion from initial solid fluorine to the final product gaseous fluoride (García-Labiano et al., 1995). Literature It is proved that the release of fluorine in coal satisfies the first-order reaction kinetics model under constant airflow during the isothermal process (Qi et al., 2003). Whether the thermal decomposition process of fluorine in the co-combustion of coal and SCCB meets the first-order reaction kinetic model has been verified in this paper.
Assuming that the reaction is still a first-order reaction, the formation rate of total fluoride can be expressed as:
Where and (mol/mol) are the fluorine content in sample at reaction time t and the initial reaction time, respectively; is the reaction rate constant; (s) is the residence time.
k can be expressed as Arrhenius form:
If the fluorine emission rate in the sample is expressed by X, as follows:
Eq.(5) can be obtained by substituting Eqs.(3) and (4) into Eq.(2), which is the differential equation of the formation rate of total fluoride:
Based on the experimental data at the combustion temperature of 950 ∼ 1400 ℃, the reaction kinetics curve of fluorine emission was obtained by linear fitting according to -ln(1-X) and 1/T.
2.6 Thermodynamic equilibrium simulation
Based on the Gibbs minimum free energy and entropy increase principles, the equilibrium composition module and the compound database in HSC Chemistry 6 were used to simulate and explore the fluorine footprint in an ideal system (Wang et al., 2017). Input data included the contents of C, H, O, N, S, F, Al2O3, SiO2, CaO, Na2O, Fe2O3, MgO, K2O and TiO2 (Tables 2, 3 and 4). The simulated temperature is 600 ∼ 400 °C and the pressure is 1 atm. The excess air coefficient is 1.3 in air atmosphere.
Samples
Na2O
MgO
Al2O3
SiO2
P2O5
SO3
K2O
CaO
TiO2
Fe2O3
Others
Meager coal
0.62
0.83
32.91
49.56
0.19
1.03
0.98
3.17
1.03
6.28
3.40
SCCB
32.80
0.83
32.31
23.44
0.06
0.15
0.70
4.09
0.47
4.39
0.76
3 Results and discussion
3.1 Fluorine in meager coal and SCCB
Fig. 3 shows the fluorine content in meager coal and SCCB. As can be seen, the fluorine content of meager coal used in the experiment is 1112 µg/g, much higher than the national average level of 200 µg/g and the world average level of 80 µg/g (Luo et al., 2004, Dai et al., 2012). Previous studies have shown that fluorine in coal mainly exists in the form of fluorapatite minerals, organic fluorine and inorganic fluorine decomposed at low temperatures, and fluorine volatilizes in the form of gaseous pollutants HF and SiF4 during pyrolysis (Li et al., 2019b). The fluorine content of SCCB is 109827 µg/g, which belongs to the normal level in electrolytic aluminum overhaul slag (Xie et al., 2020), whose main components are C, NaF, CaF2, AlF3, Na3AlF6, NaAl11O17, SiO2, NaCN, [Na4Fe(CN)6], etc. (Lisbona and Steel, 2008, Xiao et al., 2018). According to the research results on the disposal of SCCB by fire method (Han et al., 2023), during combustion, fluorine volatilizes in the gaseous form of HF, SiF4, CH4 and particulate matter with fluoride. Therefore, in this paper, the gaseous fluoride (GF) and dust fluoride (DF) volatilized in the co-combustion process of meager coal and SCCB are taken as the research object to study the conversion rule of fluorine. And the sum of gaseous fluoride and dust fluoride in the gas phase is defined as total fluoride (TF).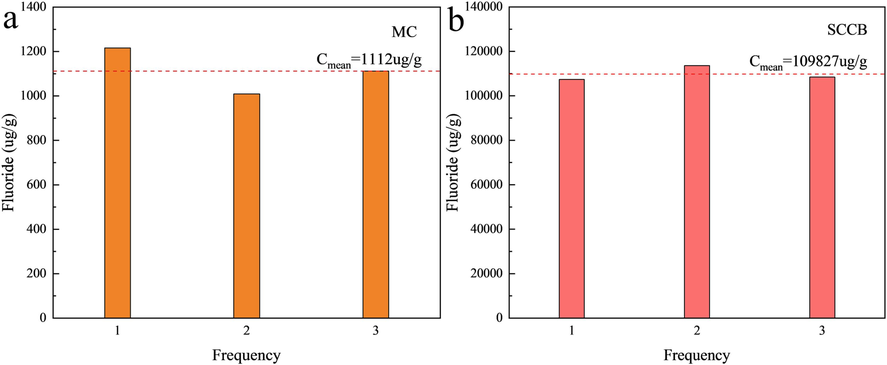
Fluorine content in meager coal and SCCB. (a) Meager coal, (b) SCCB.
Table 5 indicates that the content of heavy metals in meager coal is higher than that in SCCB, and is little different except for nickel. Domestic and foreign scholars (Dai and Ren, 2006, Dai et al., 2012) have conducted in-depth studies on the migration rule of heavy metals in coal. In this paper, the migration rule of heavy metals is no longer studied, and only the amount of residual heavy metals in ash residue is tested to judge the leaching toxicity of ash residue. Note: L - indicates below the detection limit.
Samples
Ni
Pb
Cr
Cd
As
Se
Meager coal
0.65
0.05L
0.01L
0.015
0.41
0.14
SCCB
0.04
0.05L
0.01L
0.005
0.29
0.13
3.2 Transformation characteristics of fluorine
3.2.1 Influence of combustion temperature
The conversion rate of fluorine in the sample α is calculated by Eq. (6):
where (%) is the fluoride conversion rate; , and are the mass of total fluoride, gaseous fluoride and dust fluoride precipitated by the thermal decomposition of fluorine in the sample, respectively; ) is the mass of the sample's initial fluorine.
The influence of combustion temperature on the thermal conversion of fluorine is shown in Fig. 4 and Table 6.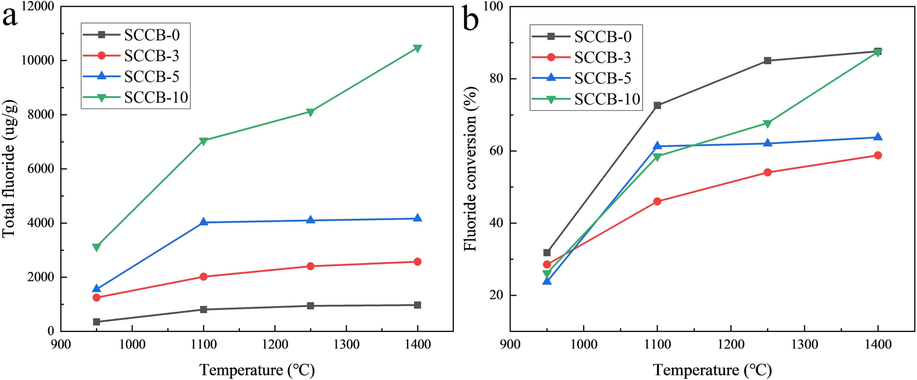
Influence of combustion temperature on thermal conversion of fluorine. (a) Total fluoride, (b) Fluoride conversion.
Temperature
SCCB-0
SCCB-3
SCCB-5
SCCB-10
TF (ug/g)
Conversion rate
(%)TF
(ug/g)Conversion rate
(%)TF
(ug/g)Conversion rate
(%)TF
(ug/g)Conversion rate
(%)
950 ℃
353.8
31.82
1247.9
28.53
1557.9
23.79
3134.0
26.15
1100 ℃
807.4
72.61
2020.1
46.01
4024.7
61.30
7048.2
58.54
1250 ℃
945.4
85.00
2405.9
54.06
4097.4
62.05
8117.3
67.77
1400 ℃
974.4
87.60
2575.0
58.80
4165.1
63.76
10477.8
87.47
As can be seen from Fig. 4 and Table 6, with the increase of temperature, both the production and the gas-phase conversion of fluorine are increasing. The gas phase conversion of fluorine in coal is the highest under the same temperature. When the mixing ratio of SCCB is 3 %, the gas phase conversion of fluorine is the lowest. And the conversion rate of the remaining mixed samples is in between. At the combustion temperature of 950–1400 ℃, the gas phase conversion rate of fluorine in coal ranges from 31.82 to 87.60 %, with an average of 69.26 %, which is 7.68 % lower than that reported in the literature (Qi et al., 2003). This may be because the samples in the porcelain ship are piled too thick, leading to the change in the heat transfer and diffusion characteristics of the samples, which affects the experimental results to some extent (Godbeer and Swaine, 1987). The gas phase conversion rate of fluorine in the mixed sample (SCCB-3) mixed with 3 % spent cathode carbon ranges from 28.53 to 58.80 %, with an average of 46.85 %. This may be because, at low temperatures (950–1100 ℃), Ca in coal reacts with F to form CaF2, which is dominant. The metal complex formed at high temperature (1250–1400 ℃) affected the gas phase conversion of fluorine. However, with the increase of mixing ratio, the reaction diminishes, and the gas phase conversion of fluorine increases.
It can also be seen from Fig. 4 that when the combustion temperature increases from 950 ℃ to 1100 ℃, the gas phase conversion gradient of fluorine is the largest. When the combustion temperature exceeds 1100 ℃, the gas phase conversion of fluorine tends to be gentle. This is mainly because fluorine in SCCB exists in the form of NaF, Na3AlF6, AlF3, CaF2 and other combined states, and the combustion decomposition temperature are high, which has a significant impact on the production of fluorine in the gas phase (Han et al., 2023).
3.2.2 Relationship between gaseous fluoride and dust fluoride
Fig. 5 and Table 7 show the comparison of fluorine forms in the flue gas of meager coal and SCCB.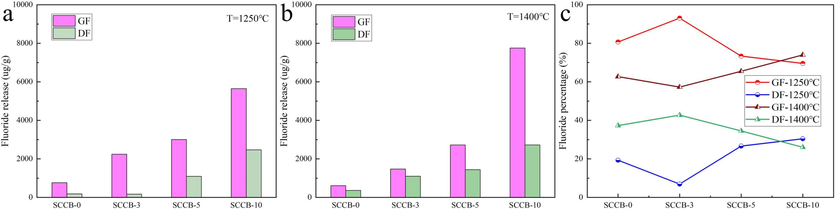
Comparison of occurrence forms of fluorine thermal conversion in combustion flue gas. (a) 1250 ℃, (b) 1400 ℃, (c) Fluoride percentage.
Samples
1250 ℃
1400 ℃
GF(µg/g)
DF(µg/g)
GF
content(%)DF
content(%)GF
(µg/g)DF (µg/g)
GF
content(%)DF
content(%)
SCCB-0
762.9
182.8
80.66
19.34
610.9
363.5
62.70
37.30
SCCB-3
2239.0
167.0
93.06
6.94
1474.7
1100.4
57.27
42.73
SCCB-5
3005.3
1092.1
73.35
26.65
2726.9
1438.2
65.47
34.53
SCCB-10
5644.8
2472.5
69.54
30.46
7751.7
2726.1
73.98
26.02
As can be seen from Fig. 5 and Table 7, in the gas phase fluorine precipitated by combustion of test samples, the gas fluorine is higher than the dust fluoride, and the lower the temperature, the greater the proportion of gas fluorine. When the combustion temperature is 1250 ℃, the proportion of fluorine in gas is 69.54-93.06 %. When the temperature is 1400 ℃, the proportion of fluorine in gas is 57.27-73.98 %. The greater the proportion of gas fluorine, the greater the pressure of flue gas defluorination. The dust and fluorine in flue gas can be well removed by cloth bag filter, which has been fully proved in the removal of particulate matter in power plant. However, it is still necessary to further study whether the limestone-gypsum wet desulphurization method can meet the emission standards and bring about new environmental problems.
3.2.3 Thermal decomposition kinetics of fluorinated minerals
Based on the experimental data of the sample at the combustion temperature of 950 ∼ 1400 ℃, the reaction kinetics curve of fluorine precipitation of the sample was obtained by linear fitting of
and
, as shown in Fig. 6.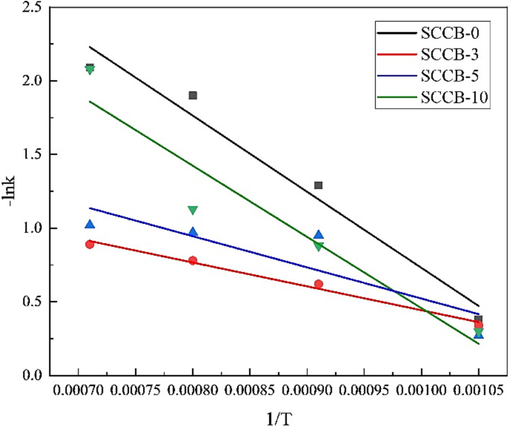
-lnk-1/T diagram of fluorine precipitation during combustion of mixed samples.
According to the slope and intercept of the fitting curve in Fig. 6, the activation energy of reaction E and the pre-exponential factor A can be obtained.
As shown in Table 8, the correlation coefficient R2 of the first-order kinetic curve of fluorine emission from meager coal used in the experiment is greater than 0.95, and the fitting result is linear. The activation energy of the reaction is 42.97 kJ/mol, lower than 77 kJ/mol of the thermal decomposition of fluorapatite (Moreno da Costa et al., 2023), indicating that fluorine in coal can be released at a lower temperature than that of fluorapatite.
Samples
Intercept
Slope
A/min−1
E/kJ·mol−1
R2
SCCB-0
5.90
−5168.67
1.77
42.97
0.9534
SCCB-3
2.06
−1619.62
0.72
13.47
0.9812
SCCB-5
2.64
−2116.71
0.97
17.60
0.6383
SCCB-10
5.29
−4834.82
1.67
40.20
0.8704
After adding SCCB, the fluorine emission of the mixed fuel no longer accords with the first-order kinetic model, and the correlation coefficient R2 of the fitting result of fluorine emission of SCCB-3 is greater than 0.98, which may be related to the low fluorine emission rate and low mixing ratio. However, from the obtained activation energy, adding a small amount of SCCB can promote the combustion of coal and the emission of fluorine, which is related to the high oxygen content of SCCB.
3.3 Influence of CaO on the release characteristics of gaseous pollutants
3.3.1 Migration and transformation characteristics of fluorine
Due to the limitation of experimental conditions, the amount of dust fluoride collected by filter membrane is very small, which cannot meet the requirements of detection. This paper will not analyze the influence of adding CaO on the dust fluoride thermal conversion. See Table 9 and Fig. 7 for the effect of CaO addition on thermal conversion of gaseous fluoride.
Combustion Temperature
Index
SCCB-5
SCCB-5-CaO-3
SCCB-5-CaO-5
SCCB-5-CaO-10
F/mg
12.96
Ca/mg
42.86
71.43
142.86
Ca/F
3.3:1
5.5:1
11.0:1
1100 ℃
GF/mg
8.05
2.52
1.99
3.29
Fluorine in slag/mg
4.91
10.44
10.96
9.67
The increase of fluorine in slag/mg
5.53
6.05
4.76
Fluorine fixation rate/%
42.67
46.72
36.72
1250 ℃
GF/mg
8.20
10.28
8.29
5.17
Fluorine in slag/mg
4.76
2.27
4.67
7.79
The increase of fluorine in slag/mg
−2.49
−0.09
3.03
Fluorine fixation rate/%
−19.26
−0.73
23.37
1400 ℃
GF/mg
8.33
9.02
9.66
9.75
Fluorine in slag/mg
4.63
3.94
3.30
3.21
The increase of fluorine in slag/mg
−0.69
−1.33
−1.42
Fluorine fixation rate/%
−5.32
−10.28
−10.97
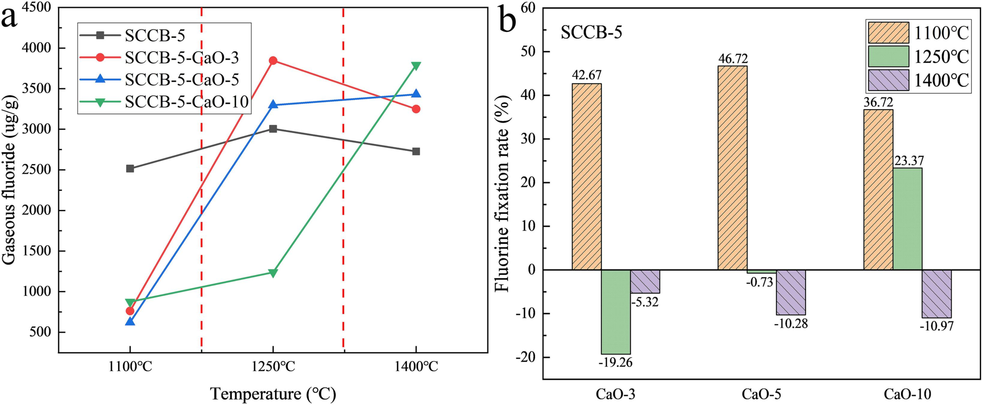
Effect of CaO amount on thermal conversion of gaseous fluoride. (a) gaseous fluoride content, (b) fluorine fixation rate.
As can be seen from Fig. 7 and Table 9, the lower the combustion temperature, the better the fluorine fixation effect. When the combustion temperature is 1100 ℃ and 3 % CaO (Ca:F = 3.3:1) is added to the mixture sample mixed with 5 % spent cathode carbon (SCCB-5), the fluorine fixation rate reaches 42.67 %. The rate of fluoride fixation decreases rapidly with increasing temperature. CaO is the main absorbent of fluoride fixation. CaO can react with fluoride to form CaF2. However, CaF2 is unstable at high temperature. CaF2 starts to decompose at the temperature of more than 1150 ℃, and decomposes completely at 1350 ℃. Therefore, the increase in temperature promotes the decomposition of CaF2, and fluorine is released resulting in a decrease in the rate of fluoride fixation. On the one hand, the negative fluorine fixation rate is caused by the decomposition of CaF2 generated in coal. On the other hand, it is also caused by the addition of CaO, which improves the production amount of particulate matter in flue gas and the production amount of dust fluoride associated with particulate matter. When the combustion temperature is 1250 ℃, Ca/F increases with the development of CaO addition, and the fluorine fixation rate increases gradually from negative to positive. When Ca/F is 5.5, the generation rate of CaF2 is greater than the decomposition rate. But the production of dust fluoride is large, and the fluorine fixation rate basically approximates the equilibrium point. When Ca/F is less than 5.5, the fluorine fixation by combustion not only has no effect but also intensifies the emission of total fluoride. However, with the further increase of Ca/F ratio, the effect of fluoride fixation gradually appeared. When the Ca/F reaches 11, the fluorine fixation rate turns 23.37 %. When the combustion temperature is 1400 ℃, adding CaO not only has no effect on fluorine fixation but also increases the emission of dust fluoride.
According to the above analysis, the effect of fluorine fixation in low-temperature combustion (T < 1100 ℃) furnace is obvious. But the fluorine fixation through high temperature (T > 1250 ℃) combustion furnace is inefficient, which should not be a way of defluorination. This is consistent with the conclusion that the optimal temperature for the combustion of calcium-based fluoride fixation agents is 800-1000 ℃ (Qi et al., 2003).
3.3.2 Release feature of SO2
The influences of combustion temperature and CaO amount on the release characteristics of SO2 are shown in Fig. 8. In this paper, the integral of the curve of SO2 production concentration over time is used to estimate the sulfur fixation rate, and the calculation results are shown in Table 10.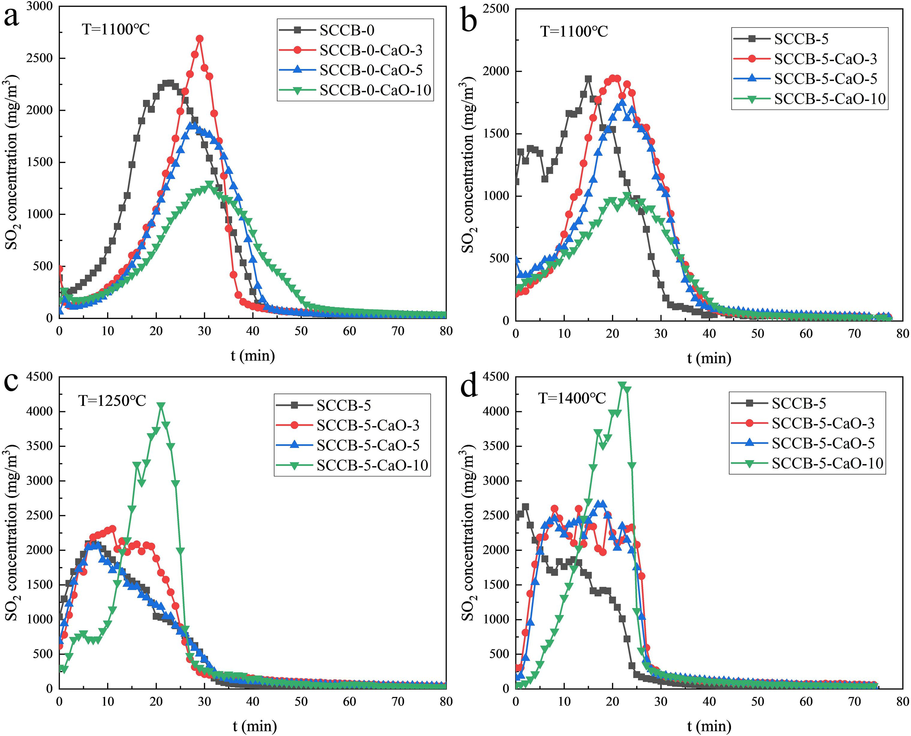
Influence of CaO on release characteristics of SO2. (a) SCCB-0–1100 ℃, (b) SCCB-5–1100 ℃, (c) SCCB-5–1250 ℃, (d) SCCB-5–1400 ℃.
Samples
SCCB-0
SCCB-0-CaO-3
SCCB-0-CaO-5
SCCB-0-CaO-10
Area
50,219
39,391
38,161
34,206
Sulfur fixation rate/%
21.56
24.01
31.89
Samples
SCCB-5
SCCB-5-CaO-3
SCCB-5-CaO-5
SCCB-5-CaO-10
Area
41,089
41,003
36,928
26,437
Sulfur fixation rate/%
0.21
10.13
35.66
As can be seen from Fig. 8(a-b) and Table 10, when the combustion temperature is 1100 ℃, the sulfur fixation rate increases gradually with the increase of CaO addition, from 21.56 % to 31.89 %. The sulfur fixation rate of the sample (SCCB-5) mixed with 5 % spent cathode carbon increased from 0.21 % to 35.66 % with the increase of CaO. In the mixed samples with 3 % and 5 % CaO, the higher the fluoride content, the lower the sulfur fixation rate, indicating the competitive removal of fluorine and sulfur. When adding 10 % CaO, Ca/S reaches about 4.5/1, which has little effect on the sulfur fixation rate. In Fig. 8(c-d), no obvious sulfur fixation effect can be observed in SCCB-5 samples under two combustion temperatures of 1250 ℃ and 1400 ℃.
Fig. 9 shows the effect of CaO amount on the collaborative removal of sulfur and fluorine.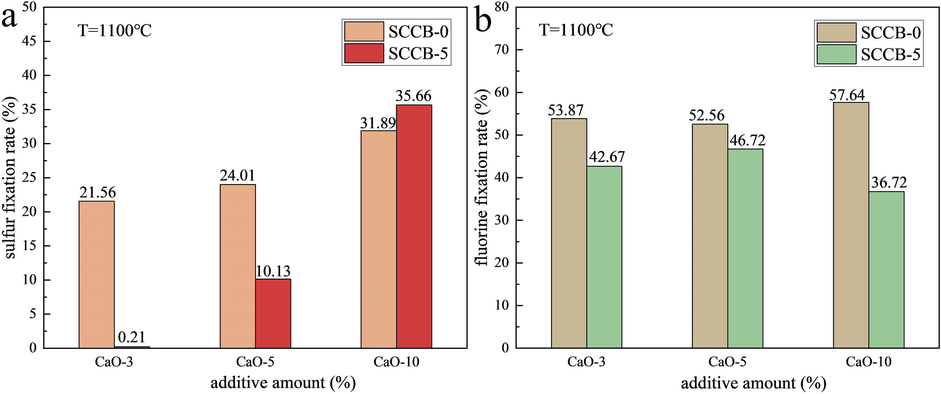
Effect of CaO amount on the collaborative removal of sulfur and fluorine. (a) sulfur, (b) fluorine.
As can be seen from Fig. 9, at the combustion temperature of 1100 ℃, during coal combustion, with the addition of CaO, the fluorine fixation rate first decreases and then increases, with a small range of 52.56 %-57.64 %. But the fluorine fixation rate is significantly higher than the sulfur fixation rate. With the increase of CaO amount in the combustion process of the mixed sample with 5 % spent cathode carbon (SCCB-5), the fluorine fixation rate increases first and then decreases from 42.67 % to 46.72 % and then to 36.72 %. But the fluorine fixation rate is still much higher. The first reason is that Ca/F is much higher than Ca/S. Secondly, CaF2, with a higher decomposition temperature, is more stable than CaSO4. Meanwhile, CaF2 (molecular weight 76) has a much lower degree of pore plugging on CaO than CaSO4 (molecular weight 136).
3.3.3 Analysis of the mechanism of fluorine fixation and sulfur in combustion
CaO reacts with SO2, HF and SiF4 produced by the combustion of mixed samples to produce stable sulfide or fluoride. The basic equations are as follows:
Fluorination reaction:
Sulfuration reaction:
The combustion flue gas contains H2S, CO and other gases, so the following reactions will occur:
On the basis of the previous study on the melting characteristics of ash (Liu et al,2000), the composition of ash is quite complex, containing a large number of acid oxides, such as Al2O3 and SiO2. Under the catalytic action of acid oxides, the added CaO tends to form relatively stable metal complexes, such as 3CaO·3Al2O3·CaF2, 3CaO·3SiO2·CaF2, 3CaO·3Al2O3·CaSO4, Ca4F2Si2O7. The decomposition temperature of these complexes is higher, reaching more than 1400 ℃, which is also the reason why F is still contained in high-temperature ash. As seen in Table 10 and Fig. 9, there is a competitive relationship between desulfurization and defluoridation of CaO. In the reaction process, CaO preferentially reacts with HF to form CaF2.The increase of CaO content has a little effect on the rate of fluorine fixation, while it has a larger effect on the rate of sulfur fixation. This indicates that the formation of CaSO4 has a weak effect on the fluoride fixation rate of CaO. The combustion temperature is the key factor affecting the fluoride fixation rate when the CaO content is certain.
3.4 Fluorine conversion simulation
3.4.1 Fluorine footprint
The conversion behavior of fluorine during the combustion of the samples is presented in Fig. 10.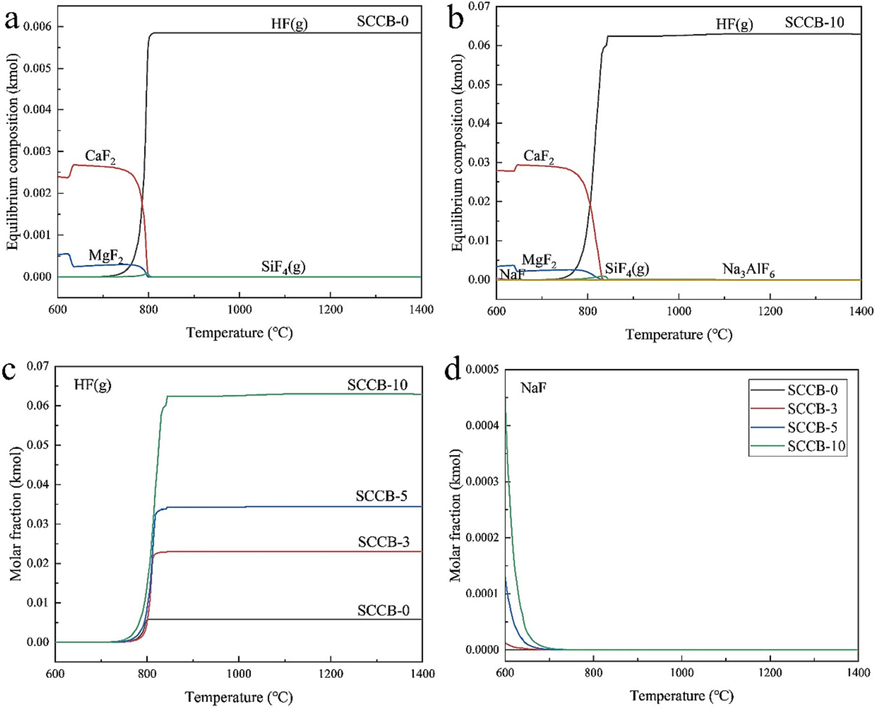
Transformation behaviors of F species during the (co–)combustion. (a)SCCB-0, (b)SCCB-10, (c)HF(g), (d)NaF.
From Fig. 10(a-b), it can be seen that the fluorine in the fuel is mainly emitted to the outside in the form of HF gas after combustion. Flue gas defluoridation is the key to ensure that fluorine emissions meet the standards. Fluorine in coal mainly exists in the form of fluorapatite minerals, organic fluorine and inorganic fluorine decomposed at low temperature. In the combustion temperature of 640-800 ℃, fluorine apatite (Ca5(PO4)3F) decomposition or carbon reduction, generating CaF2. CaF2 reacts with the steam produced by combustion to produce HF (g). Coal combustion process fluorine conversion reaction formula as shown in R6-R8.
Fluorine in the SCCB mainly exists in the form of NaF and Na3AlF6. Na3AlF6 decomposes to produce NaF and AlF3 at a combustion temperature of 500-600 ℃. The fluorine conversion reaction equations in the combustion of SCCB are listed as R9-R11.
The decomposition (R9) and hydrolysis (R10-R11) phenomena were not observed in Fig. 10(b) when 10 % of SCCB was mixed with coal due to the low molar fraction of Na3AlF6. However, it can be seen from Fig. 10(c-d) that the content of NaF grows with increasing the amount of SCCB mixed. The molar fraction of HF gas produced gradually rises, which also explains the conversion process of fluorine in the SCCB.
3.4.2 Effect of CaO addition on fluorine conversion
The effect of the CaO addition on the fluorine conversion is shown in Fig. 11. From Fig. 11(a), it can be seen that the production of HF gas increases and then decreases with increasing combustion temperature after the addition of CaO. CaO obviously inhibits the rate and amount of HF gas production. The release of HF gas from the SCCB-5 sample is 0.0343 kmol at 890 °C. After mixing 5 % and 10 % CaO, the release of HF gas is 0.0316 kmol and 0.0287 kmol, respectively. When the temperature is 1020 °C, the production of HF gas for the mixed samples mixed with 5 % and 10 % CaO is basically the same and reaches the maximum value (about 0.0336 k mol). Subsequently, the amount of HF gas production began to decrease, and at 1400 °C, the amount of HF gas production is about 0.0265 kmol.This is due to the fact that NaF and AlF3 from the decomposition of Na3AlF6 react with CaO to form CaF2, which inhibits the rate of HF generation. In addition, CaO reacts with acidic oxides (Al2O3, SiO2) from combustion to form more stable metal complexes (3CaO·3Al2O3·CaF2, 3CaO·3SiO2·CaF2,Ca4F2Si2O7), which leads to a decrease in the amount of HF. As can be seen from Fig. 11(b), the decomposition of Na3AlF6 is not affected by the addition of CaO.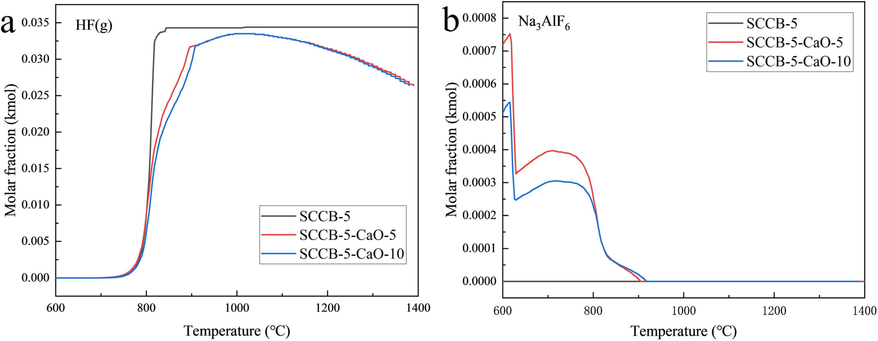
Effect of CaO addition on fluorine conversion. (a) HF(g), (b) Na3AlF6.
3.5 Ash
3.5.1 Influence of combustion temperature on soluble fluorine in ash
The influence of combustion temperature on soluble fluorine in ash is shown in Fig. 12. As can be seen from Fig. 12(a), the higher the combustion temperature, the lower the content of soluble fluorine in ash. When the combustion temperature is 950 ℃, the maximum value of soluble fluorine in the SCCB-10 cinder is 33.4 mg/L. When the combustion temperature rises to 1400 ℃, the content of soluble fluorine is only 0.51 mg/L. The content of soluble fluorine in ash residue at other mixing ratios also showed a similar rule, all of which were far lower than the requirement of 100 mg/L concentration limit of inorganic fluoride (excluding CaF2) in the leaching solution in Table 1 of the Standard for Identification of Hazardous Waste Leaching Toxicity (GB5085.3–2007).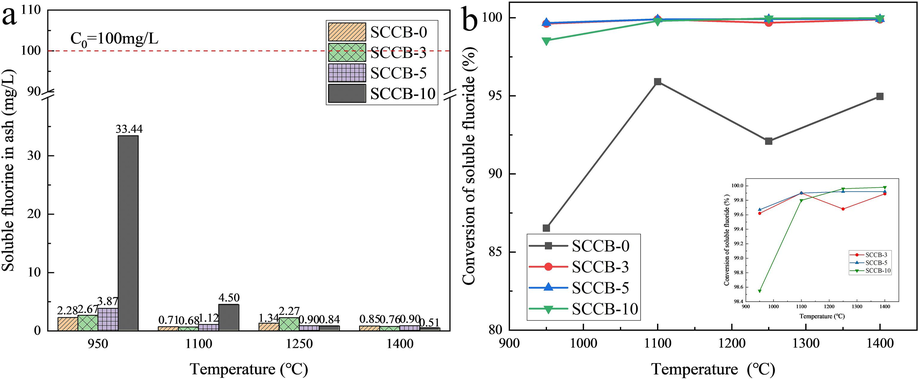
Effect of combustion temperature on soluble fluorine in ash. (a) soluble fluorine, (b) conversion rate.
Fig. 12(b) shows that incineration is the most effective way to remove the toxicity of SCCB. When the combustion temperature exceeds 1100 ℃, the thermal conversion rate of soluble fluorine in the mixed sample is as high as 99.68 %-99.98 %, while the thermal conversion rate of soluble fluorine is slightly lower at 950 ℃, also reaching 98.55 %-99.67 %. The thermal conversion rate of soluble fluorine in coal is lower than that of mixed samples at the same temperature, ranging from 86.53 % to 95.91 %, which is related to the occurrence form of fluorine in coal and is consistent with the thermal conversion rate of fluorine in coal obtained by pulverized coal boiler (Swain and Satapathy, 2023).
3.5.2 Influence of mixing ratio on soluble fluorine in ash
Fig. 13 indicates the influence of the mixing ratio on soluble fluorine in ash. With the rising mixing ratio, the fluorine content in the mixed sample and a mean value of soluble fluorine in the ash after combustion both increase. The soluble fluorine in coal ash ranges from 0.71 mg/L to 2.28 mg/L, with an average value of 1.30 mg/L. The soluble fluorine in the combustion ash of SCCB-10 ranges from 0.51 mg/L to 33.44 mg/L, with an average value of 9.82 mg/L, which is consistent with the previous research (Sun et al., 2021).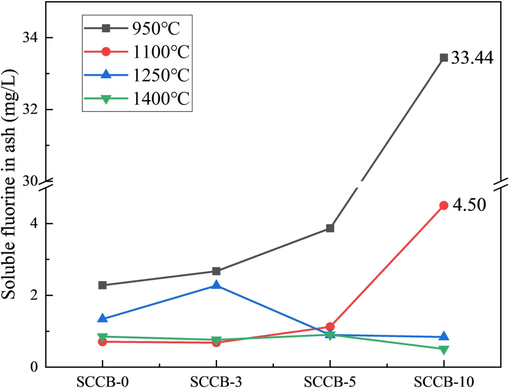
Influence of mixing ratio on soluble fluorine in ash.
3.5.3 Heavy metals in ash
Fig. 14 and Table 11 show the content of heavy metals in the combustion ash of mixed samples. As is shown in Fig. 14, combustion temperature has little effect on heavy metal content in ash. The melting points of Ni, Cr, Pb, Cd, As and Se are 1453 ℃, 1907 ℃, 327 ℃, 321 ℃, 814 ℃ and 221 ℃, respectively. When the temperature is higher than the melting point of Pb, Cd, As and Se, it is easy to sublimate, which belongs to volatile heavy metals. Ni and Cr are volatile heavy metals. The combustion temperature of this experiment is between 950 ℃ and 1400 ℃. The temperature has little influence on the content of heavy metals in ash. Note: The effect of combustion temperature on heavy metal content is not considered.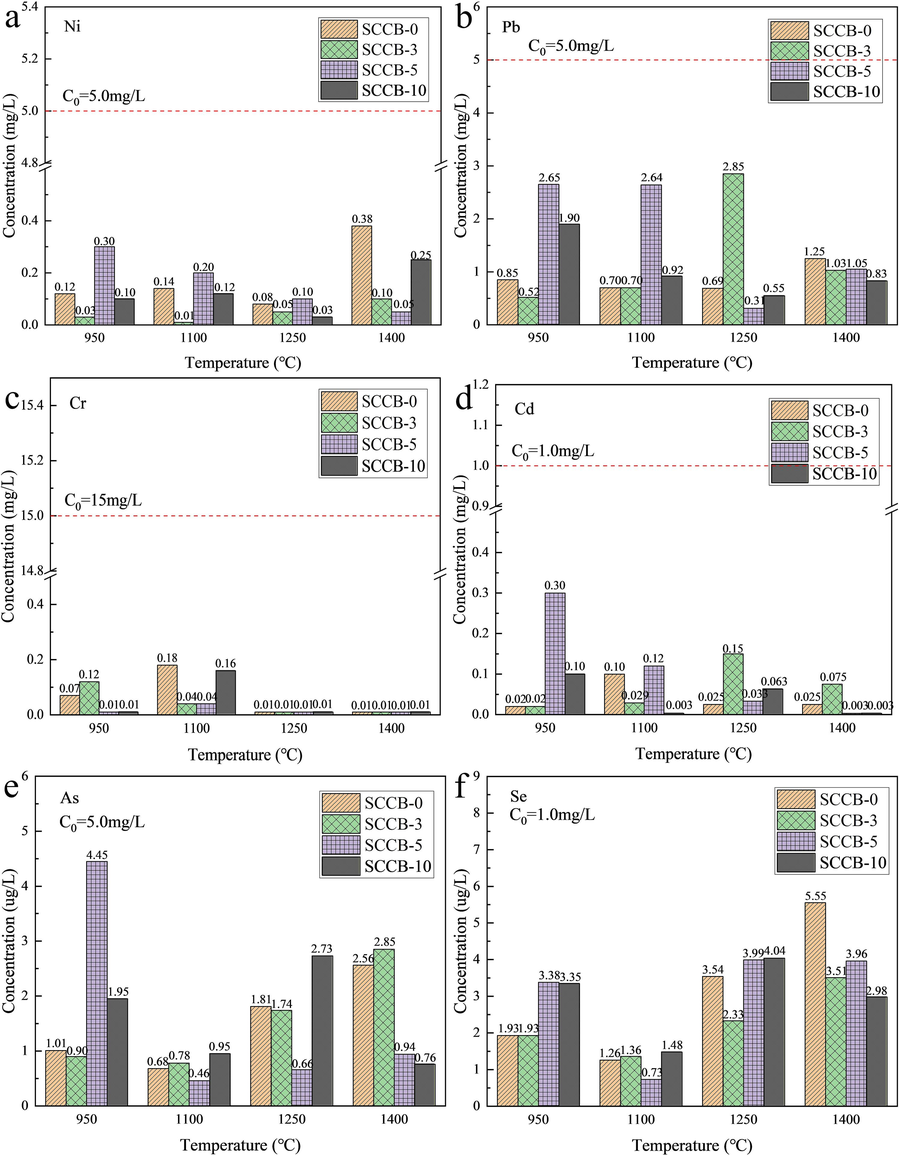
Concentration of heavy metals in mixed sample combustion ash (
--Concentration limits of hazardous substances in leaching solution). (a) Ni, (b) Pb, (c) Cr, (d) Cd, (e) As, (f) Se.
Samples
Ni (mg/L)
Pb (mg/L)
Cr (mg/L)
Cd (mg/L)
As (ug/L)
Se (ug/L)
SCCB-0
0.180
0.873
0.068
0.043
1.515
3.070
SCCB-3
0.048
1.275
0.045
0.069
1.568
2.283
SCCB-5
0.163
1.663
0.018
0.114
1.628
3.015
SCCB-10
0.125
1.050
0.048
0.042
1.598
2.963
The content of heavy metals in the slag of the mixed sample after combustion is very low. The concentrations of Ni, Cr, Pb and Cd range from 0.048 to 0.180 mg/L, 0.873 to 1.663 mg/L, 0.018 to 0.068 mg/L, and 0.042 to 0.114 mg/L, respectively. The concentrations of As and Se range from 1.515 to 1.628 ug/L and 2.283 to 3.070 mg/L, respectively, which are far lower than the concentration limits of hazardous substances in the leach solution in Table 1 of the Standard for Identification of Hazardous Waste Leaching Toxicity (GB5085.3–2007).
3.5.4 Properties of ash
According to previous analysis, SCCB are identified as hazardous waste due to containing a large amount of soluble fluoride and a small amount of soluble cyanide. At the combustion temperature of 950 ∼ 1400 ℃, the soluble cyanide in the SCCB can completely burn and decompose into CO2 and NOx. At low mixing ratio ( ), the maximum value of soluble fluorine in ash residue is 33.44 mg/L, which meets the requirement of 100 mg/L concentration limit of inorganic fluoride (excluding CaF2) in leaching solution of Hazardous Waste Identification Standard (GB5085.3–2007), not belonging to hazardous waste.
3.6 Characteristics of ash
3.6.1 XRD analysis
Fig. 15 shows the XRD pattern of SCCB-5 and the ash after combustion with CaO. As SCCB co-combusts with coal, aluminosilicate minerals rich in NaAlSi3O8 and pyroxene (Na0.72Ca4(Al10Si26O72)(H2O)29.12) appear in the phase composition of ash, corresponding to the high sodium content of SCCB. Such minerals are flux-auxiliating minerals. Diffraction intensity gradually decreases with the increase in temperature. When the temperature is 1400 ℃, diffraction peaks of NaAlSi3O8, Na0.72Ca4(Al10Si26O72)(H2O)29.12 cannot be observed, which is consistent with the conclusion that the diffraction peak disappears when the temperature exceeds 1260 ℃. When the combustion temperature is 1100 ℃, the diffraction peak of CaF2 appears, which corresponds to the high fluorine content of SCCB. When the temperature rises to 1250 ℃, the diffraction peak of CaF2 disappears, which means that the CaF2 content decreases. The physical property of CaF2 decomposition over 1150 ℃ can also be explained. In the XRD pattern, Al2O3, Fe2O3 and Al2O3·SiO2 are stable, and their diffraction intensity does not change significantly with the increase of temperature, indicating that these substances belong to the refractory minerals, acting as the skeleton.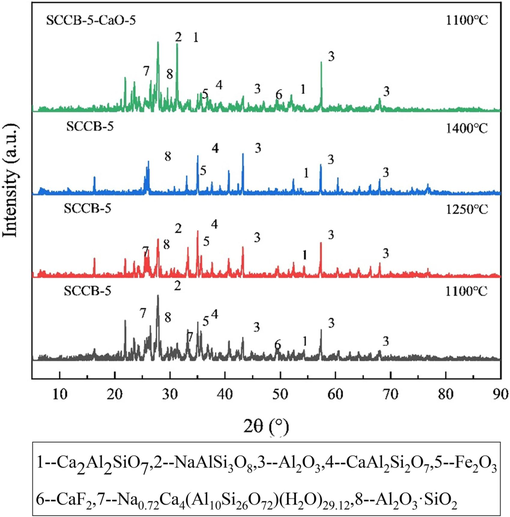
XRD pattern of SCCB-5 and the ash after combustion with CaO.
When the combustion temperature is 1100 ℃, the diffraction peak of plagioclase (Ca2Al2SiO7) appears in the combustion ash of SCCB-5 samples with CaO, indicating that CaO reacts with SiO2 and Al2O3 to form plagioclase ( ). The diffraction peak of CaF2 (2θ = 46.93°) is more obvious, which also means that CaO has a certain effect on fluorine fixation at low temperatures.
3.6.2 Microstructure of ash
As can be seen from Fig. 16, great differences in the microscopic morphology of the four kinds of ash exist.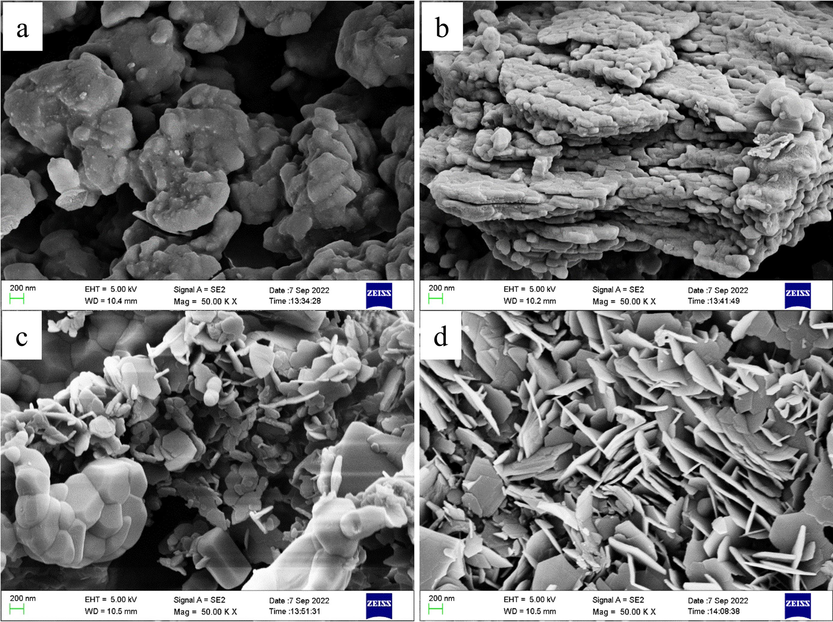
Microstructure of co-combustion ash of meager coal and SCCB at 1100 ℃. (a) MC, (b) SCCB-5, (c) SCCB-10, (d) SCCB-5-CaO-5.
Fig. 16 shows the microstructure of the co-combustion ash of meager coal and SCCB at the combustion temperature of 1100 ℃, from which it can be seen that great differences exist in different kinds of ash. Fig. 16(a) shows that when the combustion temperature is 1100 ℃, the coal ash is partially melted and presents a uniform small and agglomerative vitreous structure with a smooth surface. The EDS results show that the main components of ash are SiO2 and Al2O3. According to the element composition and existing studies (Lim et al., 2023), the main solid phase of coal ash is mullite (3Al2O3·2SiO2) with a high melting point. As shown in Fig. 16(b), when 5 % of the SCCB is added, the ash is stratified, changing from the original agglomeration into a loose cake structure, and the melting phenomenon is relieved. In Fig. 16(c), when the mixing ratio of SCCBs reaches 10 %, the ash presents a mixed structure of particles and sheets with obvious improvement effects, but some small particles still accumulate locally. This is because the SCCB contains Na alkali metal, and the ion potential of Na+ is very low, which can destroy the polymers in the ash, form low melting point sodium-containing minerals such as NaAlSi3O8, and reduce the melting temperature of ash. In Fig. 16(d), after adding 5 % CaO to the sample, the ash turns loose in texture and appears a uniform and flaky structure. This is because the added CaO reacts with SiO2 and Al2O3 to produce calcite (CaAl2Si2O8), calcite (2CaO·Al2O3·SiO2), wollite (CaSiO3) and other calcium-containing minerals, which inhibits the generation of mullite, changes the type of main solid phase, and reduces the percentage of main solid phase, making the melting temperature of ash further reduce.
Fig. 17 draws that the combustion temperature and melting characteristics of ash have significant effects on the surface morphology and microstructure of ash. It can be seen from Fig. 17 and Fig. 16(b) that with the increase in combustion temperature, the morphology of ash changes from sintered state to the molten state. The melting phenomenon is observable at the combustion temperature of 1250 ℃ and extremely strict when the temperature rises to 1400 ℃.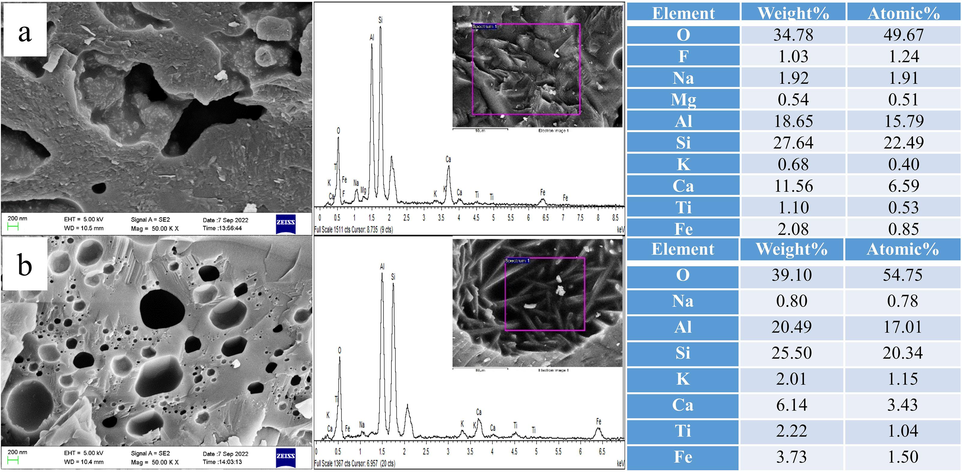
Microstructure and element analysis of co-combustion ash of SCCB-5 mixed samples at different temperatures. (a) 1250℃, (b) 1400℃.
In Fig. 17(a), the ash at 1250 ℃ is fused into a dense massive solid, with a small amount of solid particles attached to the surface, forming a spherical cavity with a diameter of 0.3 µm and a cavernous cavity with an irregular length of 3.97 µm and width of 1.65 µm. The boundary between the two cavities is smooth and uniform, showing obvious traces of melting flow. The EDS analysis indicates that the main components of ash residue are SiO2, Al2O3, CaO, Na2O, Fe2O3 and a small amount of CaF2. From the element composition, it can be inferred that the formation of the spherical cavity is mainly caused by the decomposition of CaCO3 and the decomposition of a small amount of CaF2 and the generation of gaseous HF. The irregular cavernous cavity is mainly caused by the liquid phase material flow generated by the cryoeutectic reaction of SiO2, Al2O3, CaO and Na2O at high temperatures, and the volume shrinkage caused by the precipitation of the generated anorthite and albite during the cooling process.
As shown in Fig. 17(b), serious melting occurred in the ash slag at 1400 ℃. The surface is smooth with almost no particles, forming a more dense massive solid. The number of spherical cavities on the surface is increasing, and the pore size varies from dozens of nanometres to 1 µm. The EDS results show that the main components of the ash are SiO2, Al2O3, CaO, Na2O, and Fe2O3 without the element F. From the element composition, it can be inferred that the formation of a spherical cavity is mainly caused by a low-temperature eutectic reaction of SiO2, Al2O3, CaO, Na2O and Fe2O3 at high temperature, resulting in liquid phase material flow and cooling contraction to form dense Na-Ca-Al-Fe-Si low temperature eutectic. At the same time, the CaCO3 and CaF2 in the ash are completely decomposed into gaseous CO2 and HF, and the gaseous HF etches the surface of ash to form a spherical cavity during the precipitation process.
4 Conclusions
In this paper, the thermal conversion of fluorine in the co-combustion process was investigated under different mixing ratios and temperatures using meager coal and SCCB as fuels. In addition, the characteristics of the ash after co-combustion were investigated. This study is of great significance for the resource utilization of SCCB and environmental protection. The specific findings are as follows:
In the co-combustion of meager coal and SCCB, the gas phase conversion rate of fluorine rises with increasing combustion temperature. The effect of fluorine fixation in the furnace is related to temperature. When the combustion temperature is lower than 1100 ℃, the effect of in-furnace fluorine fixation is obvious. The efficiency of furnace fluoridation decreases with combustion temperature above 1250 ℃. In addition, fluoride removal is accompanied by desulfurization, but the effect of fluoride removal is superior to desulfurization.
The production of total fluoride increases with increasing the mixing ratio of SCCB. The proportion of gaseous fluoride is higher than that of dust fluoride. The proportion of gaseous fluoride increases when the temperature decreases.
The decomposition and transformation of fluorine is related to the combustion conditions and the form of fluorine. Fluorine emissions are not in accordance with the primary kinetic model in co-combustion of meager coal with SCCB. The combustion of coal is facilitated when doped with minor amounts of SCCB.
Combustion is suitable method to remove soluble fluorine in SCCB, and the thermal conversion rate of soluble fluorine is as high as 99.68–99.98 %. The ash after combustion of the sample mixed with 10 % SCCB belongs to the general industrial solid waste.
Acknowledgement
This work was financially supported by Shandong Weiqiao Aluminum & Electricity Co., Ltd (1380020011).
Declaration of competing interest
The authors declare that they have no known competing financial interests or personal relationships that could have appeared to influence the work reported in this paper.
References
- Mutagenic effects of spent potliner and derivatives on Allium cepa L. and Lactuca sativa L.: A molecular approach. Chemosphere. 2018;208:257-262.
- [Google Scholar]
- Evaluation of the reactivity of treated spent pot lining from primary aluminum production as cementitious materials. Resour. Conserv. Recycl.. 2021;170:105584
- [Google Scholar]
- Comparative biomonitoring of leachates from hazardous solid waste of two industries using Allium test. Sci. Total Environ.. 2005;347:46-52.
- [Google Scholar]
- Emission-to-ash detoxification mechanisms of co-combustion of spent pot lining and pulverized coal. J. Hazard. Mater.. 2021;418:126380
- [Google Scholar]
- Fluorine concentration of coals in China—An estimation considering coal reserves. Fuel. 2006;85:929-935.
- [Google Scholar]
- Geochemistry of trace elements in Chinese coals: A review of abundances, genetic types, impacts on human health, and industrial utilization. Int. J. Coal Geol.. 2012;94:3-21.
- [Google Scholar]
- Evaluation of spent pot lining (SPL) as an alternative carbonaceous material in ironmaking processes. J. Mater. Res. Technol.. 2019;8:33-40.
- [Google Scholar]
- Determination of sulfur release and its kinetics in rapid pyrolysis of coal. Fuel. 1995;74:1072-1079.
- [Google Scholar]
- Combustion and emissions analysis of Spent Pot lining (SPL) as alternative fuel in cement industry. Sci. Total Environ.. 2019;684:519-526.
- [Google Scholar]
- Measurement and control of containing-fluorine particulate matter emission during spent pot lining combustion detoxification process. J. Hazard. Mater.. 2023;447:130748
- [Google Scholar]
- Extraction of ferronickel concentrate from laterite nickel ore by reduction roasting-magnetic separation using spent cathode carbon. Miner. Eng.. 2023;201:108194
- [Google Scholar]
- An environmentally benign and sustainable process for carbon recovery and efficient defluorination of spent carbon cathode. Trans. Nonferrous Met. Soc. Chin.. 2022;32:3810-3821.
- [Google Scholar]
- Insights into the synergistic calcination of spent pot lining and red mud for stabilization of fluorine and recovery of iron. J. Environ. Chem. Eng.. 2023;11:111435
- [Google Scholar]
- In-situ capturing of fluorine with CaO for accelerated defluorination roasting of lepidolite in a fluidized bed reactor. Powder Technol.. 2019;353:498-504.
- [Google Scholar]
- Evolution and distribution characteristics of fluorine during the incineration of fluorine-containing waste in a hazardous waste incinerator. J. Zheijang Univ. Sci. A. 2019;20:564-576.
- [CrossRef] [Google Scholar]
- Characterizing crystalline phase transitions in zeolitization of coal fly ash using focused ion beam-scanning electron microscopy. Surf. Interfaces. 2023;36:102536
- [Google Scholar]
- Recovery of fluoride values from spent pot-lining: Precipitation of an aluminium hydroxyfluoride hydrate product. Sep. Purif. Technol.. 2008;61:182-192.
- [Google Scholar]
- Mechanism and kinetics analysis of valuable metals leaching from copper-cadmium slag assisted by ultrasound cavitation. J. Clean. Prod.. 2022;379:134775
- [Google Scholar]
- Fluorine content and distribution pattern in Chinese coals. Int. J. Coal Geol.. 2004;57:143-149.
- [Google Scholar]
- Spent potlining utilisation possibilities. Waste Manag. Res.. 2003;21:467-473.
- [CrossRef] [Google Scholar]
- Influence of the thermal stability of ammonium perchlorate in presence of heteroleptic copper (I) complexes bearing ethane-1,2-diimine and biphosphines. Inorg. Chim. Acta. 2023;545:121249
- [Google Scholar]
- Fluorine emission characteristics and kinetic mechanism during coal combustion. Ranliao Huaxue Xuebao/journal of Fuel Chemistry and Technology.. 2003;31:400.
- [Google Scholar]
- Effect of depressants on flotation separation of magnesite from dolomite and calcite. Int. J. Min. Sci. Technol.. 2023;33:83-91.
- [Google Scholar]
- Highly efficient fluoride extraction from simulant leachate of spent potlining via La-loaded chelating resin. An equilibrium study. J. Hazard. Mater.. 2019;361:200-209.
- [Google Scholar]
- Characterization of inorganic fraction of spent potliners: evaluation of the cyanides and fluorides content. J. Hazard. Mater.. 2002;89:177-183.
- [Google Scholar]
- Thermogravimetric and mass-spectrometric analyses of combustion of spent potlining under N2/O2 and CO2/O2 atmospheres. Waste Manag.. 2019;87:237-249.
- [Google Scholar]
- Thermal behaviors, combustion mechanisms, evolved gasses, and ash analysis of spent potlining for a hazardous waste management. J. Environ. Sci.. 2021;107:124-137.
- [Google Scholar]
- Development of coumarin derivatives as fluoride ion sensor. Tetrahedron. 2023;133310
- [Google Scholar]
- Influence of BaCO3 on chlorine fixation, combustion characteristics and KCl conversion during biomass combustion. Fuel. 2017;208:82-90.
- [Google Scholar]
- Co-utilization of spent pot-lining and coal gangue by hydrothermal acid-leaching method to prepare silicon carbide powder. J. Clean. Prod.. 2018;204:848-860.
- [Google Scholar]
- Detoxification of spent cathode carbon blocks from aluminum smelters by joint controlling temperature-vacuum process. J. Clean. Prod.. 2020;249:119370
- [Google Scholar]
- A closed-circuit cycle process for recovery of carbon and valuable components from spent carbon cathode by hydrothermal acid-leaching method. J. Environ. Manage.. 2022;318:115503
- [Google Scholar]
- Co-treatment of spent cathode carbon in caustic and acid leaching process under ultrasonic assisted for preparation of SiC. Ultrason. Sonochem.. 2018;41:608-618.
- [Google Scholar]
- Co-combustion characteristics and kinetics of meager coal and spent cathode carbon block by TG-MS analysis. Arab. J. Chem.. 2021;14:103198
- [Google Scholar]
- Pilot experimental study on pollutant emission characteristics from co-combustion of coal and spent cathode carbon block. Process Saf. Environ. Prot.. 2023;173:579-591.
- [Google Scholar]
- Study on Slagging Characteristics of Co-Combustion of Meager Coal and Spent Cathode Carbon Block. Journal. 2023;16
- [CrossRef] [Google Scholar]


