Translate this page into:
Therapeutic effects and mechanism of action of lavender essential oil on atopic dermatitis by modulating the STAT3/RORγt pathway
⁎Corresponding authors. 2051028@sntcm.edu.cn (Xiaofei Zhang), wcl3433@163.com (Changli Wang)
-
Received: ,
Accepted: ,
This article was originally published by Elsevier and was migrated to Scientific Scholar after the change of Publisher.
Abstract
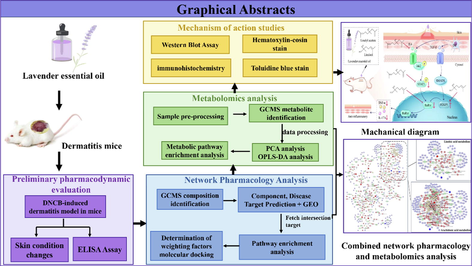
Abstract
Objectives
Atopic dermatitis (AD) is a common skin disorder characterized by skin inflammation caused by an imbalance in the immune response. The efficacy of lavender essential oil in treating atopic dermatitis has been demonstrated; however, its specific mechanism of action and active components remain unknown. Therefore, this study investigated the therapeutic effects and possible mechanism of action of LEO on AD in a 2,4-dinitrochlorobenzene (DNCB)-induced dermatitis mice model.
Methods
To determine the efficacy of LEO, serum levels of the cytokines IL-6 and TNF-α were tested in Kunming mice, and network pharmacology was used to predict the targets and mechanisms of LEO in AD treatment, after which network pharmacology was combined with metabolomics to construct complex response–enzyme–gene networks and investigate their potential associations. Based on the predicted mechanisms, skin tissues were further examined by immunohistochemistry and immunoblotting analysis, and the skin epidermis was stained with hematoxylin-eosin (HE) and toluidine blue (TB).
Results
LEO significantly suppressed the basal levels of IL-6 and TNF-α in the DNCB-induced mice model and predicted that Th17 cell differentiation is a critical pathway for LEO-based network pharmacology in AD treatment. As for the cytokines associated with the Th17 cell differentiation pathway, further experiments verified that LEO significantly reduced the protein expression of interleukin-17A (IL-17A)、Phosphorylated JAK2 (p-JAK)、Phosphorylated STAT3 (p-STAT3), and Retinoic acid-related orphan receptor γt (RORγt) but increased the expression of Foxp3. Additionally, the results of combined network pharmacology and metabolomics analysis showed that LEO could improve two metabolic pathways, namely, linoleic acid metabolism and arachidonic acid metabolism, by regulating the Th17 cell differentiation pathway; identify two key metabolites (linoleic acid, arachidonic acid); and regulate two differential genes (PTGS1, HPGD).
Conclusion
LEO may alleviate DNCB-induced skin inflammation by inhibiting the STAT3/RORγt pathway in Th17 cell differentiation, and reducing the expression of associated inflammatory cytokines and chemokines and improving the metabolism of linoleic and arachidonic acid in vivo.
Keywords
Atopic dermatitis
Lavender essential oil
STAT3
RORγt

1 Introduction
Atopic dermatitis (AD) is a chronic, relapsing inflammatory skin disease caused by an imbalance in the immune response and is characterized by dry, itchy, flaky, and eroded skin (Yurong et al., 2023). The pathogenesis of AD is complex and influenced by several factors, among which genetic and environmental factors are considered the main risk factors. The pathogenesis mainly involves a disturbed immune response and a dysfunctional barrier (David Boothe et al., 2017). The incidence of AD is increasing every year, and 2.1 %–4.9 % of adults and 2.7 %–20.1 % of children worldwide are affected by this disease. AD is characterized by long, recurrent, itchy cycles, usually associated with allergic rhinitis and allergic asthma. Although not life-threatening, the disease can be very painful to the patient both physically and mentally. Therefore, there is an urgent need for strategies focusing on AD treatment. In clinical practice, symptoms can often be alleviated and controlled by topical application of calcium-regulated neurophosphatase inhibitors, glucocorticoids, and other agents (Yu and Shengyuan, 2022). However, these drugs cause many side effects, tend to rebound after stopping, and may lead to renal insufficiency when used in excess concentrations. Currently, there are no drugs that can safely and effectively treat AD.
The pathophysiology of AD may be related to the STAT3/RORγt pathway in the Th17 cell differentiation signaling pathway. interleukin-17A (IL-17A)-producing helper T cells (Th17), a recently discovered CD4 helper T cell subset, are involved in a number of autoimmune and inflammatory illnesses, including AD (Ma et al., 2015). They play a significant role in immune system regulation. The cytokines IL-17A and IL-21 that are produced by activated Th17 cells cause keratin-forming cells to generate antimicrobial peptides that increase proliferation but prevent keratin-forming cells from differentiating. These cytokines are important in the pathophysiology of AD and are produced by the transcription factors STAT3 and RORγt (Su et al., 2017). When peripheral Th17 cells proliferate, they can exacerbate the symptoms of patients with AD (Yamada et al., 2013).
Lavender (Lavandula angustifolia Mill.) is a small perennial shrub of the Labiatae family. Lavender is mainly used in the pharmaceutical or cosmetic industries as a dried product or essential oil, and the volatile oil content ranges from 1 % to 3 % in the whole herb (Yating et al., 2021). The wound-healing properties of lavender and lavender oil were discovered as early as 1910 (Samuelson et al., 2020). Traditionally, lavender essential oil (LEO) is often used for massage in aromatherapy to prevent skin diseases such as AD, psoriasis, and eczema (Rai et al., 2020). The primary active ingredients of LEO are linalool and linalyl acetate, among others. Modern pharmacological studies have shown that LEO exerts pharmacological effects as an example anti-inflammatory, antioxidant, antibacterial, and antidementia activities (Owen et al., 2022). Clinical research has demonstrated that LEO can hasten wound healing by inhibiting macrophage apoptosis, lowering the generation of pro-inflammatory factors, and enhancing the inflammatory response. It can also enhance the hydrolipidic properties, morphological properties, and barrier function of the skin (Ao et al., 2023). LEO and its main ingredients, linalool and linalyl acetate, reduce skin symptoms and are therefore useful in the treatment of skin inflammation in imiquimod -induced psoriasis (Rai et al., 2022).
Network pharmacology is used as part of systems biology, which combines pharmacology, bioinformatics, and molecular biology to provide an in-depth understanding of the action and interactions of the drug with multiple targets (Noor et al., 2023). However, most web-based pharmacological studies focus on qualitative research and ignore the effect of ingredient content and concentration on efficacy, leading to an inability to correctly identify the active ingredient and unravel its mechanism of action. Oral bioavailability and drug-like characteristics are essential metrics routinely employed to evaluate active components in orally delivered medicines. However, this method is not suitable for evaluating transdermal administration; therefore, a new approach, namely, the “dose-effect weighting factor method,” which introduces an oil–water partition coefficient, has been developed; To determine the theoretical transdermal absorption content of each drug, this approach combines the relative content and the oil–water partition coefficient. Using this approach, the corresponding “weighting factors” were established to select key pathways relative to traditional signaling pathway enrichment (Wang et al., 2021b). Metabolomics is used as a top-down approach to analyze metabolic biomarkers comprehensively, explore the pathogenesis of the disease, and help monitor treatment response. The metabolome lies downstream of the genomic product (toward the end) and provides the closest link to the cellular and organismal phenotype (Fu et al., 2023). Metabolite changes in AD can be effectively tracked, and a combined analysis of metabolomics and network pharmacology helps in constructing the entire pharmacopathology network.
The present study investigated the therapeutic effects and the possible mechanism of action of LEO on AD in a DNCB-induced dermatitis mice model. We also introduce a new network pharmacology approach, the “weighted factor approach,” to analyze and screen the key pathways of LEO for AD treatment and combine metabolomics techniques to construct a complete pharmacological network. Finally, we also performed hematoxylin-eosin (HE) and toluidine blue(TB) staining assays, immunohistochemistry (IHC) analysis, and western blotting (WB) to validate the mechanism of action of LEO in AD treatment. This will help us to provide the possibility of using lavender essential oil as a drug for the treatment of AD and provide a scientific basis for its clinical application (Fig. 1).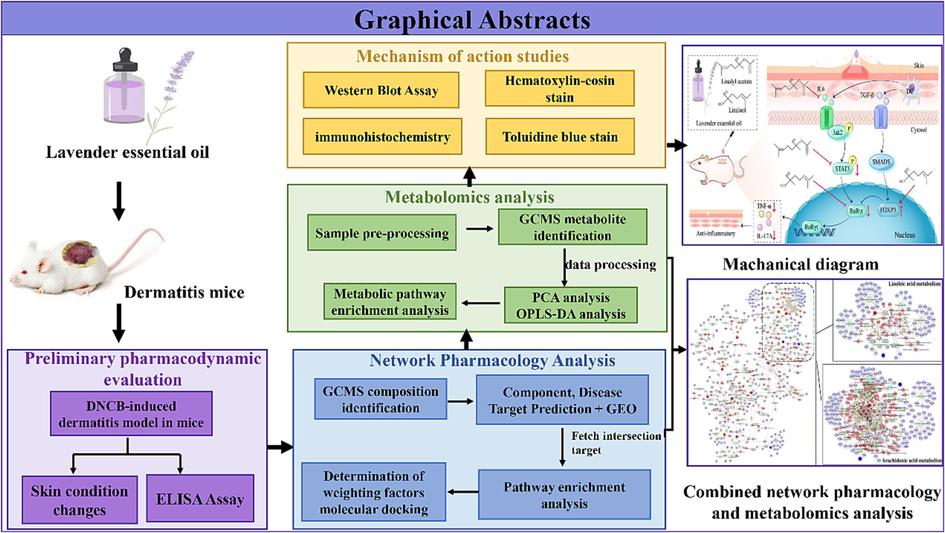
A brief flowchart of the study in question.
2 Materials and methods
2.1 Materials
Lavender essential oil (Xinjiang Ipak Khan Spices Co., Ltd., Yi Ning, China), DNCB (Chengdu Kolon Chemical Co., Chengdu, China), acetone (Tianjin Tian li Chemical Reagent Co., Tianjin, China), and olive oil (Poli Aromatic Pharmaceutical Technology Co., Shanghai, China) were purchased.
2.2 Experimental animals
Specific pathogen-free (SPF)–grade healthy male Kunming mice (18–22 g) were purchased from Chengdu Da shuo Company Limited (Shaanxi Province, China), with animal certificate number. SCXK (Chuan) 2020–030. All experimental procedures were approved by the Animal Ethics Committee of Shaanxi University of Traditional Chinese Medicine (No. SUCMDL20220805001). The mice were acclimatized for 7 days and maintained under standard laboratory temperature and humidity conditions.
2.3 Establishment of DNCB-induced AD model in mice
The mice were randomly divided into six groups: normal group, model group, positive drug group (compound dexamethasone acetate cream), 2 % LEO low-dose group, 4 % LEO medium-dose group, and 8 % LEO high-dose group. The dose groups were all diluted with acetone olive oil solution (4:1). Each group had 10 mice. After grouping, shave approximately 2 cm × 2 cm of fur from the back of the mouse using a razor In the normal group, 100 µL of acetone olive oil solution was used as the control vehicle, and in the remaining five groups, The mice were sensitized by administering a 100 µL solution of acetone olive oil (4:1) containing 7 % DNCB to their back skin (Li et al., 2023). After 6 days, the mice were topically treated with 30 μL of acetone olive oil solution on their left ear as a control, and 30 μL of acetone olive oil solution with 1 % DNCB on their right ear for stimulation, and the stimulation experiment was repeated every 2 days for the sum of three times. One hour after the first sensitization, the sensitizer was washed with a 0.9 % mass fraction of sodium chloride solution, after which the test drug was applied, and the same dose of acetone olive oil solution was utilized for the model group. Mice were dosed twice daily for 12 days. One day after the last administration, mice were allowed to bleed and then euthanized, and dorsal skin and spleen tissue samples were collected and stored in 4 % tissue fixative and in a −80 °C refrigerator.
2.4 Determination of IL-6, TNF-α using ELISA
Mice sera were tested using an enzyme-linked immunosorbent assay (ELISA) kit (Jiangsu Meimian Industrial Co.,Ltd) and cytokine levels in each group were determined according to the instructions. Standard curves were constructed and the concentrations of interleukin-6 (IL-6) and tumour necrosis factor-α (TNF-α) were calculated in each group (Xiaojing et al., 2023).
2.5 Characterization of the chemical composition of LEO
2.5.1 Sample preparation
A 100 μL volume of lavender essential oil was diluted with n-hexane in a 10 mL brown volumetric flask, subsequently dried with anhydrous Na2SO4, and filtered through a 0.22 μm filter membrane into the injection flask to serve as the sample for gas chromatography-mass spectrometry (GC–MS) analysis.
2.5.2 Identification of the chemical components
The chromatographic requirements or conditions for GC–MS analysis were as follows: GC–MS (Model 7890GC/5977MC; Agilent Technologies Inc, Palo Alto, USA), HP-5 MS capillary column (30 m × 0.25 mm × 0.25 μm; Agilent), He as the carrier gas, 1.5 μL injection volume, no splitting, and 1 mL/min flow rate. The heating program was as follows: initial temperature of 65 °C, 1 min holding; 5 °C/min to 90 °C, 1 min holding; and then 10 °C/min to 260 °C, 10 min holding. The ionization mode was electron ionization (EI) with an ionization energy of 70 eV, ion source temperature was 230 °C, full scan mode, and solvent delay time was 3.0 min.
2.5.3 Identification of the chemical composition
Combining the Retention Index (RI) and utilizing a standard solution of n-alkanes (C8-C40), calculate the Retention Index using the following formula for further compound identification (1)
2.6 Screening of LEO for identifying targets of active ingredients
Based on the active ingredients identified in GC–MS, Swiss Target Prediction (https://www.swisstargetprediction.ch/),the PubChem (https://pubchem.ncbi.nlm.nih.gov/), Gene Cards (https://www.genecards.org/), Target Net (https://targetnet.scbdd.com/), and The Comparative Toxicogenomics Database (https://ctdbase.org/) were reviewed to determine the active ingredients of LEO and their AD disease targets. And based on the GEO database GSE32924 microarray assay data, Differential gene analysis was performed using the Limma package for R. The screening conditions were |logFC|>1 and P < 0.05 The intersection of differential genes, LEO component targets, and AD disease targets in the GSE32924 data was then screened using Venny 2.1.0 (https://bioinfogp.cnb.csic.es/tools/venny/index.html). Cross-targets are fed into the online STRING (https://string-db.org/) platform to construct PPI network. The information was then entered into the Cytoscape 3.7.2 software for analysis. and into Cytoscape 3.7.2 (Kohl et al., 2011) software to construct an “AD-active component-AD potential target” network for LEO and analyze the network using the software's built-in network analyser tool. Furthermore, characteristic parameters were used to investigate the important components present in LEO, their targets, and the relationship between them. Gene ontology–biological process (GO-BP) and Kyoto Encyclopedia of Genes and Genomes (KEGG) enrichment analyses were performed using R Language (version 4.2.1), and the results are obtained from the enrichment analysis and then re-ranked using the method based on their weighting coefficients.
2.7 Determination of weighting factors
Since the drug is administered transdermally, we introduced an important parameter of transdermal absorption of drug, logP value, to convert the transdermal absorption rate. Co means that the drug can be completely absorbed, while Cw means the part of the drug that is not absorbed. X indicates the absorption rate of the volatile oil (Wang et al., 2021a). Thus, we related the logP value, relative content and active ingredient to obtain the following formula Eqs. (2)–(6).
In this formula, is the relative amount of each active ingredient, Y is the sum of the scores of the target's related compounds, and S is the sum of the scores of the targets included in the pathway.
2.8 Molecular docking
We obtained the 3D structures of the important targets from the PDB database (https://www.rcsb.org/) (Burley et al., 2021) and the 2D structures of the ligands from the PubChem database. Then, we used the LibDock module of Discovery Studio 4.5 software to dock the target protein with its active ingredient and positive drug.
2.9 Metabolomics studies
2.9.1 Sample pre-processing
Thaw the plasma sample frozen at −80 °C at room temperature and vortex thoroughly to ensure homogeneity. Subsequently, pipette 50 µL of the sample, add 30 µL of 0.5 mg/mL; heptadecanoic acid (internal standard), and 500 µL of pre-chilled methanol. Vortex the mixture for 5 min. Allow the mixed solution to stand at −20 °C. Centrifuge at 13,000 rpm for 10 min at 4 °C to remove proteins. Then, A volume of 400 µL of the supernatant was transferred to a 1.5 mL Eppendorf tube, and the solvent was eliminated through evaporation at a solution evaporation station until dryness. Subsequently, 40 µL of methoxy pyridine solution (15 mg/mL) was added, after which the contents were sealed, shaken, and mixed for 30 s until they dissolved completely. Subsequently, a closed reaction was carried out in a heated mixer (300 rpm) at 60 °C for 2 h. After removing and cooling the contents at − 20 °C for 10 min, 60 µL of BSTFA (with 1 %TMCS) was added, and the contents of the tube were sealed, shaken, and mixed for 30 s. A closed reaction was carried out again in the heated mixer at 70 °C for 1 h. After removing and cooling the contents at 4 °C, they were centrifuged at 13,000 rpm for 10 min.
2.9.2 Handling of quality control samples
The supernatant was taken into the samples for analysis. Briefly, 10 µL of each sample was aspirated and mixed in equal volumes with the supernatant, and processed as described in Section 2.9.1 to obtain quality control samples.
2.9.3 Identification of metabolites
Chromatographic analysis was completed using the Agilent 7890B GC system, and all samples were separated on an HP-SMS capillary column (0.25 mm × 30 m × 0.25 µm). Ultrapure helium (99.999 %) was used as a carrier gas, the flow rate was 1 mL/min, the separation ratio was 10:1, and the injection volume was 1 µL. The column ramp-up procedure was performed for 0–2 min, maintained at an initial temperature of 80 °C for 2 min; 2–20 min, ramped up to 260 °C at 10 °C/min; 20–40 min, ramped up to 300 °C at 2 °C/min, and continued at 300 °C for 0 min. The sample was driven by a carrier gas during separation into the Agilent 597A quadrupole mass spectrometer for analysis. The EI ionization mode was used for the ion source, with an ionization voltage of 70 eV, an ion source temperature of 230 °C, an interface temperature of 290 °C, a mass scan range of 50–600 m/z and a five-minute solvent delay time.
2.9.4 Multivariate analysis and metabolic pathway enrichment
The metabolite and relative content data were imported into R 4.2.1 software for data filtering and normalization. Data were then processed using MetaboAnalyst 5.0 (https://www.metaboanalyst.ca/) and SIMCA14.1 software for multivariate analysis, including principal component analysis (PCA) and Orthogonal partial least squares discriminant analysis (OPLS-DA). Metabolites meeting both (VIP) > 1 and P < 0.05 were considered as differential metabolites. Metabolic pathway enrichment analysis was performed using MetaboAnalyst 5.0.
2.10 Histological testing
The back skin tissue samples fixed in 4 % paraformaldehyde were dehydrated using a gradient of anhydrous ethanol and treated with xylene to increase transparency. Paraffin-embedded, 4-μm-thick tissue sections were cut, then baked on slides, dewaxed, and stained with HE and toluidine blue to observe histopathology under a microscope (Yurong et al., 2023).
2.11 Immunohistochemical testing
The sections were deparaffinized by baking in xylene and then treated with 3 % hydrogen peroxide for 25 min. They were then washed three times in phosphate-buffered saline (PBS) and incubated with 10 % normal goat serum for 30 min. After removing the serum, IL-6, IL-17A, Forkhead box protein 3 (FOXP3) and Phosphorylated JAK2 (p-JAK2) were added and incubated overnight at 4 °C The sections were then washed three times with PBS. After the introduction of secondary antibodies, the sections were incubated at 37 °C for 50 min. Dropwise addition of DAB solution was done for color development, and sections were stained again with hematoxylin solution for 2 min, dehydrated, sealed, and then observed under a microscope (Xiaoqiong, 2022).
2.12 Western blot experiments
The skin tissue from each group was lysed with the prepared protein lysate, and the tissue and lysate were mixed thoroughly and positioned on ice for 5 min. The contents were spun down at 12,000 rpm for 10 min at 4 °C, and the resulting supernatant was isolated. The collected supernatant was utilized as the protein extract. and the total protein concentration was determined using the BCA method. After protein quantification, proteins were upsampled at 4 μg/mL and separated by 10 % SDS-PAGE and then transferred to a PVDF membrane. The membranes were blocked using 5 % powdered skim milk, followed by incubation using antibodies against STAT3 (ab68153; Abcam, China), Phosphorylated STAT3 (p-STAT3) (bs-1658R; Boossen, China), and RORγt (ER1916-09; HUAbio, China). The membranes were then washed with TBST and incubated with secondary antibodies for 1 h. The membranes were washed three times with TBST, and then ECL chemiluminescence solution was added to the top surface of the membranes in a dark box for 5 min protected from light. β-Actin (66009-1-Ig; Proteintech, China) was used as an internal reference using a gel imaging system (Xiaojing et al., 2023).
2.13 Analysis of the data using statistical methods
All experimental data in this study were subjected to statistical analysis using GraphPad Prism 8.0 software. and the results are presented as ± SD. One-way analysis of variance (ANOVA) were used to analyze statistically significant differences between two or more groups. P < 0.05 was considered to indicate a statistically significant difference between two groups.
3 Results
3.1 Effect of LEO on DNCB-induced mice models
DNCB induction leads to signs of bleeding, edema, vesicles, flaking, and dryness in the skin of mice (Zhang et al., 2022). Based on animal experiments in a mice dermatitis model induced by DNCB, it was shown that the symptoms of AD were treated with different concentrations of LEO, and the skin condition was observed and found to be significantly relieved (Fig. 2A).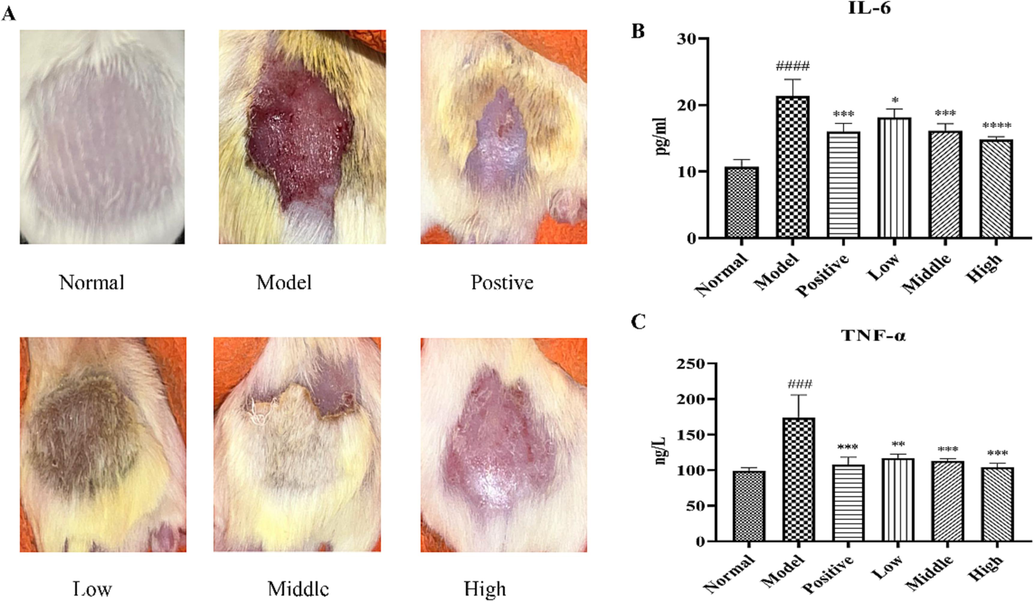
(A) Lavender essential oil treatment ameliorates DNCB-induced atopic dermatitis lesions and (B-C) Effect of lavender essential oil on IL-6 and TNF-α levels in DNCB model (Data are presented as
± SD, n = 6. ****P < 0.0001, ***P < 0.001.).
3.2 Serum levels of TNF-α and IL-6
To further investigate the effect of LEO on AD treatment, serum concentrations of IL-6 and TNF-α were quantified. Compared with the normal group, TNF-α (***P < 0.001, n = 6) and IL-6 (****P < 0.0001, n = 6) levels were significantly increased in the model group, and compared to model group, the LEO dose group showed a decrease in TNF-α and IL-6 levels (Fig. 2B–C).
3.3 GC–MS composition of LEO
The chemical composition of LEO was determined by GC–MS, see Fig. 3A. 17 chemical components were identified, the main components of which were linalool (20.47 %) and linalyl acetate (14.989 %), the results are shown in Table 1. Note: The bolded words are the key ingredients of high content LEO.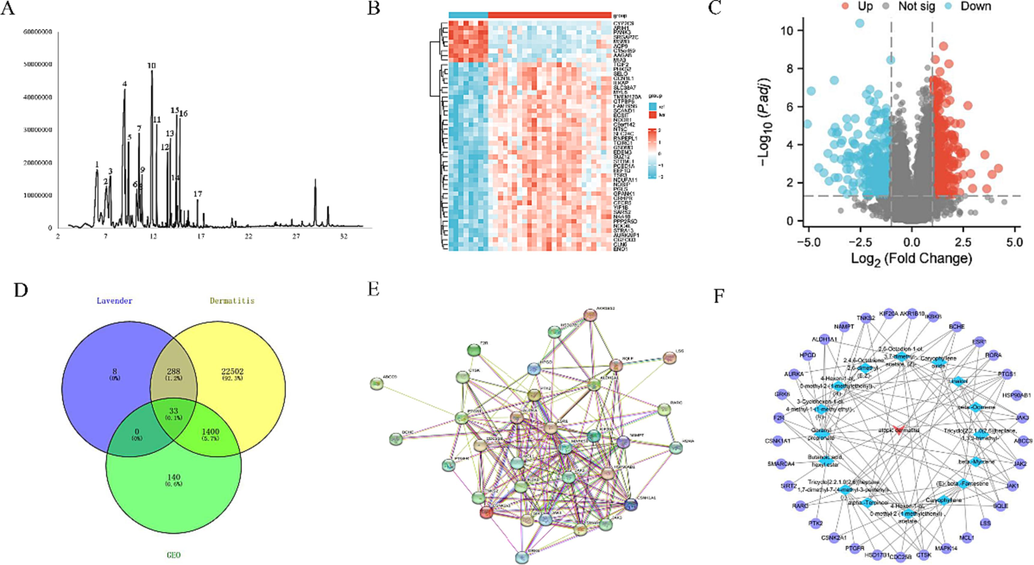
(A) Total ion current map of LEO. (B) The differential genetic volcano map of AD (C) Heat map of differential genes in AD (D) Intersection map of LEO targets, eczema targets, and differentially expressed genes. (E) PPI network diagram. (F) Network diagram of LEO for AD disorders – active ingredients – core targets.
Number
Library/ID
Retention
time (min)Pct total
RI
1
beta. - Myrcene
6.105
10.009
148.9066
2
Tricyclo [2.2.1.0(2,6)] heptane, 1,3,3-trimethyl-
7.0971
7.905
168.9754
3
beta. - Ocimene
7.5056
6.495
177.2388
4
Linalool
9.0061
20.47
1118.1532
5
2,4,6-Octatriene,2,6-dimethyl-, (E, Z)-
9.4063
5.065
1137.5109
6
4-Hexen-1-ol,-methyl-2-(1-methylethenyl)-, (R)-
10.2816
2.329
1179.8491
7
3-Cyclohexen-1-ol, 4-methyl-1-(1-methylethyl)-, (R)-
10.54
5.671
1192.3479
8
Butanoic acid, hexyl ester
10.6151
1.159
1195.9805
9
Alpha. - Terpineol
10.8151
2.448
1206.7416
10
Linalyl acetate
11.8905
14.989
1268.7601
11
4-Hexen-1-ol, 5-methyl-2-(1-methylethenyl)-, acetate
12.3741
3.97
1296.6494
12
2,6-Octadien-1-ol, 3,7-dimethyl-, acetate, (Z)-
13.4995
2.009
1370.7336
13
Geranyl propionate
13.7913
2.961
1390.0722
14
Tricyclo[2.2.1.0(2,6)]heptane, 1,7-dimethyl-7-(4-methyl-3-pentenyl)-, (-)-
14.3831
0.938
1432.5263
15
Caryophyllene
14.4582
4.211
1438.0528
16
(E) – beta -Farnesene
14.8166
3.536
1464.4271
17
Caryophyllene oxide
16.6423
0.792
1607.9306
3.4 Network pharmacology analysis
3.4.1 Screening key targets
Using Swiss Target Prediction, TargetNet, GeneCards, and CTD databases to predict targets for LEO components and AD diseases, 329 component targets and 24,223 disease targets were obtained. Based on the GEO database GSE32924 assay data, normal and disease samples were analyzed, which showed 1857 differentially expressed genes. The related heat map and volcano map are illustrated in Fig. 3B, C total of 33 intersecting targets were then analyzed using the Venny 2.1.0 online website, and correlation Venny plots were obtained (Fig. 3D).
3.4.2 Network construction and analysis
The intersection of the LEO component targets and AD disease-related targets with the differentially expressed genes from the GSE32924 microarray assay data can be considered a key target for LEO in AD treatment. The protein–protein interaction (PPI) network graph was constructed by introducing 33 intersection targets into the STRING online platform, which has 33 nodes, 47 edge counts, and an average degree value of 2.85 (Fig. 3E) (Xiaojing et al., 2023). In Fig. 3F, the purple ovals represent the key components of the LEO screen, the blue triangles represent the key targets, and the red arrows represent the disease. Those with high degree scores were selected as key role targets using network analyzer analysis. PTGS1, JAK2, JAK3, CTSK, SQLE, and JAK1 are the top six key targets that are likely effective.
3.4.3 Results of GO-BP and KEGG enrichment analyses
GO-BP and KEGG enrichment analyses of 33 intersecting targets were performed using the R Language. The analysis resulted in the identification of 230 biological processes and 28 signaling pathways (Fig. 4A–B). GO-BP is mainly involved in the growth hormone receptor signaling pathway, cellular response to growth hormone stimulus, regulation of ubiquitin-dependent protein catabolic process, and other pathways. KEGG analysis revealed enriched pathways such as Th17 cell differentiation, PD-1/PD-L1 in Cancer and Th1 /Th2 cell differentiation, and other pathways. Fig. 4C–D shows data after recalculation and reordering of the weighting factors. Th17 cell differentiation was still ranked first, and Th17 cell differentiation was finally identified as the most important pathway.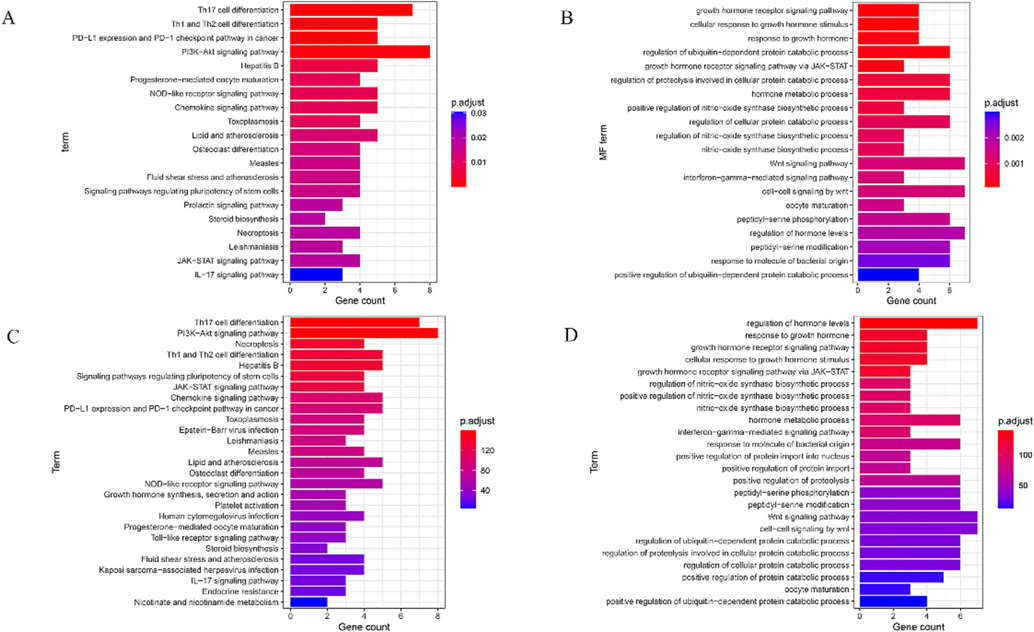
(A) Plot of KEGG enrichment analysis of LEO (B) Plot of GO-BP analysis of LEO. (C) Plot of KEGG enrichment analysis of LEO after ranking with the weighting factor method. (D) GO-BP analysis of LEO after sorting by the weighting factor method.
3.5 Molecular docking results
The selection of key active components of LEO for molecular docking with key targets of the Th17 cell differentiation pathway was performed in the LibDock section of Discovery Studio 4.0 software. The docking results are based on the docking score when comparing the active ingredient with the specific ligand. If an active ingredient has the highest score and is comparable to the specific ligand score, then the active ingredient works best at that target site and has a greater role in the Th17 cell differentiation pathway. The results suggest that linalool exhibits optimal binding affinity towards crucial targets (RORγt, FOXP3) and establishes stable interactions, with scores similar to those of specific ligands (celastrol, chloroquine). Similarly, linalyl acetate demonstrates optimal binding activity and forms stable interactions with key targets (STAT3, IL-6), yielding scores comparable to specific ligands (Dibromotyrosine, Rivanicline). The RORγt target proteins, leucine (LEU), alanine (ALA), and valine (VAL), engage in hydrophobic interactions with Linalool, specifically alkyl-to-alkyl and alkyl-to-unsaturated bonds. Additionally, arginine (ARG) forms a hydrogen bond with Linalool. On the other hand, the Foxp3 target proteins, leucine (LEU), valine (VAL), tyrosine (TYR), and phenylalanine (PHE), also form hydrophobic interactions with Linalool. However, methionine (MET) exhibits an unfavorable binding with Linalool, as it is capable of binding in plan but not in stereo. Among the STAT3 target proteins, ALA, VAL, isoleucine (ILE), and cysteine (CYS) engage in hydrophobic interactions with Linalyl acetate, while ARG, glutamine (GLN), and Linalyl acetate form hydrogen bonds with each other. Similarly, the IL-6 target proteins MET, LEU, and LYS exhibit hydrophobic interactions with Linalyl acetate, respectively. This suggests that linalool and linalyl acetate could be the key active ingredients in LEO for AD treatment (Fig. 5).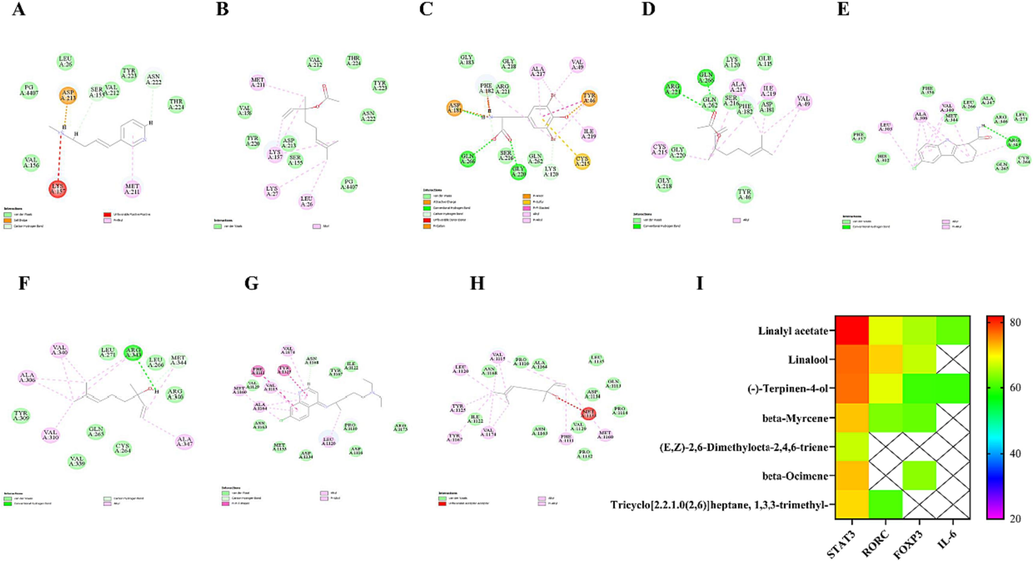
(A) Interaction diagram of IL-6 and rivanicline. (B) Interaction diagram of IL-6 and linalyl acetate. (C) Interaction diagram of STAT3 and dibromotyrosine. (D) Interaction diagram of STAT3 and linalyl acetate. (E) Interaction diagram of RORγt and selisistat. (F) Interaction diagram of RORγt and linalool. (G) Interaction diagram of FOXP3 and chloroquine. (H) Interaction diagram of FOXP3 and linalool. (I) Heat map of molecular docking scores. The interactions of key amino acids and structures are shown, with dark green representing conventional hydrogen bonding, light green representing van der Waals forces, red representing unfavourable binding, dark purple representing π-σ, and light purple representing alkyl groups. (For interpretation of the references to color in this figure legend, the reader is referred to the web version of this article.)
3.6 Metabolomics analysis
Analysis of mice serum samples by GC–MS with simultaneous collection of serum QC samples demonstrates instrument stability. A 2D scatter plot generated by the PCA highlighted clear distinctions between the normal group and the model and high-dose groups. (Fig. 6A). This result indicates that LEO caused changes in metabolites in vivo and that differences were observed in metabolic levels between the groups of samples (Li et al., 2021a). To further mine the data for metabolite information, we used supervised multidimensional statistical methods (i.e., OPLS-DA) and further analyzed the normal and model groups separately (R2X = 0.315, R2Y = 0.985, Q2 = 0.737); the model and dosing group samples (R2X = 0.453, R2Y = 0.996, Q2 = 0.923; Fig. 6B, C). Both groups showed good separation, with improved R2Y and Q2 values, and yielded more coherent interpretations and cross-validated predictions about the data for the sample classification. in addition to validating the validity and adaptability of the OPLS-DA model using permutation tests (200 times; Fig. 6D, E).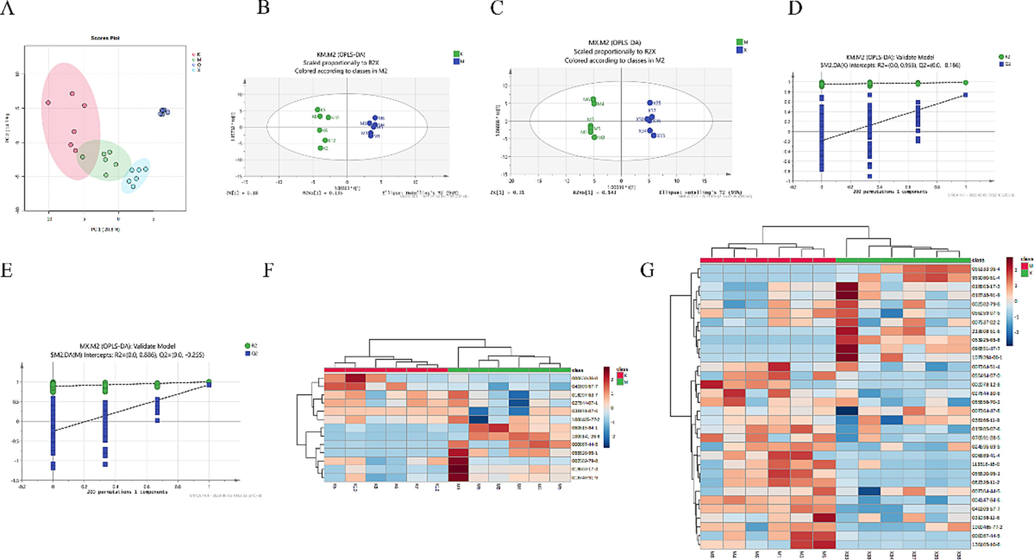
Metabolomics analysis. (A) PCA for normal, model, dosing, and QC groups. (B) Normal vs model OPLS-DA score plots. (C) OPLS-DA score plot for model vs dosing. (D-E) Normal vs model, model vs administered OPLS-DA model random substitution test (n = 200). Green triangles are labeled R2, and blue boxes are labeled Q2. (F-G) Heat map of metabolites with differential expression between normal vs model and model vs dosing. (For interpretation of the references to color in this figure legend, the reader is referred to the web version of this article.)
In OPLS-DA and t-test analyses using SIMCA 14.1 software, with VIP > 1 and P < 0.05 as screening criteria, 12 differentially expressed metabolites were identified in the normal model group, with five metabolites having upregulated expression in the normal group compared with that in the model group, including Caryophyllene, Tetradecanoic acid, Stearic acid, Dodecanoic acid, Urea. And seven having downregulated expression in the normal group compared with that in the model group including Phytane, mio-Inositol, 1,3-Bisurea, l-Alanine, Glyceric acid, Butanedioic acid and DL-Pyroglutamic acid. (see Table 2 for details). Thirty-two differentially expressed metabolites were identified in the model-administered group, with seven metabolites having upregulated expression and 25 metabolites having downregulated expression compared with those of the model and administered groups (see Table 3 for details). We generated heat maps based on the two sets of differentially expressed metabolite changes (Fig. 6F, G). To further investigate the metabolic pathways regulated by LEO, we introduced these differentially expressed metabolites into MetaboAnalyst 5.0. Fig. 7 displays the outcomes of the analysis. Based on the pathway impact of > 0.01, six major metabolic pathways were screened in the normal model group, mainly including the phosphatidylinositol signaling system, glycerolipid metabolism, glyoxylate and dicarboxylate metabolism, and other metabolic pathways. Thirteen major metabolic pathways were identified in the screening model administration group. The main pathways include linoleic acid (LA) metabolism D-Glutamine and D-glutamate metabolism phenylalanine, tyrosine, and other metabolic pathways.
No
RT/Min
Compound_ID
Ref
VIP
Trend
Compound Name
1
10.8187
–
80,121
1.46257
↑
Caryophyllene
2
13.8094
HMDB0003502
176,407
1.46786
↓
Phytane
3
18.2425
HMDB0001059
346,997
1.33388
↓
mio-Inositol
4
8.299
HMDB0014876
80,690
1.49298
↓
1,3-Bisurea
5
15.5692
HMDB0000806
199,632
1.21125
↑
Tetradecanoic acid
6
19.31
HMDB0000827
266,040
1.37878
↑
Stearic acid
7
6.2604
HMDB0000161
115,251
1.45844
↓
l-Alanine
8
9.5685
HMDB0000139
226,193
1.56264
↓
Glyceric acid
9
9.28
HMDB0000254
149,846
1.81118
↓
Butanedioic acid
10
13.444
HMDB0000638
163,456
1.72877
↑
Dodecanoic acid
11
7.4529
HMDB0000294
167,685
1.54191
↑
Urea
12
12.0688
HMDB0000267
164,275
1.28932
↓
DL-Pyroglutamic acid
No
RT/Min
Compound_ID
Ref
VIP
Trend
Compound Name
1
10.8187
–
80,121
1.16966
↓
Caryophyllene
2
8.3567
HMDB0001870
68,604
1.10542
↓
benzoate
3
18.2425
HMDB0000211
346,997
1.4282
↓
meso-inositol
4
15.0882
HMDB0002428
211,224
1.53402
↑
Terephthalic acid
5
11.3955
HMDB0005802
118,293
1.29142
↓
2-methoxy-4-propenylphenoxy
6
7.9336
HMDB0000883
148,881
1.19711
↓
L-Valine
7
9.0875
HMDB0000162
146,465
1.29208
↓
L-proline
8
13.3092
HMDB0000159
210,210
1.47898
↓
L-phenylalanine
9
10.3377
HMDB0000167
242,351
1.49908
↓
L-Threonine
10
13.2034
HMDB0000148
272,256
1.44823
↓
L-Glutamic acid
11
15.5692
HMDB0000806
199,632
1.09596
↓
Tetradecanoic acid
12
19.31
HMDB0000827
266,040
1.22653
↓
Stearic acid
13
14.1747
HMDB0000182
271,127
1.226
↓
L-Lysine
14
11.3957
HMDB0001147
242,300
1.16396
↑
2-Aminomalonic acid
15
12.0013
HMDB0000696
189,711
1.43776
↓
L-Methionine
16
14.9055
HMDB0002142
328,762
1.50264
↓
Phosphoric acid
17
11.6359
HMDB0000744
259,025
1.24849
↓
Malic acid
18
9.2799
HMDB0000254
149,846
1.56118
↓
Butanedioic acid
19
12.2419
HMDB0015537
171,122
1.60472
↑
2,4-Di-tert-butylphenoxy
20
7.0875
HMDB0000710
7.0875
1.1466
↑
4-Hydroxybutyric acid
21
10.4819
HMDB0000661
167,761
1.22391
↓
Glutaric acid
22
13.4438
HMDB0000638
163,460
1.38335
↓
Dodecanoic acid
23
15.4152
HMDB0000214
313,094
1.31082
↓
L-Ornithine
24
19.0695
HMDB0000673
261,807
1.53536
↓
linoleate
25
14.9728
HMDB0000641
271,055
1.26177
↓
L-Glutamine
26
9.8473
HMDB0000847
111,241
1.43296
↓
nonanoic acid
27
19.0601
HMDB0000207
263,933
1.15912
↑
9-octadecenoate
28
12.0304
HMDB0000267
164,275
1.08296
↓
DL-Pyroglutamic acid
29
11.5015
HMDB0001406
69,933
1.19664
↑
Niacinamide
30
20.4446
HMDB0001043
284,903
1.32653
↓
Arachidonic acid
31
16.2711
HMDB0000122
345,085
1.15128
↓
d-Glucose
32
12.0207
HMDB0000267
164,270
1.0513
↑
5-Oxoproline
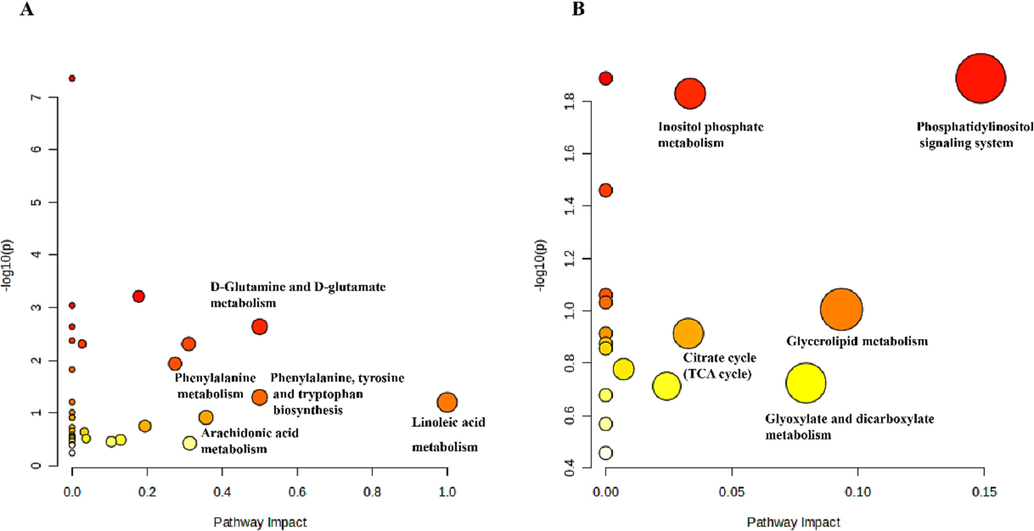
(A-B) Metabolic pathways showing important metabolites in normal vs model and model vs dosing.
3.7 Combined network pharmacology and metabolomics analysis
In order to comprehensively understand how LEO operates as a treatment for AD, we used network pharmacology and metabolomics to construct a network of interactions (depicted in Fig. 8). Using the MetScape plugin in Cytoscape software, we integrated the screened differential genes and differential metabolites to construct a compound-response-enzyme-gene network (Li et al., 2021b). By matching differential genes to compounds, we identified two key targets: HPGD and PTGS1 (see dark blue circles in Fig. 8). In addition, we identified key metabolites such as linoleic acid and arachidonic acid (indicated by red hexagons in Fig. 8). Affected metabolic pathways include Linoleic acid metabolism, Arachidonic acid metabolism. we then confirmed the expression of these genes which may play an important role in the efficacy of LEO as a treatment for AD.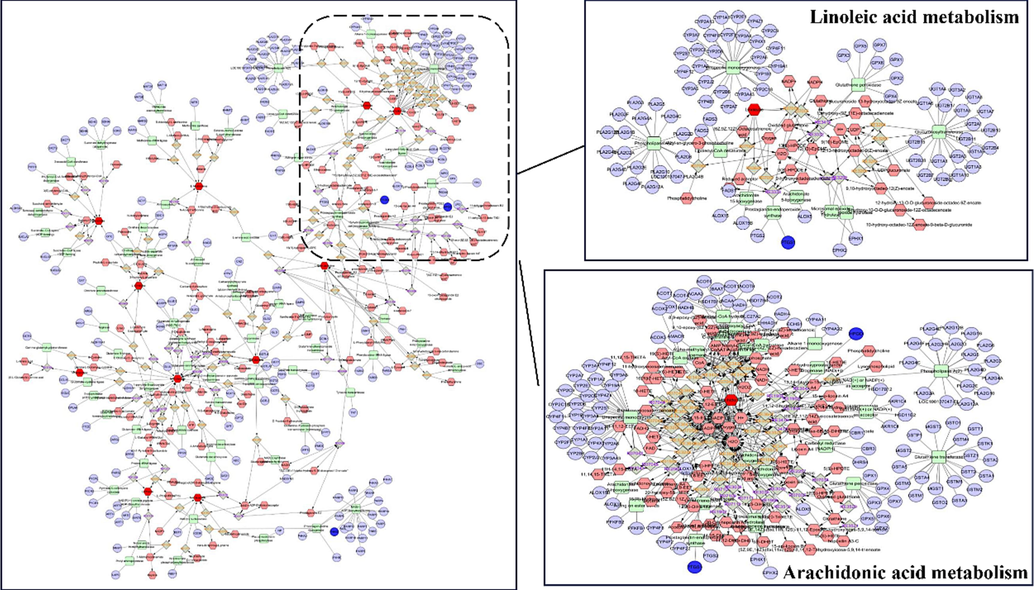
Compound-reaction-enzyme-gene networks for key metabolites and genes of arachidonic acid metabolism and linoleic acid metabolism.
3.8 LEO inhibits DNCB-induced epidermal thickening and mast cell infiltration in the mice model
The analysis of HE staining (Fig. 10A) revealed that the epidermal tissue of showed that the epidermal tissue of the normal group had a normal structure, with no evident hyperkeratosis of the stratum corneum and no significant thickening of the skin. By contrast, the model group showed a marked thickening of the tissue epidermis and a large number of blood crusts formed by leukocyte exudation and platelet coagulation were visible. Positive drug observation shows mild abnormalities in skin tissue structure, with slight epidermal hyperplasia, tight epidermal-dermal junctions, and a small amount of inflammatory cell infiltration visible in the tissue. In the treatment group, as the dose increased, a small amount of new epidermis was visible in the tissue, and cellular edema was significantly reduced (Kim et al., 2022).
When the tissue was stained with TB (Fig. 10B) as a mast cell marker, the normal group showed a little quantity of mast cell infiltration, and the model group had massive mast cell infiltration and a significantly higher number of mast cells than the normal group. In the positive drug group, the number of mast cells decreased with an increasing dose in the low-dose, medium-dose, and high-dose LEO groups. According to the results of mast cell count, mast cells were significantly higher in the model group than in the blank group, and mast cells were significantly lower in the LEO dose group compared to the model group (Fig. 10E).
3.9 Immunohistochemical staining results
IHC staining results (Fig. 9A) showed that IL-6 and IL-17A were both pro-inflammatory factors, and the brown area of their corresponding staining decreased with increasing doses of IL-6 and IL-17A inflammatory factors when compared with that in the model group. The protein expression level of p-JAK2 was reduced in different doses of LEO compared to the model group, and its staining was lighter in brown color. FOXP3 exhibited increased levels of FOXP3 protein expression and deepened brown staining in different doses of LEO compared to the model group. In Fig. 9B, significant differences in the expression levels of IL-6 (**P < 0.01, n = 3), IL-17A (**P < 0.01, n = 3), p-JAK2 (**P < 0.01, n = 3), and FOXP3 (**P < 0.01, n = 3) can be seen between the LEO high-dose and model group.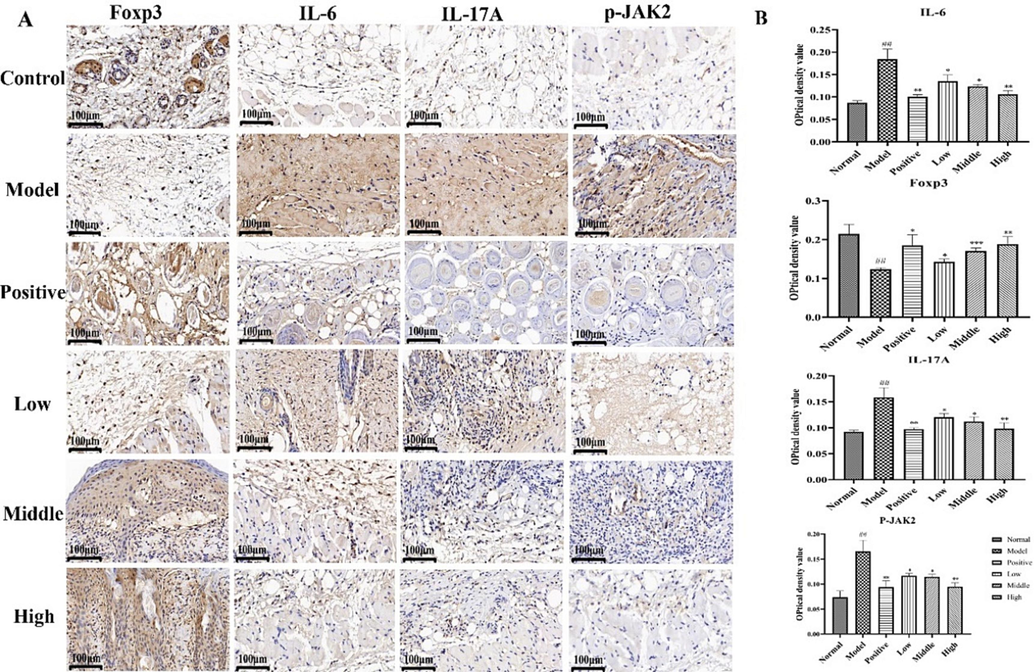
(A)IHC detection of FOXP3, IL-6, IL-17A and p-JAK2 expression in dorsal skin tissues of mice (×400 magnification) (B) Qualitative outcomes of FOXP3, IL-6, IL-17A, and p-JAK2. Data are presented as
± SD, n = 3. ##P < 0.01, ##P < 0.01, ##P < 0.01, ##P < 0.01 vs control; **P < 0.01, **P < 0.01, **P < 0.01, **P < 0.01 vs model group.
3.10 Western blot analysis results
Western blot analysis was performed to determine the protein expression of STAT3 and RORγt, which serve as regulatory factors for Th17 cell differentiation. the expression of p-STAT3/STAT3 (***P < 0.001, n = 3) and RORγt/β-actin (****P < 0.0001, n = 3) was dramatically raised in the model group, and compared with the model group, the LEO high-dose group dramatically reduced the expression of RORγt/β-actin (***P < 0.001, n = 3), p-STAT3/STAT3 (**P < 0.01, n = 3) protein expression (Bai et al., 2020) (Fig. 10C–D).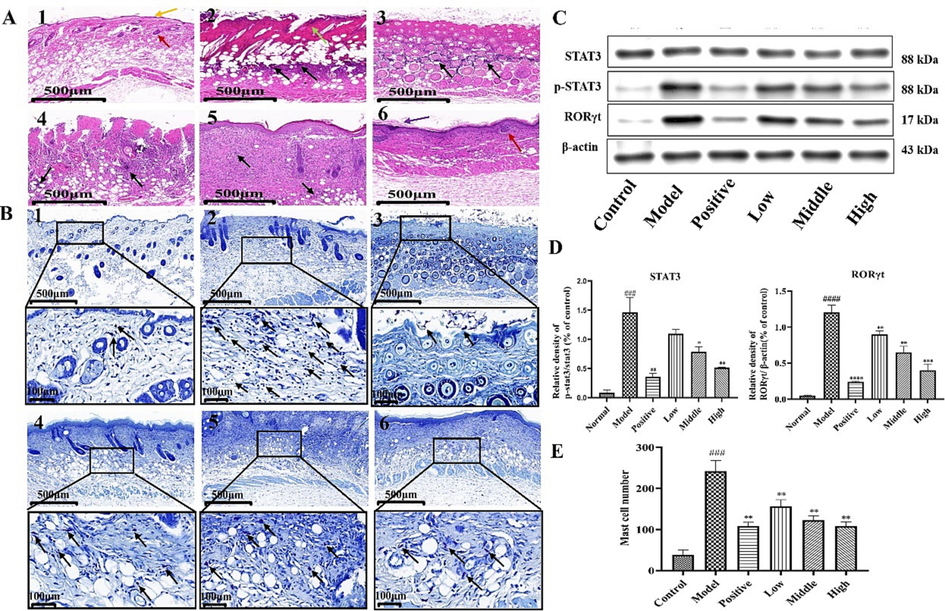
(A) Hematoxylin-eosin staining results of mice skin tissues (×100 magnification, Note 1: normal, 2: model 3: positive drug, 4: low-dose, 5: medium-dose 6: high-dose). As shown in the figure yellow arrow shows the epidermis, red arrow shows the dermal follicle, green arrow shows large necrosis visible in the dermis of the tissue, black arrow shows infiltration of inflammatory cells and purple arrow shows slight thickening visible in the epidermis of the tissue. (B) Toluidine blue staining results, black arrows show mast cells (×100, ×400 magnification). (C) Results of RORγt and STAT3 protein expression and their phosphorylation levels. (D) Quantitative analysis of RORγt/β-actin, p-STAT3/STAT3. Data are presented as
± SD, n = 3. ####P < 0.0001, ###P < 0.001 vs control; ***P < 0.001, **P < 0.01 vs model group. (E) Mast cell counts shown after toluidine blue staining. Data are presented as
± SD, n = 3. ###P < 0.001 vs control; **P < 0.01 vs model group. (For interpretation of the references to color in this figure legend, the reader is referred to the web version of this article.)
4 Discussion
The main causes of AD pathogenesis are immune dysfunction and skin barrier dysfunction, with an imbalance in Th17/Treg cell differentiation being one of the main causes of immune dysfunction (Guan et al., 2022). The high production of the IL-6 protein in AD inhibits Treg cell expression, making it easy for Th17 cells to escape immunosuppression by Treg cells, and antagonizing the inhibitory effect of Foxp3 on RORγt may lead to a decrease in Treg cells and an increase in Th17 cells in AD, thus facilitating the occurrence of an imbalance between Th17 and Treg cells (Ma et al., 2014). Thus, this research was conducted to investigate the mechanism of action of LEO in AD treatment based on the STAT3/RORγt pathway in Th17 cell differentiation in a DNCB-induced dermatitis model in mice. We used LEO to treat the DNCB-induced mice model and measurement of the cytokines IL-6 and TNF-α, as well as HE and toluidine blue staining of the skin epidermis, and immunohistochemistry of the skin tissues to measure IL-6, IL-17A, p-JAK2, FOXP3, and western blot to detect STAT3, p-STAT3, and RORγt protein expression levels. According to the experimental results, LEO inhibits RORγt gene expression by affecting the activation of JAK2 and STAT3 phosphorylation, thus inhibiting the STAT3/RORγt pathway, preventing Th17 cell differentiation, and reducing the expression of cytokines such as IL-17A and TNF-α. In this way, AD has a therapeutic effect. Moreover, LEO inhibits the expression of the RORγt gene by affecting the activation of JAK2 and STAT3 phosphorylation, thereby inhibiting the STAT3/RORγt pathway, preventing Th17 cell differentiation, and the inhibition of IL-17A and TNF-α expression, suggesting that LEO plays a therapeutic role in AD. Foxp3 can also inhibit Th17 cell differentiation by antagonizing RORγt and IL-17A production to achieve a therapeutic effect (Fig. 11).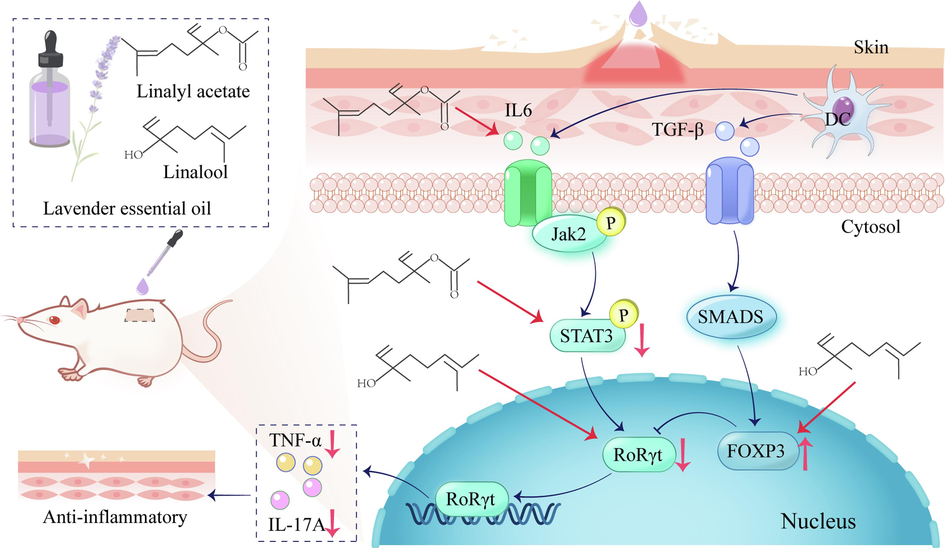
Mechanism of action of LEO in the treatment of AD through modulation of STAT3/RORγt pathway.
To further investigate the role of the active components of LEO in the Th17 cell differentiation pathway, we identified STAT3, IL-6, RORγt, IL-17A, and FOXP3 in this pathway for molecular docking. According to the results of GCMS analysis, the primary components of lavender essential oil are linalool and linalyl acetate. Linalool and linalyl acetate have been reported to possess anti-inflammatory activities, suggesting their potential as anti-inflammatory agents. Additionally, linalool exhibits antibacterial properties and has calming pharmacological effects. Notably, linalool significantly mitigated BV2 microglial inflammation induced by LPS-triggered Nrf2 activation, as well as LPS-induced lung inflammation. (Li et al., 2015). Linalyl acetate alleviated carrageenan-induced inflammatory symptoms caused by paw oedema in mice (Peana et al., 2002). In a more in-depth study, linalool synergised with linalyl acetate significantly ameliorated IMQ-induced psoriasis-like skin inflammation (Rai et al., 2022). Therefore, linalool and linalyl acetate may be critical ingredients of the signaling pathway acting on Th17 cell differentiation. Th17 cell differentiation is initiated by stimulation of specific cytokines including IL-6, IL-21, and TGF-β. Following IL-6-JAK-STAT3 axis–mediated upregulation of the spectrum-defining transcription factor RORγt, Th17 cells produce the hallmark cytokines IL-17A and IL-22 (Yasuda et al., 2019). Linalyl acetate acts with IL-6 and affects the expression of STAT3 phosphorylation. p-STAT3 forms a dimer and enters the nucleus to inhibit the expression of RORγt and other related genes, thereby inhibiting Th17 cell differentiation and reducing the expression of IL-17A and TNF-α (Xu et al., 2022). Linalool also acts on FOXP3, wherein it activates Treg cell expression and immunosuppression of Th17 cells by Treg cells, thereby inhibiting RORγt expression and IL-17A production.
In a deeper exploration of AD's LEO mechanism, we calculated a new coefficient, the weighting factor, by using key parameters such as log P and component content. The weighting factor is not an absolute factor, but a relative content concept. The weighting coefficients for each class of component can indicate the degree of involvement in the pharmacological action. The higher the weighting coefficient, the stronger the affinity for binding between the components (Wang et al., 2021b). Reassessment of the KEGG and GO-BP enrichment analyses using the “weighting factor” contribution scores revealed significant differences. Based on our reordering results, the top three pathways before KEGG pathway sequencing are Th17 cell differentiation, PD-1/PD-L1 in Cancer and Th1 /Th2 cell differentiation. After calculations using the weighting factor method, the three most enriched pathways were Th17 cell differentiation, phosphatidylinositol 3-kinase-protein kinase pathway, and necrotizing apoptosis. The Th17 cell differentiation pathway was ranked first both before and after sorting. The findings suggest that PI3K/AKT inhibitors can reduce IMQ-induced skin inflammation by modulating Notch1 and PI3K/AKT signaling pathways in TH17 cell differentiation (Lin et al., 2022). Therefore, we consider Th17 cell differentiation as a critical pathway in AD treatment.
The Th17 cell differentiation pathway may also regulate the arachidonic acid metabolic pathway, thus playing a Critical role in the pathological changes in AD. The NF-κB pathway in Th17 cell differentiation activates Transcription factor activator protein 1 (AP-1) and CREB-binding protein (CBP/p300), drive the expression of cyclooxygenase-2 (PTGS2), cytoplasmic phospholipase A2 (cPLA2) and membrane-bound prostaglandin E synthase 1 (mPGES-1), thereby promoting arachidonic acid release and prostaglandin production (Jiang et al., 2022). Therefore, arachidonic acid metabolism may be regulated through the Th17 cellular pathway, thereby influencing the therapeutic effects of LEO in AD.
Combining metabolomics and network pharmacology results revealed that multiple genes were enriched in metabolic pathways, implying a possible impact of LEO on metabolic regulation and signaling pathways. By analyzing the results, a total of two related genes, HPGD and PTGS1, were mined. These genes play a role in arachidonic acid metabolism and LA metabolism. Essential fatty acids (EFAs) are components of cell membranes and precursors of immunomodulatory factors that may participate in the inflammatory and immunopathogenesis of AD. In the EFA-deficient state, moisture loss and barrier function of the skin are significantly impaired (Horrobin, 2000). LA is an EFA, while arachidonic acid is an n-2 polyunsaturated 6-carbon fatty acid formed during LA biosynthesis (Hadley et al., 2016). Arachidonic acid is metabolised by three enzymes, namely cyclooxygenase (COX), lipoxygenase (LOX) and cytochrome P450 (CYP450), forming various metabolites that lead to different biological reactions. Cyclooxygenase-1 (PTGS1) is a critical enzyme in the metabolism of arachidonic acid. Arachidonic acid is released from cell membrane–bound phospholipids through phospholipase A2 (PLA2) and converted to prostaglandin-like compounds through PTGS1 and PTGS2. 15-Hydroxyprostaglandin dehydrogenase is the key enzyme for the degradation of prostaglandin E2 (PGE2) (Lehtinen et al., 2012). Direct injection of the prostaglandin-like compound PGE2 into tissues can induce many of the major signs of inflammation, and PGE2 may collaborate with histamine and kinins among other mediators to trigger pain and swelling associated with the inflammatory process. EP3 is a PGE2 specific receptor, and EP3 receptors promote inflammatory responses in the skin through a leukocyte-dependent mechanism (Goulet et al., 2004). Our study found that LA levels and serum levels of arachidonic acid were downregulated in the LEO high-dose group, which may inhibit the occurrence of skin inflammation. In addition, arachidonic acid metabolism plays an important role in skin inflammation. Leukotrienes formed from arachidonic acid are potent pro-inflammatory mediators, and nutmeg extract inhibited 5-lipoxygenase, a key enzyme in the synthesis pathway of arachidonic acid–forming LTs and improved psoriasis-like skin inflammation in mice (Tsukayama et al., 2022).
In conclusion, Lavender essential oil significantly reduced the severity of AD as measured by Th17-related cytokine and protein expression assays and histopathological observations. These results suggest that LEO inhibits the DNCB-stimulated inflammatory response by inhibiting the STAT3/RORγt pathway in the Th17 differentiation pathway to exert a therapeutic effect. While our study demonstrated the inhibitory effect of LEO on the expression of inflammatory cytokines, it is necessary to conduct further research involving larger sample sizes and human samples to validate the efficacy of LEO in treating AD. The correct dosage of LEO is yet to be investigated, with the results of one study showing that LEO was observed to be slightly irritating to the skin at a 10 % therapeutic dose. However, at the 2 % therapeutic dose, skin irritation caused by linalool and linalyl acetate was barely perceptible. By contrast, this study used a high dose of 8 % LEO to demonstrate therapeutic relief of AD symptoms, and further studies can be conducted on the skin irritation of different doses of LEO. Our findings are expected to unravel the possibility of using LEO as a therapeutic agent for AD and provide a scientific basis for its clinical application. This study, therefore, provides a basis for further research into the clinical use of LEO as a treatment option for AD.
Acknowledgement
The authors gratefully acknowledge the financial supports by the National Natural Science Foundation of China (81703720 and 82074026), the National Key Research and Development Program (2021YFD1601004), Project of Shaanxi Provincial Department of science and technology (2022JM-555), Key R & D program of Xianyang City (2021ZDYF-SF-0015), Shaanxi Administration of Traditional Chinese Medicine (ZYJXG-Y23005), Shaanxi Provincial Administration of Traditional Chinese Medicine “Qin Medicine” Development Key Research Project (2021-02-22-014), and Shaanxi University Engineering Research Center of Traditional Chinese Medicine Aromatic Industry.
Declaration of competing interest
The authors declare that they have no known competing financial interests or personal relationships that could have appeared to influence the work reported in this paper.
References
- Lavender essential oil accelerates lipopolysaccharide-induced chronic wound healing by inhibiting caspase-11-mediated macrophage pyroptosis. Kaohsiung J. Med. Sci.. 2023;39(5):511-521.
- [Google Scholar]
- Artesunate attenuates 2, 4-dinitrochlorobenzene-induced atopic dermatitis by down-regulating Th17 cell responses in BALB/c mice. Eur. J. Pharmacol.. 2020;874:173020
- [Google Scholar]
- RCSB Protein Data Bank: powerful new tools for exploring 3D structures of biological macromolecules for basic and applied research and education in fundamental biology, biomedicine, biotechnology, bioengineering and energy sciences. Nucleic Acids Res.. 2021;49(D1):D437-D451.
- [Google Scholar]
- E-prostanoid-3 receptors mediate the proinflammatory actions of prostaglandin E2 in acute cutaneous inflammation. J. Immunol.. 2004;173(2):1321-1326.
- [Google Scholar]
- Adipose-derived stem cells ameliorate atopic dermatitis by suppressing the IL-17 expression of Th17 cells in an ovalbumin-induced mouse model. Stem Cell Res. Ther.. 2022;13(1):98.
- [Google Scholar]
- The essentiality of arachidonic acid in infant development. Nutrients. 2016;8(4):216.
- [Google Scholar]
- Essential fatty acid metabolism and its modification in atopic eczema. Am. J. Clin. Nutr.. 2000;71(1 Suppl):367s-372s.
- [Google Scholar]
- Metabolomics combined with network pharmacology to study the mechanism of Shentong Zhuyu decoction in the treatment of rheumatoid arthritis. J. Ethnopharmacol.. 2022;285:114846
- [Google Scholar]
- Essential oil from Chrysanthemum boreale flowers modulates SNARE protein-linked mast cell response and skin barrier proteins and ameliorates atopic dermatitis-like lesions in mice. Hortic. Environ. Biote. 2022;63(2):287-298.
- [Google Scholar]
- Cytoscape: software for visualization and analysis of biological networks. Methods Mol. Biol.. 2011;696:291-303.
- [Google Scholar]
- 15-Hydroxyprostaglandin dehydrogenase associates with poor prognosis in breast cancer, induces epithelial-mesenchymal transition, and promotes cell migration in cultured breast cancer cells. J. Pathol.. 2012;226(4):674-686.
- [Google Scholar]
- The JAK/STAT/NF-κB signaling pathway can be regulated by rosemary essential oil, thereby providing a potential treatment for DNCB-induced in mice. Biomed. Pharmacother.. 2023;168:115727
- [Google Scholar]
- Linalool inhibits LPS-induced inflammation in BV2 microglia cells by activating Nrf2. Neurochem. Res.. 2015;40(7):1520-1525.
- [Google Scholar]
- Study on hepatotoxicity of rhubarb based on metabolomics and network pharmacology. Drug Des. Devel. Ther.. 2021;15:1883-1902.
- [Google Scholar]
- Integrated metabolomics and network pharmacology to reveal the mechanisms of hydroxysafflor yellow A against acute traumatic brain injury. Comput. Struct. Biotechnol. J.. 2021;19:1002-1013.
- [Google Scholar]
- Notch1/Hes1-PTEN/AKT/IL-17A feedback loop regulates Th17 cell differentiation in mouse psoriasis-like skin inflammation. Mol. Med. Rep.. 2022;26(1)
- [Google Scholar]
- The imbalance of Th17 cells and CD4(+) CD25(high) Foxp3(+) Treg cells in patients with atopic dermatitis. J. Eur. Acad. Dermatol. Venereol.. 2014;28(8):1079-1086.
- [Google Scholar]
- MicroRNA-155 may be involved in the pathogenesis of atopic dermatitis by modulating the differentiation and function of T helper type 17 (Th17) cells. Clin. Exp. Immunol.. 2015;181(1):142-149.
- [Google Scholar]
- Machine learning for synergistic network pharmacology: a comprehensive overview. Brief. Bioinform.. 2023;24(3):bbad120.
- [Google Scholar]
- Research progress on the chemical composition and pharmacological effects of volatile oil of Lavandula officinalis. Chin. Patent Med.. 2022;44(01):170-176.
- [Google Scholar]
- Anti-inflammatory activity of linalool and linalyl acetate constituents of essential oils. Phytomedicine. 2002;9(8):721-726.
- [Google Scholar]
- Anti-psoriatic effect of Lavandula angustifolia essential oil and its major components linalool and linalyl acetate. J. Ethnopharmacol.. 2020;261:113127
- [Google Scholar]
- A combination of linalool and linalyl acetate synergistically alleviates imiquimod-induced psoriasis-like skin inflammation in BALB/c mice. Front. Pharmacol.. 2022;13:913174
- [Google Scholar]
- The effects of lavender essential oil on wound healing: a review of the current evidence. J. Altern. Complement. Med.. 2020;26(8):680-690.
- [Google Scholar]
- Differentiation of T-helper cells in distinct phases of atopic dermatitis involves Th1/Th2 and Th17/Treg. Eur J Inflamm. 2017;15(1):46-52.
- [Google Scholar]
- Malabaricone C derived from nutmeg inhibits arachidonate 5-lipoxygenase activity and ameliorates psoriasis-like skin inflammation in mice. Free Radic. Biol. Med.. 2022;193(Pt 1):1-8.
- [Google Scholar]
- The mechanism action of german chamomile (Matricaria recutita L.) in the treatment of eczema: based on dose-effect weight coefficient network pharmacology. Front. Pharmacol.. 2021;12:706836
- [Google Scholar]
- The mechanism of lavender essential oil in the treatment of acute colitis based on “quantity-effect” weight coefficient network pharmacology. Front. Pharmacol.. 2021;12:644140
- [Google Scholar]
- Modulation of H1R and PAR-2/TRPV1 itch signaling pathways in mice with chronic dermatitis eczema by T-cell-mediated immune homeostasis with skin fresh lotion. Chinese Modern Appl. Pharmacol. 2023:1-9.
- [Google Scholar]
- Xiaoqiong, L., 2022. Purslane alleviates alcohol-exacerbated imiquimod-induced psoriasis-like dermatitis in mice via the PKM2-TH17 pathway PhD. China Medical University.
- Ursolic acid inhibits Th17 cell differentiation via STAT3/RORγt pathway and suppresses Schwann cell-mediated Th17 cell migration by reducing CXCL9/10 expression. Innate Immun.. 2022;28(5):155-163.
- [Google Scholar]
- Th17-cells in atopic dermatitis stimulate orthodontic root resorption. Oral Dis.. 2013;19(7):683-693.
- [Google Scholar]
- The pathogenicity of Th17 cells in autoimmune diseases. Semin. Immunopathol.. 2019;41(3):283-297.
- [Google Scholar]
- GC-MS analysis of volatile oil components of Lavandula officinalis in Xinjiang. Chem. Technol. Dev.. 2021;50(Z1):41-45.
- [Google Scholar]
- Clinical application study of dopriumab in the treatment of atopic dermatitis. Chinese Aesthetic Med.. 2022;31(08):13-17.
- [Google Scholar]
- Study on the ameliorative effect of Qing Dai San topical gel on mice with atopic dermatitis. Chinese Clin. Pharmacol. Therapeutics. 2023;28(01):19-28.
- [Google Scholar]
- Tea saponin extracted from seed pomace of Camellia oleifera Abel ameliorates DNCB-induced atopic dermatitis-like symptoms in BALB/c mice. J. Funct. Foods. 2022;91:105001
- [Google Scholar]


