

Translate this page into:
Danshen ligustrazine injection ameliorates MCAO/R rats through the AhR-SOCS2 axis in association with gut microbiota-derived tryptophan metabolism
⁎Corresponding authors. sunzhi2013@163.com (Zhi Sun), dszyxb@163.com (Shuzhang Du)
-
Received: ,
Accepted: ,
This article was originally published by Elsevier and was migrated to Scientific Scholar after the change of Publisher.
Abstract
Background
Danshen Ligustrazine Injection (DSLI), composed of the extract of Salvia miltiorrhiza Bunge and Conioselinum anthriscoides 'Chuanxiong', is commonly used in the clinical treatment of ischemic stroke, which is the most common type of cerebrovascular disease, affected by multiple factors. The brain-gut axis is a new type of influencing factor for ischemic stroke, however, there is a lack of systematic research on the relationship between microbiota and host metabolic phenotype. This study aimed to investigate the host metabolic phenotype-microbiome interface in ischemic stroke and the immunomodulatory effects of DSLI.
Methods
In the study, liquid chromatography-mass spectrometry was used to primarily analyze the quality markers (Q-markers) and the polyphenols of DSLI. Based on 16S rRNA gene sequencing and metabolomics, the variations of microbial composition in different groups were characterized. In addition, a network diagram was constructed to reveal the interrelationship between DSLI-regulated gut microbiota changes and DSLI-regulated brain metabolites in MCAO/R rats. The expression of the aryl hydrocarbon receptor (AhR) in the colon and brain by immunofluorescence and suppressors of cytokine signaling 2 (SOCS2) by western blot were further detected.
Results
Diminished metabolic diversity and alterations in the tryptophan metabolism pathway were a feature of IS in the study. The results revealed that Clostri_UCG-014 was positively correlated with indoleacrylic acid, indole-3-methylacetate, and Ruminococcaceae was strongly related with L-tryptophan, 3-methylindole, and indole. The results of immunofluorescence showed that the expression of AhR in the colon and brain tissues of rats in the model group was greatly reduced compared with that in the sham-operated group, and was heavily activated with the treatment of DSLI. The levels of aryl hydrocarbon nuclear receptor ARNT2 and SOCS2 were down-regulated in the brains of Model rats, whereas increased by DSLI, further confirming that the brain-gut microbiota-Trp metabolism exists in the pathological changes of stroke and the intervention mechanism of DSLI.
Conclusions
The present study findings suggest Clostri_UCG-014, Ruminococcaceae, and Firmicute_RF39 play an important role in improving the regulation of immune function in stroke through tryptophan metabolites by acting on the AhR-SOCS2 axis.
Keywords
Gut microbiota
Ischemic stroke
Brain-gut microbiota-Trp metabolism
AhR
DSLI

- AhR
-
aryl hydrocarbon receptor
- ARNT2
-
Aryl hydrocarbon receptor nuclear translocator 2
- CNS
-
Central Nervous System
- DSLI
-
Danshen Ligustrazine Injection
- IA
-
indoleacrylic acid
- IS
-
ischemic stroke
- LDA
-
linear discriminant analysis
- LEfSe
-
linear discriminant analysis effect size
- MCAO/R
-
middle cerebral artery occlusion-reperfusion model
- NMDS
-
non-metric multidimensional scaling analysis
- PCA
-
principal component analysis
- PCoA
-
principal coordinate analysis
- PLS-DA
-
partial least squares-discriminant analysis
- SOCS2
-
suppressor of cytokine signaling 2
- TCM
-
Traditional Chinese Medicine
- Trp
-
Tryptophan
- UHPLC-Q-Orbitrap HRMS
-
ultraperformance liquid chromatography-quadrupole/orbitrap high-resolution mass spectrometry
Abbreviations
1 Introduction
Stroke is divided into ischemic stroke (IS) and hemorrhagic stroke, with IS accounting for about 80% of strokes (Barthels and Das, 2020). IS is a disease caused by ischemic necrosis of brain tissue due to cerebrovascular embolism or insufficient blood supply to the brain (Baron, 2018), which results in permanent neurological deficit, dementia, or death. It is now the second leading cause of death and the third most common disabling disease in the world, and early diagnosis and treatment are the keys to reducing neurological damage (Iadecola et al., 2020, Mendelson and Prabhakara, 2021).
With advances in DNA sequencing and bioinformatics, biomedicine has undergone 'transformation'. The biological microbiota, especially the gut microbiota, has entered the central stage of biomedicine (Honda and Littman, 2016), and technology can rapidly identify the microbiota in our body at the genus or species level. Currently, the gut microbiota through the brain-gut axis has been an emerging field of research for stroke (Arya and Hu, 2018, Morais et al., 2021). The gut microbiota has a strong signal transmission with the central nervous system (CNS) via neural, immune, and direct humoral pathways, and in turn, the CNS can alter the intestinal microenvironment by regulating intestinal motility and secretion, which is called a bidirectional brain-gut signaling (Li et al., 2023). there is increasing evidence that the gut microbiota regulate brain development, function and behavior (Cryan et al., 2020). However, the effect of stroke on the composition or function of microbiota, and the mechanism of the “bottom-up” gut-brain axis regulation of stroke by the flora, is not clear.
DSLI, composed of the extract of Salvia miltiorrhiza Bunge and Conioselinum anthriscoides 'Chuanxiong', is commonly used in the clinical treatment of IS (Ye et al., 2021). In the work, the material basis of DSLI was clarified. The ultraperformance liquid chromatography-quadrupole/orbitrap high resolution mass spectrometry (UHPLC-Q-Orbitrap HRMS) was employed to quickly identify the main chemical components and achieve accurate quantification of DSLI, which established an analytical method for determining the main content of ligustrazine, danshensu, and other polyphenols components, such as salvianolic acid A, succinic acid, rosmarinic acid, protocatechuic aldehyde and caffeic acid, laying the foundation of its material quality. The work disclosed that danshensu and ligustrazine are the Q-markers of DSLI. In addition, it should be noted that DSLI also contains large amounts of phenolic compounds, such as salvianolic acid A, succinic acid, rosmarinic acid, protocatechuic aldehyde and caffeic acid. Salvia miltiorrhiza and Chuanxiong are the classic medicine pairs for the treatment of IS. The two, one bitter, one pungent, one cold and one warm, enter the heart and liver meridian together, multiplying the effect of promoting blood circulation and removing blood stasis (Zuo et al., 2020). Ligustrazine, as a characteristic component of Ligusticum chuanxiong, has the pharmacological effects of protecting endothelial cells, anti-platelet aggregation and regulating blood lipids. Danshensu, one of the main active components of Salvia miltiorrhiza polyphenols, exerts its pharmacological activity by expanding coronary artery expansion, inhibiting thrombosis, eliminating inflammation and enhancing neuroprotective function. Accumulating evidence demonstrates that microbiota is closely related to the pharmacological activities of polyphenols (Loo et al., 2020, Zhang et al., 2023). On the one hand, the polyphenols are converted into various metabolites by microorganisms to improve bioavailability; On the other hand, the polyphenols can also regulate the composition of microbiota by inhibiting the growth of harmful bacteria and promoting the growth of beneficial bacteria. In general, the microecosystem may be an important pathway for polyphenols to play a role in the treatment of cardiovascular diseases.
According to the study of the Chinese National Stroke Database, 70% of IS patients have been treated with traditional Chinese medicine (TCM). In the early stage of our research, the UHPLC-Q-Orbitrap HRMS was conducted to profile metabolome of brain tissue in middle cerebral artery occlusion-reperfusion model (MCAO/R) rats, which showed DSLI anti-stroke is closely related to tryptophan (Trp) metabolism (Zhou et al., 2021), revealing that Trp and its indole derivatives in brain were significantly different between Sham-operated and Model, Model and DSLI groups. Endogenous ligands such as 3-indoleacrylic acid, 3-methylindole, and indole have been characterized as AhR ligands (Sun et al., 2020). It is worth noting that tryptophan is an essential and the only amino acid containing an indole structure. In contrast, the indole pathway of tryptophan metabolism occurs in the regional lineage of the gut microbiota, which suggests that the axis of brain-gut microbiota-Trp metabolism runs through the pathological changes of stroke and the intervention mechanism of DSLI. Therefore, it is important to assess the gut microbiota-related metabolic phenotype alterations in the brain, to further understand the pathophysiological mechanism of stroke and explore the role of gut microbiota in the development of stroke.
A growing body of literature suggests that tryptophan catabolites generated by the gut microbiota are important signaling molecules in microbial communities (Roager and Licht, 2018). AhR is a transcription factor widely expressed by cells in the immune system, which has been reported to induce the expression of SOCS2 in B cells, interfering with NF-κB activation (Rothhammer et al., 2016). Moreover, in-depth molecular studies have established that AhR inhibits NF-κB activation in astrocytes through a SOCS2-dependent mechanism (Rothhammer et al., 2018, Barroso et al., 2021). Cytokine Signaling 2 (SOCS2) promotes hippocampal neurogenesis and survival of newborn neurons in the brain and regulates anti-inflammatory responses in the periphery (Basrai et al., 2016, Zheng et al., 2018). Thus, the discovery of tryptophan catabolites as AhR ligands may provide new insight into how microbial metabolites affect the immune system in the stroke.
The current research on gut microbiota and stroke is insufficient to explain the relationship between microbiota and specific metabolites. It is imperative and essential to combine metabolomics, 16S rRNA gene sequencing, and bioinformatics to conduct correlation analysis on gut microbiota compositions, microbiota metabolites, and host metabolisms, exploring the intrinsic link between gut flora, host metabolic Trp, and its microbiota metabolites in stroke disease. In addition, the morphological characteristics of the colon in MCAO/R rats were observed by HE staining in groups, and the expression of AhR in the colon, hippocampus, and cerebral cortex and the levels of ARNT2 in brain by immunofluorescence was analyzed, to confirm the hypothesis. The present research sheds light on the pathogenesis of IS from brain-gut axis perspective and facilitates the development of probiotics produced from dietary tryptophan metabolism, which help us unravel the pathological mechanism of stroke, indicating recovering the homeostasis of gut microbiota and Trp-indole derivatives would be beneficial to the recovery of the IS (Fig. 1). The plant name has been checked with MPNS http://mpns.kew.org.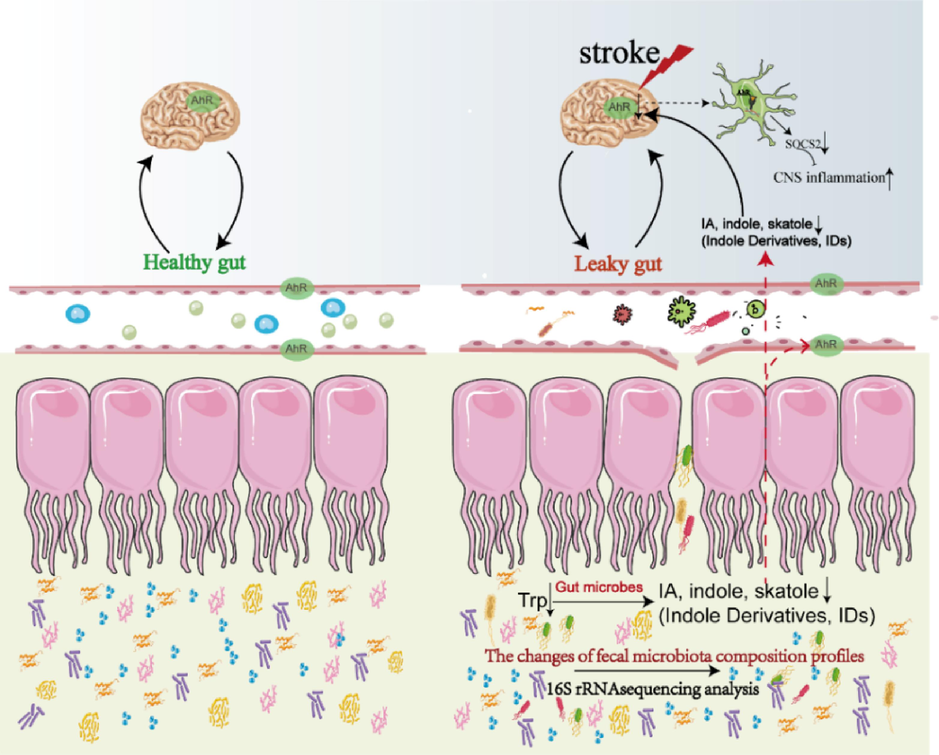
Healthy gut and the Leaky gut of Stroke.
2 Materials and Methods
2.1 Chemicals and reagents
DSLI was acquired from Jilin Pharmacy. Chemical standards for MS/MS analysis of predicted metabolites were obtained from Sigma-Aldrich (St.Louis, MO, United States). HPLC grade acetonitrile and methanol were obtained from Fisher Scientific (Fair Lawn, NJ, United States). HPLC-grade formic acid was purchased from Aladdin Industrial Co., Ltd. (Shanghai, China). Ultra-pure water (18.2 M) was prepared daily by a Milli-Q water purification system (Millipore, Shanghai, China). All solutions were filtrated by 0.22 µm pore size filters before use.
2.2 Chromatographic conditions and mass spectrometric conditions of DSLI
After experimental investigation, DSLI was diluted 1000-fold with 50% methanol–water for the determination of ligustrazine, 100-fold for the determination of danshensu, and 10-fold for the determination of succinic acid, salvianolic acid A, rosmarinic acid and protocatechuic aldehyde; caffeic acid was determined by taking the original liquid of DSLI. The stock standard solutions of the seven reference standards were dissolved in 50% methanol water with concentration of 1.0 mg/mL for each compound, respectively. Each stock solution was mixed with 50% methanol to prepare a final mixed standard solution, and a series of working standard solutions were prepared by the successive dilution of the mixture of standard solutions. All the solutions were filtered through a 0.22 μm syringe filter and stored at 4 °C before use.
The parameters of HPLC condition were as follows: column, ACQUITY UPLC BEH C18 (2.1 mm × 100 mm, 1.7 μm); column temperature: 40 °C; mobile phase A: ultrapure water with 0.1% formic acid; mobile phase B: acetonitrile; flow rate: 0.2 ml/min. The specific mobile phase changes were as follows: 0–1 min, 5% B; 1–9 min, 5% B-100% B; 1–11.5 min, 100% B, 11.6 min-13 min, 5% B; injection volume, 5 μL.
Mass spectrometry conditions: the HESI source (heated ESI) was used in this experiment, and the auxiliary gas and ion transport tube temperatures were 300 and 320 °C, respectively. The auxiliary gas flow rate was 10 arb. In positive ion mode: sheath gas flow rate of 40 arb and spray voltage of 3.50 kV; in negative ion mode: sheath gas flow rate of 38 arb and spray voltage of 2.80 kV. The full MS/ddMS2 mode was employed for the simultaneous scanning of positive and negative ions, which includes two events: one first-level (resolution of 70,000 FWHM) full scan and one data-dependent (resolution of 17,500 FWHM) second-level scan. The m/z scan range is 80 to 1200.
2.3 Experiment animals
Male Sprague-Dawley rats (250–280 g) were procured from the experimental animal center of Zhengzhou University. Before the experiment, animals were kept in a climate-controlled room (25 ± 2 °C) with a relative humidity of 60%±5% under 12-h day/night cycles and fed with hydration/nutrition ad libitum for at least 1 week. Rats received irradiated, nutritionally balanced, and pelleted rodent diet and filtered tap water, fed once at a fixed time daily. The ingredients of the pelleted rodent diet include corn, wheat, soybean meal, soybean oil, rock flour, fish meal, calcium hydrogen phosphate, vitamins, and minerals. Before the modelling/sacrifice rats were fasted overnight. All animal experiments fell in line with obligations approved by the Ethics Committee of the National Institute of Health (NIH) and implemented following the guidelines for the Care and Use of laboratory animals of Zheng Zhou University(2022-KY-1242–002).
2.4 Cerebral ischemia/reperfusion model and drug administration
The MCAO/R rat model was induced by the intraluminal technique according to the method of originally described by Longa et al (Longa et al., 1989). The detail model operation refers to our previous experiments described in studies (Zhou et al., 2019). Rats were randomly divided into three groups: Sham-operated (Sham), Model (MCAO/R), and DSLI groups. Rats in the Model and DSLI group received MCAO/R surgery, while in the Sham-operated group arterial exposure and isolation without insertion. DSLI, a mixture of salvia miltiorrhiza extract and ligustrazine, was administered intravenously at a concentration of 0.16 ml/100 g for 7 days in DSLI groups (the experiments dosage derived from clinically equivalent dose), which is widely used in China to treat occlusive or ischemic diseases of the cerebrovascular or cardiovascular system. Rats in Sham-operated and Model groups were intravenously administered with the corresponding volume of 0.9% saline in the same way. After 2 h ischemia followed by 24 h reperfusion, rats were sacrificed, at the same time brains were quickly removed and feces samples were obtained for 16S rRNA gene sequencing analysis.
2.5 Metabolomics analysis of brain samples
0.5 g brain tissue samples were homogenized with triple volume saline (w/v) by centrifugation (3,000 × g, 10 min, 4 °C), with supernatant separated and stored at −80 °C for reserve. On performing analyses, sample of 100 ml was mixed with 300 µL methanol containing 500 ng/ml ketoprofen and 50 ng/ml 2-chloro-Lphenylalanine as internal standard centrifuged at 13,000 × g for 10 min at 4 °C. Thereafter, 5 μL aliquot of the supernatant was injected into UHPLC-Q-Orbitrap HRMS for metabolomics analysis. The conditions of UHPLC-Q-Orbitrap HRMS were the same as those used in our previously established protocol, The metabolomics data were analyzed according to the method described previously (Zhou et al., 2021). Heatmaps were developed through the heatmap pack within R (Version 3.6.3).
2.6 Analysis of intestinal microbiota
DNA extraction and PCR amplification of 16S rRNA V3-V4 region.
High-purity genomic DNA was extracted from stool samples adopting E.Z.N.A.® Soil DNA Kit (Omega Bio-Tek, USA) according to the manufacturer’s protocols, the quality of DNA was detected by 1% agarose gel electrophoresis, and DNA concentration and purity were determined by NanoDrop 2000. The V3 + V4 sequenced regions of the 16S rRNA gene were amplified by PCR with the primers 338F(5′-ACTCCTACGGGAGGCAGCA-3′) and 806R (5′-GGACTACHVGGGTWTCTAAT-3′). The PCR amplified product was recovered from 2% agarose gel, purified by using the AxyPrep DNA Gel Extraction Kit (Axygen Biosciences, Union City, CA, USA), and quantified with Quantus™ Fluorometer (Promega, USA). Purified amplicons were sequenced on an Illumina MiSeq PE300 platform (Illumina, San Diego, USA). The raw 16S rRNA gene sequencing reads were quality-filtered, merged and then the filtered sequences were clustered into operational taxonomic units (OTUs) with a threshold of 97% sequence similarity. Alpha diversity of samples was analyzed by software platform: Uparse (version7.0.1090) and R (version 3.3.1) software. Beta diversity analysis was performed using the Bray-Curtis algorithm of ‘QIIME’ and R (version 3.3.1) software to compare the similarity of species diversity in different samples.
2.7 Correlation profiling between the metabolites and gut microbiota
Linear discriminant analysis effect size (LEfSe) was performed to compare the microbial composition, which employs linear discriminant analysis (LDA) to identify communities that have markedly different effects on sample partitioning, screening out the significant biomarkers among groups. The LDA score was obtained by LDA analysis. The higher the LDA score, the greater the impact of species abundance on the difference effect. In this work, the LDA score > 3.5 and p < 0.05 were set to screen the differential flora among groups.
Spearman correlation analysis was conducted between perturbed gut microbes screened from 16S rRNA gene sequencing analysis and the reversed metabolites by DSLI filtered from brain metabolomics. The criteria for screening correlation coefficient was set as |r| > 0.50 (*p < 0.05), and then a cooccurrence network was constructed based on Spearman correlation analysis (|r| > 0.50, **p < 0.01). The nodes represent the screened microbiota or altered metabolites, and the lines between the nodes indicate the biological relationships between altered metabolites and perturbed gut microbes. The solid lines indicate a positive correlation while the dotted indicate a negative correlation. Eventually, the relationship between altered metabolites and gut microbes was obtained and displayed as network diagrams. Clustering correlation heatmap with signs and correlation network were performed using R (version 3.6.3) and the OmicStudio tools at https://www.omicstudio.cn.
2.8 Collection of the colons
After the execution of the rat, the abdominal cavity was quickly opened along the midline of the abdomen, and the colon tissue was taken from 1 cm above the anus, spread naturally on an ice bag to measure the length of the colon and photographed. The intestinal cavity was washed with pre-cooled phosphate buffered salt solution PBS and the excess water was blotted off on filter paper, and then the colon was weighed on an electronic balance and the bowel length index was calculated. Bowel length index = mass of colon (g) / length of colon (cm) × 100%. PBS buffer, the most widely used buffer in biochemistry research, the main components are Na2HPO4, KH2PO4, NaCl, and KCl. It is generally used as a solvent and plays a role in the dissolution of protective reagents.
2.9 Histopathological examination of colon
The colons were collected and fixed in 10% PBS-buffered formalin for 48 h then embedded in paraffin wax. Five-μm-thick sections were stained with hematoxylin and eosin (H&E), to observe the histopathological changes of colons in different groups.
2.10 IL-17 immunohistochemistry examination of colon
Tissues are typically cut into 4–6 mm slices and fixed in a solution of dewaxing liquid, and afterward tissues are dehydrated in a series of steps using ethanol. Antigen repair citric acid buffer was used for antigen repair. To block endogenous peroxidase, the slides were placed in 3% hydrogen peroxide solution and incubated for 25 min at room temperature, protecting from light, and then the slides were placed in PBS (PH 7.4) on a decolorization shaker and washed 3 times for 5 min each time with shaking. Further tissue slides were covered with 3% BSA dropwise, blocking at room temperature for 30 min. Gently shake off the blocking solution, and the sections are incubated overnight at 4 °C in a wet box with IL-17 primary antibody (Servicebio, GB11110-1) diluted at a dilution of 1:500. After washing the sections with PBS, the tissues were covered with HRP-labeled goat anti-rabbit secondary antibody and incubated at room temperature for 50 min, and finally the tissues were visualized with DAB chromogenic solution.
2.11 Immunofluorescence staining of AhR and ARNT2
The colons and brains were removed quickly when rats were sacrificed. Tissues were washed with PBS and embedded in OCT, then frozen at −80 °C for sectioning. Frozen sections were baked in an oven at 37 °C for 10–20 min to control moisture. The sections were then fixed in paraformaldehyde for 30 min and dried in air. Subsequently, the tissue sections were placed in a repair cassette filled with citric acid antigen repair buffer (pH 6.0) and subjected to antigen repair in a microwave oven. Next we drew circles around the tissue to prevent antibodies from flowing away, spun off PBS, added BSA dropwise, and blocked for 30 min. Gently shaked off the blocking solution, the colons and brains sections were incubated with AhR antibodies (Santa Cruz SC-133088, USA) at a dilution of 1: 100 at 4 °C overnight, and ARNT2 antibody (Santa Cruz SC-393683, USA) was incubated at the same dilution in brain sections only. The slices were washed slides three times with PBS (pH 7.4) in a rocker device, covered objective tissue with secondary antibody and incubated for 50 min at room temperature in the dark. Then the slides were washed again and incubated with DAPI solution for 10 min at room temperature and kept in the dark. Subsequently, added spontaneous fluorescence quenching reagent to incubate for 5 min. Then the slices were observed under the fluorescence microscope and the images were acquired.
2.12 Western blotting analysis
The total protein of brain tissues on the ischemic side was extracted, and western blotting analysis was conducted as described previously (Zhou et al., 2019). In brief, equal quantities of protein samples (60 µg) were loaded into SDS-PAGE and transferred to PVDF membranes. Membranes were incubated with primary antibody SOCS2 (dilution 1:1000, #2779; CST, Danvers, MA, USA) overnight at 4 ℃. Subsequently, the membranes were incubated for 1 h at room temperature with secondary antibodies coupled to horseradish peroxidase (1:2000 dilution, Servicebio, China), The band intensity was quantified by densitometry with ImageJ software.
2.13 Statistical analysis
The data were statistically analyzed by SPSS software and expressed as means ± standard deviation or means ± standard errors. Comparative analyses were performed by the One-way ANOVA test or Kruskal-Wallis rank sum test. p < 0.05 was deemed to convey statistical significance.
3 Results
3.1 Qualitative and quantitative analysis of DSLI
In the work, the contents of ligustrazine, danshensu, succinic acid, salvianolic acid A, rosmarinic acid and protocatechuic aldehyde and caffeic acid in DSLI are listed in Table 1, including the regression equation, coefficient of determination (R2) and linear range. The information on the qualitative analysis of DSLI is presented in Table 2. The total ion chromatograms (TIC) of DSLI diluted 1000 × is shown in Fig. 2. Note: * represents the components confirmed by comparison of the standards
Compounds
Regression equations
R2
Linearity and range/μg·ml−1
ρ/μg·ml−1
DSLI/μg·ml−1
Ligustrazine
Y = 1.5705E + 09ρ + 6.7978E + 09
0.9992
3–30
12.3537
12353.76
Danshensu
Y = 1.0088E + 08ρ + 3.0019E + 06
0.9997
0.6–6
3.6767
367.67
Salvianolic acid A
Y = 5.4212E + 07ρ – 6.2639E + 07
0.9995
3–30
6.3931
63.93
Protocatechuic aldehyde
Y = 1.4217E + 08ρ + 4.0567E + 06
0.9996
0.8–8
5.2158
52.16
Rosmarinic acid
Y = 3.7366E + 07ρ + 5.5477E + 06
0.9995
0.8–8
4.2175
42.18
Succinic acid
Y = 5.4273E + 07ρ + 5.5557E + 06
0.9996
0.8–8
5.3266
53.26
Caffeic acid
Y = 4.8996E + 07ρ + 2.1974E + 06
0.9989
0.8–8
1.9684
1.97
No.
Compound
Formula
Ion mode
tR/min
[M−H]−/[M + H]−
Error(ppm)
Fragment ions(m/z)
Measured
Predicted
1
5-hydroxymethylfurfural
C6H6O3
+
1.55
127.0389
127.0390
−0.787
109.03, 81.03, 53.04
2
Betaine
C5H11NO2
+
1.31
118.0868
118.0862
5.084
118.09, 59.07
3*
Protocatechuic aldehyde
C7H6O3
–
4.18
137.0241
137.0244
−2.190
119.01, 108.02, 109.03
4*
Succinic acid
C4H6O4
–
1.75
117.0192
117.0193
−0.854
100.92, 73.03
5*
Danshensu
C9H10O5
–
2.84
197.0456
197.0450
3.046
179.03, 151.04, 135.04, 123.04
6*
Caffeic acid
C9H8O4
–
1.90
179.0344
179.0349
−2.793
135.04, 117.03, 107.05
7*
Ligustrazine
C8H12N2
+
4.13
137.1075
137.1074
0.730
122.08, 80.05
8*
Rosmarinic acid
C18H16O8
–
5.28
359.0775
359.0772
0.836
197.04, 161.02, 133.03
9*
Salvianolic acid A
C26H22O10
–
5.71
493.1147
493.1140
1.420
295.06, 185.02
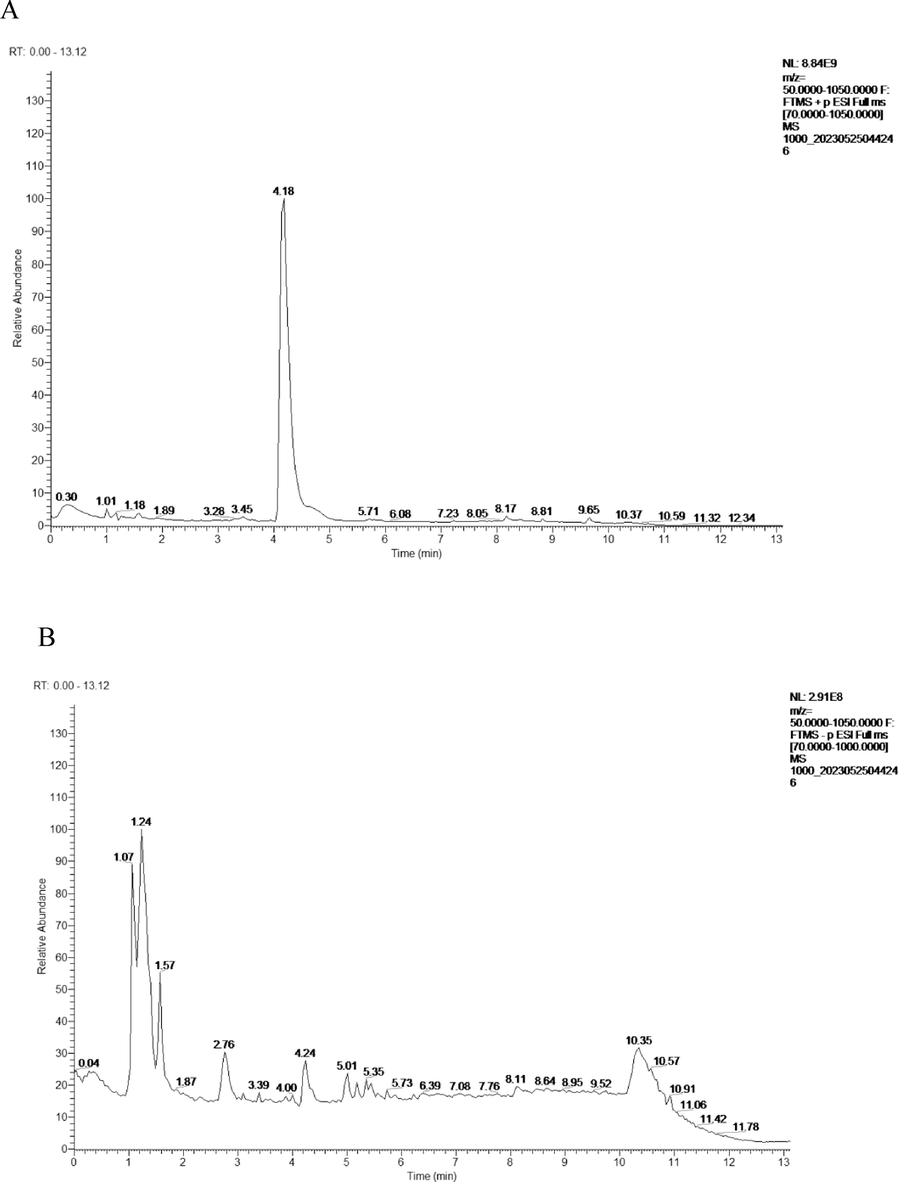
The total ion chromatograms (TIC) of DSLI (A) diluted 1000 × in positive mode (B) and negative mode.
3.2 Cerebral ischemia/reperfusion model
The Fig. 3 below shows the monitoring results of the MCAO reperfusion model by the laser speckle blood flow imaging system.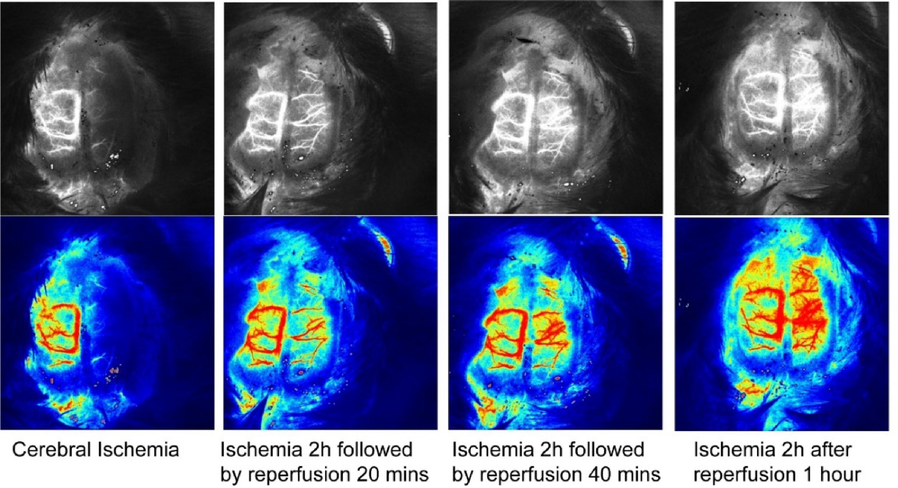
Blood flow monitoring at different reperfusion time points in MCAO/R model by the laser speckle blood flow imaging system.
3.3 Brain metabolic profiling reversed by DSLI in MCAO/R rats
A heat map was applied to reveal the change direction of the selected metabolites discriminators by R (version 3.6.3) software. Regarding brain metabolomics, significant metabolic differentiation was observed in groups, 17 metabolites were identified to be significantly restored by DSLI, in which the levels of 7 different metabolites screened out were remarkably decreased, and those of 10 metabolites were notably increased by DSLI compared to the Model group. The DSLI-administrated group was shown to induce substantial metabolic changes. Among these metabolites, the results showed that nearly 1/3 metabolites screened were involved in tryptophan metabolism, which aroused our great interest. Trp and its indole derivatives, 3-Methylindole, indole, indole-3-methyl acetate, indoleacrylic acid, were notably decreased in MCAO/R group compared with the sham-operated group, while DSLI significantly up-regulated those indole derivatives. In Fig. 4, the brain levels tryptophan and its indole derivatives were greatly diminished in MCAO/R rats, while DSLI administration can prominently restore the level of tryptophan and its metabolites. Tryptophan is an essential amino acid and the only amino acid containing an indole structure, which is metabolized to indole derivatives by enzymes produced by the gut microbiota, suggesting that DSLI may play its intervention role against MCAO/R by targeting gut microbiota to regulate the differential metabolism and exert a therapeutic effect.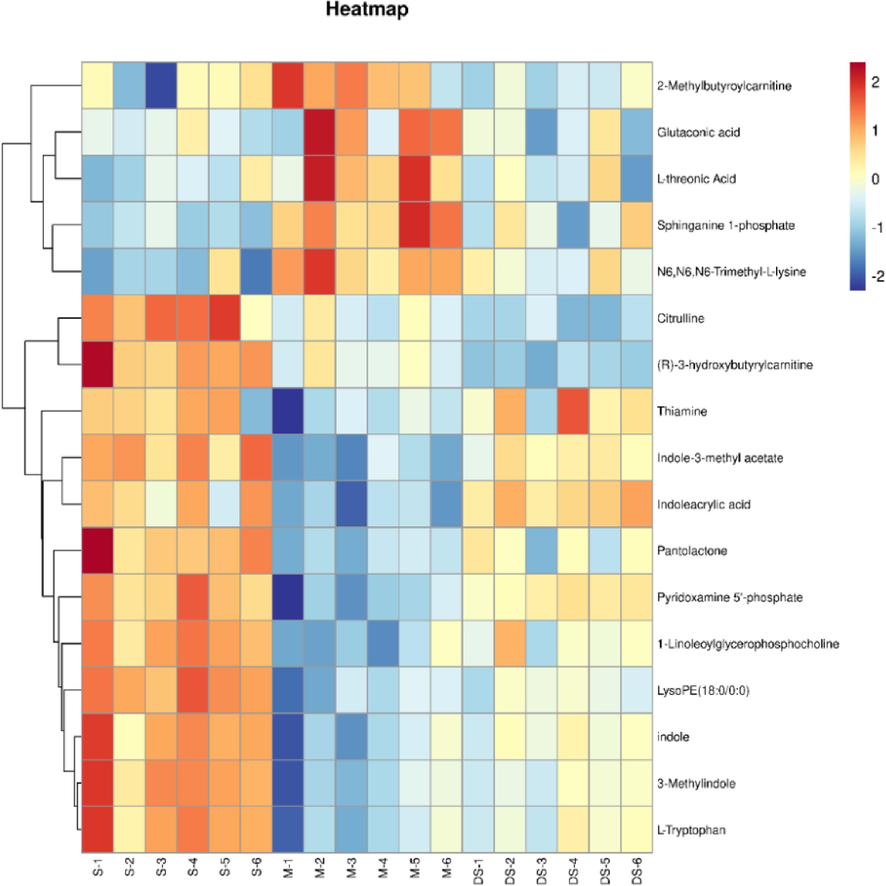
Discovery and characterization of the key differential metabolites with metabolomics assay. Heatmap overview of differential metabolites using the student’s t-test in the brain throughout Sham, Model, and DSLI groups.
3.4 Sequence diversity analysis
Fecal microbiota composition profiles were analyzed by the 16S rRNA gene sequencing (Fig. 5). Bioinformatics statistical analysis was performed on OTU clustering results at 97% similarity level, and the phylum-level TOP5 species include: Firmicutes, Bacteroidota, Proteobacteria, Actinobacteriota, Campilobacterota; The family-level TOP5 species include: Muribaculaceae, Lachnospiraceae, Lactobacillaceae, Prevotellaceae, Oscillospiraceae.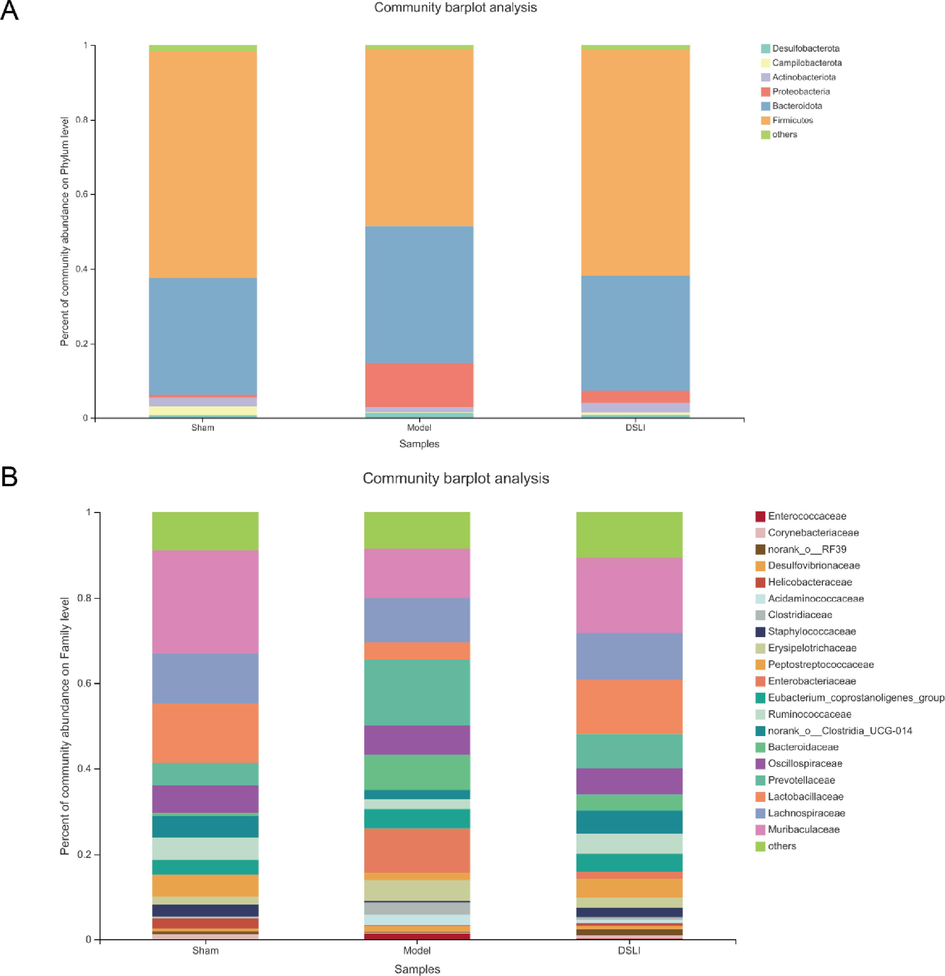
Longitudinal changes in microbial diversity in different groups. (A) Microbial composition of each group at the phylum level (B) Microbial composition of each group at the family level.
Alpha diversity refers to the diversity within a specific area or ecosystem. Rarefaction curves were used to evaluate the sequencing depth. Rarefaction index sobs and Shannon curves become flatter with increasing sample sequencing data, indicating that the sequencing data is basically saturated and covers most of the species and diversity information of the gut microbiome community (Fig. 6). Meanwhile, the Sobs and Shannon indices that reflect community richness and diversity respectively were observed at species level. Compared with the sham group, the sobs index of gut microbiota in the model group was significantly decreased (p < 0.01), and the richness of gut microbiota in the DSLI group was remarkably higher than that in the model group (p < 0.05). the Shannon index in the model group notably declined compared to the sham group (p < 0.05), while the diversity of gut microbiota in the DSLI group showed no significant difference compared with the model group.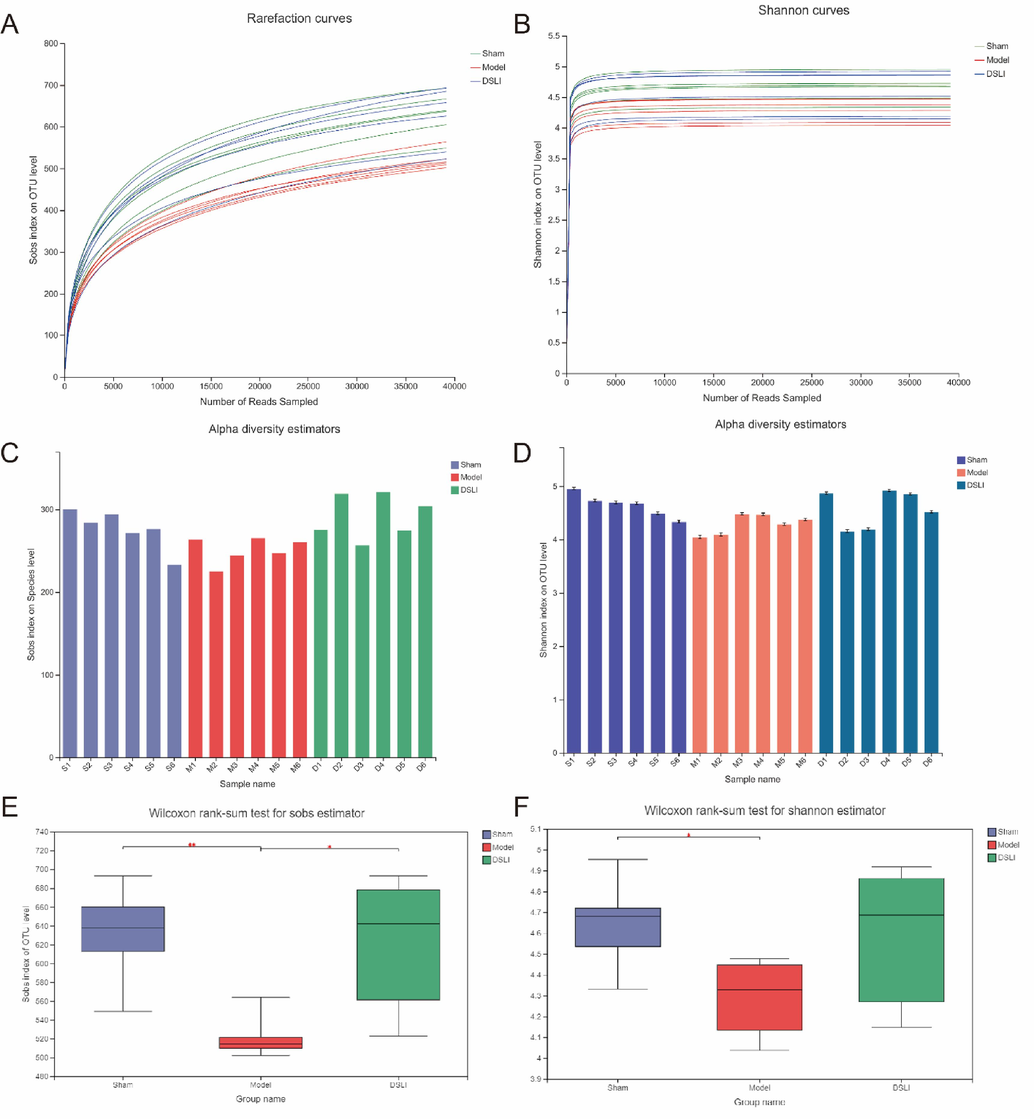
Fecal microbiota diversity based on 16S rRNA gene sequences. (A) Sobs index of rarefaction curves (B) Shannon index of rarefaction curves (C) Bacterial richness, here presented by Sobs indices at species level (D) Diversity analysis of intestinal flora in each group of samples at Shannon index species level (E) Wilcoxon rank-sum test for Sobs index of OUT level in groups (F) Wilcoxon rank-sum test for Shannon index of OUT level in groups.
3.5 Effects of cerebral ischemia on the composition of gut microbiota in rats
To further analyze the differences in gut microbial composition, the abundance of microbiota in the Sham-operated, Model, and DSLI group were classified and visualized at the levels of phylum, family and genus, as shown in Figs. 7-8. At the phylum level, the gut microbiota in the three groups can be mainly classified into seven phyla, among which the relative abundance of Firmicutes, Bacteroidota, and Proteobacteria are the dominant bacteria of fecal samples, accounting for more than 90% of the total sequence. In addition, there are relatively small phyla such as Actinobacteriota, Desulfobacterota, Campilobacterota, etc. Among the three dominant bacterial phyla, Firmicutes occupies the most dominant position in the classification of samples, with a relative degree of more than 45%; Bacteroidota was rated number two, with a relative abundance of more than 30%. Proteobacteria ranked third, with 11.90% in the MCAO/R group, but only 0.79%, and 3.17% in the sham-operated group and DSLI group, respectively. The relative abundances of the three groups of samples are shown in Fig. 7.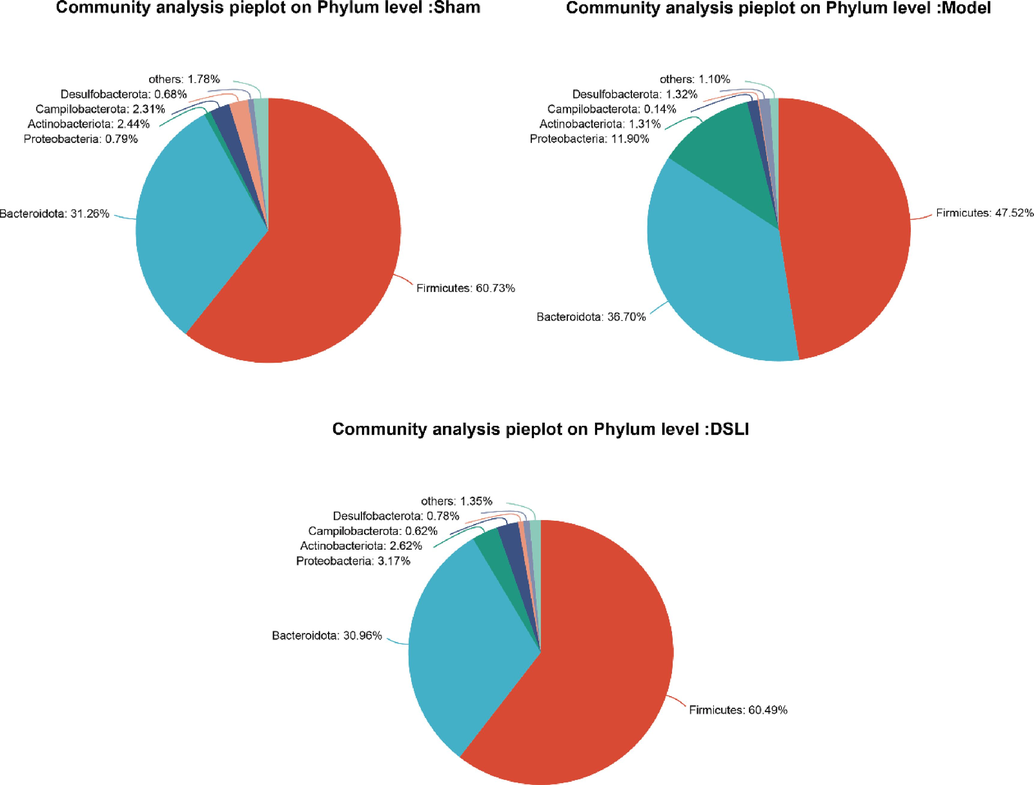
Community types of the gut microbiota. Pie charts show the proportion of reads in each phylum for sham-operated, MACO/R, and DSLI groups.
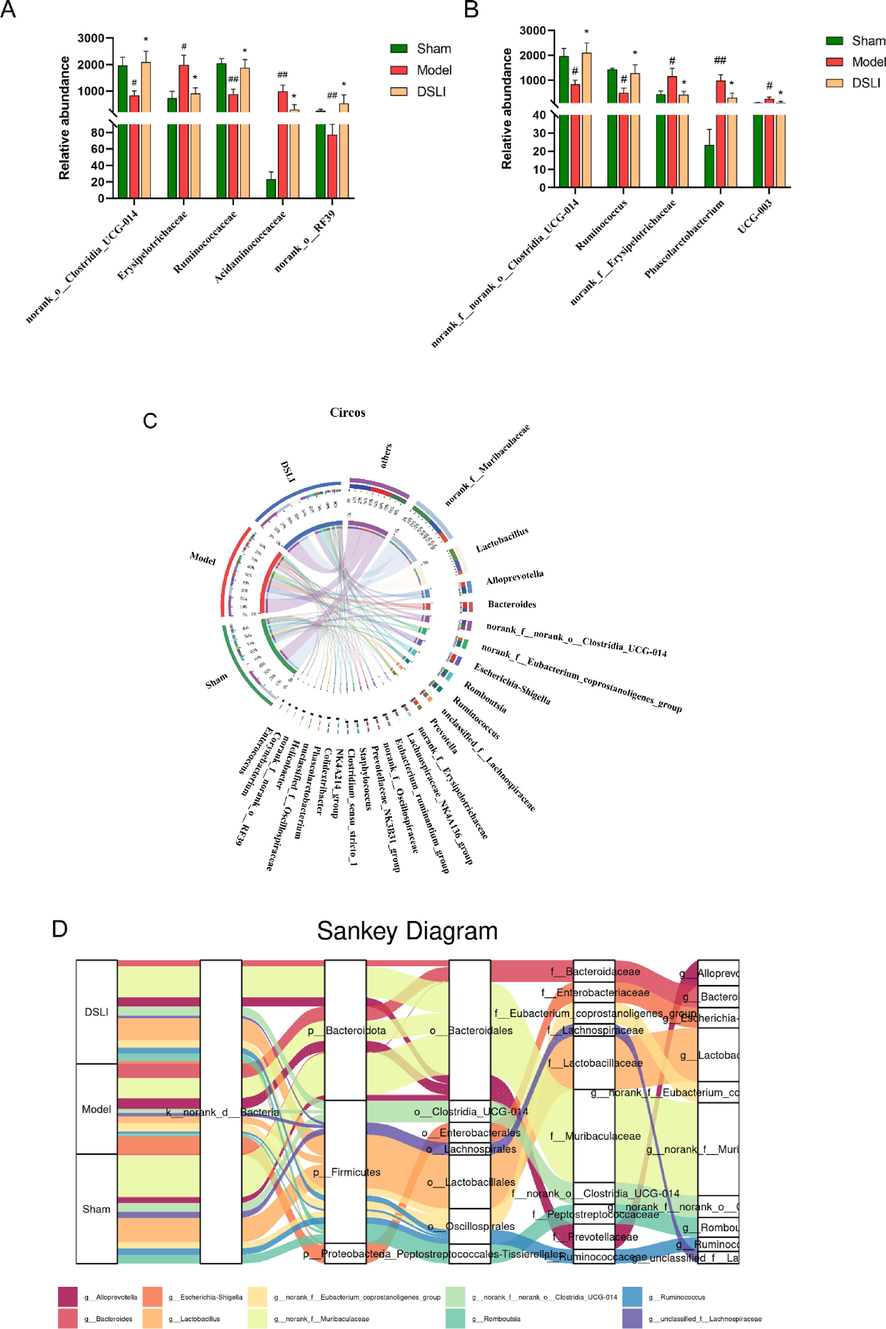
Gut microbial composition of rats at the family and genus levels (A) Comparison of relative abundance at the family level and (B) at genus level among the three groups (C) Circos chart visualization of the distribution ratio of the dominant genus in groups (D) Interactive information visualization of Sankey diagrams at phylum-class-family-genus-species level. Data are presented with means and standard errors (##p < 0.01, #p < 0.05 versus Sham group; *p < 0.05 versus model group, Wilcoxon rank-sum test).
At the family level, the microbiota of rats in the Sham-operated, Model and DSLI group mainly classified into 20 families, among which Muribaculaceae, Lachnospiraceae, Lactobacillaceae, Prevotellaceae, Oscillospiraceae, Bacteroidaceae, Clostridia_UCG-014, Ruminococcaceae, Enterobacteriaceae occupied relative higher abundance. The Kruskal-Wallis rank sum test was adopted to identify the differences in gut microbial communities at the family levels. The Model group showed a lower proportion of Ruminococcaceae, Clostridia_UCG-014, and RF39 than that of the Sham-operated group, while the relative abundances of Erysipelotrichaceae and Acidaminococcaceae were significantly increased. With the intervention of DSLI, the abundances of Ruminococcaceae, Clostridia_UCG-014, and RF39 were remarkably augmented (p < 0.05), and the relative abundance of Erysipelotrichaceae Acidaminococcaceae was notably down-regulated.
At the genus level, the difference analysis of gut microbiota at the genus level by Kruskal-Wallis rank sum test was consistent with family data: the relative abundance of Clostridia_UCG-014 and Ruminococcus materially diminished in the Model group (p < 0.05), yet the relative abundances of Erysipelotrichaceae, Phascolarctobacterium, and Prevotella UCG-003 were higher than Sham-operated group (p < 0.05). DSLI can remarkedly reverse the trend of dysbiosis induced by MCAO/R (Fig. 8B). Meanwhile, the Circos diagram at the genus level was used to visualize the distribution proportion of each dominant species in different groups, as shown in Fig. 8C. It can be concluded that Muribaculaceae, Lactobacillus, Clostridia_UCG-014, Romboutsia are more abundant in the Sham-operated and DSLI groups, with lower proportion in the Model group; while Alloprevotella, Bacteroides, Escherichia-Shigella are ampler in Model group, and a lower ratio in Sham and DSLI groups. In addition, interactive information visualization of Sankey diagrams was constructed to exhibit the overall dynamic flow of gut microbiota at the phylum-class-family-genus-species level (Fig. 8D).
3.6 Comparative analysis of samples
To evaluate the changes in β-diversity of gut microbiota across different groups, principal component analysis (PCA), principal coordinate analysis (PCoA), and non-metric multidimensional scaling analysis (NMDS) were conducted to evaluate differences in community composition in samples. The more similar the composition of samples, the closer the distance reflected in the diagrams; On the contrary, it means the greater variation in the composition of samples. Moreover, a partial least squares-discriminant analysis (PLS-DA) model is established, which is a supervised learning method for linear discrimination and classification modeling, as Fig. 9C shown, the Sham-operated group, Model group and DSLI group were separated clearly with excellent values in the scatter plot of the model assessed by the ANOSIM tests (R = 0.390, p = 0.002), which revealed the difference of the gut microbial community composition between groups and within groups.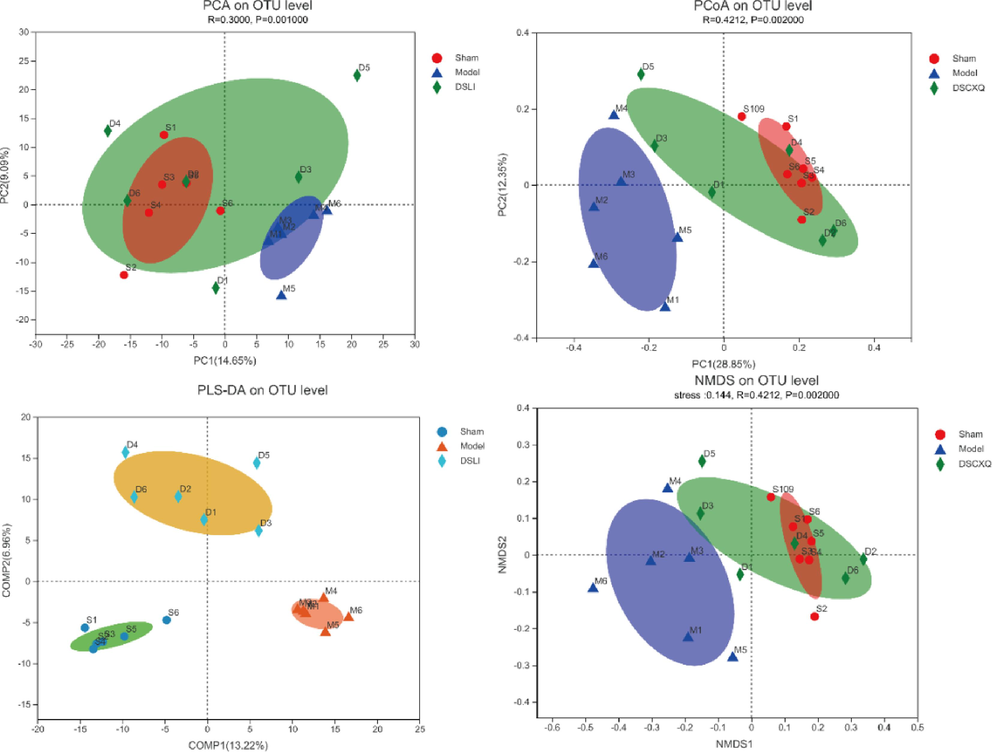
Microbiome multivariate analysis. the bacterial communities of groups showed distinct clusters on the OTU level among the three groups, which were visualized with (A) the Principal Component Analysis (PCA), (B) Principal co-ordinates analysis (PCoA), (C) Supervised Partial Least Squares Discriminant Analysis (PLS-DA) analysis, indicating the discrimination between the groups, and (D) the Non-metric multidimensional scaling analysis (NMDS) assay. Statistical significance was estimated by an ANOSIM with 999 permutations.
3.7 Significant difference analysis of LEfSe
In order to obtain deeper insight into microbiota alterations upon DSLI administration, LEfSe was performed to compare the microbial composition, which employs linear discriminant analysis (LDA) to identify communities that have markedly different effects on sample partitioning, indicating the significant biomarkers could be found among groups. LEfSe results showed that the Sham-operated group was enriched with more probiotic groups, such as Muribaculaceae, Peptostreptococcaceae, Ruminococcaceae, and Firmicutes; while the MCAO/R group was concentrated with more pathogens or opportunistic pathogens, including Erysipelotrichaceae, Acidaminococcales, Phascolarctobacterium (LDA score > 3.5p < 0.05). With the interventions of DSLI, the enrichment of gut microbiota Clostridia_UCG-014, RF39, Ruminococcaceae showed a higher level in DSLI group (LDA score > 3.5p < 0.05), the results revealed that DSLI up-regulated beneficial microbiota and reduced opportunistic pathogens. Clostridia_UCG-014, Ruminococcaceae, RF39, and Faecalibacterium in the DSLI group were the biomarkers with significant differences. DSLI alleviated gut dysbiosis in MCAO/R rats (see Fig. 10).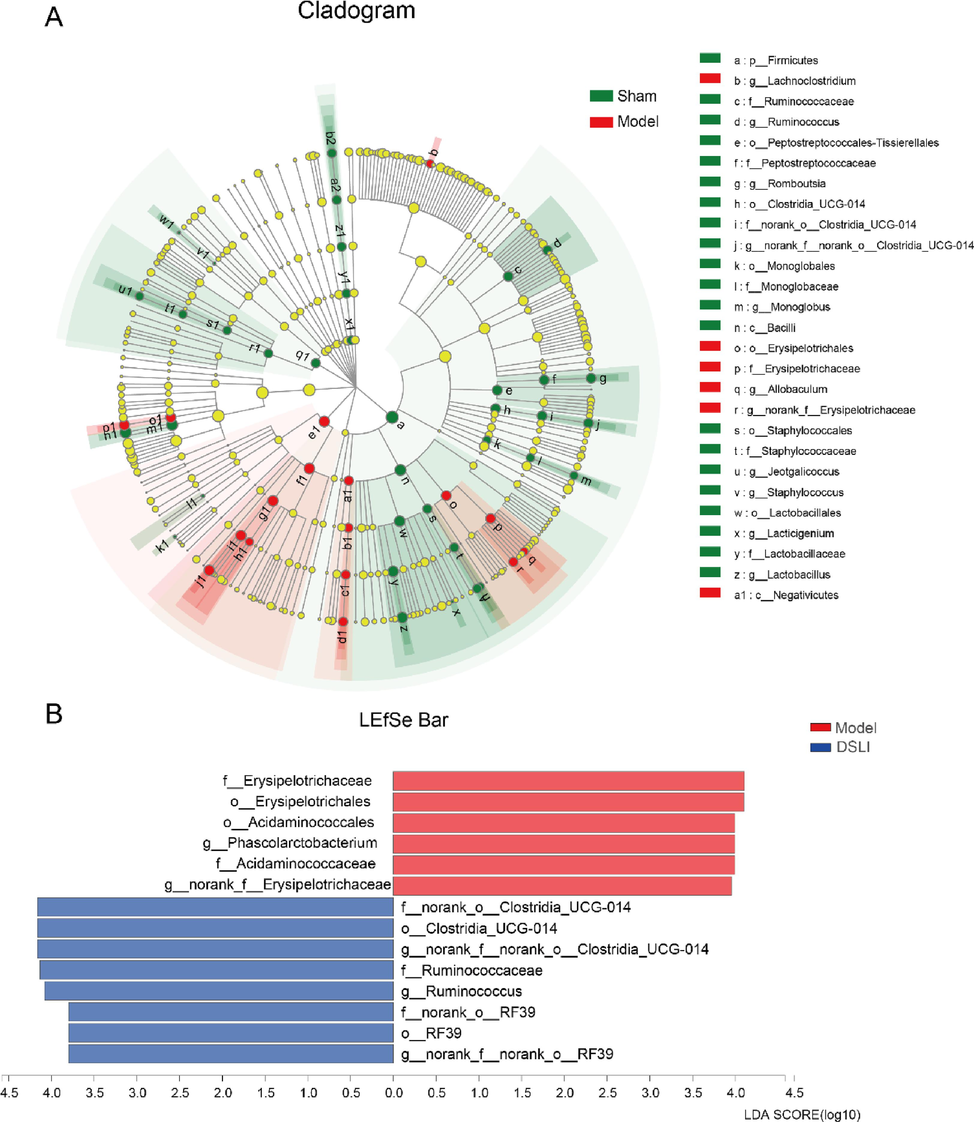
Core microbiome and genus-discriminant analyses. (A) Linear discriminant analysis Effect Size (LEfSe) of Multilevel Species Hierarchy Tree Diagram between Sham and Model visualized by cladogram (B) Linear discriminant analysis (LDA) between Model and DSLI displayed by histogram.
3.8 Correlation analysis between metabolites and gut microbiota
To elucidate the relationship between the altered gut microbiota in stroke and the changes of metabolites reversed by DSLI in the brain, Spearman correlation analysis was performed to reveal the interrelationship between the varied gut microbiota and the restored metabolites in the DSLI administration group (see Fig. 11). The results showed that the changes in metabolites in brain tissue were significantly correlated with the changes in gut microbiota in MCAO/R rats. Of particular interest, tryptophan metabolism was mainly involved in the interrelationship: Clostri_UCG-014 was positively correlated with indoleacrylic acid (IA) (p < 0.01), indole-3-methyl acetate (p < 0.05). Firmicutes_Rf39, Alcaligenaceae, Ruminococcaceae, Peptostreptococcaceae, and Lactobacillaceae have a strong positive relationship with the levels of tryptophan, indole, 3-methylindole, indole-3-methyl acetate metabolites. Meanwhile, the above metabolites mostly displayed a notable negative correlation with Phascolarctobacterium, Lachnoclostridium, Enterobacteriaceae, Morganellaceae, Bacteroidaceae, Acidaminococcaceae, Veillonellaceae. Besides, S1P, a metabolite marked increased in the MCAO/R group, has a notable negative correlation with various bacterial species enriched in the corresponding gut microbiota, such as Firmicutes_RF39, Ruminococcaceae, and Muribaculaceae. The above results suggest that there is a necessarily close connection between the perturbed metabolites restored by DSLI in the brain tissue and altered gut microbiota, especially tryptophan and its metabolites play a key role in stroke and DSLI intervention.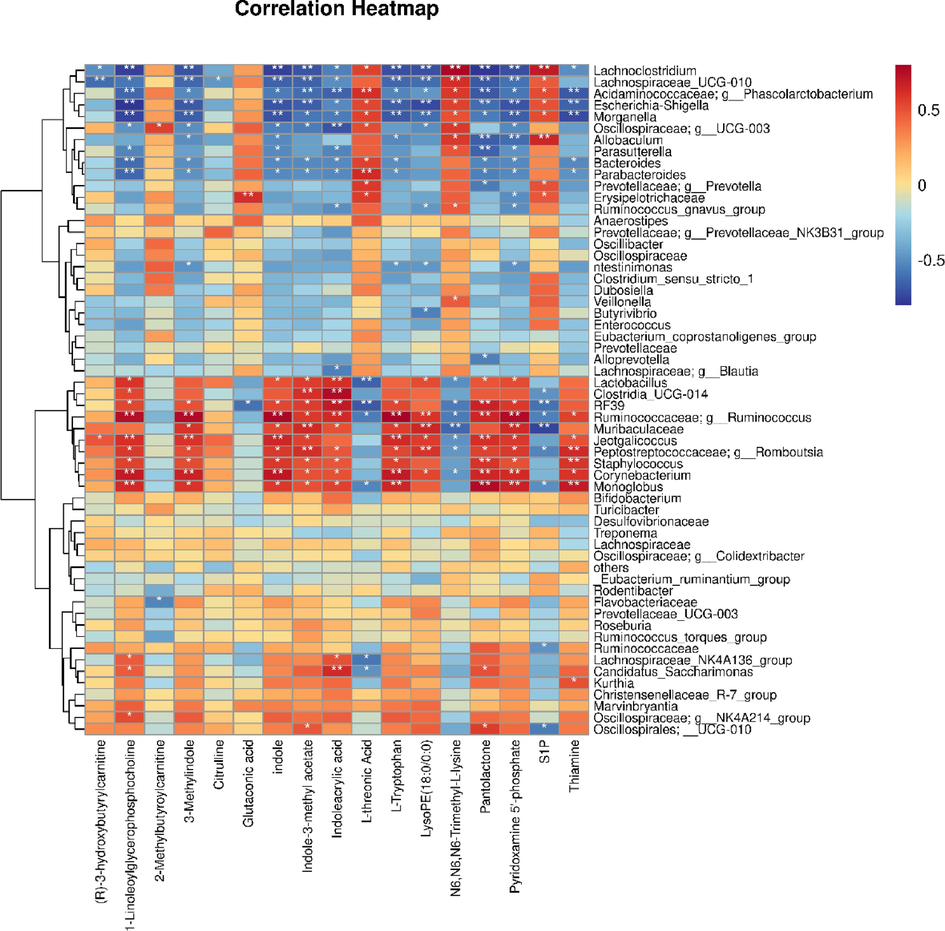
Heatmap of scaled correlations based on Spearman’s analysis between perturbed gut microbes genus and altered brain metabolites DSLI changed the contents of metabolites in MCAO/R rats, *p value < 0.05; **p value < 0.01.
Furthermore, using correlation thresholds |r|>0.5 and p < 0.01 as screening conditions, the network diagram of the interconnection between the changed metabolites and gut microbiota was constructed to exhibit the interaction network diagram of the metabolites-microbes. Fig. 12 was the correlation diagram between the differential metabolites restored by DSLI and the altered gut microbiota at the family level. As the line gets thicker, it indicates a higher correlation, otherwise the lower correlation is. It can be revealed from Fig. 12 that indoleacrylic acid was strongly correlated with Clostri_UCG-014, Firmicute_RF39, (r = 0.75, r = 0.69), slightly correlated with Lactobacilaceae, and highly negatively related with Oscillospiraceae; g_UCG-003 (r=0.69). The correlation coefficient between indole-3-methyl acetate and Clostri_UCG-014 was r = 0.62, Ruminococcus performed a tremendous correlation coefficient with L-tryptophan, 3-methylindole, and indole (r = 0.79, r = 0.76, r = 0.78, respectively). However, Escherichia-Shigella was strongly negatively correlated with L-tryptophan, 3-methylindole, indole and 1-linoleoylglycerophosphocholine. The results of relationship diagram at the family level were consistent with those at the genus level.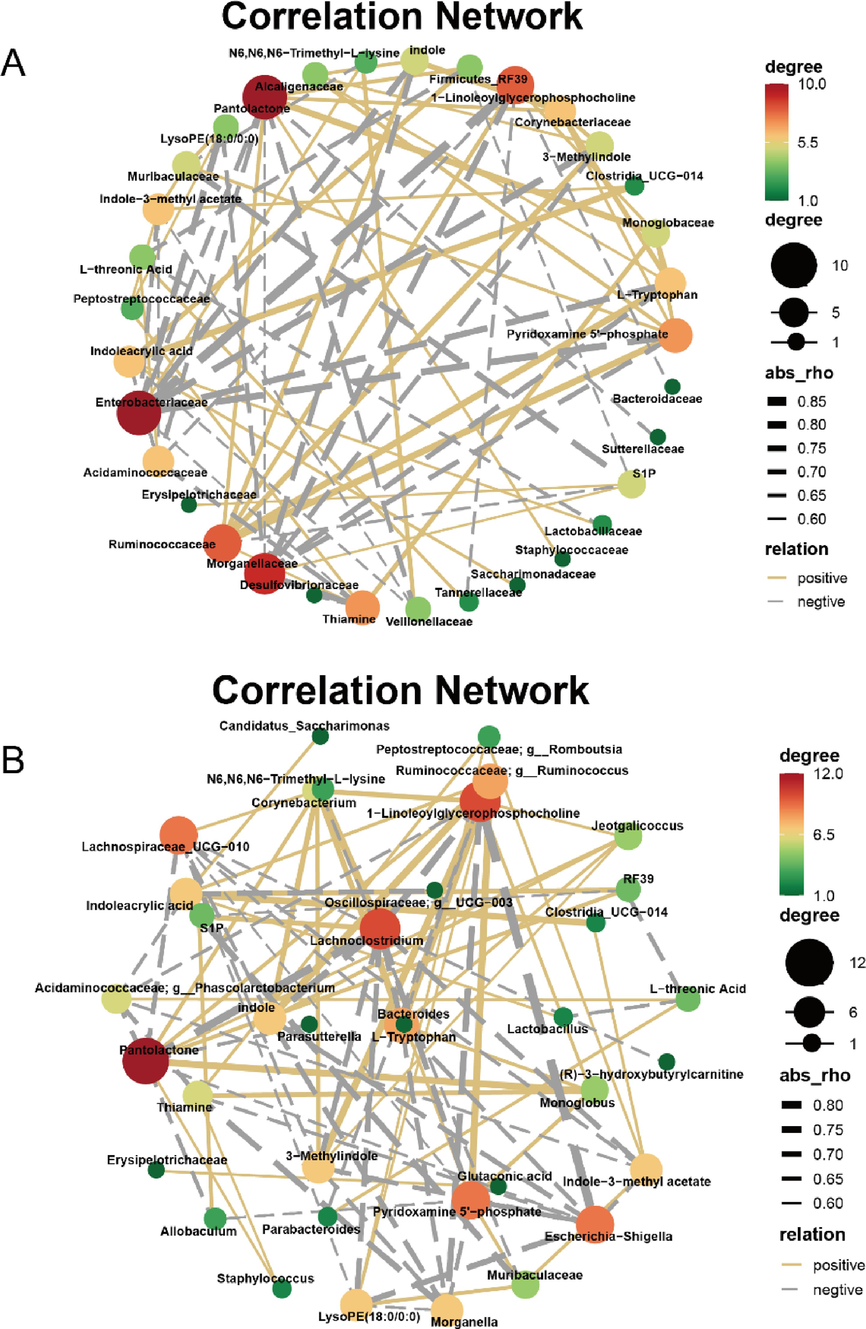
Correlation networks of perturbed gut microbes and differential metabolites altered by DSLI in MCAO/R rats at family (A) and genus (B) levels. an orange solid line indicates a positive correlation, a grey dashed line indicates a negative correlation, and the line thickness represents the strength of the correlation.
3.9 DSLI ameliorates inflammatory pathological indexes of the colon in MCAO rats
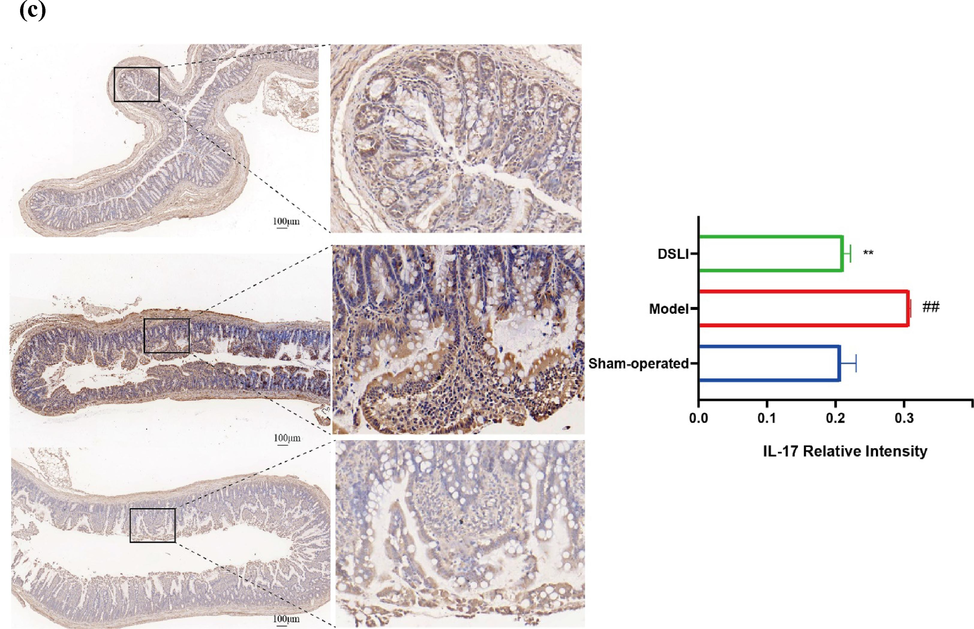
As a major biomarker of colonic inflammation (Martin et al., 2016), a significant increase in the weight-length ratio of the colon was observed in the Model group. In contrast, the weight-length ratio of the colon was obviously reduced in the DSLI group. Furthermore, microscopic observation revealed that the colon histology of the model group showed inflammatory cell infiltration occurred in the mucosa, with the shedding of goblet cells and mucosal epithelial cells, distorted crypt structure, and disorganized arrangement emerging. Encouragingly, the goblet cells showed a rebound in abundance and were relatively neatly arranged in the DSLI group, moreover, there was a reduction in mucosal damage and inflammatory cell infiltration, and a significant histological improvement in the crypt structure, suggesting that DSLI effectively alleviated the pathological damage in the colon of MCAO rats. Meanwhile, the expression of colonic IL-17 was measured among groups using immunohistochemistry, and it was found that the positive expression of IL-17 in the model group was greatly higher than that in the sham-operated group, while DSLI markedly inhibited the expression of IL-17 in the model group (see Fig. 13).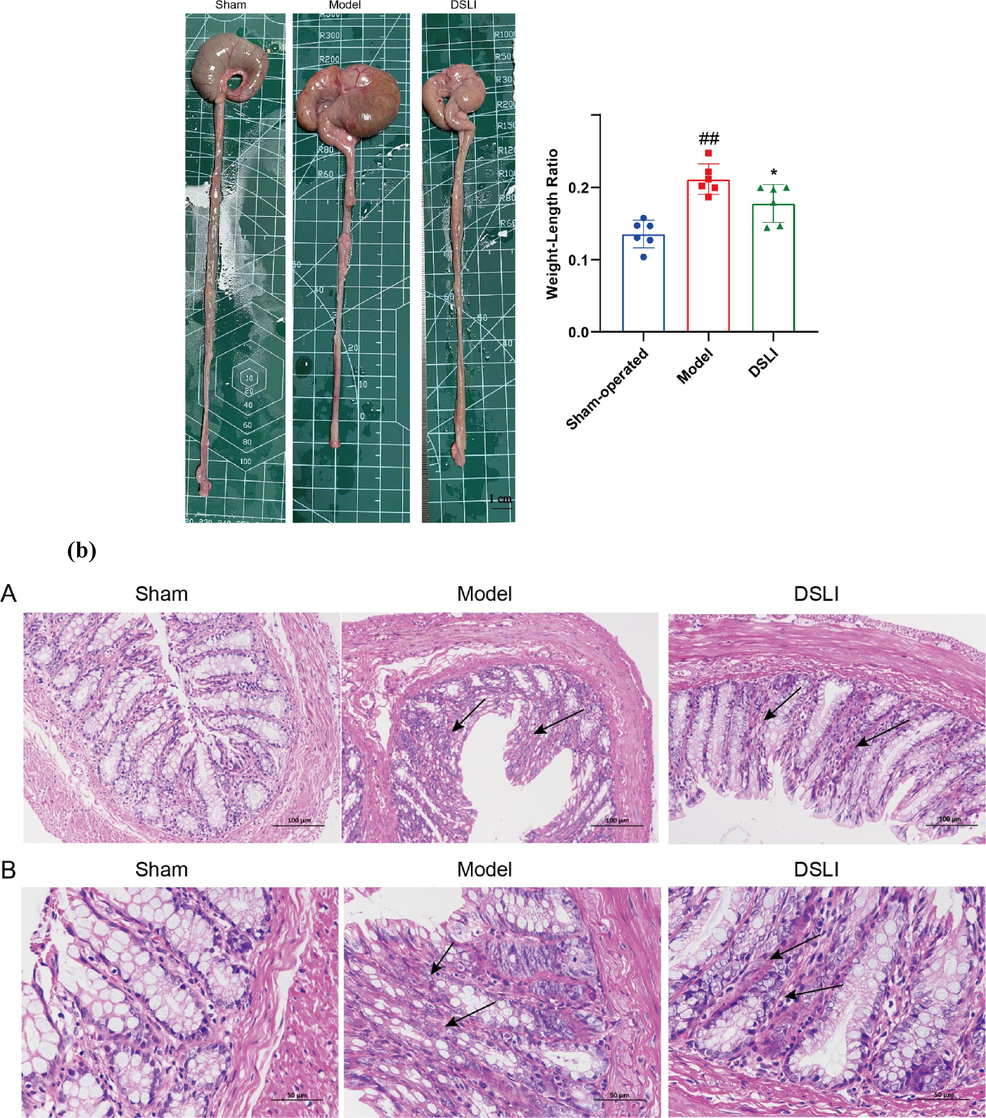
(a) DSLI improves the pathological phenotype of colitis in MCAO/R rats. Data were expressed with mean values ± standard errors (n = 6). ##p < 0.01 vs. Sham-operated group, *p < 0.05 vs. Model group (b) Representative H&E pictures of the colon A (scale bars, 100 μm) and B (scale bars, 50 μm)were captured and visualized (n = 3) (c) Representative IL-17 Immunohistochemistry pictures of the colon (scale bars, 100 μm) were captured and visualized (n = 3).
(a) DSLI improves the pathological phenotype of colitis in MCAO/R rats. Data were expressed with mean values ± standard errors (n = 6). ##p < 0.01 vs. Sham-operated group, *p < 0.05 vs. Model group (b) Representative H&E pictures of the colon A (scale bars, 100 μm) and B (scale bars, 50 μm)were captured and visualized (n = 3) (c) Representative IL-17 Immunohistochemistry pictures of the colon (scale bars, 100 μm) were captured and visualized (n = 3).
3.10 DSLI enhances the expression of SOCS2 in the brain tissue of MCAO/R rats
Suppressors of cytokine signaling SOCS proteins are modulators of cytokine and growth factor signaling whose aberrant regulation has been linked to a variety of inflammatory diseases. Among SOCS family members, SOCS2 is highly expressed in CNS, and SOCS2 is an important AhR-dependent intracellular mediator of the anti-inflammatory actions in vivo (Kim et al., 2019), which can negatively regulate cytokine signaling through a classical feedback loop. In the results, compared with the sham-operated group, SOCS2 levels were significantly reduced in the model group, predicting expanded inflammation in the model rats, while DSLI greatly elevated SOCS2, indicating that DSLI attenuated inflammation in MCAO/R rats (see Fig. 14).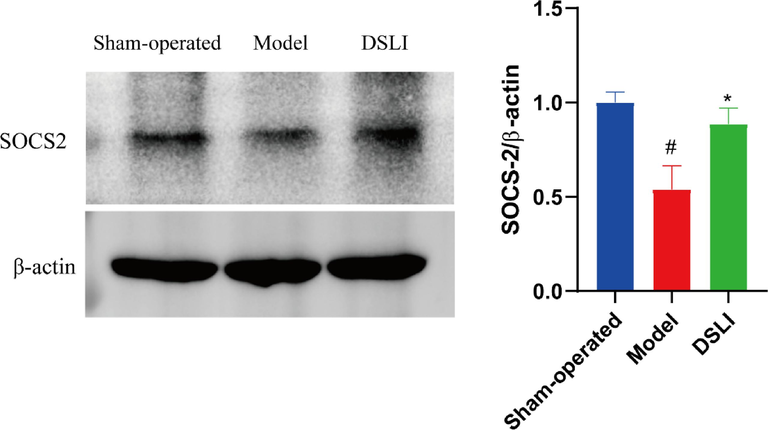
SOCS2 was determined by Western blot analysis. The protein levels were expressed as a ratio of the β-actin levels. Data were expressed with mean values ± standard error of the mean (SEM). #p < 0.05 versus Sham-operated group, *p < 0.05 versus Model group (n = 4).
3.11 DSLI mediated the Trp-AhR-SOCS2 pathway through gut microbiota to improve stroke
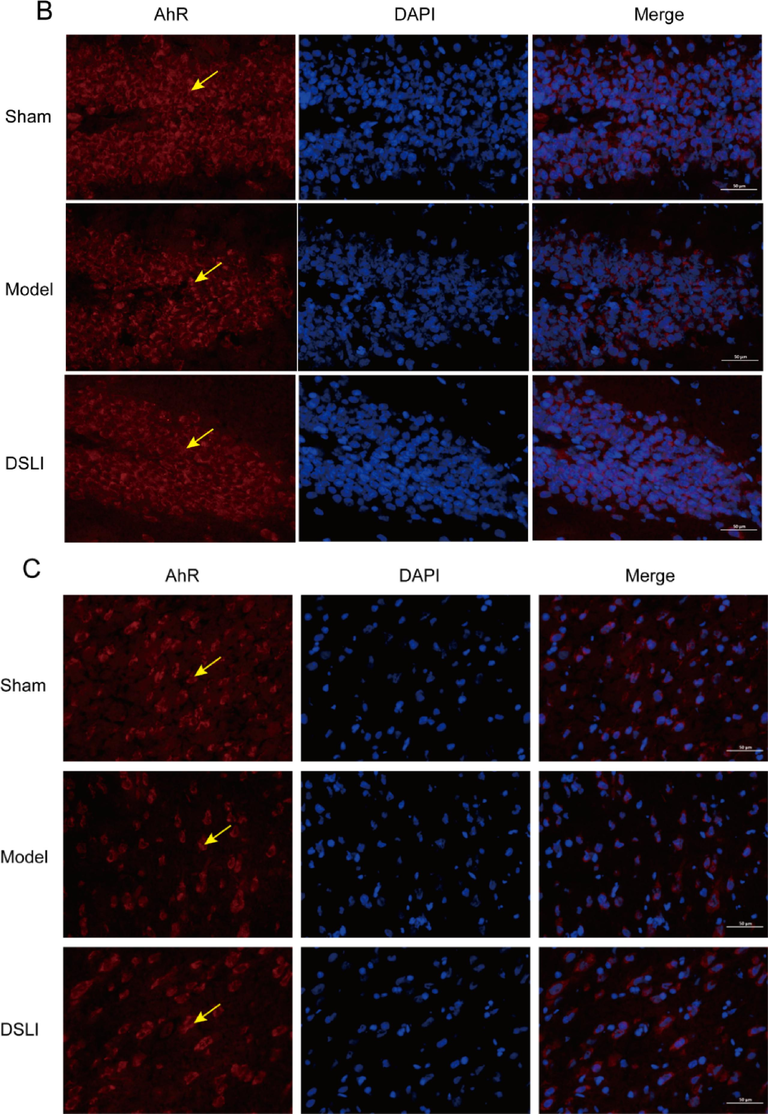
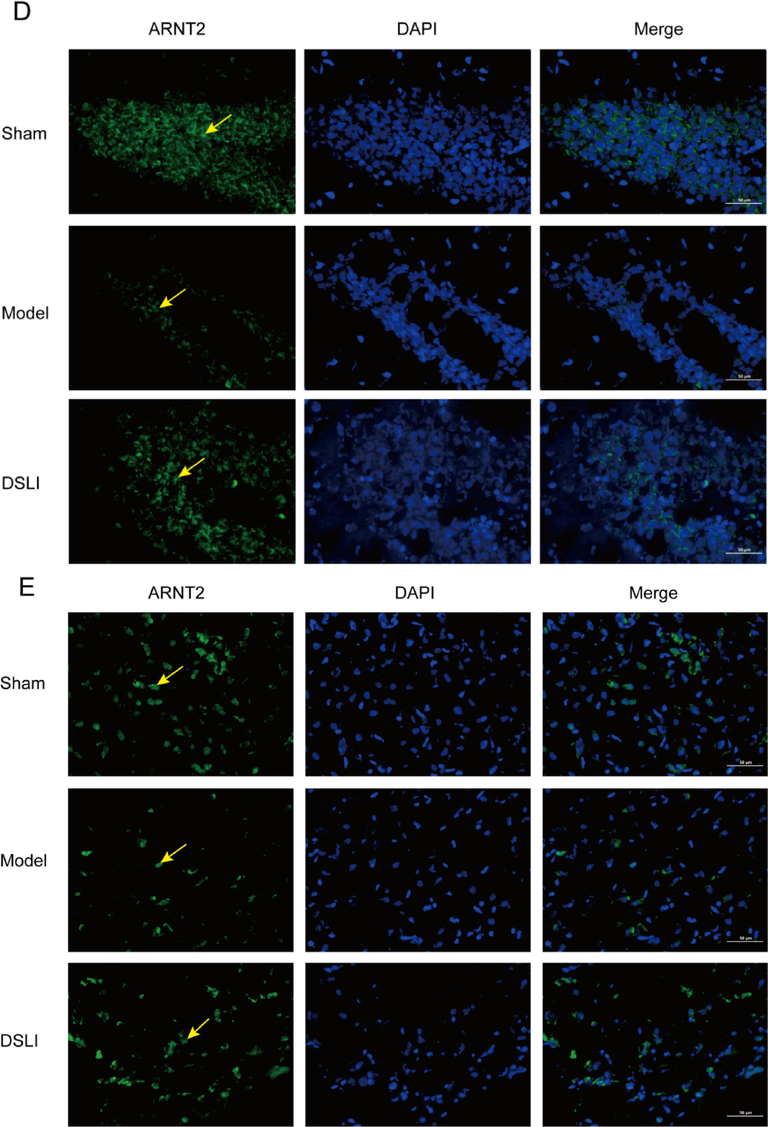
Tryptophan is the only amino acid that contains the structure of an indole, which is taken up in the small intestine, but the fraction that reaches the colon can be catabolized by the gut bacteria bringing about a variety of indole derivatives. Bacterial tryptophan catabolites, including indoleacrylic acid, 3-methylindole, and indole, act as ligands of AhR that activate the immune system (Ma et al., 2020). In our results, By Immunofluorescence, DAPI-stained nuclei appear blue under UV excitation, and the AhR, ARNT2 positive expression was CY3 fluorescein-labeled red and 488 fluorescein-labeled green, respectively. It was found that intestinal AhR expression was significantly lower in the model group than that in the sham-operated group, while the DSLI group had an activating effect on AhR expression (Fig. 15A). Similarly, the AhR in the hippocampus and cortex of the brain tissue was notably reduced in the model group, however, DSLI increased the relative AhR expression (Fig. 15B, Fig. 15C). The levels of ARNT2 in MCAO/R rats were down-regulated greatly compared to the Sham-operated group, and DSLI showed an effect with upregulation of ARNT2. AhR is present in the cytoplasm associated with chaperones, such as HSP90. Upon ligand binding, AhR is released from HSP90 and pairs with the nuclear transporter-ARNT- translocates to the nucleus and activates gene transcription of dioxin-responsive elements sequences within promoter regions of several genes, including SOCS2. SOCS2, which is highly expressed in the CNS and a negative modulator of NF-κB, is directly induced by tryptophan catabolites-activated AhR (Rothhammer et al., 2016). In the results, DSLI greatly elevated SOCS2 in MCAO/R rats, indicating that DSLI attenuated inflammation in stroke. Above all, the results suggest that DSLI mediated the Trp-AhR-SOCS2 pathway through gut microbiota to improve stroke.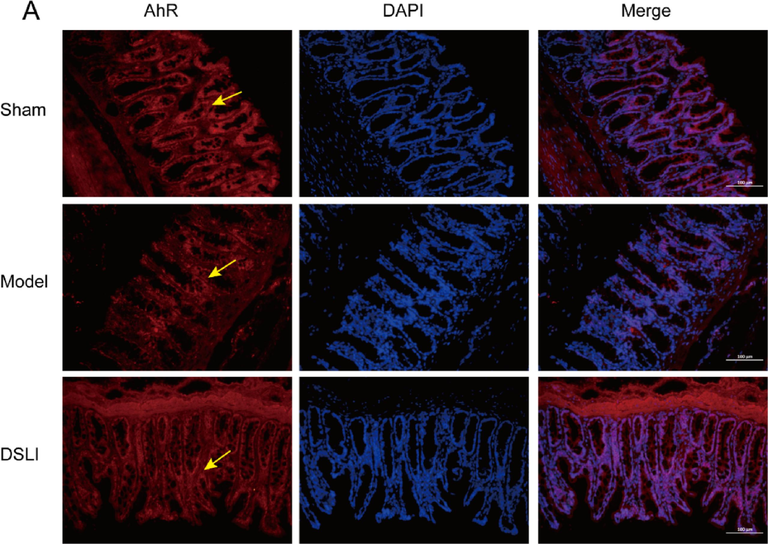
Representative immunofluorescence images of AhR localization in colon (A), Cerebral hippocampus (B) and Cerebral cortex (C) Left, AhR (red); Middle, DAPI; Right, merge. Scale, colon 50 μm or brain 100 μm, (n = 3). Arrowheads indicate AhR localization; Representative immunofluorescence images of ARNT2 localization in the Cerebral hippocampus (D) and Cerebral cortex (E). Left, ARNT2 (green); Middle, DAPI; Right, merge. Scale, brain 100 μm, (n = 3).
Representative immunofluorescence images of AhR localization in colon (A), Cerebral hippocampus (B) and Cerebral cortex (C) Left, AhR (red); Middle, DAPI; Right, merge. Scale, colon 50 μm or brain 100 μm, (n = 3). Arrowheads indicate AhR localization; Representative immunofluorescence images of ARNT2 localization in the Cerebral hippocampus (D) and Cerebral cortex (E). Left, ARNT2 (green); Middle, DAPI; Right, merge. Scale, brain 100 μm, (n = 3).
Representative immunofluorescence images of AhR localization in colon (A), Cerebral hippocampus (B) and Cerebral cortex (C) Left, AhR (red); Middle, DAPI; Right, merge. Scale, colon 50 μm or brain 100 μm, (n = 3). Arrowheads indicate AhR localization; Representative immunofluorescence images of ARNT2 localization in the Cerebral hippocampus (D) and Cerebral cortex (E). Left, ARNT2 (green); Middle, DAPI; Right, merge. Scale, brain 100 μm, (n = 3).
4 Discussion
In this study, an integrated 16S rRNA gene sequencing and HMRS HPLC-MS based metabolomics approach were employed to explore the association of the altered gut microbiota and disturbed metabolic phenotypes of brain tissue reversed by DSLI in MCAO/R rats. The results showed that there were significant differences in abundance levels of phyla, family, and genera in the gut microbial community. The richness and diversity of gut microbiota in MCAO/R rats were remarkably reduced, whereas DSLI not only affected the metabolic phenotype of MCAO rats, but also altered the gut microbiota to balance the dysbiosis of metabolite and microbiota homeostasis. Besides, the alterations of gut microbiota were appreciably associated with disturbed metabolites, especially tryptophan and its indole metabolites.
DSLI consists of the extracts of ligustrazine and Salvia miltiorrhiza extract, which, in addition to the main compounds ligustrazine and the phenolic acid danshensu, also includes other polyphenols, such as salvianolic acid A, protocatechuic aldehyde, rosmarinic acid, caffeic acid, etc. Apart from the powerful anti-inflammatory, antioxidant, lipid-lowering, anti-platelet activation activities of the polyphenols (Xue et al., 2022), accumulating evidence implicates that phenolic acids can regulate the composition of the microbiota, promote the production of metabolites, and play a “prebiotic” -like effect (Zhang et al., 2023). The polyphenols often need to be hydrolyzed, cleaved, and reduced under the action of microbial enzymes, and then transformed into active metabolites that interact with surrounding organs and tissues to play a pharmacological role. On the contrary, the polyphenols and their metabolites can also regulate the composition of gut microbiota, promote the growth of probiotics, and inhibit conditional pathogens, facilitating improvement in disease.
Although DSLI exerts multiple pharmacological effects, such as inhibiting platelet aggregation and antioxidant, anti-inflammatory, and vascular endothelium protection activity, recent studies have underlined that the bioactive components of DSLI can exert their effects by regulating gut microbiota and host metabolites (Zhang et al., 2021a,b). Our previous results have shown that tryptophan and its related indole derivatives in the brain were increased in MCAO/R rats with the treatment of DSLI. What’s more, a growing body of literature suggests that tryptophan catabolites generated by the gut microbiota are important signaling molecules in microbial communities, and several studies indicated that indole-induced AhR activation may be one way that bacteria contribute to mucosal homeostasis (Sun et al., 2020). AhR is expressed in CNS endothelial cells, neurons, and oligodendrocytes (Barroso et al., 2021). Research demonstrated that tolerogenic dendritic cell induction was dependent on the AhR-dependent induction of SOCS2, which interfered with the production of proinflammatory cytokines (Yeste et al., 2016).
Clinical and preclinical evidence suggests that the brain-gut axis plays an important role in CNS diseases (Fung et al., 2017), and increasing research has focused on elucidating the bidirectional communication pathway between the gut microbiota and the CNS (Singh et al., 2016, Dinan and Cryan 2017). In the metabolomics study, the levels of indole-3-methyl acetate, indoleacrylic acid, indole, 3-methylindole and L-tryptophan in MCAO/R group were conspicuously lower than those in Sham-operated group, and DSLI could eminently restore the contents of indole-3-methyl acetate, indoleacrylic acid, indole, 3-methylindole and L-tryptophan. What’s more, it is of great interest to us that indole-3-methyl acetate, indoleacrylic acid, indole, and 3-methylindole are all indole metabolites of L-tryptophan, the only amino acid with an indole structure (Gao et al., 2018, Roager and Licht 2018, Sun et al., 2020). The indole pathway of the tryptophan metabolic pathway occurs in the regional lineage of the gut microbiome (Gao et al., 2020). The results of 16S rRNA gene sequencing revealed that the levels of Muribaculaceae, Lactobacillaceae, Clostridia_UCG-014, and Prevotellaceae were significantly lowered in the MCAO/R group, compared with the Sham-operated group, while Bacteroidaceace, Enterobacteriaceae were increased markedly. With the intervention of DSLI, the flora Clostridia_UCG-014, RF39, and Ruminococcaceae are enriched and up-regulated conspicuously in the DSLI group. LDA score indicates that Clostridia_UCG-014, RF39, and Ruminococcaceae are the biomarkers of DSLI-regulated microbiota in MCAO/R rats.
To further investigate the role of the brain-gut axis in stroke and the relationship between metabolic phenotype and gut microbiota, Correlation heatmaps were constructed using Spearman coefficients to represent the covariation between disturbed gut microbial genera and altered brain metabolites reversed by DSLI, which revealed that Clostri_UCG-014 was markedly positively correlated with indoleacrylic acid, indole-3-methylacetate, and Ruminococcaceae showed a strongly positive correlation with L-tryptophan, 3-methylindole, and indole. Indoleacrylic acid, indole-3-methyl acetate, 3-methylindole, and indole are all bacterial metabolites, which confirmed our hypothesis that the brain-gut microbiota-Trp metabolism axis exists in the pathogenesis of stroke. It can be concluded that DSLI can upregulate the levels of indoleacrylic acid, indole-3-methyl acetate, 3-methylindole and indole, which cross the blood–brain barrier (Durgan et al., 2019) and act as ligands for AhR to activate the immune system (Gutierrez-Vazquez and Quintana, 2018), by enriching the flora Clostridia_UCG-014, Ruminococcaceae, RF39. AhR and its target gene are expressed in both the gastrointestinal tract and different brain regions including the cerebellum, ventrolateral medulla, hippocampus, and cortex (Juricek and Coumoul, 2018), which play a key role in mediating the brain-gut axis (Shinde and McGaha, 2018, Barroso et al., 2021), suggesting that microbial tryptophan metabolites may act like as ‘bridge’ between the intestinal microbiota and the CNS by activating AhR receptor. ARNT2 is a nuclear transcription factor found almost exclusively in CNS, which is an isoform of ARNT, named after its purported role in the nuclear translocation of AhR. ARNT2 has been associated with neuroprotective properties in ischemic insults and cells undergoing oxidative damage (Rahim et al., 2018). In this study, we analyzed AhR on the intestine, hippocampus, and cortex and ARNT2 in the brains of MCAO/R rats by immunofluorescence assays, and we found the expression of AhR and ARNT2 in the model group was decreased than that in the sham-operated group, while DSLI significantly enhanced AhR, alleviating stroke-induced injury. Overall, in the findings, the association of regulated gut microbiota with tryptophan metabolites may be a potential mechanistic field for exploring the impact of stroke on immune function and developing microbiome-based tools for disease prevention and treatment. The study proposed that DSLI up-regulated beneficial microbiota Clostridia_UCG-014, Ruminococcaceae, and Firmicutes_RF39, which exert an important role in improving the regulation of immune function in stroke by activating AhR expression through tryptophan metabolites. To further in-depth research, SOCS2, which is directly induced by tryptophan catabolites-activated AhR, was detected by western blots in groups. The results showed that DSLI could attenuate the expression of SOCS2, alleviating inflammation in MCAO/R rats.
5 Conclusions
16S rRNA gene sequencing and HMRS HPLC-MS based metabolomics were combined to evaluate the dynamic variation characteristics of gut microbiota and the relationship with brain metabolic phenotype reversed by DSLI. Our results reveal that the gut microbiota Clostri_UCG-014, Ruminococcaceae, RF39 are closely related to the restored brain metabolites, especially indole tryptophan metabolites indoleacrylic acid, 3-methylindole in DSLI-regulated model rats. which indicates that gut microbiota may exert a vital role in the brain-gut microbiota-Trp metabolism axis protecting brain tissue from the neurological damage of stroke. Furthermore, the present work findings suggest that gut microbiota play an important role in improving the regulation of immune function in stroke through tryptophan metabolites by acting on the AhR-SOCS2 axis. These findings shed light on the mechanism by which DSLI improves MCAO/R, deepening the understanding of the role of the brain-gut axis in stroke, and providing new insights into the regulation of gut microbes in stroke.
Funding
This work was financially supported by Henan Provincial Science and Technology Research Project [Grant No. 232102311200], the National Natural Science Foundation of China (Grant Nos. 82003921) and the Science and Technology Project of Henan Province [202102310487].
Institutional Review Board Statement
All animal experiments fell in line with obligations approved by the Ethics Committee of the National Institute of Health (NIH) and implemented following the guidelines for the Care and Use of laboratory animals of Zheng Zhou University(2022-KY-1242-002).
CRediT authorship contribution statement
Peipei Zhou: Conceptualization, Investigation, Methodology, Visualization, Writing – original draft. Ying Kuang: Investigation, Writing – review & editing. Lihua Zuo: Validation, Funding acquisition. Shuhong Liang: Investigation, Writing – review & editing. Zhuolun Li: Validation. Lei Chen: Investigation, Writing – review & editing. Jingxue Li: Methodology, Visualization. Jun Zhang: Validation. Chenhan He: Visualization. Xiaobao Wang: Visualization. Yaojuan Chu: Resources. Jianying Pei: Resources. Zhi Sun: Project administration, Supervision. Shuzhang Du: Project administration, Supervision.
Declaration of Competing Interest
The authors declare that they have no known competing financial interests or personal relationships that could have appeared to influence the work reported in this paper.
References
- Protecting the ischaemic penumbra as an adjunct to thrombectomy for acute stroke. Nat. Rev. Neurol.. 2018;14:325-337.
- [CrossRef] [Google Scholar]
- The aryl hydrocarbon receptor and the gut-brain axis. Cell. Mol. Immunol.. 2021;18:259-268.
- [CrossRef] [Google Scholar]
- Current advances in ischemic stroke research and therapies. Biochimica et biophysica acta. Mol. Basis. Dis.. 2020;1866:165260
- [CrossRef] [Google Scholar]
- Suppressor of Cytokine Signaling-2 (SOCS2) Regulates the Microglial Response and Improves Functional Outcome after Traumatic Brain Injury in Mice. PLoS. One. 2016;11:e0153418.
- [Google Scholar]
- The gut microbiome in neurological disorders. Lancet. Neurol.. 2020;19:179-194.
- [CrossRef] [Google Scholar]
- Gut instincts: microbiota as a key regulator of brain development, ageing and neurodegeneration. J. Physiol.. 2017;595:489-503.
- [CrossRef] [Google Scholar]
- Examining the Role of the Microbiota-Gut-Brain Axis in Stroke. Stroke. 2019;50:2270-2277.
- [CrossRef] [Google Scholar]
- Interactions between the microbiota, immune and nervous systems in health and disease. Nat. Neurosci.. 2017;20:145-155.
- [CrossRef] [Google Scholar]
- Tryptophan Metabolism: A Link Between the Gut Microbiota and Brain. Adv. Nutr.. 2020;11:709-723.
- [CrossRef] [Google Scholar]
- Impact of the Gut Microbiota on Intestinal Immunity Mediated by Tryptophan Metabolism. Front. Cell. Infect. Microbiol.. 2018;8:13.
- [CrossRef] [Google Scholar]
- Regulation of the Immune Response by the Aryl Hydrocarbon Receptor. Immunity. 2018;48:19-33.
- [CrossRef] [Google Scholar]
- The microbiota in adaptive immune homeostasis and disease. Nature. 2016;535:75-84.
- [CrossRef] [Google Scholar]
- Immune responses to stroke: mechanisms, modulation, and therapeutic potential. J. Clin. Invest.. 2020;130:2777-2788.
- [CrossRef] [Google Scholar]
- The Aryl Hydrocarbon Receptor and the Nervous System. Int. J. Mol. Sci.. 2018;19
- [CrossRef] [Google Scholar]
- Indoxyl sulfate-induced TNF-α is regulated by crosstalk between the aryl hydrocarbon receptor, NF-κB, and SOCS2 in human macrophages. FASEB J.. 2019;33:10844-10858.
- [CrossRef] [Google Scholar]
- Dietary polyphenols: regulate the advanced glycation end products-RAGE axis and the microbiota-gut-brain axis to prevent neurodegenerative diseases. Crit. Rev. Food. Sci. Nutr.. 2023;63:9816-9842.
- [CrossRef] [Google Scholar]
- Reversible middle cerebral artery occlusion without craniectomy in rats. Stroke. 1989;20:84-91.
- [CrossRef] [Google Scholar]
- Modulation of the human gut microbiota by phenolics and phenolic fiber-rich foods. Compr. Rev. Food. Sci. Food. Saf.. 2020;19:1268-1298.
- [CrossRef] [Google Scholar]
- Host-microbiome interactions: the aryl hydrocarbon receptor as a critical node in tryptophan metabolites to brain signaling. Gut. Microbes. 2020;11:1203-1219.
- [CrossRef] [Google Scholar]
- Martin, J. C., Bériou, G., Josien, R. 2016. Dextran Sulfate Sodium (DSS)-Induced Acute Colitis in the Rat. Methods in molecular biology (Clifton, N.J.). 1371, 197-203. 10.1007/978-1-4939-3139-2_12.
- Diagnosis and Management of Transient Ischemic Attack and Acute Ischemic Stroke: A Review. JAMA. 2021;325:1088-1098.
- [CrossRef] [Google Scholar]
- The gut microbiota-brain axis in behaviour and brain disorders. Nat. Rev. Microbiol.. 2021;19:241-255.
- [CrossRef] [Google Scholar]
- Expression of the neuroprotective protein aryl hydrocarbon receptor nuclear translocator 2 correlates with neuronal stress and disability in models of multiple sclerosis. J. Neuroinflammation. 2018;15:270.
- [CrossRef] [Google Scholar]
- Microbial tryptophan catabolites in health and disease. Nat. Commun.. 2018;9:3294.
- [CrossRef] [Google Scholar]
- Type I interferons and microbial metabolites of tryptophan modulate astrocyte activity and central nervous system inflammation via the aryl hydrocarbon receptor. Nat. Med.. 2016;22:586-597.
- [CrossRef] [Google Scholar]
- Microglial control of astrocytes in response to microbial metabolites. Nature. 2018;557:724-728.
- [CrossRef] [Google Scholar]
- The Aryl Hydrocarbon Receptor: Connecting Immunity to the Microenvironment. Trends. Immunol.. 2018;39:1005-1020.
- [CrossRef] [Google Scholar]
- Microbiota Dysbiosis Controls the Neuroinflammatory Response after Stroke. J. Neurosci.. 2016;36:7428-7440.
- [CrossRef] [Google Scholar]
- Tryptophan (Trp) modulates gut homeostasis via aryl hydrocarbon receptor (AhR) Crit. Rev. Food. Sci. Nutr.. 2020;60:1760-1768.
- [CrossRef] [Google Scholar]
- Danshensu prevents thrombosis by inhibiting platelet activation via SIRT1/ROS/mtDNA pathways without increasing bleeding risk. Phytomedicine. 2022;104:154271
- [CrossRef] [Google Scholar]
- Combination of Danshen and ligustrazine has dual anti-inflammatory effect on macrophages and endothelial cells. J. Ethnopharmacol.. 2021;266:113425
- [CrossRef] [Google Scholar]
- Tolerogenic nanoparticles inhibit T cell-mediated autoimmunity through SOCS2. Sci. Signal. 2016;9:ra61.
- [CrossRef] [Google Scholar]
- The positive correlation of antioxidant activity and prebiotic effect about oat phenolic compounds. Food. Chem.. 2023;402
- [CrossRef] [Google Scholar]
- GuanXinNing Tablet Attenuates Alzheimer’s Disease via Improving Gut Microbiota, Host Metabolites, and Neuronal Apoptosis in Rabbits. Evid. Based. Complement. Alternat. Med.. 2021;2021:1-20.
- [CrossRef] [Google Scholar]
- Metabolites of microbiota response to tryptophan and intestinal mucosal immunity: A therapeutic target to control intestinal inflammation. Med. Res. Rev.. 2021;41:1061-1088.
- [CrossRef] [Google Scholar]
- Ginkgolide B promotes the proliferation and differentiation of neural stem cells following cerebral ischemia/reperfusion injury, both in vivo and in vitro. Neural. Regen. Res.. 2018;13:1204-1211.
- [CrossRef] [Google Scholar]
- Tetramethylpyrazine2'Osodium ferulate provides neuroprotection against neuroinflammation and brain injury in MCAO/R rats by suppressing TLR-4/NF-kappaB signaling pathway. Pharmacol. Biochem. Behav.. 2019;176:33-42.
- [CrossRef] [Google Scholar]
- Neuroprotective Effects of Danshen Chuanxiongqin Injection Against Ischemic Stroke: Metabolomic Insights by UHPLC-Q-Orbitrap HRMS Analysis. Front. Mol. Biosci.. 2021;8:630291
- [CrossRef] [Google Scholar]
- Interactions of antithrombotic herbal medicines with Western cardiovascular drugs. Pharmacol. Res.. 2020;159:104963
- [CrossRef] [Google Scholar]


