

Translate this page into:
Optimizing sponge-like activated carbon from Manihot esculenta tubers for high-performance supercapacitors
⁎Corresponding author at: Department of Physics, Faculty of Mathematics and Natural Sciences, Universitas Negeri Malang, Jl. Semarang 5, Malang 65145, Indonesia. markus.diantoro.fmipa@um.ac.id (Markus Diantoro)
-
Received: ,
Accepted: ,
This article was originally published by Elsevier and was migrated to Scientific Scholar after the change of Publisher.
Abstract
Activated carbon plays a crucial role in enhancing supercapacitor performance by optimizing parameters such as surface area, pore structure, and morphology. This study investigates activated carbon derived from Manihot esculenta tubers, which offers a promising, sponge-like porous morphology suitable for supercapacitor electrodes. Activated carbon derived from Manihot esculenta tubers was synthesized utilizing chemical activation with varying concentrations of potassium hydroxide (KOH) as the activator 0 M (C-S0), 1 M (AC-S1M), 2 M (AC-S2M), and 4 M (AC-S4M). The AC-S4M sample variant achieved the highest surface area (471.645 m2g−1) and total volume (0.253 cm3g−1). Electrochemical characterization using symmetric coin cell supercapacitors demonstrated excellent specific capacitance of 146.570 Fg−1 at 0.1 Ag−1 in a 6 M KOH aqueous electrolyte. Notably, the highest energy density of 15.525 Whkg−1 at a power density of 174.660 Wkg−1 was achieved. These results underscore the potential of Manihot esculenta tubers-derived activated carbon as a sustainable, high-performance electrode material, advancing environmentally friendly energy storage technologies, which remain interesting for further studies.
Keywords
Sponge-like activated carbon
Waste biomass
Manihot esculenta tubers
KOH activation
Supercapacitor

- Co
-
Company
- USA
-
United States of America
- MA
-
Massachusetts
- LIB
-
Lithium-ion battery
- Ltd
-
Limited
- C-S0
-
Manihot esculenta tubers-carbon before KOH activation
- AC-S1M
-
Manihot esculenta tubers-activated carbon resulting from activation using 1 M KOH concentration
- AC-S2M
-
Manihot esculenta tubers-activated carbon resulting from activation using 2 M KOH concentration
- AC-S4M
-
Manihot esculenta tubers-activated carbon resulting from activation using 4 M KOH concentration
Abbreviations
1 Introduction
Supercapacitors are innovative technologies developed as energy storage devices that surpass conventional capacitors. According to Market Research Consulting, the demand for supercapacitors in the global market will continue to increase from 2019 to 2030 (Lasrado et al., 2021). The advantages of supercapacitors as energy storage devices include high power density (2–5 kWkg−1), high stability, fast recharge time, and long cycle life (Baig and Gul, 2021; Kalu-Uka et al., 2022). The limited energy density of supercapacitors hinders their widespread adoption in electric vehicles and electronic devices. Thus, efforts must be made to raise energy density to preserve the cycle life and performance of power densities. Increased specific capacitance leads to increased energy density.
One effective strategy to improve the electrochemical performance of supercapacitors is to use active electrode materials with high electrical conductivity and large surface area (Borenstein et al., 2017). Various active materials that are often used for supercapacitor electrodes include metal oxides, metal–organic frameworks (MOFs), covalent-organic frameworks (COFs), conductive polymers, and activated carbon (Adoor et al., 2024; Adoor et al., 2023; Agadi et al., 2024; Pramitha et al., 2024; Pramitha et al., 2023). Compared with other materials, such as metal oxides (such as Mn3O4 and Co3O4), MOFs, COFs, and conductive polymers, activated carbon offers a wider pore size range that supports ion accommodation and enables efficient ion diffusion. The interconnected pore structure further contributes to substantial energy storage capacity and superior energy and power densities. In activated carbon-based electric double-layer capacitors (EDLCs), charging is initiated by depositing negative and positive electrolyte ions on the cathode and anode under an applied voltage (Intan Subadra et al., 2019). During discharge, the ions become randomly oriented, and the electrodes are left uncharged. The electrochemical performance of EDLC is greatly influenced by the raw material of activated carbon, activated carbon derived from biomass materials has the advantages of being abundantly available, cost-effective, and easy to synthesize (Ghosh et al., 2019).
Based on data from 2014 to 2018, the demand for imported activated carbon in Indonesia reached 10,630 tons per year, with a compound annual growth rate of 1.5 %. Import activities were necessary to fulfill the demand for activated carbon in Indonesia, as local sources proved inadequate. Based on President Decree No. 29 of 2018, regulations regarding industrial empowerment were issued. The President Decree mandates using local content at a rate of more than 40 %. Local natural resources in Indonesia are widely utilized as sources for activated carbon production (Adinaveen et al., 2013).
The synthesis of activated carbon is influenced by various parameters, including the activation method, activating agent, synthesis procedure, and raw material (Thongpat et al., 2021). Physical activation and chemical activation are two frequent activation techniques. Physical activation involves thermal treatment of the material in the presence of oxidizing or inert gases such as carbon dioxide (CO2), nitrogen (N2), or argon (Ar), resulting in pore formation (Illingworth et al., 2022). One disadvantage of physical activation is that high temperatures can lead to increased ash content and reduced carbon content in certain biomass materials. In contrast, chemical activation is a process that utilizes chemicals including potassium hydroxide, sodium hydroxide, phosphoric acid, sulfuric acid, and zinc chloride as activating agents (Chen et al., 2012; Demir and Doguscu, 2022; He et al., 2013).
Supercapacitor electrodes typically use activated carbon precursors derived from biomass materials such as coconut shells, bagasse, straw, bamboo, coffee, and cassava, which have been proven effective in enhancing electrode performance (Charoensook et al., 2021a; Omokafe, 2020; Zhang et al., 2018). However, certain limitations remain, such as the need for higher specific capacitance as well as improved surface area and pore volume for large-scale applications. This study aims to address these limitations by exploring the underutilized potential of Manihot esculenta (cassava) to produce highly porous activated carbon through controlled chemical activation. According to data from the Food and Agriculture Organization from 2012 to 2022, Indonesia ranks 6th globally in Manihot esculenta production, with a cultivation area covering approximately 19,155,594 ha. Manihot esculenta is commonly used in food and tapioca flour production. Manihot esculenta also has the potential for use in non-food products, particularly in energy storage materials. Nevertheless, the potential has not yet been fully realized. Manihot esculenta has a high content of lignin (13.42 %), cellulose (39.29 %), and hemicellulose (24.34 %) (Lismeri et al., 2021). The composition contributes to the significant porosity and surface area of the resulting activated carbon. Previous research on Manihot esculenta-derived activated carbon has shown promising results in terms of surface area and porosity, particularly when activated using ZnCl2 (1567 m2g−1, 0.54 cm3g−1), KOH (1605 m2g−1, 0.691 cm3g−1), and H2SO4 (398.46 m2g−1, 0.1639 cm3g−1) (Ospino Orozco et al., 2022; Shrestha, 2022; Zhang et al., 2018). Furthermore, the activated carbon derived from Manihot esculenta exhibits a porous morphology with a surface area of 1350 m2g−1, which enhances ion transport and electrolyte accessibility (Chaisit et al., 2020). Based on previous studies, the synthesis of activated carbon from various parts of Manihot esculenta, including stems, peels, roots, and starch, the potential of tubers as a carbon source is still unexplored. Furthermore, previous studies, such as the work of Chaisit et al., only used one concentration of KOH during activation. In this study, we systematically vary the concentration of KOH to improve the electrochemical properties of activated carbon derived from Manihot esculenta tubers, providing insight into its potential for high-performance energy storage applications. This study improves current knowledge by examining the effects of various concentrations of KOH (0, 1, 2, and 4 M) on the activation of Manihot esculenta tubers to produce activated carbon with porous morphology and higher specific capacitance for supercapacitor electrodes. The previous results show that using KOH not only enhances the porosity but also increases the specific capacitance to 179 Fg−1, which is better than the previous results with Na2SO4 (80 Fg−1) and H2SO4 (64 Fg−1) (Chaisit et al., 2020; Ospino Orozco et al., 2022). By optimizing the KOH concentration, this research offers a more effective and scalable method for producing high-performance supercapacitor electrodes.
2 Materials and methods
2.1 Materials
Waste Manihot esculenta was procured from a traditional market in Malang, Indonesia. All chemicals employed in this study were of analytical purity and used without further refinement: potassium hydroxide (KOH, Sigma Aldrich Chemical Reagent Co., USA), hydrochloric acid (HCl, Sigma Aldrich Chemical Reagent Co., USA), N-methyl-2-pyrrolidone (NMP, Sigma Aldrich, Burlington, MA, USA), polyvinylidene fluoride (PVDF, Dongguan Gelon LIB Co., Ltd., China), and carbon black (CB, Imerys, La Hulpe, Belgium) as a conductive additive. Nickel foam served as the substrate, and coin-type cells were obtained from TOB Machine, Fujian, China.
2.2 Activated carbon synthesis
As shown in Fig. 1, the Manihot esculenta was subjected to chemical activation. The initial step in this process was peeling the Manihot esculenta to remove the peel from the tubers. In this study, the tubers of Manihot esculenta were used. Then, the Manihot esculenta tubers were cut into ±3 cm in size and dried under the sun for 12 h to remove excess moisture. The dried Manihot esculenta tubers were pre-carbonated at 400 °C for 2 h until they turned carbon. Next, the carbonized Manihot esculenta tubers were pulverized and passed through a 200-mesh sieve to achieve a uniform particle size. The Manihot esculenta tubers carbon was mixed in 50 mL of KOH solution with concentrations of 0 M, 1 M, 2 M, and 4 M (called C-S0, AC-S1M, AC-S2M, and AC-S4M) and stirred for 24 h at room temperature. The washing process was carried out in 2 stages, the first washing using 1 M HCl, then continued using distilled water until it reached a neutral pH. The activated carbon was desiccated in an oven at 110 °C for 24 h, followed by calcination in a furnace at 600 °C for 60 min.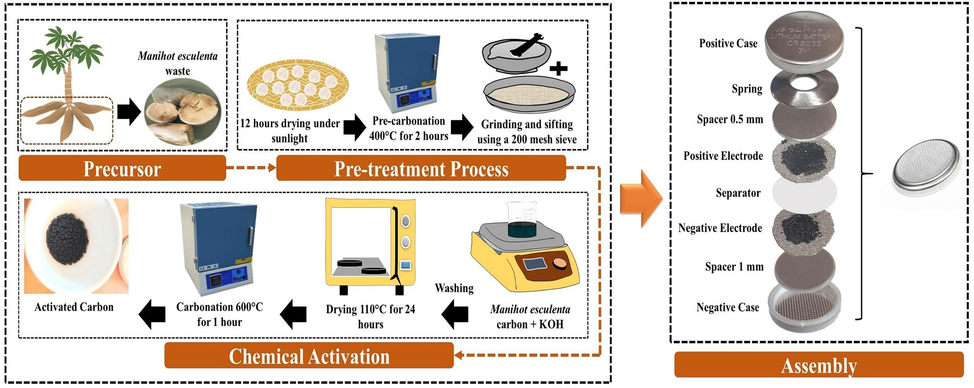
Synthesis schematic illustration and EDLC coin cell assembly of Manihot esculenta tubers-activated carbon.
2.3 Electrode preparation and fabrication of EDLC coin cell
The electrodes were fabricated by mixing activated carbon derived from Manihot esculenta tubers as the active material, carbon black (CB), and PVDF in a weight ratio of 8:1:1. The total mass of the electrode was 1 g, with 0.8 g consisting of the active material. The resulting slurry was homogenized through 12 h of continuous stirring. The nickel foam substrate was cut into the form of a disc with a diameter of 1.5 cm. The nickel foam substrate was coated on both sides with 20 µL of Manihot esculenta tubers-based electrode paste using a micropipette. The electrodes were heated in an oven at 80 °C for 1 h. Manihot esculenta activated carbon electrodes were pressed with a load of 500 kg to produce thin film electrodes. Finally, the electrodes were immersed in 5 mL of 6 M KOH solution electrolyte for 24 h. The electrodes were arranged using a coin cell, with the arrangement as shown in Fig. 1.
2.4 Materials characterization
The microstructure of the activated carbon was examined through scanning electron microscopy (SEM), Brunauer-Emmett-Teller (BET) analysis, X-ray diffraction (XRD), Raman spectroscopy, Fourier transform infrared (FTIR), and X-ray photoelectron spectroscopy (XPS). SEM with the brand FEI Inspect-S50 type was used to determine the pore structure of the activated carbon of Manihot esculenta tubers. The N2 adsorption analyzer utilizes the Brunauer-Emmet-Teller (BET) method using Tristar II Plus 3020. The micropore volume (Vmicro) and external surface area (Sext) from the N2 adsorption were determined by t-plot using the De Boer method in Eq. (1) (De Boer, 1965),
2.5 Electrochemical measurements
Electrochemical properties of the coin cell supercapacitor were evaluated using galvanostatic charge–discharge (GCD), cyclic voltammetry (CV), and electrochemical impedance spectroscopy (EIS). GCD measurements were performed on a NEWARE Battery Testing System, while CV and EIS were conducted using a Palmsens4 potentiostat. EIS measurements use a frequency range of 0.01 to 100 kHz. The charge–discharge cycle was measured at a current density of 0.1 Ag−1, and a cut-off voltage of 0.0–1.0 V. Specific capacitance was determined from the discharge current (I), discharge time (t), electrode mass (m), and potential difference (ΔV) using Eq. (4) (Zapata Benabithe et al., 2013),
3 Results and discussion
3.1 Morphological and microstructure analysis
SEM images of activated carbon from Manihot esculenta tubers before and after activation are shown in Fig. 2(a – d). SEM image with low magnification (800×) shows that increasing the KOH concentration in the activation process produces increasingly smaller activated carbon particles from Manihot esculenta tubers. KOH plays a role in the process of breaking down larger carbon particles into smaller and more uniform structures, thereby increasing the efficiency and performance of electrical energy storage (Chaudhary et al., 2024).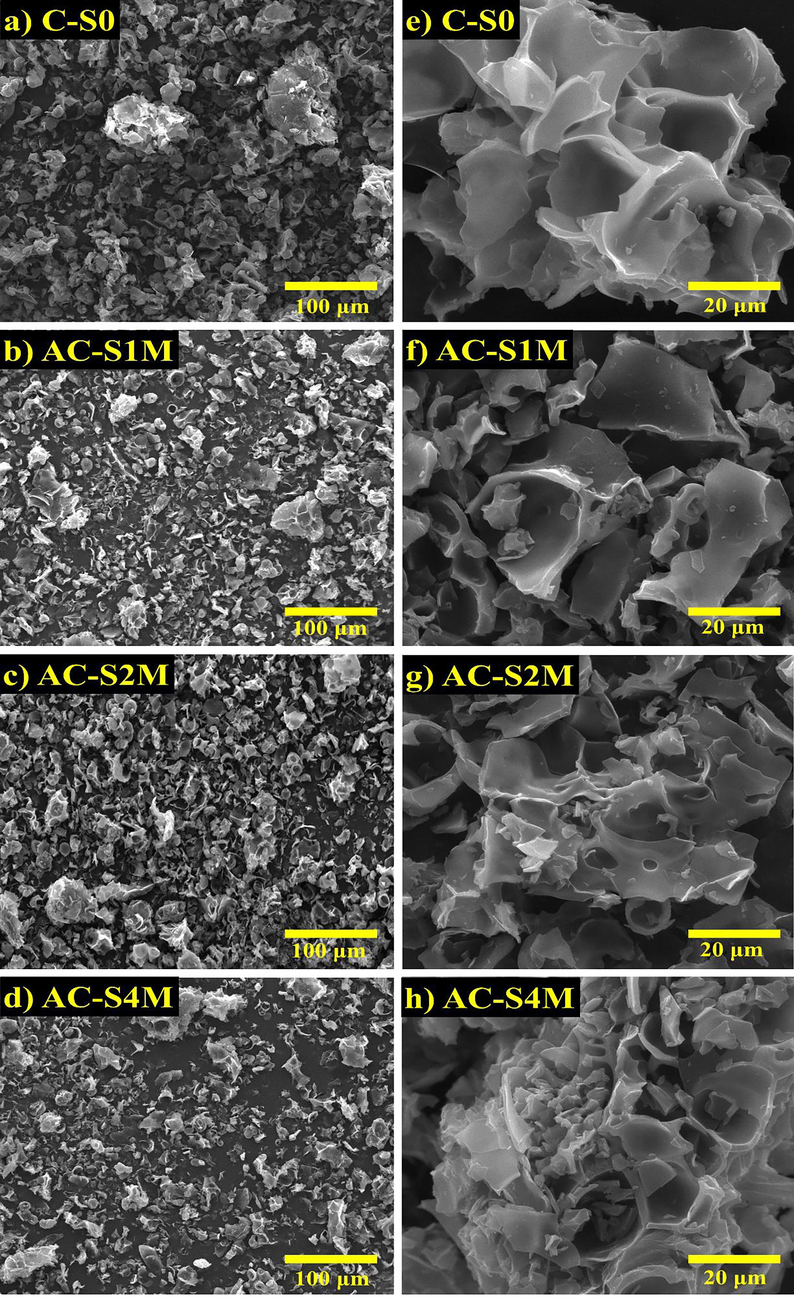
SEM images magnification 800× (a-d) and 5000× (e-h) of Manihot esculenta tubers-activated carbon on the variation of KOH activator.
Fig. 2(e – h) depict the porosity morphology of activated carbon derived from Manihot esculenta tubers. The surface morphology reveals a porous and smooth structure, which varies with the concentration of the KOH activator. The KOH activator plays a role in the formation of sponge-shaped pores in the activated carbon derived from Manihot esculenta tubers. Morphological analysis indicates that pore diameter decreases with increasing KOH concentration. Fig. 2(e) shows that pre-activated Manihot esculenta tubers have pores with larger diameters. Fig. 2(f – h) show that post-activation with KOH, activated carbon pores increase, and the pore diameter decreases. The sponge-like pore structure facilitates rapid ion transport within the electrode, leading to enhanced electrochemical properties in supercapacitors (Wu et al., 2025). The pore structure of activated carbon significantly impacts the accessibility of ions to the electrode surface. The pore structure of activated carbon derived from Manihot esculenta tubers is open and directly connected to the electrode surface, facilitating faster ion mobility. Table 1 presents the characteristics of the activated carbon derived from Manihot esculenta tubers, including particle dimensions, pore size, and porosity percentage. Variations in dimensions and pore size can lead to differences in porosity, which consequently can affect the electrical performance (Atchudan et al., 2022).
Sample
Particle Size (μm)
Pore Diameter (μm)
% of Porosity
C-S0
12.371
4.069
64.158
AC-S1M
8.905
3.422
73.542
AC-S2M
5.811
2.184
74.456
AC-S4M
5.480
1.789
74.918
Table 1 shows that particle size and pore diameter decrease, but the porosity percentage increases with increasing KOH activator concentration. According to research conducted by (Chaisit et al., 2020), particle size affects the decrease of the surface area. The role of KOH in the activation process is to oxidize and erode other materials in the carbon. The KOH activator also breaks bond chains to reduce particle size and increase porosity. The smaller particle size distribution results in smaller and more numerous pores, enhancing supercapacitor performance. The reduced particle size and increased pores signify high electrochemical performance and capacitance, attributed to the enhanced capacity for accommodating electrolyte ions within the pores and improved electrolyte ion diffusion.
Pore structures of Manihot esculenta tubers-activated carbon were contrasted and analysed to further explore their physical properties. Adsorption and desorption isotherm analysis of N2 was carried out through BET characterization, aiming to analyse Manihot esculenta tubers-activated carbon pore properties and specific surface area. BET analysis on Manihot esculenta tubers-activated carbon is presented in Fig. 3(a – d). Based on Fig. 3(a), a linear graph of isotherms shows that Manihot esculenta tubers-activated carbon corresponds to the type I isotherm (P/Po <0.3) according to the IUPAC classification (Rawal et al., 2018). The graph begins with the sharp increase caused by the absorption process of the main nitrogen gas. A sharp increase at P/Po <0.3 indicates the sample has microporous-sized particles with a small external surface area. A steady increase after the initial rise indicates the presence of mesoporous and macropore-sized particles. The adsorption and desorption of N2 on the samples yielded overlapping graphs, signifying the presence of numerous microporous-sized particles. Mesopore analysis is depicted in the BJH pore size distribution, which shows that Manihot esculenta tubers-activated carbon has a pore diameter range of 1.9–3.8 nm, as illustrated in Fig. 3(b). Based on research by M. Vinayagam et al., the findings indicate the existence of micropores in the samples (Vinayagam et al., 2024b). The t-plot for the Manihot esculenta activated carbon was constructed within the relative pressure range of 0.05 to 0.35. Micropore volume and external surface area were subsequently determined from the t-plot intercept and slope, respectively, using Eqs. (2) and (3) (Fig. 3(c)).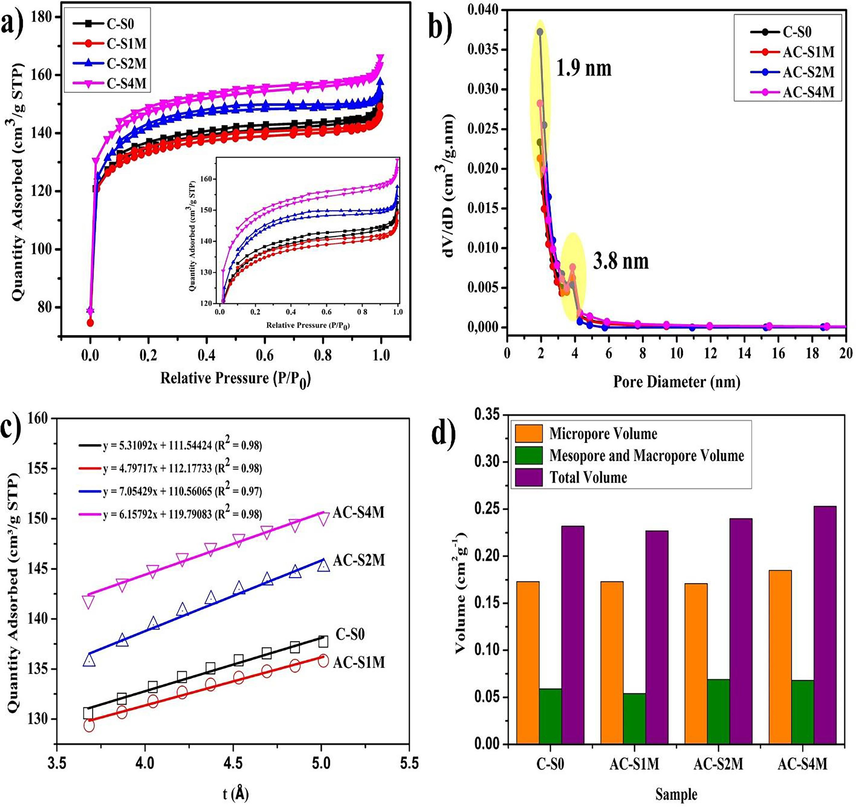
(a) BET isoterm plot, (b) BJH pore diameter distribution, (c) t-plot graph, (d) pore volume distribution of Manihot esculenta tubers-activated carbon at various concentrations of KOH activator.
Table 2 reveals that the AC-S4M sample possesses the highest micropore surface area (376.382 m2g−1), external surface area (95.263 m2g−1), and total BET surface area (471.645 m2g−1), along with a micropore volume of 0.185 cm3g−1. According to Fig. 3(d), Manihot esculenta tubers-activated carbon exhibits a higher micropore volume than mesopore and macropore volumes. Microporous-sized particles are very good at increasing the ability to store electrochemical energy (Supawet Phainuphong et al., 2022). The BET surface area of activated carbons derived from Manihot esculenta tubers was determined for various activator concentrations and is presented in Table 2. The C-S0 sample has the lowest surface area of 413,794 m2g−1. The activation process significantly increases the surface area of the samples. Specifically, surface areas of 418.695, 449.417, and 471.645 m2g−1 were achieved for AC-1 M, AC-2 M, and AC-4 M, respectively. The larger surface area can increase the charge storage capacity for energy applications.
Sample
BET SSA (m2g−1)
Daved (nm)
Pore Volume (cm3g−1)
Smicroa
Sextb
SBETc
Vmicroe
Vmeso+macrof
Vtg
C-S0
331.634
82.160
413.794
2.247
0.173
0.059
0.232
AC-S1M
344.483
74.212
418.695
2.171
0.173
0.054
0.227
AC-S2M
340.287
109.129
449.416
2.132
0.171
0.069
0.240
AC-S4M
376.382
95.263
471.645
2.145
0.185
0.068
0.253
The diffraction pattern using XRD from Manihot esculenta tubers-activated carbon and Thailand commercial activated carbon is presented in Fig. 4(a) to analyse the phase and crystallinity of the activated carbon of Manihot esculenta tubers. The diffraction of Manihot esculenta tubers-activated carbon is marked as pre-activation (C-S0), post-chemical activation (AC-S1M, AC-S2M, AC-S4M), and commercial activated carbon (AC-Commercial). X-ray diffraction patterns of activated carbon prepared from Manihot esculenta tubers reveal characteristic peaks at 2θ = 23° (002) and 43° (100). The presence of an amorphous phase, along with a well-defined peak at 2θ = 23° indicative of a graphitic structure, is supported by the diffraction pattern (Yang et al., 2020). The amorphous phase of Manihot esculenta tubers-activated carbon adopts a turbostratic model, signifying a graphite-like layer with microscopic defects and irregularities, and includes two diffraction peaks within the graphite peaks on a flat plane (planar). Based on the XRD diffraction pattern, the first diffraction peak with a large area is produced at 2θ = 19.58° (C-S0), 23.77° (AC-S1M), 23.56° (AC-S2M), 23.56° (AC-S4M), and 23.56° (AC-Commercial). The first peak in the C-S0 sample is not located in the same place as the other samples. The KOH is indicated to be responsible for rearranging the carbon atoms to their correct location (Farma et al., 2021b; Latupeirissa et al., 2016). The second peak is at 2θ = 43.33° (AC-S1M), 42.75° (AC-S2M), 42.75° (AC-S4M), and 43.29° (AC-Commercial), with an area smaller than the first peak. The low peak intensity in the C-S0 sample is due to the lack of chemical activation and high-temperature carbonation, where final carbonation leads to the rearrangement of carbon, forming more carbon-intensive materials. In AC-S1M and AC-S2M samples, the low intensity of the second peak indicates incomplete formation of activated carbon. The AC-S4M sample shows the highest diffraction peak intensity, and the intensity increases with higher KOH concentration, revealing the formation of a hexagonal crystal structure from cellulose content. The increase in KOH activator concentration is directly related to the smaller particle size. The chemical activation process of carbon-based Manihot esculenta tubers produces a diffraction pattern similar to that of commercial activated carbon.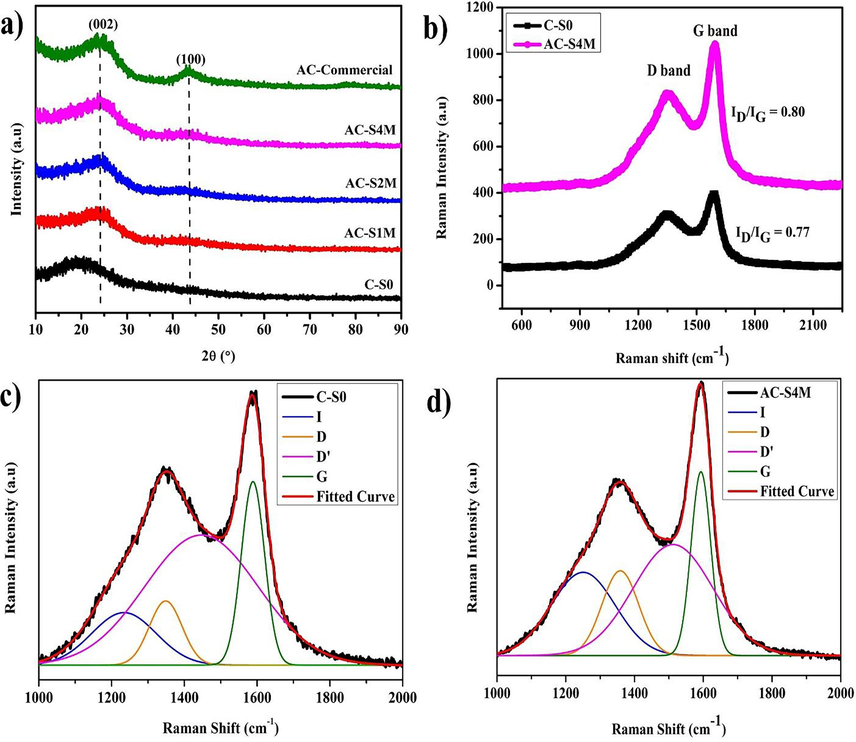
(a) XRD diffraction pattern, (b) Raman spectra, (c) Raman deconvulation curve of the C-S0 sample, (d) Raman deconvulation curve of the AC-S4M sample.
The activated carbon structure of Manihot esculenta tubers is more explicitly understood through Raman characterization. Raman characterization is a sensitive method used to detect abnormalities in carbon materials at the molecular level and analyze the chemical bonds responsible for resonance in the Raman spectrum. Based on Fig. 4(b – d), four peaks (I, D, D', G band) are observed in the Raman characterization of Manihot esculenta tubers-activated carbon. As demonstrated in the study by Chen, Weimin, et al. and Yin, Yanshan, et al., the fitting process was applied to the four peaks obtained in our research (Chen et al., 2017; Yadav et al., 2022; Yin et al., 2018). The peaks are the D band (1300–1400 cm−1) and the G band (1500–1600 cm−1). Based on Table 3, the I band at 1233.943 cm−1 (C-S0) and 1250.392 cm−1 (AC-S4M) indicate the presence of impurities in the structure of graphite. The D band represents a defect carbon that has a lower intensity than the G band (Ahmed et al., 2018; Yumak et al., 2019). The D band is related to the charge storage capacity of Manihot esculenta tubers-activated carbon, indicating the interaction between graphite carbon atoms and electrolyte ions (Sahoo and Rao, 2021). The D' band observed at 1446.767 cm−1 (C-S0) and 1512.185 cm−1 (AC-S4M) is associated with amorphous sp2-bonded carbon fragments or functional groups within the disordered structure. The bands located at 1446.767 cm−1 (C-S0) and 1512.185 cm−1 (AC-S4M) suggest irregularities in the stacking sequence of the graphite layers. The G band is associated with the Irregularities in the arrangement of the graphite layer and levels of electrical conductivity. In the C-S0 sample, an ID/IG ratio of 1.258 is in the D band (1348.667 cm−1) and G band (1588.518 cm−1). The AC-S4M sample shows an ID/IG ratio of 1.243 in the D band (1358.519 cm−1) and G band (1593.114 cm−1) positions. The elevated ID/IG ratio observed in the AC-S4M sample signifies increased structural irregularities in the carbon and a reduction in crystal size. The results presented here corroborate those obtained from SEM analysis. The peaks of the D band and G band are vibrational modes of sp2-bonded carbon atoms, which indicate the presence of an irregular microcrystalline structure or amorphous structure. The increase in FWHM in band D in the AC-S4M sample shows that defective species in the sp2 clusters increase due to the influence of chemical activation. Raman characterization shows results that are in accordance with XRD characterization.
Sample
Raman shift (cm−1) of each parameter
FWHMDe
Ia
Db
D’c
Gd
C-S0
1233.943
1348.667
1446.767
1588.518
105.905
AC-S4M
1250.392
1358.519
1512.185
1593.114
125.440
Fig. 5 presents the FTIR characterization results of activated carbon derived from Manihot esculenta tubers at different KOH concentrations. FTIR spectroscopy was employed to characterize the functional groups of activated carbon produced from Manihot esculenta tubers. Based on Fig. 5, the Manihot esculenta tubers activated carbon functional group has a wave number range of 526–3629 cm−1 with increasing and decreasing absorption peaks. The FTIR spectrum of the C-S0 sample is different from the FTIR spectrum of the AC-S1M, AC-S2M, and AC-S4M samples. The samples with chemical activation have a uniform shape. The activation process produces an O
H (hydroxyl) absorption peak for the phenolic functional group located at 3632.60 cm−1 for AC-S1M, AC-S2M, and 3643.19 cm−1 for AC-S4M. The activation process, involving KOH and subsequent carbonation, decomposes phenolic compounds, releasing carbon dioxide gas. The gas evolution contributes to enhanced porosity and surface area development in the activated carbon derived from Manihot esculenta tubers (Darvishi et al., 2021). The presence of hydroxyl groups (O
H), evidenced by the absorption band between 3200 and 3850 cm−1, suggests residual water content from the activation process (Ospino Orozco et al., 2022). At wave numbers 2927–3056 cm−1, the aliphatic C
H functional group has a low absorption peak in samples AC-S1M, AC-S2M, and AC-S4M. The decrease in the absorption peak can be explained by the loss of hydrogen (H) atoms, which evaporate during the activation phase (Mopoung et al., 2015). The wave number range 1600–1820 cm−1 contains the C = O functional group, located at a wavelength of 1716.41 cm−1. The presence of lignin in the activated carbon derived from Manihot esculenta tubers is indicated by the C = O functional group. In the wave number range 1553–1635 cm−1, there is a C = C functional group. The activated carbon derived from Manihot esculenta tubers showed a C = C group at 1586.56 cm−1. The C = C group indicates the presence of aromatic compounds that make up the hexagonal structure of activated carbon. The presence of a C
O group at 1228.9 cm−1 indicates the polar nature and high absorption capacity of Manihot esculenta tubers-activated carbon (Wijaya et al., 2018). The C
C functional groups were between wave numbers 767.05 to 903.12 cm−1, indicating the presence of cellulose in activated carbon. In activated carbon samples that have been activated using KOH, the aromatic C
H functional groups are detected at wavenumbers of 832 cm−1 and 525 cm−1. The aromatic C
H group shows that there are pores on the surface of the activated carbon (Baloch et al., 2021; Wang et al., 2021b).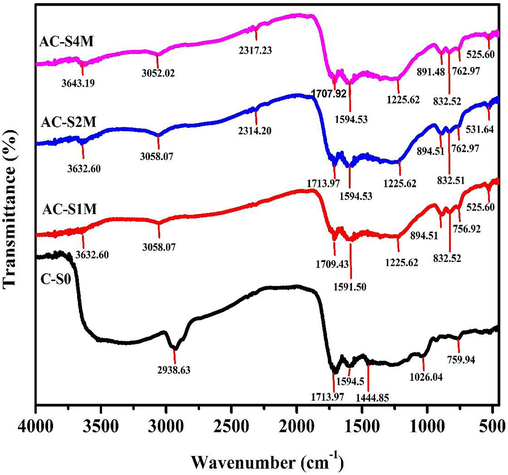
FTIR spectra of Manihot esculenta tubers-activated carbon at various concentrations of KOH activator.
The XPS spectra results show further analysis of the chemical elements of Manihot esculenta tubers activated carbon at a 4 M concentration of KOH activator, as presented in Fig. 6. Based on Fig. 6(a), the XPS observed spectrum of Manihot esculenta tubers activated carbon at a 4 M concentration of KOH activator shows the presence of carbon, oxygen, and silicon elements. The high-resolution O1s XPS spectrum in Fig. 6(b) deconvoluted into three components, corresponding to C–O (533.90 eV), C–O–C (532.29 eV), and C = O (530.85 eV) bonds, respectively (Wang et al., 2021b). The C–O–C bond exhibits an area percentage of 56.44 %, surpassing the C = O bond at 24 % and C–O at 19.55 %. A high C–O–C bond percentage indicates the presence of an ether group, which influences the absorption capacity from activated carbon. Fig. 6(c) illustrates three distinct chemical states of carbon, each characterized by different peaks. Deconvolution of the C1s peak reveals three distinct components centered at 288.69 eV (C = C aromatic), 286.42 eV (C–O), and 284.79 eV (C–C), with the C–C component exhibiting the highest peak area (Owusu et al., 2020). In line with the FTIR characterization results, the C–C bonds are attributed to the cellulose content present in Manihot esculenta tubers. Meanwhile, as depicted in Fig. 6(d), the SiO2 presence is evident in the Si 2p peak, displaying a low peak intensity at the binding energy position of 102.43 eV. The Si 2p peak is derived from the precursor content of Manihot esculenta tubers, which persists even after activation. The presence of Si 2p peak was observed in activated carbon derived from rice husk (Barakat et al., 2022).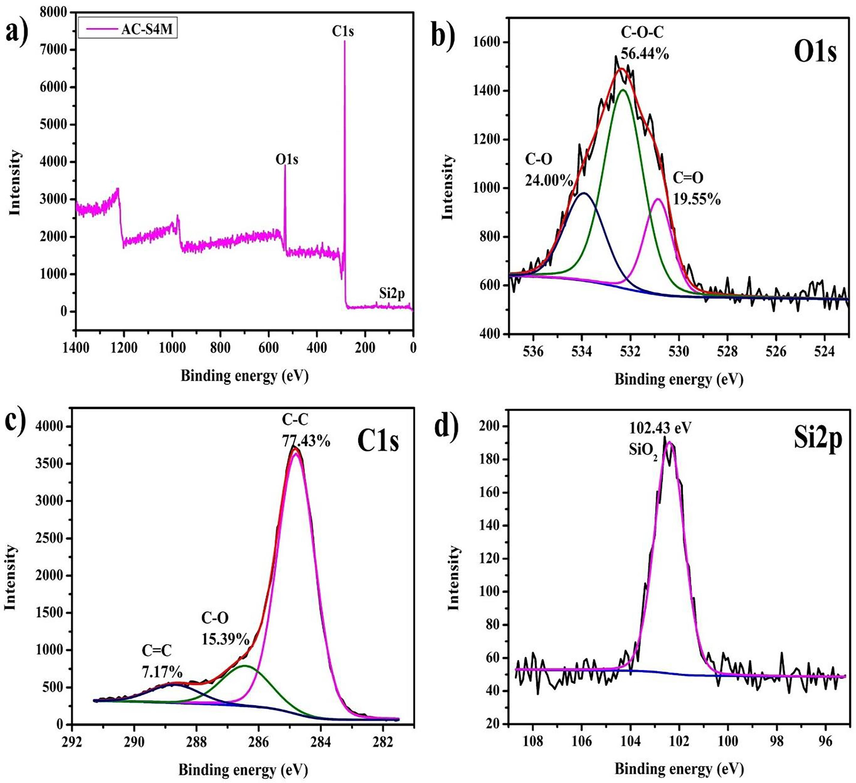
XPS spectrum of Manihot esculenta tubers-activated carbon at 4 M KOH activator concentration, (a) survey spectrum, (b) O1s spectrum, (c) C1s spectrum, and (d) Si2p spectrum.
3.2 Electrochemical performance
Fig. 7(a) shows the charge–discharge graph that was performed at various KOH concentrations on supercapacitor electrodes made of carbon activated by Manihot esculenta tubers. The GCD in Fig. 7(a) shows the ability to charge and discharge the supercapacitor electrodes from 0 V to 1 V. Fig. 7(b) illustrates the stability retention of the AC-S4M sample, demonstrating a retention rate of 93.96 % at the 100th cycle. The initial increase in retention over the first 20 cycles suggests the activation of the electrode during the charge–discharge process (Selvaraj et al., 2020). The charging process occurs when the supercapacitor undergoes a transient phase following the application of a supply voltage. The higher voltage with increasing time indicates that the Manihot esculenta tubers-activated carbon electrode responds fast to an electric field. The higher voltage during the charging process also demonstrates the capability of the electric field to orient activated carbon molecules, leading to polarization within the supercapacitor (Vinayagam et al., 2021). During discharge, a significant electric charge is transferred to the resistance. The transfer is evident from the voltage, which decreases sharply when the discharge process begins (Diantoro et al., 2022). Fig. 7(c) depicts the configuration of the coin cell supercapacitor during charging and discharging processes. The resulting graph forms an imperfectly symmetrical triangle, which characterizes the EDLC supercapacitor (Wei et al., 2020).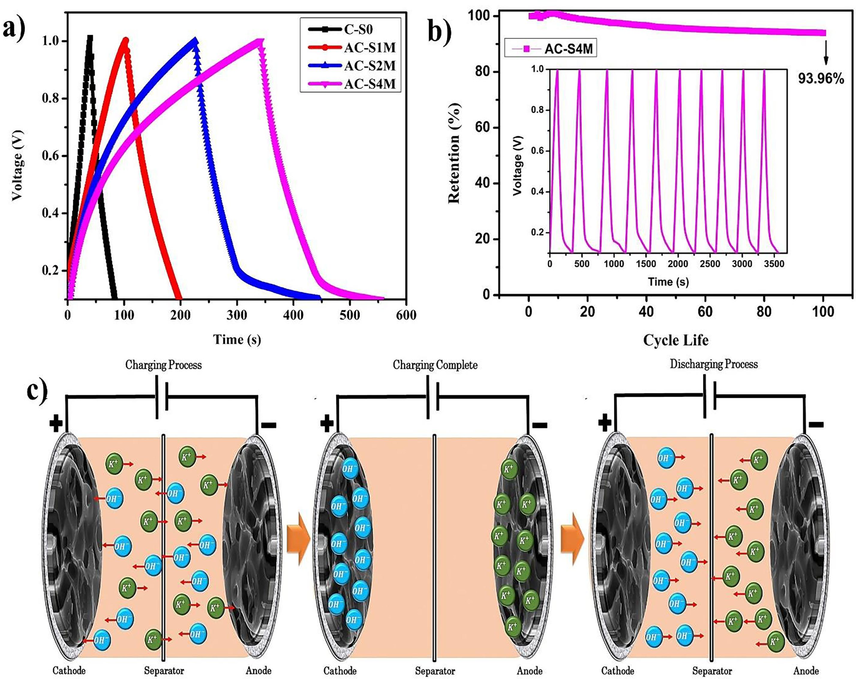
(a) GCD curves, (b) capacitance retention, and (c) the coin cell supercapacitor configuration scheme during the charging and discharging process.
GCD graphs can be processed to produce specific capacitance, energy density, and power density, as shown in Table 4, which illustrates the impact of increased KOH concentration on these parameters. The AC-S4M sample demonstrates the highest performance, signifying that the electrode can store significant electrolyte ions. Optimizing the ion-transfer pathway is essential for improving electrolyte accessibility to the micropore structure (Vinayagam et al., 2020). The performance is corroborated by BET analysis, which reveals the presence of microporous structures in the activated carbon, leading to high-performance supercapacitors (Vinayagam et al., 2024a). Nickel foam substrates enhance the active surface area and improve the interface for electrolyte ion diffusion, effectively capturing electrons and providing a robust pathway for electrolyte ion transport. The comparison of electrochemical supercapacitors derived from biomass-activated carbon using KOH activators is presented in Table 5.
Sample
Specific Capacitance (Fg−1)
Energy Density (Whkg−1)
Power Density (Wkg−1)
C-S0
20.03
2.051
171.740
AC-S1M
43.36
4.529
173.44
AC-S2M
97.51
10.242
173.920
AC-S4M
146.57
15.525
174.660
Biomass
Activating Agent
Specific Capacitance (Fg−1)
Energy Density (Whkg−1)
Power Density
(Wkg−1)Rct (Ω)
Electrochemical Measurements
Ref.
Cocoa Skin
KOH 0.4 M
140.2
−
−
−
Three electrode system
(Yuli et al., 2021)
Sugarcane Bagasse
KOH 0.3 M
146.89
3.83
209
1.59
Supercapacitor cell
(Taer et al., 2014)
Banana stem
KOH 0.5 M
170
−
−
3.80
Sandwich type
(K et al., 2017)
Coffee
KOH 1:1 ratio
74
−
−
−
Coin cell device
(Choi et al., 2019)
Manihot esculenta peel
KOH 70 %
62.16
−
−
−
Three electrode system
(Ospino Orozco et al., 2022)
Pomelo peel
KOH 1:4 ratio
43.5
17.1
420
0.47
Three electrode system
(Peng et al., 2014)
Cigarette filters
KOH
52
7.2
127
−
Sandwich type
(Bi et al., 2022)
Sweet corn husks
KOH 1:4 ratio
80
20
0.68
7.80
Coin cell device
(Usha Rani et al., 2020)
Rice Straw
KOH 1:3 ratio
80
17.4
126
−
Three electrode system
(Sudhan et al., 2017)
Baobab fruit shells
KOH 1:1 ratio
56.67
20.86
400
2.06
Solid-state supercapacitor device
(Mohammed et al., 2019)
Cocos nurifera
ZnCl2 and KOH
279.56
7.52
220.00
−
two-symmetric electrode system
(Subraya Hegde and Ramachandra Bhat, 2024)
Mangifera indica leaf
FeCl3, KOH
521.65
17.04
242.50
−
two symmetric electrode system
(Hegde and Bhat, 2024a)
Tectona grandis
FeCl3, KOH
572.0
−
−
−
two symmetric electrode system
(Hegde and Bhat, 2024b)
Fatsia Japonica seed
KOH
140
23
550
1.50
Coin cell device
(Li et al., 2020)
Manihot esculenta tuber
KOH 4 M
147.57
15.53
174.66
2.19
Coin cell device
This work
Fig. 8(a) and Fig. 7(b) display the CV curves of the EDLC supercapacitor coin cell, which reveal a quasi-rectangular shape representing the relationship between voltage and current. Based on the graph, there are two types of currents. The charge current (Ic) is shown in the voltage range of −0.4 to 1.0 V, and the output current (Id) is in the voltage range of 1.0 to −0.4 V. Fig. 8(a) at a scan rate of 80 mVs−1 is rectangular with a more prominent curve area when the KOH concentration is increased. The AC-S4M sample exhibited the largest cyclic voltammetry curve area, suggesting rapid electrolyte ion diffusion, and has the highest specific capacitance. Fig. 8(b) shows the CV on the AC-S4M sample at different scan rates of 20, 50, and 80 mVs−1. The graph shows the characteristics of an EDLC supercapacitor with a rectangular curve. Increased scan rate during cyclic voltammetry measurements resulted in a larger enclosed area, indicating a higher electrochemical performance associated with lower internal resistance at the electrode–electrolyte interface (Thirumal et al., 2022). Activated carbon in a sponge can retain electrolyte ions, thereby increasing charge storage capacity and improving supercapacitor performance (Lobato-Peralta et al., 2023). Fig. 9(a and b) illustrate the Ragone plot and correlation between the pore structure of activated carbon and the specific capacitance of the supercapacitor (Chaitra et al., 2017; Qian et al., 2014; Wang et al., 2021a; Wang et al., 2013, 2020; Young et al., 2022). Based on Fig. 9(a), activated carbon derived from Manihot esculenta exhibits superior power density compared to activated carbon sourced from Nipah fruticans fruit, bamboo stalk, Shorea robusta wood dust, and bamboo carbon (Farma et al., 2021a; Gong et al., 2017; Muthi Aturroifah et al., 2024; Shrestha and Rajbhandari, 2021).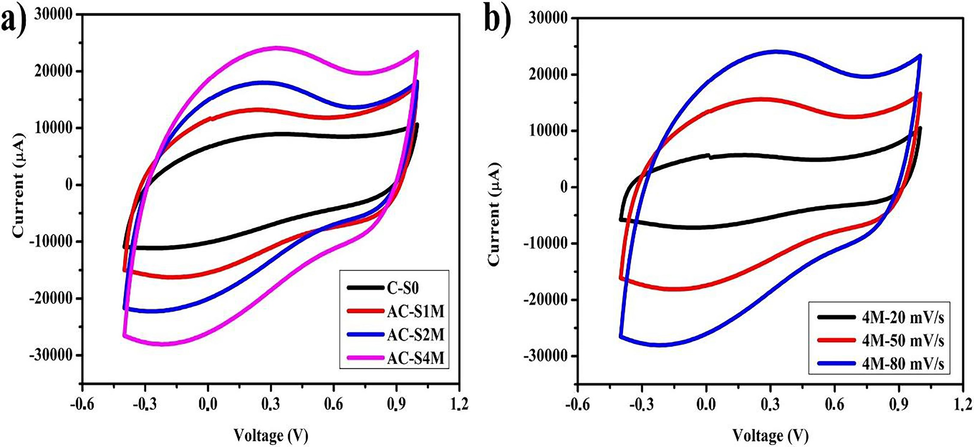
(a) CV curves with scan rate 80 mV/s, (b) CV curves AC-S4M sample.

(a) Ragone plot of the Manihot esculenta activated carbon supercapacitor compared with different biomass, (b) the comparison of the pore shape of activated carbon with the specific capacitances.
Further investigation in term of electrochemical performance of supercapacitors based on Manihot esculenta tubers-derived activated carbon was conducted through EIS, which provided insights into impedance and resistance capabilities. Impedance is related to capacitive performance or alternating current movement, while resistance is related to resistance from a device or direct current movement (Gharbi et al., 2020; Kim et al., 2019). The data obtained from the EIS is in the form of a Nyquist plot. The Nyquist plot is shown from the real (Z') and imagined (Z“) impedance values, as shown in Fig. 10(a). Fig. 10(a) shows a smaller diameter of quasi-semicircle with increasing KOH concentration. The diameter of the quasi-semicircle represents the charge transfer resistance of cations from the electrolyte to the electrode matrix (Rct). Electrochemical performance is better if the device resistance is low, indicated by a small Rct (Hasan et al., 2022; Shahrokhian et al., 2018; Thirumal et al., 2022). The Rct is an essential indicator for determining the electrochemical rate of supercapacitors (Muthurasu and Ganesh, 2012). The increase in the electrochemical performance is associated with the decrease in initial resistance (Rs) and Rct (Charoensook et al., 2021b).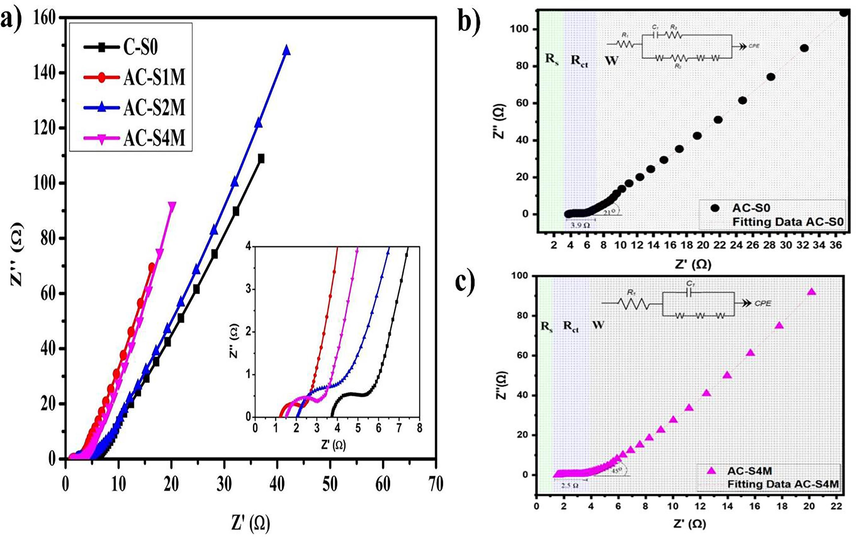
(a) Nyquist plot of Manihot esculenta tubers-activated carbon electrodes, fitting of the EIS data using an equivalent circuit model for supercapacitor coin cell (b) C-S0 and (c) AC-S4M.
Fig. 10(b and c) shows that comparing the Nyquist fitting data for sample C-S0 and sample AC-S4M, sample C-S0 has higher resistance than sample AC-S4M. Sample AC-S4M has lower Rs and Rct than sample C-S0. Based on Table 6, the Rct is 4.3 Ω for the C-S0 sample and 2.2 Ω for the AC-S4M sample. Apart from Rct, Rs is also an important indicator of supercapacitor performance. Rs represents the overall resistance, encompassing both the bulk resistance of the electrolyte and the interfacial resistance at the electrode–electrolyte interface. The Rs on C-S0 and AC-4 M are 3.1 and 0.7 Ω. Less resistance in the electrolyte pathway is characterized by lower Rs and Rct, thereby increasing conductivity and device performance. Fig. 10(b and c) shows illustrates a Randles equivalent circuit model consisting of internal resistance (Rs) in series with a capacitance (C1) connected in parallel by a combination of charge transfer resistance (Rct) and Warburg impedance (ZW) with a Warburg element (W open, W short, and W) as shown in Table 6.
Sample
Rs (Ω)
Rct (Ω)
C (F)
Wo (Ω)
Ws (Ω)
W (Ω)
C-S0
3.1
4.3069
1.66×10⁻⁵
5.2292
1.65×10⁻⁶
4.19×10⁻⁷
AC-S4M
0.7
2.1903
1.205×10⁻⁴
2.3577
0.25801
0.92299
Table 6 shows that decreased Rs and Rct increase the C, indicating the capacitance performance. Based on the EIS analysis results, an increased slope in the impedance plot correlates with improved electrochemical performance and higher capacitance values (Funari et al., 2020; Song et al., 2018; Zelinskyi et al., 2022). In addition to the semi-circular graph representing Rs and Rct, the straight line shows the Warburg area. The straight-line Warburg impedance (W) indicates the ion diffusion path capability, which is influenced by the capacitive properties of the material (Kurniawan et al., 2019; Zeigler et al., 2015). Several factors influence Warburg impedance, including electrolyte, morphology, and electrode material composition (Koseoglou et al., 2021; Laschuk et al., 2021). The optimal supercapacitor performance is achieved at a 45° angle on the Warburg line, owing to the equilibrium between diffusion and electrochemical reactions. The slope of the Warburg line shows that there is less resistance when electrons move between the electrode and the electrolyte (Lukács and Kristóf, 2020). Fig. 10(c) shows that the AC-S4M sample performs better, with the Nyquist forming an angle of 45° compared to the C-S0 sample. An angle slope approaching 90° signifies enhanced capacitive behavior within a device, characterized by the facile movement of KOH within the pores and rapid ionic diffusion (Chaudhary et al., 2019; Moreno-Fernández et al., 2019). The mechanism aligns with a report using NAC electrodes, which exhibited a significantly lower Warburg impedance (0.5291 Ω) compared to AC electrodes (0.8383 Ω), indicating better electronic conductivity (Abouelamaiem et al., 2018; Iqbal et al., 2020). The findings confirm that AC-S4M sample exhibits superior electrochemical and ionic diffusion performance compared to samples with lower KOH concentrations.
4 Conclusion
Manihot esculenta tubers-derived activated carbon demonstrates strong potential as a sustainable and efficient electrode material for supercapacitors, addressing the limitations of conventional capacitors. By employing chemical activation with varying KOH concentrations (0, 1, 2, and 4 M), we achieved a distinctive, sponge-like porous morphology, which is particularly pronounced in the optimized AC-S4M sample. This sample exhibited the highest surface area (471.65 m2g−1) and ideal pore diameter (2.67 nm), enhancing ion transport and electrolyte accessibility. Manihot esculenta tubers activated carbon has an amorphous structure with diffraction peaks at (002) and (100). Through a chemical activation process, activated carbon is produced, which is indicated by the functional groups C = O, C = C, C O, and C H. The symmetric supercapacitor coin cell utilizing AC-S4M achieved an impressive gravimetric capacitance of 146.57 Fg−1 at 0.1 Ag−1, and in a 6 M KOH aqueous electrolyte, delivered a high energy density of 15.525 Whkg−1 at a power density of 174.660 Wkg−1 with an Rct of 2.19 Ω. These findings establish Manihot esculenta tubers-derived carbon as a viable option for high-performance, scalable supercapacitor electrodes, advancing the development of sustainable energy storage solutions.
CRediT authorship contribution statement
Markus Diantoro: Writing – review & editing, Supervision, Conceptualization. Nuviya Illa Muthi Aturroifah: Writing – original draft, Methodology, Formal analysis. Joko Utomo: Writing – review & editing, Data curation. Ishmah Luthfiyah: Visualization, Formal analysis. Ida Hamidah: Writing – review & editing. Brian Yuliarto: Writing – review & editing. Andrivo Rusydi: Writing – review & editing. Worawat Meevesana: . Santi Maensiri: . Pramod K. Singh: Writing – review & editing.
Acknowledgments
The authors would like to acknowledge the Ministry of Culture, Higher Education, Research, Technology of the Republic of Indonesia and Universitas Negeri Malang through Riset Kolaborasi Indonesia 2022 research grant.
Funding
This research was funded by the national competitive grant of Riset Kolaborasi Indonesia 2022 from the Ministry of Higher Education, Research and Technology with a specific grant by Universitas Negeri Malang, Contract No. 17.5.51/UN32.20.1/LT/2022.
Declaration of Competing Interest
The authors declare that they have no known competing financial interests or personal relationships that could have appeared to influence the work reported in this paper.
References
- Synergistic relationship between the three-dimensional nanostructure and electrochemical performance in biocarbon supercapacitor electrode materials. Sustain. Energy Fuels. 2018;2:772-785.
- [CrossRef] [Google Scholar]
- Studies on structural, morphological, electrical and electrochemical properties of activated carbon prepared from sugarcane bagasse. J. Ind. Eng. Chem.. 2013;19:1470-1476.
- [CrossRef] [Google Scholar]
- Elucidating the role of copper-induced mixed phases on the electrochemical performance of Mn-based thin-film electrodes. ACS Omega. 2023;8:46640-46652.
- [CrossRef] [Google Scholar]
- Electrochemical performance and structural evolution of spray pyrolyzed Mn3O4 thin films in different aqueous electrolytes: effect of anions and cations. RSC Adv.. 2024;14:29748-29762.
- [CrossRef] [Google Scholar]
- Unveiling the versatile applications of cobalt oxide-embedded nitrogen-doped porous graphene for enhanced energy storage and simultaneous determination of ascorbic acid, dopamine and uric acid. J. Electrochem. Soc.. 2024;171 097510
- [CrossRef] [Google Scholar]
- Nitrogen doped activated carbon derived from orange peel for supercapacitor application. Adv. Nat. Sci. Nanosci. Nanotechnol.. 2018;9 035008
- [CrossRef] [Google Scholar]
- Facile synthesis of nitrogen-doped porous carbon materials using waste biomass for energy storage applications. Chemosphere. 2022;289:133225
- [CrossRef] [Google Scholar]
- Conversion of wheat husk to high surface area activated carbon for energy storage in high-performance supercapacitors. Biomass Bioenergy. 2021;144:105909
- [CrossRef] [Google Scholar]
- Catalytic upgradation of bio-oil over metal supported activated carbon catalysts in sub-supercritical ethanol. J. Environ. Chem. Eng.. 2021;9:105059
- [CrossRef] [Google Scholar]
- H3PO4/KOH Activation Agent for High Performance Rice Husk Activated Carbon Electrode in Acidic Media Supercapacitors. Molecules. 2022;28:296.
- [CrossRef] [Google Scholar]
- Comprehensive study of used cigarette filters-derived porous activated carbon for Supercapacitors: From biomass waste to sustainable energy source. J. Electroanal. Chem.. 2022;925:116915
- [CrossRef] [Google Scholar]
- Carbon-based composite materials for supercapacitor electrodes: a review. J. Mater. Chem. A. 2017;5:12653-12672.
- [CrossRef] [Google Scholar]
- Preparation, characterization, and electrochemical properties of KOH-activated carbon from cassava root. Mater. Res. Express. 2020;7:105605
- [CrossRef] [Google Scholar]
- KOH activated carbon derived from biomass-banana fibers as an efficient negative electrode in high performance asymmetric supercapacitor. J. Energy Chem.. 2017;26:56-62.
- [CrossRef] [Google Scholar]
- K. Charoensook, C. Huang, H. Tai, Y. Li. 2021b. Journal of the Taiwan Institute of Chemical Engineers Preparation of porous nitrogen-doped activated carbon derived from rice straw for high-performance supercapacitor application. 120. 246–256. https://doi.org/10.1016/j.jtice.2021.02.021.
- Preparation of porous nitrogen-doped activated carbon derived from rice straw for high-performance supercapacitor application. J. Taiwan Inst. Chem. Eng.. 2021;120:246-256.
- [CrossRef] [Google Scholar]
- Waste biomass-derived activated carbons for various energy storage device applications: A review. J. Energy Storage. 2024;78:109996
- [CrossRef] [Google Scholar]
- Nanocomposite having Flower -Shaped Morphology as Electrode for Electrochemical Supercapacitor Applications. ChemistrySelect. 2019;4:8719-8726.
- [CrossRef] [Google Scholar]
- High-performance supercapacitors based on a graphene–activated carbon composite prepared by chemical activation. RSC Adv.. 2012;2:7747.
- [CrossRef] [Google Scholar]
- Synergistical enhancement of the electrochemical properties of lignin-based activated carbon using NH3·H2O dielectric barrier discharge plasma. RSC Adv.. 2017;7:7392-7400.
- [CrossRef] [Google Scholar]
- Waste coffee management: deriving high-performance supercapacitors using nitrogen-doped coffee-derived carbon. J. Carbon Res.. 2019;5:44.
- [CrossRef] [Google Scholar]
- Ce and Mn/bio-waste-based activated carbon composite: Characterization, phenol adsorption and regeneration. J. Environ. Chem. Eng.. 2021;9 105788
- [CrossRef] [Google Scholar]
- Studies on pore systems in catalysts VII. Description of the pore dimensions of carbon blacks by the t method. J. Catal.. 1965;4:649-653.
- [CrossRef] [Google Scholar]
- Preparation of Porous Carbons Using NaOH, K 2 CO 3 , Na 2 CO 3 and Na 2 S 2 O 3 Activating Agents and Their Supercapacitor Application: A Comparative Study. ChemistrySelect. 2022;7
- [CrossRef] [Google Scholar]
- Electrochemical performance of symmetric supercapacitor based on activated carbon biomass TiO2 nanocomposites. J. Phys. Conf. Ser.. 2022;2243:12-77.
- [Google Scholar]
- Supercapacitor cell electrodes derived from nipah fruticans fruit coir biomass for energy storage applications using acidic and basic electrolytes. J. Phys. Conf. Ser.. 2021;2049:012043
- [CrossRef] [Google Scholar]
- Removal of Cu, Fe, and Zn from peat water by using activated carbon derived from oil palm leaves. Adv. Mater. Res.. 2021;1162:65-73.
- [CrossRef] [Google Scholar]
- Rheology of the Electric Double Layer in Electrolyte Solutions. Anal. Chem.. 2020;92:8244-8253.
- [CrossRef] [Google Scholar]
- Revisiting cyclic voltammetry and electrochemical impedance spectroscopy analysis for capacitance measurements. Electrochim. Acta. 2020;343
- [CrossRef] [Google Scholar]
- Natural biomass derived hard carbon and activated carbons as electrochemical supercapacitor electrodes. Sci. Rep.. 2019;9:16315.
- [CrossRef] [Google Scholar]
- Highly porous graphitic biomass carbon as advanced electrode materials for supercapacitors. Green Chem.. 2017;19:4132-4140.
- [CrossRef] [Google Scholar]
- Poly (Vinyl Alcohol)/Agar Hydrogel Electrolytes Based Flexible All-in-One Supercapacitors with Conducting Polyaniline/Polypyrrole Electrodes. Polymers (basel).. 2022;14:4784.
- [CrossRef] [Google Scholar]
- Rice husk-derived porous carbons with high capacitance by ZnCl2 activation for supercapacitors. Electrochim. Acta. 2013;105:635-641.
- [CrossRef] [Google Scholar]
- Sustainable energy storage: Mangifera indica leaf waste-derived activated carbon for long-life, high-performance supercapacitors. RSC Adv.. 2024;14:8028-8038.
- [CrossRef] [Google Scholar]
- Biomass waste-derived porous graphitic carbon for high-performance supercapacitors. J. Energy Storage. 2024;76:109818
- [CrossRef] [Google Scholar]
- Understanding the mechanism of two-step, pyrolysis-alkali chemical activation of fibrous biomass for the production of activated carbon fibre matting. Fuel Process. Technol.. 2022;235:107348
- [CrossRef] [Google Scholar]
- Preparation and Characterization of Magnetite Nanoparticles Combined with Polyaniline and Activated Carbon. IOP Conf. Ser. Earth Environ. Sci.. 2019;276:012041
- [CrossRef] [Google Scholar]
- A facile approach to investigate the charge storage mechanism of MOF/PANI based supercapattery devices. Solid State Ion.. 2020;354:115411
- [CrossRef] [Google Scholar]
- Production of Activated Carbon Electrode for Energy Storage Application in Supercapacitors via KOH Activation of Waste Termite Biomass. Waste Biomass Valoriz.. 2022;13:2689-2704.
- [CrossRef] [Google Scholar]
- Efficient supercapattery behavior of mesoporous hydrous and anhydrous cobalt molybdate nanostructures. J. Alloys Compd.. 2019;789:256-265.
- [CrossRef] [Google Scholar]
- A Novel On-Board Electrochemical Impedance Spectroscopy System for Real-Time Battery Impedance Estimation. IEEE Trans. Power Electron.. 2021;36:10776-10787.
- [CrossRef] [Google Scholar]
- Synthesis N-Doped Activated Carbon from Sugarcane Bagasse for CO2 Adsorption. IPTEK J. Technol. Sci.. 2019;30:80.
- [CrossRef] [Google Scholar]
- Reducing the resistance for the use of electrochemical impedance spectroscopy analysis in materials chemistry. R. Soc. Chem.. 2021;11:27925-27936.
- [Google Scholar]
- Lasrado, D., Ahankari, S., Kar, K.K., 2021. Global Trends in Supercapacitors 329–365. https://doi.org/10.1007/978-3-030-68364-1_10.
- Carbon characterization from Candlenut Shells (Aleurites Moluccana (L) Willd) with XRD. Indones. J. Chem. Res. 2016;3:324-328.
- [Google Scholar]
- Fatsia Japonica-Derived Hierarchical Porous Carbon for Supercapacitors With High Energy Density and Long Cycle Life. Front. Chem.. 2020;8
- [CrossRef] [Google Scholar]
- Preparation and Characterization of Nanocrystalline Cellulose from Cassava Stem Wastes by Electromagnetic Induction. J. Rekayasa Kim. Lingkung.. 2021;16:109-117.
- [CrossRef] [Google Scholar]
- Sponge-like nanoporous activated carbon from corn husk as a sustainable and highly stable supercapacitor electrode for energy storage. Diam. Relat. Mater.. 2023;138:110176
- [CrossRef] [Google Scholar]
- A generalized model of the equivalent circuits in the electrochemical impedance spectroscopy. Electrochim. Acta. 2020;363
- [CrossRef] [Google Scholar]
- Low-cost, high-performance supercapacitor based on activated carbon electrode materials derived from baobab fruit shells. J. Colloid Interface Sci.. 2019;538:308-319.
- [CrossRef] [Google Scholar]
- Characterization and properties of activated carbon prepared from tamarind seeds by KOH activation for Fe (III) adsorption from aqueous solution. Sci. World J. 2015
- [Google Scholar]
- Flat-shaped carbon–graphene microcomposites as electrodes for high energy supercapacitors. J. Mater. Chem. A. 2019;7:14646-14655.
- [CrossRef] [Google Scholar]
- Enhancing supercapacitor performance with cassava tuber- bamboo stem blended porous activated carbon: an environmentally friendly approach. E3S Web Conf.. 2024;517:10003.
- [CrossRef] [Google Scholar]
- Electrochemical characterization of Self-assembled Monolayers (SAMs) of silanes on indium tin oxide (ITO) electrodes - Tuning electron transfer behaviour across electrode-electrolyte interface. J. Colloid Interface Sci.. 2012;374:241-249.
- [CrossRef] [Google Scholar]
- Fabrication of Activated Carbon from Coconut Shells and its Electrochemical Properties for Supercapacitors. Int. J. Electrochem.. 2020;Sci:10854-10865.
- [CrossRef] [Google Scholar]
- Activated carbon from cassava peel: A promising electrode material for supercapacitors. Rev. Fac. Ing. Univ. Antioquia. 2022;102:88-95.
- [CrossRef] [Google Scholar]
- Activated carbon clothes for wide-voltage high-energy-density aqueous symmetric supercapacitors. Chinese Chem. Lett.. 2020;31:1620-1624.
- [CrossRef] [Google Scholar]
- Oxygen-enriched activated carbons from pomelo peel in high energy density supercapacitors. RSC Adv.. 2014;4:54662-54667.
- [CrossRef] [Google Scholar]
- Synthesis and characterization of activated carbon derived from rubberwood sawdust via carbonization and chemical activation as electrode material for supercapacitor. J. Adv. Res. Fluid Mech. Therm. Sci.. 2022;94:61-76.
- [CrossRef] [Google Scholar]
- Properties of Mn3O4 thin film electrodes prepared using spray pyrolysis for supercapacitor application. Mater. Chem. Phys.. 2023;307:128213
- [CrossRef] [Google Scholar]
- Unveiling the mass-loading effect on the electrochemical performance of Mn3O4 thin film electrodes: a combined computational and experimental study. Phys. Scr.. 2024;99:105922
- [CrossRef] [Google Scholar]
- Human hair-derived carbon flakes for electrochemical supercapacitors. Energy Environ. Sci.. 2014;7:379-386.
- [CrossRef] [Google Scholar]
- Synthesis and characterization of activated carbon from the biomass of Saccharum bengalense for electrochemical supercapacitors. J. Energy Storage. 2018;20:418-426.
- [CrossRef] [Google Scholar]
- A high energy flexible symmetric supercapacitor fabricated using N-doped activated carbon derived from palm flowers. Nanoscale Adv.. 2021;3:5417-5429.
- [CrossRef] [Google Scholar]
- Process of Activated Carbon form Coconut Shells Through Chemical Activation. Nat. Sci. J. Sci. Technol.. 2020;9
- [CrossRef] [Google Scholar]
- Cation intercalated one-dimensional manganese hydroxide nanorods and hierarchical mesoporous activated carbon nanosheets with ultrahigh capacitance retention asymmetric supercapacitors. J. Colloid Interface Sci.. 2020;566:485-494.
- [CrossRef] [Google Scholar]
- Nickel-cobalt layered double hydroxide ultrathin nanosheets coated on reduced graphene oxide nonosheets/nickel foam for high performance asymmetric supercapacitors. Int. J. Hydrogen Energy. 2018;43:2256-2267.
- [CrossRef] [Google Scholar]
- Activated carbon and its hybrid composites with manganese (IV) oxide as effectual electrode materials for high performance supercapacitor. Arab. J. Chem.. 2022;15:103946
- [CrossRef] [Google Scholar]
- The effects of different activating agents on the physical and electrochemical properties of activated carbon electrodes fabricated from wood-dust of Shorea robusta. Heliyon. 2021;7 e07917
- [CrossRef] [Google Scholar]
- Effect of polymer binders on graphene-based free-standing electrodes for supercapacitors. Electrochim. Acta. 2018;267:213-221.
- [CrossRef] [Google Scholar]
- Impact of electrolyte concentration on electrochemical performance of Cocos nucifera Waste-Derived High-Surface carbon for green energy storage. Fuel. 2024;371:131999
- [CrossRef] [Google Scholar]
- Biomass-derived activated porous carbon from rice straw for a high-energy symmetric supercapacitor in aqueous and non-aqueous electrolytes. Energy Fuel. 2017;31:977-985.
- [CrossRef] [Google Scholar]
- Preparation of activated carbon monolith electrodes from sugarcane bagasse by physical and physical-chemical activation process for supercapacitor application. Adv. Mater. Res.. 2014;896:179-182.
- [CrossRef] [Google Scholar]
- Characterization of activated biomass carbon from tea leaf for supercapacitor applications. Chemosphere. 2022;291:132931
- [CrossRef] [Google Scholar]
- Synthesis and characterization of microporous activated carbon from rubberwood by chemical activation with KOH. Carbon Lett.. 2021;31:1079-1088.
- [CrossRef] [Google Scholar]
- Saccharide-derived microporous spherical biochar prepared from hydrothermal carbonization and different pyrolysis temperatures: synthesis, characterization, and application in water treatment. Environ. Technol.. 2018;39:2747-2760.
- [CrossRef] [Google Scholar]
- Corn husk derived activated carbon with enhanced electrochemical performance for high-voltage supercapacitors. J. Power Sources. 2020;471:228387
- [CrossRef] [Google Scholar]
- Biomass-derived porous activated carbon from Syzygium cumini fruit shells and Chrysopogon zizanioides roots for high-energy density symmetric supercapacitors. Biomass Bioenergy. 2020;143:105838
- [CrossRef] [Google Scholar]
- Biomass-derived porous activated carbon nanofibers from Sapindus trifoliatus nut shells for high-performance symmetric supercapacitor applications. Carbon Lett.. 2021;31:1133-1143.
- [CrossRef] [Google Scholar]
- Impact of carbon dioxide-assisted activation on Millettia pinnata shell-derived porous activated carbon for enhanced performance in symmetric supercapacitors. Ionics (kiel).. 2024;30:3045-3054.
- [CrossRef] [Google Scholar]
- Physical activation assisted porous activated carbon from Strychnos Potatorum shells for high-performance symmetric supercapacitors. Mater. Lett.. 2024;371:136961
- [CrossRef] [Google Scholar]
- Microporous active carbon with ultrahigh surface area from Metaplexis japonica for high-performance supercapacitor. Diam. Relat. Mater.. 2021;118:108484
- [CrossRef] [Google Scholar]
- Pectin/Activated Carbon-Based Porous Microsphere for Pb2+ Adsorption: Characterization and Adsorption Behaviour. Polymers (basel).. 2021;13:2453.
- [CrossRef] [Google Scholar]
- Honeycomb-like carbon with tunable pore size from bio-oil for supercapacitor. Microporous Mesoporous Mater.. 2020;309:110551
- [CrossRef] [Google Scholar]
- Interconnected Carbon Nanosheets Derived from Hemp for Ultrafast Supercapacitors with High Energy. ACS Nano. 2013;7:5131-5141.
- [CrossRef] [Google Scholar]
- Advanced porous hierarchical activated carbon derived from agricultural wastes toward high performance supercapacitors. J. Alloys Compd.. 2020;820:153111
- [Google Scholar]
- Synthesis and Characterization of Nano Activated Carbon Tea Waste (Camellia sinensis L.) Viewed from the Content and Ratio of Orthophosphoric Acid. Indones. J. Chem. Res.. 2018;3:49-58.
- [Google Scholar]
- Mild modification of sponge-like carbon: Ammonia post-treatment for enhanced CO2 adsorption and suitability for supercapacitors. Sep. Purif. Technol.. 2025;353:128525
- [CrossRef] [Google Scholar]
- Amine‐Functionalized Carbon Nanodot Electrocatalysts Converting Carbon Dioxide to Methane. Adv. Mater.. 2022;34
- [CrossRef] [Google Scholar]
- Nanoflower-like NiCo2O4 grown on biomass carbon coated nickel foam for asymmetric supercapacitor. J. Alloys Compd.. 2020;835:155-270.
- [CrossRef] [Google Scholar]
- Nano-porous carbon materials derived from different biomasses for high performance supercapacitors. Ceram. Int.. 2020;46:5811-5820.
- [CrossRef] [Google Scholar]
- Effect of char structure evolution during pyrolysis on combustion characteristics and kinetics of waste biomass. J. Energy Resour. Technol.. 2018;140
- [CrossRef] [Google Scholar]
- Highly Porous Holey Carbon for High Areal Energy Density Solid-State Supercapacitor Application. Micromachines. 2022;13:916.
- [CrossRef] [Google Scholar]
- Biomass waste of cocoa skin for basic activated carbon as source of eco-friendly energy storage. J. Phys. Conf. Ser.. 2021;1788
- [CrossRef] [Google Scholar]
- Effect of synthesis methods on the surface and electrochemical characteristics of metal oxide/activated carbon composites for supercapacitor applications. Appl. Surf. Sci.. 2019;469:983-993.
- [CrossRef] [Google Scholar]
- Electrochemical performance of Cu- and Ag-doped carbon aerogels. Mater. Chem. Phys.. 2013;138:870-876.
- [CrossRef] [Google Scholar]
- N-Type Hyperbranched Polymers for Supercapacitor Cathodes with Variable Porosity and Excellent Electrochemical Stability. Macromolecules. 2015;48:5196-5203.
- [CrossRef] [Google Scholar]
- How the Electrochemical Impedance Spectroscopy Can Deepen the Understanding of Supercapacitor Performance. Him. Fiz. Ta Tehnol. Poverhni. 2022;13:70-81.
- [CrossRef] [Google Scholar]
- Fabrication of electrospun LaFeO3 nanotubes via annealing technique for fast ethanol detection. Mater. Lett.. 2018;215:58-61.
- [CrossRef] [Google Scholar]


