

Translate this page into:
Fabrication of ionic liquid-cellulose-silica hydrogels with appropriate thermal stability and good salt tolerance as potential drilling fluid
⁎Corresponding authors at: Egyptian Petroleum Research Institute, and Egypt Nanotechnology Center, Cairo University, El-Sheikh Zayed Campus, 6th October, 12588 Giza, Egypt. mohamed_betiha@hotmail.com (Mohamed A. Betiha), ggenidymohamed@sci.cu.edu.eg (Gehad G. Mohamed)
-
Received: ,
Accepted: ,
This article was originally published by Elsevier and was migrated to Scientific Scholar after the change of Publisher.
Peer review under responsibility of King Saud University.
Abstract
This paper investigates the rheological properties of methylcellulose-silica-ionic liquid nanocomposite (2-MCPS-MC) on the rheological properties (apparent viscosity (AV), plastic viscosity (PV), yield point (YP), 10-s gel strength, 10-min gel strength, and thixotropy according to API requirements) of water-based mud, and comparing these properties with the properties of the silica-free methylcellulose (MC) as drilling fluid additive. The physicochemical properties of the MC and 2-MCPS-MC compounds were studied using 1H NMR, FTIR, Raman-spectroscopy, XRD, FE-SEM, AFM, and TGA. By FE-SEM and AFM, it is proven that the silica had an excellent dispersion in a spherical shape on the MC polymer. Three samples were prepared: the first is the commercial water-based mud, while the second and the third samples are MC and 2-MCPS-MC, respectively. The samples of MC were prepared in four concentrations (2%, 1.5%, 1.0% and 0.5% by weight). Throughout the test, density remained at 7.6 (lbs/gal) for mud fluid and 8.5 (lbs/gal) for MC and 2-MCPS-MC at pH 9.0. The results confirmed that the optimum concentration of MC and 2-MCPS-MC, which meet the required API code, was between 1 and 1.5%. The addition of 2-MCPS-MC to water-based mud enhances filtration properties. Response surface technique (RSM) with central composite design (CCD) was also used to optimize the drilling fluid properties to achieve the optimal response to AV, PV, YP, Gl, and Thixotropic using a Design expert software. The results obtained by RSM showed consistency between the experimental and theoretical data.
Keywords
Drilling mud
Rheology
Density
Nanocellulose
Nanocomposite
Viscosity

1 Introduction
As a result of the continuous improvement in the economic growth of various countries, especially developing ones, global demand for various energy resources is expected to increase over the next few years with global demand expected by as much as 50% over the next two decades (Saneinezhad et al., 2020; Shaban et al., 2020). Although there is a non-traditional energy source, researches, and innovations to provide renewable energy to replace oil and gas are not enough to replace them. Therefore, these renewable sources of energy are considered complementary to oil and gas at this stage or in the next stages and cannot exceed hydrocarbons (Kong and Ohadi, 2010; Betiha et al., 2020). The exploration and exploitation of hydrocarbon resources have many challenges that are related to the depth of operation, increase the length of the horizontal drilling to increase the productivity, and the natural subsurface of the drilling, as well as the collapse or damage of the formation, and erosion (Abdo and Haneef, 2010). Removal of cuttings from the drilling hole considered one of the very important requirements for the drilling operation. Initially, the water was used in the drilling operations to remove the cuttings with the help of continuous circulation of the water system. However, due to the increased depth of the drilling, the production of more efficient drilling fluid was considered. The sticky clay and water were used in drilling a well in Texas in 1901. The results obtained from the drilling fluid, allowing the transfer away of cutting from the hole.
Drilling fluids (DFs) are usually thixotropic shear-thinning fluids (TSTS) where they have a low viscosity and suitable pumpability associated with the high shear rate, but at a low shear rate, high viscosity was found (Meng et al., 2012; Alsabagh et al., 2015). In general, the drilling fluids can be categorized into 3rd types; synthetic (SDFs), water (WDFs) and oil (ODFs) based drilling fluids. Among them, WDFs is commonly used as it cheaper and easy to synthesize (Li et al., 2018). In addition to the above, the filtration performance is considered an important function of the drilling fluid, where an impervious cake is formed on the wellbore well that inhibited the leakage of water and prevented the transportation of pressure from wellbore to the formation as well as preserves the well wall stability. Therefore, adding some additive to the drilling fluid to enhance filtration performance is considered one of the better ways (Alsabagh et al., 2015; Chu and Lin, 2019; Alsabagh et al., 2014).
According to published literature, there are two types of additives that as filtration reducers, polysaccharide (starch, xanthan gum, and cellulose), and synthetic polymer (Li et al., 2015; Kelessidis et al., 2007; Zhu et al., 2012; Jiancheng et al., 2014; Jain and Mahto, 2017; Razali et al., 2018). However, as a result of the fact that most modern explorations require focused on the deep formation, where there are harsh conditions of high temperatures, salinity, and pressure, the materials currently used are difficult to meet the desired function such as colloidal and physical stabilities. In this context, it is of great importance to develop a multifunctional filtration reducer that has higher physical and chemical stabilities rather than salinity tolerance.
Currently, natural and naturally-derived polymers, including polysaccharides, are used in many different fields because of their excellent biocompatibility, environmental friendliness, hydrophilicity, and biodegradation (Shan et al., 2019; Alsabagh et al., 2013). Cellulose is one of the natural renewable sources available on a large scale. It is considered as raw-material with low economic cost that can be used in many industrial functions. Cellulose can be divided into semicrystalline fibrillar materials consisting of amorphous and crystalline regions with a small dimension and high specific surface area. The chemical composition of cellulose contains many hydroxyl groups that are easy to attack with many reactive-function groups (Yu et al., 2013; Rafieian et al., 2019). Because of the methylcellulose represents a thermoreversible swelling (sol–gel) transition, i.e. the methylcellulose forms viscous fluid at room temperature and by increasing the heat of the viscous fluid, the gel is formed (sol–gel transition) due to the existence of many hydrophobic, their use is limited due to mechanical strength is not meet the requirements. Therefore, there are many attempts to improve the properties of the mechanical properties of methylcellulose hydrogel. There are many attempts to improve the cellulose mechanical strength by increasing the crosslinking degree such as radiation or addition of crosslinking agent, as glutaraldehyde grafting (Rimdusit et al., 2012; De Dicastillo et al., 2016; Kedzior et al., 2017; Hynninen et al., 2018).
The purpose of this work was to fabricate ionic liquid-cellulose-silica hydrogels with appropriate thermal stability and good salt tolerance and for potential drilling fluid. The extraction of cellulose from rice husk was methylated to modify its surface to be easily soluble in water. After that, grafting of (3-chloropropyl)triethixysilane on the surface of the formed methylcellulose to form methylcellulose silica nanocomposite. The ionic liquid moiety is prepared on the surface of the methylcellulose silica nanocomposite through the reaction between 2-methyl pyridine and the chloropropyl group of the silane moiety. Finally, the resultant materials were well characterized and assessed as potential drilling fluids to make the drilling operation smooth, cost-effective, and efficient.
2 Materials
Rice straw husk was collected from the Kafr El-Sheikh Egyptian governorate. Toluene (anhydrous, 99.8%), ethanol (absolute, ≥99.8%), sodium hydroxide, hydrogen peroxide (30 wt% in H2O solution), acetic acid (≥99%) and nitric acid (70%) were obtained from Sigma-Aldrich. Urea (99.0%), 2-methylpyridine (α-picoline, 98%), dimethyl sulfate (≥99.8%) and (3-chloropropyl)trimethoxysilane (≥97%) were obtained from Fisher Scientific.
2.1 Extraction of cellulose from rice straw
After cutting the rice straw, wash several times with warm water to get rid of the adsorbed material on the rice straw surface. After drying at 60 °C overnight, the rice straw is grinded with a mill and then sifted with soil sieve. Transfer 50 g of dry rice straw powder to 500 ml Soxhlet extractor to get rid of waxes, dyes, and oils using a mixture of toluene and ethanol (2:1; V/V). After vacuum drying at 60 °C under, the powder (10 g) was transferred to a 500 ml flask filled with 350 ml of 5% NaOH and 2.5% hydrogen peroxide solution, and the mixture was stirred at 70 °C for 5 h. After filtering the product, the solid was washed with water until the supernatant reaches a pH of 7. The resulting solid is dried at 50 °C overnight, followed by the addition of 50 ml-acetic acid (5%) and nitric acid (5 ml). The mixture was stirred at 70 °C for a period of 5 h. The product was separated by centrifugation and wash thoroughly with water to reach pH 7. The percent yield of extracted dry cellulose was 23%.
2.2 Methylation of extracted cellulose (MC)
To dissolve cellulose, 10 g of extracted cellulose was added to 1000 ml of solution previously cooled at −12 °C consisting of 70 g of sodium hydroxide and 120 g of urea. After stirring the mixture vigorously for 30 min, a thick transparent solution of 2% cellulose is observed. The transparent Na-cellulosic material was separated using a centrifuge apparatus at 2000 rpm for 30 mint. The obtained material was re-dispersed in distilled water and centrifuged again to remove the residual sodium hydroxide material.
The obtained Na-cellulose (10 g, 55 mmol based glucose unite) was charged into 250 ml round flask pre-charged with an adequate volume of acetone equipped with a dropping funnel filled with dimethyl sulfate (42 g, 333 mmol), condenser and Teflon magnet. The dimethyl sulfate was gently dropped into Na-cellulose at refluxing temperature. After the complete addition of dimethyl sulfate, the reaction is further stirred for one day. After that, acetone was removed by vacuum distillation, and a fresh amount of acetone and 42 g of dimethyl sulfate was added at refluxing temperature for another one day. Then, the acetone is removed from the reaction medium, and the obtained material was washed with isopropanol and separated by centrifuge at 5000 rpm (Scheme 1).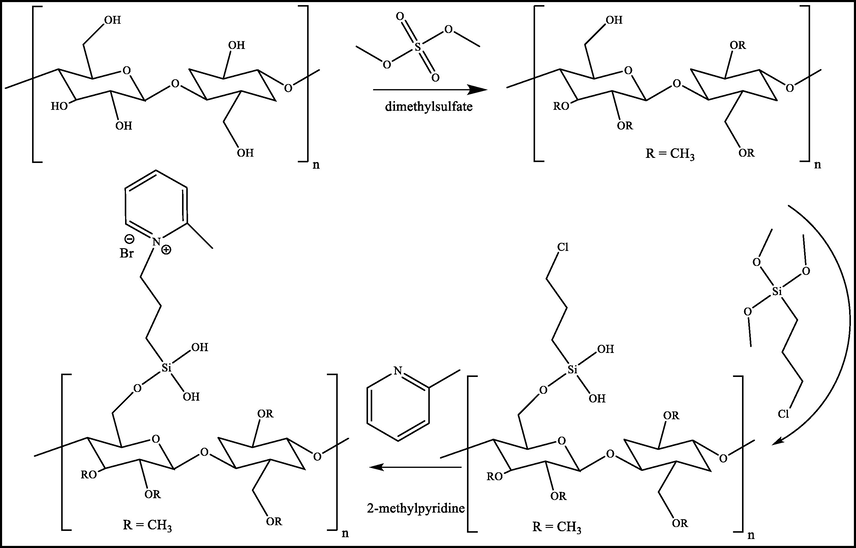
Schematic presentation of methylcellulose-silica-ionic liquid compounds.
2.3 Silylation of methylcellulose (3-CPS-MC)
Silylative passivation of methylcellulose was carried out with 3-chloropropyl-trimethoxy silane compound as silylating reagents by mixing 10 g of methylcellulose with 2.5 g of 3-chloropropyltrimethoxysilane in anhydrous toluene at refluxing temperature for 24 h. After that, a few drops of water and ethanol were added to the complete hydrolysis of methoxy-groups. Finally, the obtained 3-CPS-MC material is washed with toluene to remove the rest of 3-chloropropyltrimethoxysilane (Scheme 1). The final yield after drying was 11.87 g.
2.4 Preparation of 2-methylpyridine-CPS-MC ionic liquid (2-MCPS-MC)
The obtained 3-CPS-MC (5 g) was added to 2.34 g (25.6 mmol, twice the theoretical molar related to 3-CPS-MC) of 2-methylpyridine in isopropanol. The reactants were stirred overnight at 80 °C. After cooling, the solvent is separated by vacuum distillation, and the collected 2-MCPS-MC was a low volume of isopropanol to grit ride of unreacted 2-methyl-pyridine, and finally dried at 50 °C (Scheme 1).
2.5 Characterization
The phase identification of extracted cellulose, MC, 3-CPS-MC, and 2-MCPS-MC was carried out by X-ray Diffraction (XRD, Bruker D8). The function groups presented in extracted cellulose and cellulose derivatives were identified by Fourier transform infrared spectrometer (FT-IR, Thermo Nicolet 6700). The Raman spectra of extracted cellulose and cellulose derivatives were carried out by LabRAM HR. The surface scanning technique (Atomic-force microscopy, AFM) was carried out by Agilent Technologies 5600LS. Topographical of extracted cellulose and cellulose derivatives were collected by the field emission scanning electron microscope, Leo Supra 55. The chemical structure of cellulosic materials was performed on Bruker DPX-300 1H NMR spectrometer, operating at 300 MHz, the materials were dissolved in deuterated DMSO, TMS (tetramethylsilane) was used as internal stranded. The thermal pyrolysis behaviors of the cellulose, silica-modified cellulose and ionic liquid-silica modified cellulose materials were evaluated sika and ionic were assessed by a thermogravimetric analyzer (TGA, TQ-600, TA devices) under nitrogen atmosphere.
2.6 Preparing the cellulosic bases drilling fluid
Drilling fluids are prepared using the standard formula used in oil well drilling operations.
The drilling fluid sample is prepared by bentonite clay (32.0 g) gently to half a liter of distilled water with the help of Hamilton mixer device to get a solution with a concentration of 6.4% of bentonite. The pH of the mixture is adjusted by 5 N NaOH to 9.5, and the obtained mud weight was 8, 7 lb/gal.
2.6.1 Measurement for the rheological behavior of the drilling fluids
The rheology of drilling fluids is the science of deformation and flow of the fluid by the action of a force. Rheological behavior is controlled by many influences, which are defined as viscosity. Viscosity is the internal resistance of the fluid to flow and measured by V-G meter, which included apparent viscosity (AV, Eq. (1)), plastic viscosity (PV, Eq. (2)), yield point (YP, Eq. (3)), Gel strength, thixotropy, and fluid filtrate loss.
The sample stirred and placed in a special container; then, the container is placed on the plan of the instrument. The plan is raised until the rotor sleeve is immersed exactly to the scribed line. The gear is shifted to high-speed level, rotated the crank at 600 rpm for about 15 s. The high-speed reading (600 rpm) is brought at a steady value for dial reading. The reading (300 rpm) is brought to a steady value for dial reading.
Yield point (YP) is a measure of the attractive forces between particles and between fluids. Gel strength (Gel) is the attractive forces in fluids measured according to time. Thixotropy is the gel-structure when allowed to stand and the becoming fluid again after stirring due to electrically charged particles, which is linked together to form the rigid matrix, calculated by the difference between two readings of gel strength (10 sec and 10 min). The following equations were used to evaluate some variables.
To get the gel strength in lb/100 ft2, the mud sample is stirred at high speed (600 rpm) for 15 s, then the rest time desired (10 sec and 10 min) is carried out at 3 rpm. The maximum deflection of the dial reading before the gel breaks is called the gel strength.
E-Filtration loss is the ability of the solid constituents of fluids to form a thin and low permeability filter-cake. The filtration property of the drilling fluids was measured by the standard filter press as follows. The cell is secured to the base cup, assembling the dry parts of the filter press with a sheet of filter paper, and then the cell is filled with the sample to be tested to within ¼ inch of the top. The dry graduated cylinder is placed under the filtrate tube, and the applied pressure to the cell was 100 psi. Starting time of the test, the volume of the filtrate collected in the graduated cylinder and recorded at the end of 2, 5, 10, 15, 20, 25, and 30 min.
2.6.2 Optimization of rheological parameters by RSM
The response surface methodology (RSM) is a type of effective method for predicting process conditions, as it can determine the effect of different factors and their interactions on the indexes under evaluation (response value) during the specific process. The drilling fluid was optimized using RSM provided by Design-Expert software 11 (Stat-Ease Inc., Minneapolis, USA). Central composite design (CCD) was used to study some variables with the highest impact on drilling fluids.
Three independent variables identified are A (concentration of MC, 0.5–2%), B (temperature, 75–150°F), and C (RPM, from 3 to 600). The response was selected for Av, PV, YP, Gel-strength (GL), and thixotropy (Thixo), which was actually obtained from the Rheometer.
Eq. (4) represents the second-order polynomial equation model for the optimal point prediction between the response variables (AV, PV, YP, GL., And Thixotropy) and the independent variables of the rheological study, and in the equation: Y is the predicted response; xi and Xj are the factors or coded
The coefficient of determination (R2) is used to assess the suitability (fitting) quality to the models and to check the R2 of variances (ANOVA). The square polynomial (Eq. (4)) obtained from the R2 of experimental data was used to develop RSM and contour diagrams.
3 Results and discussion
3.1 Characterization
3.1.1 FTIR spectroscopy
FTIR absorption spectra of the prepared samples are shown in Fig. 1. The FTIR of extracted cellulose showed the characteristic bands of cellulosic material. The band at 3451 cm−1 was due to asymmetric stretching vibration mode of hydroxyl, and the bands at 2928 and 2828 cm−1 were assigned to C—H stretching vibration in CH2, while the band at 1632 cm−1 was assigned to —OH bending vibration mode of adsorbed water (Gupta et al., 2020). The band at 1420 cm−1 was attributed to C—H (C—H2 deformation), and the bands at the regime of 1245 and 975 cm−1 were characteristic for 1,4-glycosidic bonds. The bands at 1650 cm−1, 895 cm−1 and 610 cm−1 were corresponding to —C—O—C bending, —C—O Stretching and deformation and O—H bending, respectively (Hassan et al., 2020; Abdelrahman et al., 2018). After methylation of extracted cellulose, the intensity of the bands at 2928 and 2828 cm−1 (stretching vibration in CH2 or —CH3) become more at the expense of the band at 3451 cm−1, demonstrating the success of methylation process. The intensity of bands at 2928 and 2828 cm−1 to the intensity of the band at 3451 cm−1 is of 0.2 and becomes 0.8 after methylation. On the other hand, the silica-modified methylcellulose spectrum showed an intense high band at 1049 cm−1 due to the overlay with —Si—O—Si— (Betiha et al., 2020), and new band at 748 cm−1 is due to —C—Cl group. Moreover, the stretching hydroxyl group band at 3400 cm−1 is also enhanced due to the formation of —Si—OH. The weak band at 3100 cm−1 was assigned to the CH group attached to —N+— group (Rabie et al., 2019).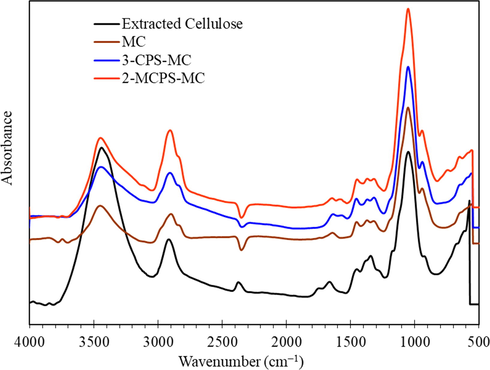
FTIR spectra of extracted cellulose, MC, 3-CPS-MC and 2-MCPS-MC materials.
3.1.2 Raman spectroscopy
Fig. 2 showed the Ramen spectra of MC, 3-CPS-MC, and 2-MCPS-MC materials. The MC showed a peak at 3468 cm−1, which is assigned to the stretching OH group, and the sharp peak at 2940 cm−1 and 2844 cm−1 represented the asymmetric stretching CH groups. The peaks at 1456 cm−1 and 1374 cm−1 indicated the binding, out of the plane binding mode of CH and CH2 groups, respectively. The peak at the regime from 1272 cm−1 to 1045 cm−1 was characteristic of the bending OH⋯O, stretching C—C, stretching —C—O—C, stretching C—OH and binding of CH groups. The weak and medium peaks at 945 cm−1 and 898 cm−1 was assigned to the stretching mode of the pyranoid ring, and the broad peak at 490 cm−1 represented the binding mode of the pyraoid ring. After silylation of methylcellulose and formation of ion liquid moieties on the surface of MC, the intensity of the peak at 945 cm−1 relative to 898 cm−1 (∼1.2 for MC and ∼1.42 for 3-CPS-MC) was enhanced due to the overlapping of —C—Cl stretching vibration mode with the stretching vibration of the pyranoid ring. The relative intensity of these two peaks was about 1 for 2-MCPS-MC, indicating the formation of —N+Cl− group. In addition, the appearance of a weak peak at 912 cm−1 can be assigned to the presence of a pyridine ring (Dressler et al., 2009).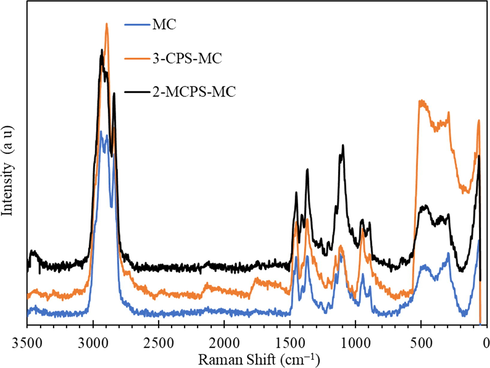
Raman spectra of MC, 3-CPS-MC and 2-MCPS-MC materials.
3.1.3 1H NMR spectroscopy
1H NMR spectra of MC and 2-MCPS-MC materials were shown in Fig. 3a and b. The sharp signal at 2.79 ppm was attributed to —OCH3 proton, the signal at 3.16 ppm was assigned to —CH proton of pyranose ring, and the signal at ∼3.4 ppm was attributed the methylene protons (—CH2—O—) (Nagel et al., 2010). The signal at ∼4.23 ppm was assigned to the residual protons (—OH). The signal at 5.6 ppm is attributed to the proton attached to C1. The calculated degree of substitution by integrating the signal at 2.79 ppm to the signal at 4.23 ppm was 2.2. The 2-MCPS-MC material shows the resonance of pyridinium ring proton at 6.76–7.24 ppm, the ppm value is lower than the documented 1H NMR of pyridinium salt (Essayem et al., 2005), the shift of pyridinium ring proton to upfield maybe due to the association of pyridinium ring on the MC pyranose ring. Similar behavior is reported by McCormick et al., (McCormick et al., 2003) for water adsorption on the silica surface. In addition, the signals at 0.862–1.231 ppm, 2.69 ppm, and 2.8–5.3 ppm were attributed to aliphatic propyl-group —CH2—Si, —CH3 of the pyridine ring, and the overlapped signal with methylcellulose molecules, respectively. The new medium signal at 4.78 ppm was assigned to the aliphatic —CH2—N+, confirming the quaternization of the pyridine ring.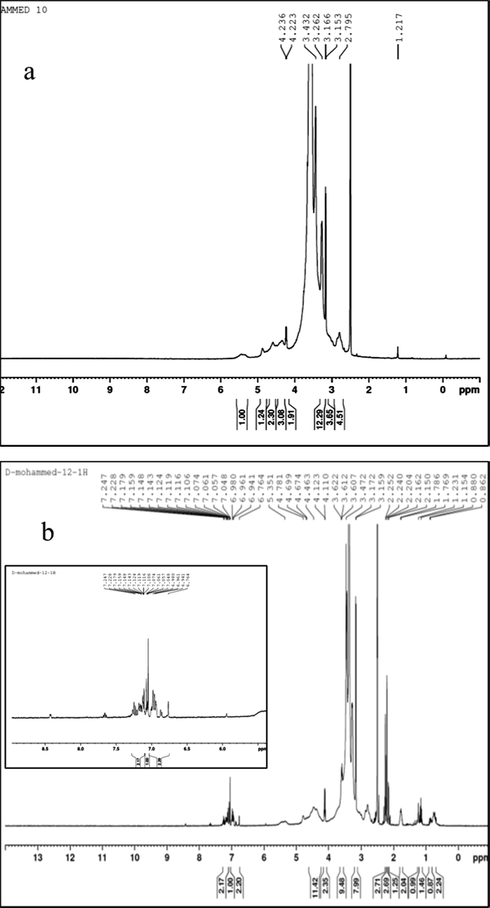
1H NMR of (a) MC, and (b) 2-MCPS-MC compounds.
3.1.4 XRD analysis
XRD studies were conducted on extracted cellulose, MC, 3-CPS-MC, and 2-MCPS-MC (Fig. 4). It is clear from Fig. 4 that the XRD diffraction of the extracted cellulose showed sharp peaks at 2θ of 16.2° (diffraction plane, 110) and 22.3° (diffraction plane, 002), which reflects the typical cellulose free of hemicellulose, starch, and lignin (Saneinezhad et al., 2020). After the implementation of the methylation reaction, the sharp peak at 2θ of 16.2° moved to lower at 2θ value of 10.28°, indicating the success of the methylation process, while the peak at 2θ of 22.34° did not change where its value was giving the impression that the crystalline structure of the cellulose is preserved. The same results have been obtained by Kumar et al. (2012) by adjusting the cellulose surface with methyl groups where this adjustment led to shift both XRD peaks to a lower angle. This shift was the result of the projection of methyl groups on cellulose, which led to an increase in the d–spacing between the interfibrillar distance. The XRD pattern of silylation of cellulose (3-CPS-MC and 2-MCPS-MC) showed the XRD-peaks at 2θ of 10.28° and 22.34°, which are match the XRD peaks of the MC material, however, there is a distinct difference in the intensity of the XRD-peaks. The intensity of peak at 2θ of 10.28°, which represents the amorphous material is increased compared to the XRD-peak at 2θ of 22.34°. However, the FESEM analysis showed the fiber retention after silylation of cellulose. This behavior may have resulted from the grafting and condensation of 3-chloropropyl-trimethoxysilan on cellulose. Shaban et al. (2020) had found the same behavior by silylation of saponite by 3-aminopropyltriethoxysilane and reported that the grafting of organosilane compound had a little effect on the crystallinity of the saponite material and the increment in the intensity of the XRD-peak is attributed to the moisture and condensed hydroxyl-groups on the external surface of saponite.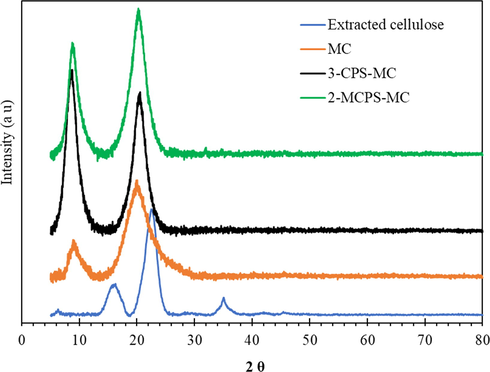
XRD of extracted cellulose, MC, 3-CPS-MC, and 2-MCPS-MC materials.
3.1.5 FESEM spectroscopy
The surface appearance of the extracted cellulose, MC, 3-CPS-MC, and 2-MCPS-MC materials is shown in Fig. 5. The FESEM image of extracted cellulose showed fibrous shape with different size and length (Fig. 5a) at low magnification, and a width of 4 µm of misalignment and twisting fibers bundles at high magnification. Upon treatment with dimethyl sulfate, the width increased to ∼4.8 µm, which may be due to the introduction of methyl groups in the cellulose networks, and no distortion is observed after the methylation process. The 3-CPS-MC materials showed that the addition of 3-chloro-propyltrimethoxysilan causes a pool of more than one fiber due to the presence of three methoxy groups that can act as a crosslinking agent, or a new intra-hydrogen bond arises between the hydroxyl group of condensed silica with the remaining hydroxyl groups of cellulose. At high magnification, the cellulosic materials look coated with silica moiety in a uniform dispersion. After the modification of 2-MCPS-MC by introducing 2-methylpicoline ionic liquid moieties (IL), the obtained fibers were observed as coated by layers of ionic liquid with the dispersion of fine silica particles, maybe due to the repulsion between the end-capped layers attached to the IL moiety.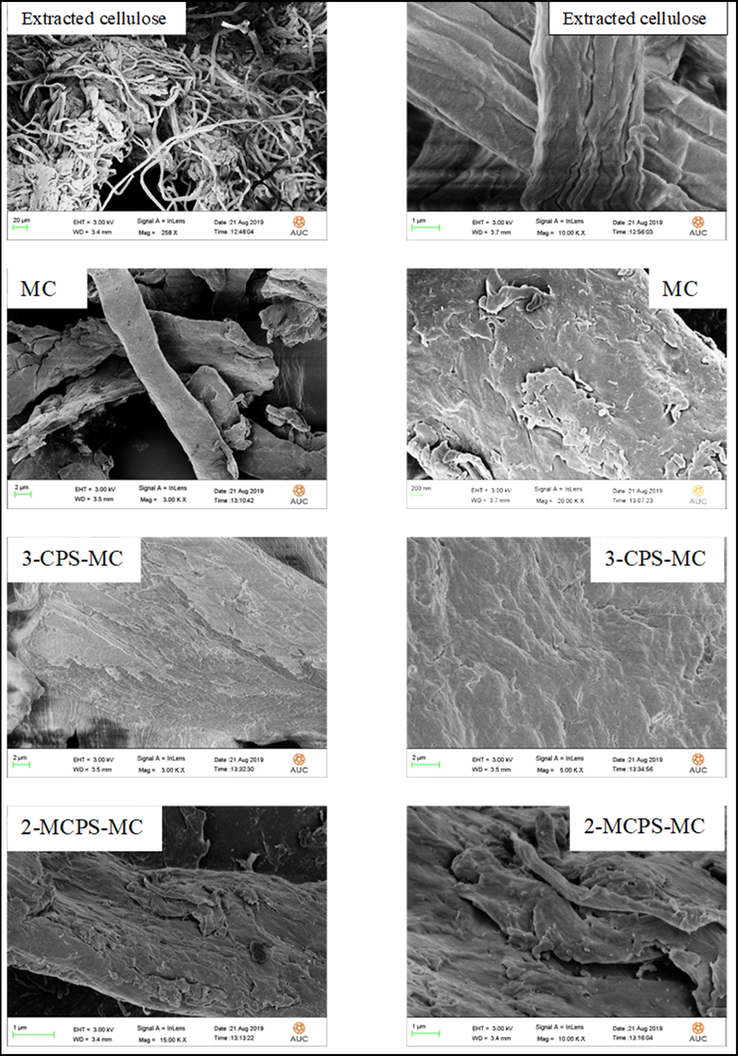
FESEM images of extracted cellulose, MC, 3-CPS-MC and 2-MCPS-MC materials.
3.1.6 AFM spectroscopy
The surface of extracted cellulose, 3-CPS-MC, and 2-MCPS-MC materials was studied using AFM (Fig. 6a–c), where the bright areas represented cellulose crystals and the gray or dark areas represented amorphous cellulose. The bright areas make up a much higher proportion of gray areas, which is consistent with the XRD results of the extract cellulose material. The extracted cellulose showed a root mean square height (Sq) of 0.0679 µm, maximum peak height (Sp) of 0.196 µm, maximum pit height (Sv) of 0.361 µm, maximum height (Sz) of 0.557 µm and arithmetic mean height (Sa) 0.0479 µm. In addition, the maximum height and the maximum depths were 141 nm and 169 nm, respectively (Fig. 6a). The AFM images of the 3-CPS-MC sample (Fig. 6b) showed (according to ISO 25178) Sq of 24 nm, Sp of 115 nm, Sv of 61.1 nm, Sz of 176 nm and Sa of 0.0479 nm. In addition, the maximum height and the maximum depths were 33.2 nm and 1.6 nm, respectively. These results are fully consistent with the results obtained from XRD analysis, where an increase in amorphous XRD-peak was shown. Upon the introduction of 2-methylpyridine (Fig. 6c), the values of Sq, Sp, Sv, Sz, and Sa were of 7.7 nm, 17 nm, 45.8 nm, and 6 nm, respectively. The reduction in height parameter may result from the effect of ionic liquid formed on methylcellulose surface in with more disordered structure is obtained due to the more d-spacing between cellulose planes.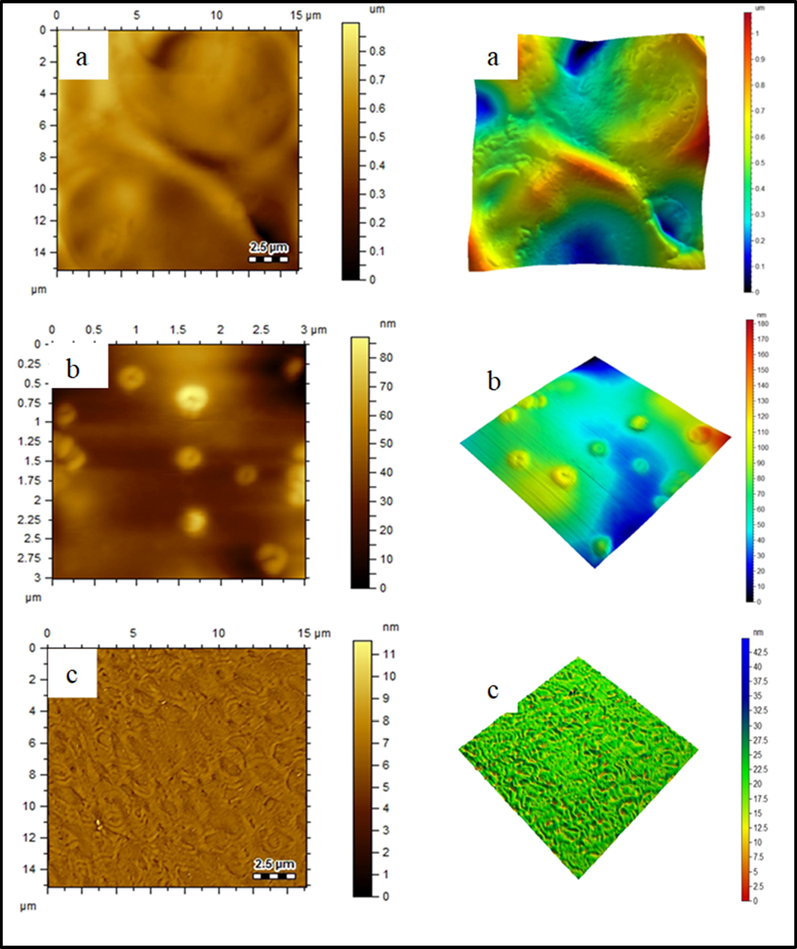
AFM topology of (a) extracted cellulose, (b) MC, 3-CPS-MC and (c) 2-MCPS-MC materials.
3.1.7 TGA analysis
The thermal stability of extracted cellulose, MC, 3-CPS-MC, and 2-MCPS-MC was studied (Fig. 7 and Table 1). Along with the cellulose curve, the degradation of the MC sample at T0.05 (degradation @ 5%) begins by 57 °C, maybe due to the extracted cellulose still contain amorphous or volatile material due to the difference in chemical structure (Gupta et al., 2020). In addition, the 3-CPS-MC and 2-MCPS-MC material also showed more degradation at T0.05, indicating that the treated sample by 3-chloropropyltrimethoxysilane and its 2-methyl pyridinium salt compounds have more hydrophilic character (more adsorbed water) of the MC material. Increasing temperature to more degradation in order extracted cellulose, 2-MCPS-MC, 3-CPS-MC and MC where these materials showed T0.5 at 350 °C, 363 °C, 369 °C and 377 °C, respectively. The char yield was 2.8%, 6.2%, 9.8%, and 13.6% for extracted cellulose, 3-CPS-MC, MC, and 2-MCPS-MC, respectively. This behavior could be correlated to the pyrolysis of the organosilane compound. Similar behavior was obtained by the treatment of graphene oxide by different organosilane moieties (Wei et al., 2019).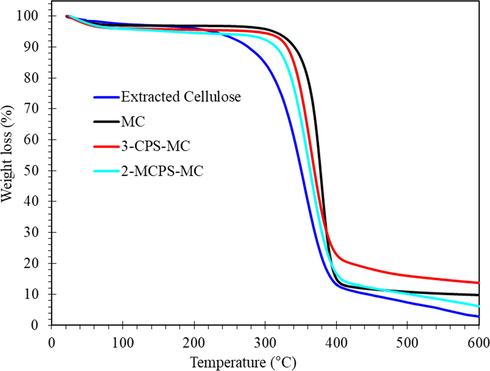
TGA curves of extracted cellulose, MC, 3-CPS-MC and 2-MCPS-MC materials.
Extracted Cellulose (°C)
MC (°C)
3-CPS-MC (°C)
2-MCPS-MC (°C)
T0.05
225
312
283
168
T0.1
276
340
330
315
T0.5
350
377
369
363
3.2 Rheological properties of MC and 2-MCPS-MC materials
Rheological properties such as AV, PV, YP, 10-s gel strength, 10-min gel strength, and thixotropy were determined using a rheometer. Filtration properties were obtained using low pressure of API filtrate volume. The results of the experiments of rheological and filtration properties were investigated for comparisons between three systems, namely, mud fluid (water-base mud), MC, and 2-MCPS-MC/water-base mud materials. Density remained at 7.6 lbs/gal for mud fluid and 8.5 lbs/gal for the MC and 2-MCPS-MC/water-base mud materials. The pH was adjusted at 9.00 throughout the experiments.
3.2.1 Rheology properties
3.2.1.1 Effect of temperature and additives concentrations on plastic viscosities for water-based muds
Fig. 8a, b represents the variation of the PV of the different water-based muds as a function of concentration (%) and temperature (°F). The PV of the different water-based muds with and without the prepared additives at different temperatures are appeared too low, which allows cuttings to fall out of the slurry and be deposited behind the drill head and consequently result in drilling failure. Furthermore, increasing the concentration of MC and the 2-MCPS-MC nanocomposite in the water base mud has an increasing trend to reach to the maximum at 2 wt%.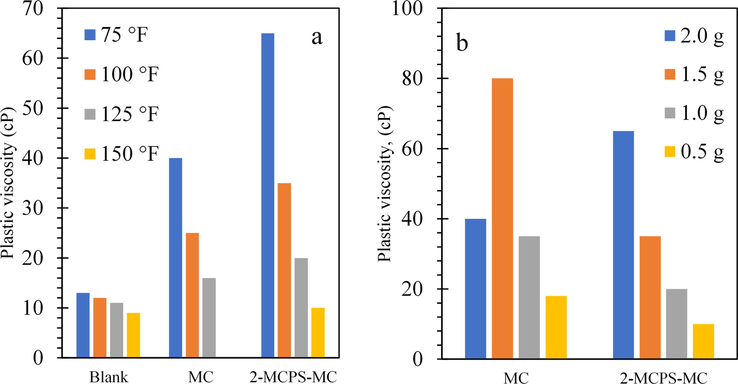
(a) Plastic viscosity variation with the different additives at different temperatures of water-based mud; (b) at different concentrations of water-based mud.
The rising of PV with additives concentration increases the capability of the drilling fluid to transfer the solid drilling cuts out to the hole surface. That is highly pronounced, particularly during drilling of large hole wherever the annular speed occurred by the pump is comparatively slow (Anawe and Folayan, 2018). That can be accredited to a combination of several factors, including the volume (%) of the solids, a decline in the size of the solid particles, and geometry changes in the particles. These results were in agreement with the results reported by Anawe and Folayan (2018) on the effect of yttrium oxide (Y2O3) nanoparticles on the water base muds.
3.2.1.2 Yield point variation with nanoparticle concentration and temperature
Fig. 9a, b shows the variation of YP of the water-base muds with and without the different additives at different temperatures and concentrations. Commonly, the values of the yield points are decreased by increasing the temperature of the process. Furthermore, increasing the concentration of the different additives from 0.5 wt% to 2 wt% increases the yield points of water-base muds containing MC and the 2-MCPS-MC nanocomposites. The dissimilarities in yield points can be attributed to various parameters such as surface characteristics, porosity, and electrical properties of water base mud particulates as nanoparticles concentration increases (Anawe and Folayan, 2018). This reduction of Yp of the drilling mud has unfavorably influenced the efficiency of cutting drilling cleaning of the obtained bore during the drilling process (Anawe and Folayan, 2018).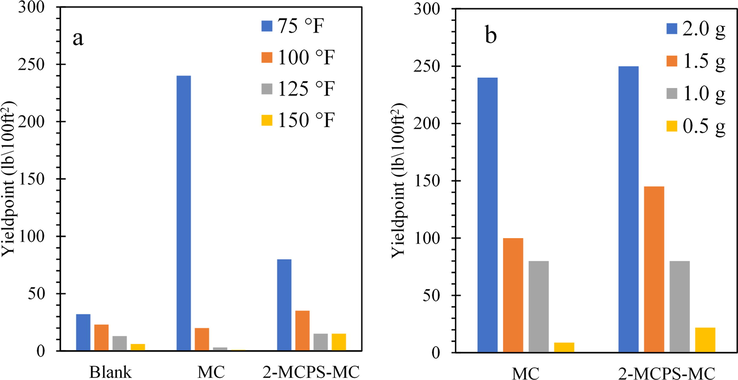
(a) Yield Point variation with additives at different temperatures of water-based mud; (b) at different concentrations of additives in water-based mud.
3.2.1.3 Gel strength variation at different concentration and temperature
The variations of gel strengths (at 10 s and 10 min) of the different water-based muds at different temperatures and additives concentrations are represented in Fig. 10a–d. It is clear from Fig. s 11a, b that the gel strength at 10 s and 10 min is decreased by increasing the temperature. Furthermore, gel strength values at 10 s and 10 min were increased by increasing the concentration of the different additives. The low gel strengths will harm the ability of the mud to suspend the drilling products at stopping the circulating process. But with 2-MCPS-MC nanocomposites concentration of 2 wt%, the gel strength becomes moderately stable compared to the untreated and treated water base mud used.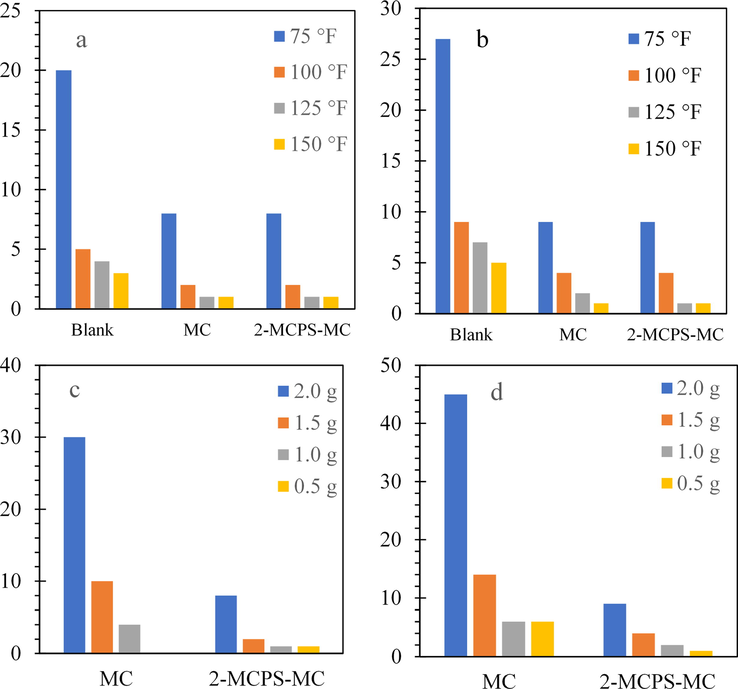
(a) 10 Seconds Gel strength, (b) 10 min Gel strength variation with temperature of water-based mud; (c) 10 Seconds Gel strength (d) 10 min Gel Strength variation with the concentration of water-based mud.
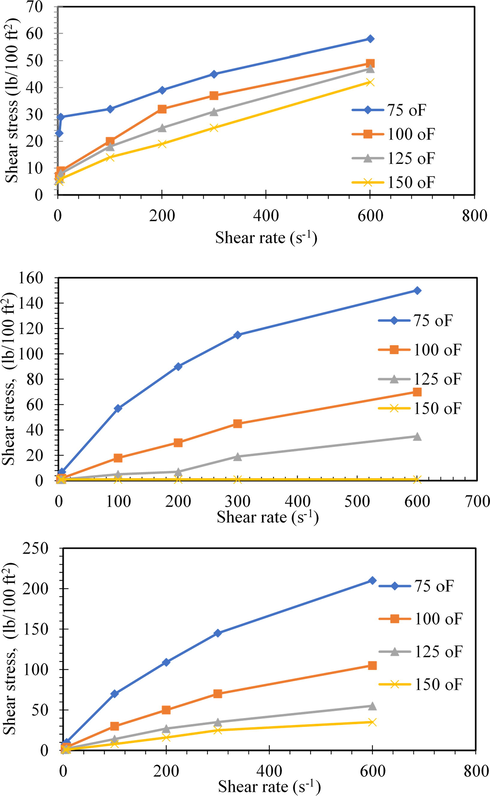
(a) Shear stress versus shear rate variation of mud fluid at different temperatures, (b) Shear Stress versus shear rate variation of mud fluid containing MC at different temperatures, (c) Shear Stress versus shear rate variation of mud fluid containing nanocomposite additive at different temperatures.
3.2.1.4 Shear stress variation with additives concentration and temperature
Data listed in Tables 2 and 3 and their graphical presentations in Fig. 11a–c showed that the shear stress decreases by increasing the temperature. Furthermore, Fig. 12a, b showed an increase in the shear stress of the different modified muds by increasing the concentrations of both of methylcellulose (MC) and the nanocomposites.
T (°F)
75 (°F)
100 (°F)
125 (°F)
150 (°F)
Mud
MC
Mud
MC
Mud
MC
Mud
MC
AV (cP)
29
160
23
35
21.5
17.5
19
0.5
PV (cP)
13
40
12
25
11
16
9
0
YP (lb\100ft2)
32
100
22
20
21
3
20
1
10 s (lb\100ft2)
20
8
5
2
4
1
3
1
10 min (lb\100ft2)
27
9
9
4
7
2
5
1
Thixotropy
7
1
4
2
3
1
2
0
Concentration (%)
2
1.5
1
0.5
AV (cP)
160
130
75
22.5
PV (cP)
40
80
35
18
YP (lb\100ft2)
100
100
80
9
10 s (lb\100ft2)
30
10
4
0
10 min (lb\100ft2)
45
14
6
0
Thixotropy
15
4
2
1
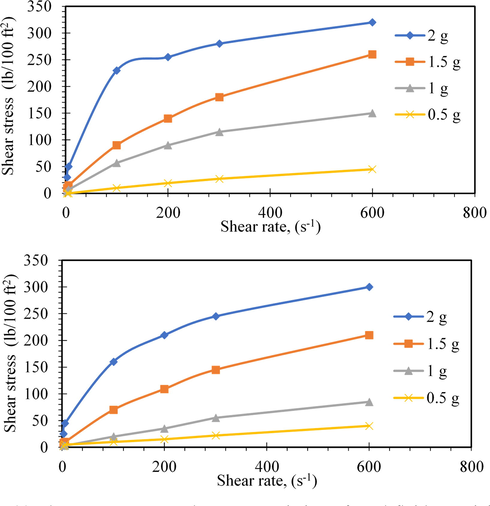
(a) Shear stress versus shear rate variation of mud fluid containing mc at different concentrations, (b) Shear stress versus shear rate variation of mud fluid containing nanocomposite additive at different concentrations.
3.3 Modeling of rheological data
Three mathematical-models have been used to characterize the rheology of mud fluid, MC, and MCPC-MC nanocomposite materials. The models named Power-law, Bingham plastic, and Hershel-Buckley. The benefit of these models is to determine the fluid's ability to perform a specific task. The model that more fitted the stress shear rate analysis is used to describe the relationship between shear stress and a shear rate of the fluid.
The following represents the three models:
3.3.1 Power-law model is expressed as:
As the letter “n” is dimensionless and indicates the behavior of fluid flow (shear thinning or shear thickening relative to the value of unity, if n n < 1 (shear thinning), and n > 1 (shear-thickening), the letter “k” in lb/100ft2sn is the consistency-coefficient (It is considered as the viscosity index of the fluid) (Reiner, 1926). From the plot of log τ versus log γ, the value of n and k can be determined. The model of Power-law provides better information in the case of a low shear rate, and has some disadvantages in the case of high shear rate conditions.
3.3.2 Bingham plastic model
This model is widely used, especially in drilling fluids, and can be mathematically represented as follows (Anawe and Folayan, 2018a, 2018b):
Plastic viscosity can be characterized as part of the flow resistance caused by mechanical friction and can be estimated using the following equation
Fluids that exhibit Bingham Plastic behavior are characterized by τo and μp. One drawback is that fluid behavior is not accurately represented at low shear rates (in the annulus) or at very high shear rate at the bit.
3.3.3 Herschel-Bulkley model
This model is considered as an extension of the Bingham plastic model to include dependency on shear rate, and can be expressed mathematically as
The three models were applied to the obtained rheological data, and the results were represented in Figs. 13–15. It is clear that the rheological models of the Power-law model, Bingham plastic model, and Hershel-Buckley model gave prediction accurately across the entire low shear rate and high shear rate condition with the measured stresses.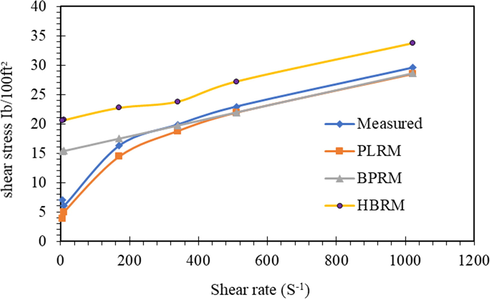
Shear stress-shear rate representation of different models for mud fluids.
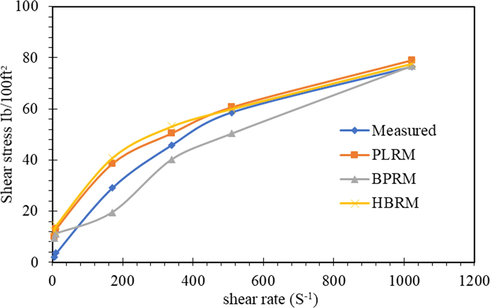
Shear stress-shear rate representation of different models for MC.
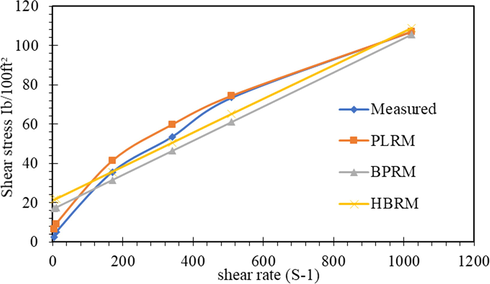
Shear stress-shear rate representation of different models for 2-MCPS-MC.
3.4 Optimization of temperature, concentration and rotation speed of water-based muds using the different additives
3.4.1 Response surface methodology for prepared drilling fluid
The results of the obtained response can be graphically represented in 3D space or contour plots. The optimization of rheological properties of drilling fluids by the addition of 2-MCPS-MC nanocomposite was done under the following condition, temperature (75–150°F), concentration of 2-MCPS-MC nanocomposite (0.5–2 wt%). To design the experiments, CCD was used, and the experimental process was optimized using RSM. The independent variables are presented, and the results are given in the complete design matrix corresponding to the CCD design of the 2-MCPS-MC nanocomposite/drilling fluid (Table 4). Random experiments were conducted to minimize errors from the systematic trends in the variables.
Run
A (%)
B (°F)
C (RPM)
AV (cP)
PV (cP)
YP (D/Cm2)
GL
Thixo
1
1.5
125
300
55
40
65
4
3
2
1
150
300
28
20
30
3
2
3
1.5
100
300
75
60
65
6
4
4
1.5
125
300
60
40
65
4
3
5
1.0
100
100
60
50
55
4
3
6
1.0
150
200
25
20
30
3
2
7
1.0
125
200
30
22
30
3
2
8
0.5
150
600
25
20
22
3
2
9
2.0
75
3
90
40
110
13
8
10
2.0
75
600
100
50
120
13
7
11
0.5
75
600
55
40
35
5
3
12
1.0
75
200
55
35
50
5
2
13
2.0
100
3
70
30
90
10
6
14
2.0
150
600
68
33
100
10
7
15
1.5
125
300
70
50
80
5
3
16
0.5
150
300
35
33
40
3
2
17
0.5
75
3
45
30
37
4
2
18
0.5
150
6
13
10
14
1
1
19
2.0
150
100
60
25
90
11
4
20
1.0
150
200
27
20
30
2
1
The following equations are based on the coded values, and experimental value (A, B, C as concentration, temperature, and RPM) for (AV, PV, YP, GL, and thixotropy) study drilling fluid
Final equations (Eqs. (12)–(16)) in terms of coded factors
Final Eqs. (17)–(21) in Terms of actual factors
The predicted values versus actual values for AV, PV, YP, Gl, and Thitropy were collected in Fig. 16 with the adjusted-R2 value of 0.8986, 0.6590, 0.8893, 0.8242, and 0.8792, respectively, indicating the models of prediction point with confidence 95%. There is appropriate compatibility between the experimental and expected values, which reflects that the data fitting-well the RSM-model and gives a reasonable estimation of the response in the range studied.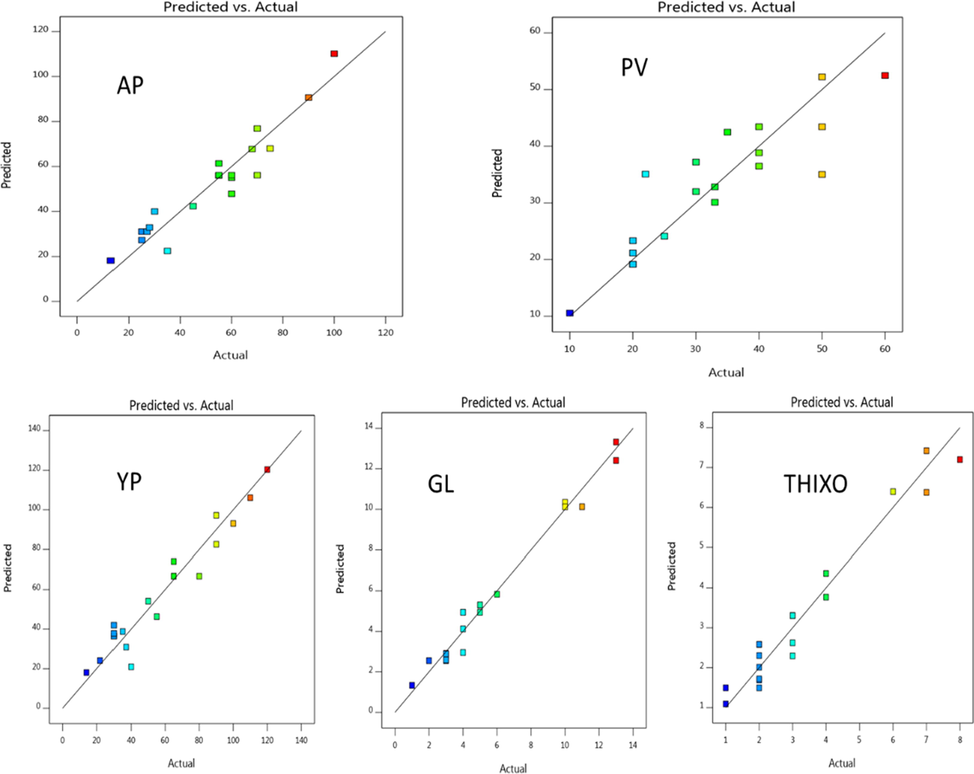
Predicted versus actual data of AV, PV, YP, GL, and thixotropy to temperature.
Figs. 17 and 18 showed 3D and contour plots for the interaction effect between A and C toward AV, PV, YP, Gl, and thixo of drilling fluid at different temperatures. The 3D-response surface shows a steep increase in all parameters with a decrease in temperature. The increase in the concentration from 0.5 to 2 wt% has the same effect, but less prominent in comparison.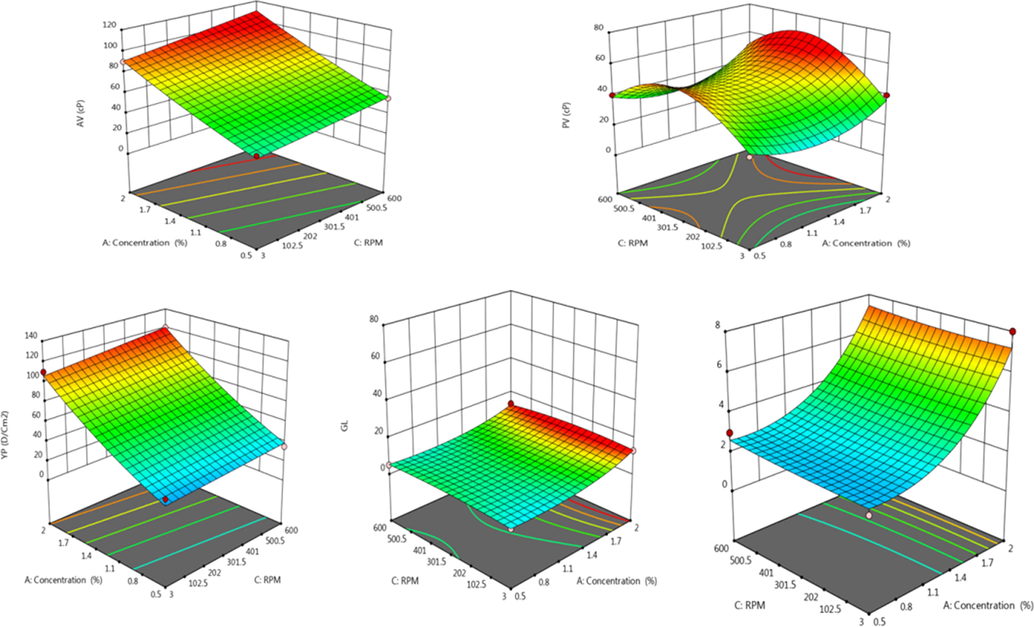
Effect of concentration (A), temperature (B), and RPM(C) on AV, PV, YP, GL, and thixotropy as 3D-response surface plot for prepared drilling fluid.
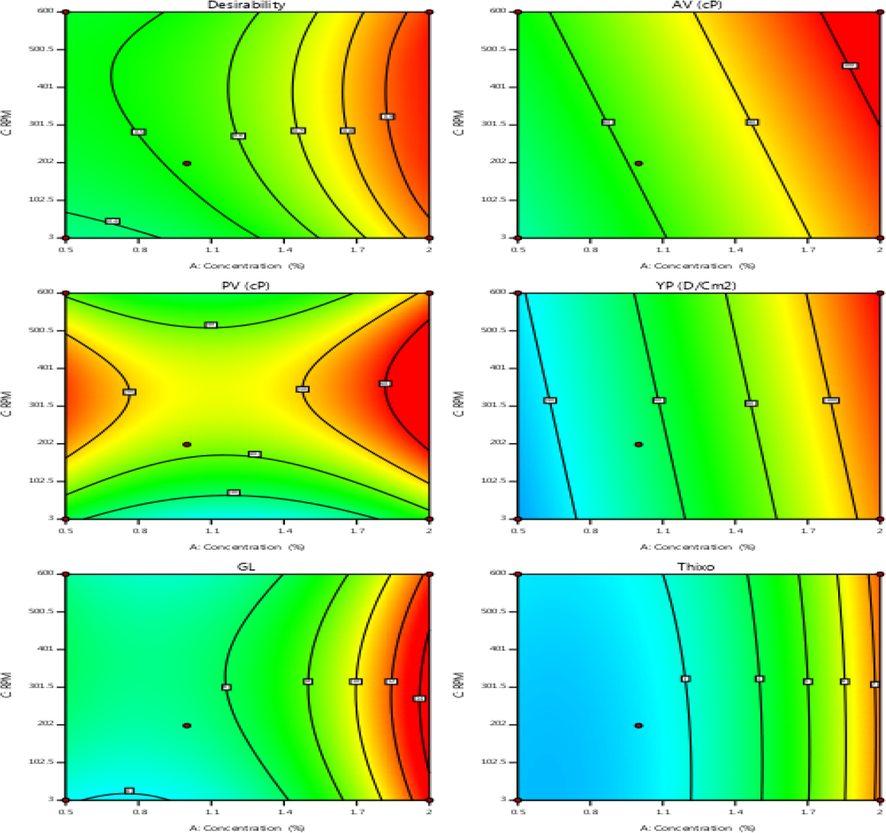
Contour rheological data of drilling fluid at optimized parameters.
3.4.2 Optimization of drilling fluid rheology
The optimization of the rheology of the prepared materials was developed to be used as drilling fluid. The range of the variables (C, T, and RPM) was set between low and high levels, which coded as −1 and −1 to get the maximum response for the drilling fluid rheology. The optimum data that obtained the optimum results were C (1.25%), T (75°F), and RPM (301). To verify the predicted model, the optimal conditions were applied to the three variables, and response toward the rheology of drilling fluid was measured in terms of all parameters for drilling fluid, as concluded in Fig. 19 and Tables 5 and 6. The developed model shows the experimental value is very close to the value of all parameters with confidence 95%.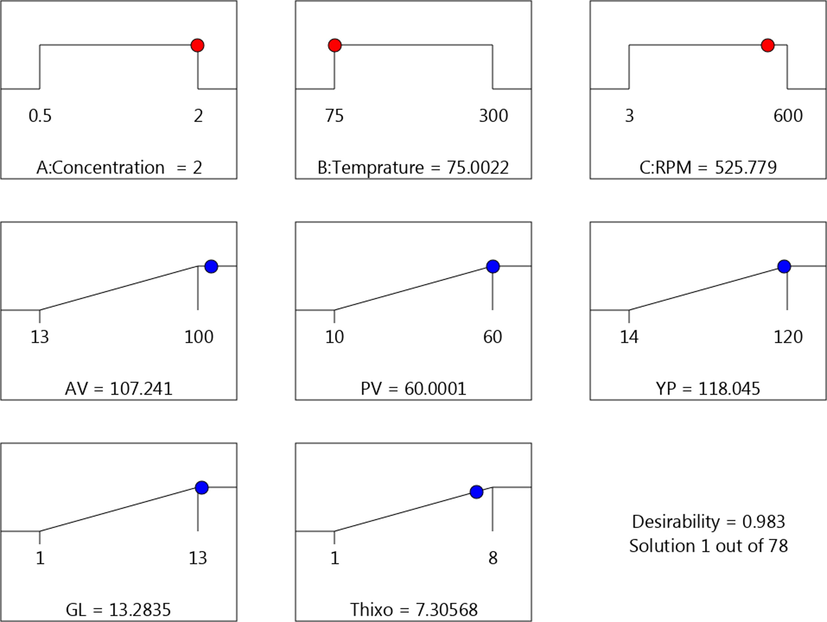
The maximum values of the rheological parameters.
Factor
Name
Level
Low Level
High Level
Std. Dev.
Coding
A
Concentration
1.25
0.5000
2.00
0.0000
Actual
B
Temprature
75.00
75.00
150.00
0.0000
Actual
C
RPM
301.50
3.00
600.00
0.0000
Actual
Response
Predicted Mean
Predicted Median
Std Dev
SE Mean
95% CI low for Mean
95% CI high for Mean
95% TI low for 99% Pop
95% TI high for 99% Pop
AV
72.2716
71.9175
10.1062
N/A
63.9852
81.0651
34.7231
122.505
PV
46.6972
46.2396
9.2225
N/A
33.1922
62.5287
9.9024
109.268
YP
68.2552
67.7774
11.4012
N/A
58.9679
78.2264
27.3221
126.3
GL
6.37659
6.34515
0.894466
N/A
5.03214
7.88091
2.43769
12.0868
Thixo
3.13395
3.10028
0.648019
N/A
2.18916
4.24999
0.5924
7.57265
3.5 Fluid loss and cake thickness control
The filtration loss represents the amount of water released from the water-based mud during the drilling process. The cake thickness represents the thickness of the mud layer formed between the drilling pipe and the hole-wall during the process of drilling. The modification of the water-based muds aimed to decrease the filtration loss and increase the mud cake thickness.
The addition of different additives of MC and the nanoparticles were significantly reduced the fluid filtration loss, as shown in Figs. 20a, b and 21a, b for the low-temperature, low-pressure filter press. The observed reduction in the filtration loss can be attributed to the fact that the prepared MC and the nanoparticles in the mud system are acted as spanning agents that wrapped the permeable filter cake mud at the nanoscale to produce a well-firmed and filter cake surface free of cracks (Anawe and Folayan, 2018). Similar results have been reported (Fereydouni et al., 2012; Saboori et al., 2012) on the potential of reduction of fluid loss by the addition of different types of nanoparticle to water-Based Muds. This lower amount of fluid loss results in minimum swelling of clay and minimum damage to the productive formation.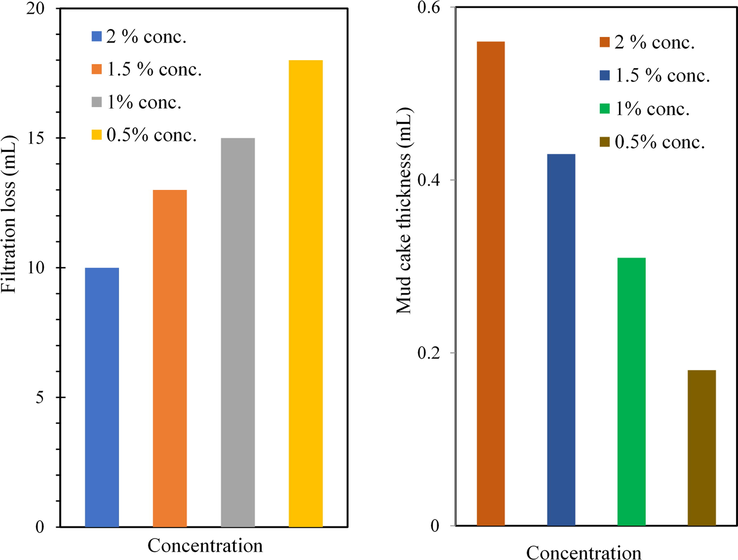
(a) Filtration loss of water base mud containing different concentrations of MC; (b) Mud cake thickness of water base mud containing different concentrations of MC.
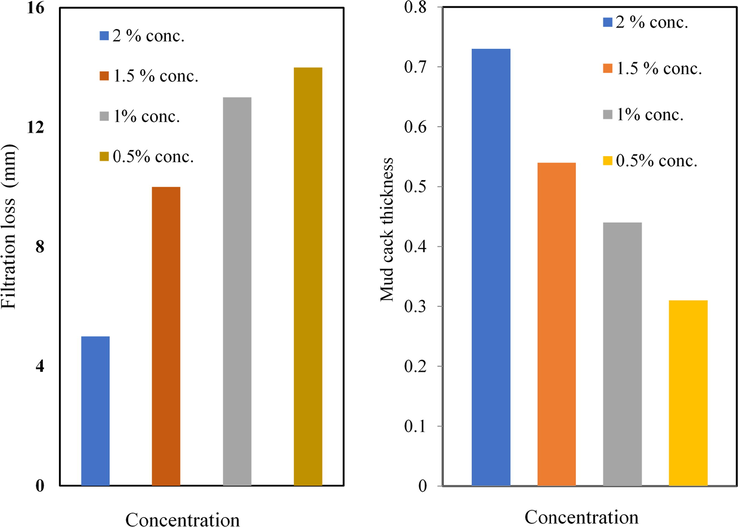
(a) Filtration loss of water base mud containing different concentrations of MC PC-MC; (b) Mud cake thickness of water base mud containing different concentrations of 2-MCPS-MC materials.
Cake penetrability delivers beneficial facts on the electrochemical conditions predominance in the mud, and it is an important parameter that controls the static and dynamic filtration process. The lower amount of filtration loss consequences a thin filter cake value by modification of the water base mud with the addition of the prepared MC and the nanoparticles compared to the mud without any additives. A thin filter cake thickness tends to reduce the differential pressure sticking problem of the drilling pipes and the produced damage for the formation during the drilling process (Zakaria et al., 2012). Muds must be treated to keep cake penetrability in its low manner to retain a stable borehole and to minimize filtrate incursion and damage to the productive zone.
4 Conclusion
In conclusion, the ionic liquid-silica-methylcellulose nanocomposite has been successfully fabricated from rice ask (as a sustainable source for biopolymer). The cellulose was chemically extracted rice husk and methylated. The methylcellulose surface was functionalized with (3-chloropropyl)trimethoxysilane as a coupling agent, and the end-capped chloride atom is used to bind the methylpyridine molecule. The 1H NMR confirmed the formation of methylcellulose, while FESEM and AFM microscopies showed the fibrous and dispersion of silica particles on the cellulose framework. Also, the thermal analysis showed that the addition of nano-silica increased thermal stability. The prepared materials have been used efficiently as drilling fluids or as an additive to drilling fluids. The study revealed that with the increase in the used temperature, both gel strength, viscosity, and yield point are significantly affected (until the mud sample fails). This behavior is produced as a reaction to the thermal decomposition of some components of the mud sample, in addition to increasing the inter-spaces between the molecules of the mud-components, which causes a reduction in the fluid's resistance to flow. The concentration 1.5% and 1.00% have high performance, and excellent rheological properties meet the API requirements and used instead of mud fluids system. The filtration loss was increased with increasing temperature and decreasing with increasing concentration. The MC and 2-MCPS-MC materials are meeting the API requirements to be used in drilling field as mud fluid. The 2-MCPS-MC material showed good rheology and filtration loss better than MC material and mud fluids. The MC and 2-MCPS-MC materials showed good density (8.6 lbs/gal) than mud fluid (7.5 lbs/gal). The MC and 2-MCPS-MC materials have pH lower than mud fluid, which can treat by a chemical additive.
Acknowledgement
The authors would like to thanks Dr. Ahmed S. Mansour (National Institute of Laser Enhanced Sciences (NILES), Cairo University), and Dr. Sameh H. Ismail (Egypt Nanotechnology Center, Cairo University, El-Sheikh Zayed Campus) For their cooperation with us during a project.
This work was financially supported by the Science and Technology Development Fund (STDF), Egypt, under Grant titled “full integration of rice husk and straw to produce nanosilica and nanocellulose for deepen local manufacture.”
Declaration of Competing Interest
The authors declared that there is no conflict of interest.
References
- Removal of refractory Organo-sulfur compounds using an efficient and recyclable Mo132 nanoball supported graphene oxide. J. Mol. Liq.. 2018;252:121-132.
- [Google Scholar]
- Nanoparticles: Promising solution to overcome stern drilling problems. In: Nanotech Conference and Exhibition, Anaheim, California. 2010. p. :6-8.
- [Google Scholar]
- Investigation of some copolymers based on acrylic salts as circulation loss control agents. Egypt. J. Pet.. 2013;22:481-491.
- [Google Scholar]
- Investigation of some locally water-soluble natural polymers as circulation loss control agents during oil fields drilling. Egypt. J. Pet.. 2014;23:27-34.
- [Google Scholar]
- Evaluation of some natural water-insoluble cellulosic material as lost circulation control additives in water-based drilling fluid. Egypt. J. Pet.. 2015;24:461-468.
- [Google Scholar]
- Modification of Bingham plastic rheological model for better rheological characterization of synthetic based drilling mud. J. Eng. Appl. Sci.. 2018;13:3573-3581.
- [Google Scholar]
- Investigation of the effect of yttrium oxide (Y2O3) nanoparticle on the rheological properties of water based mud under high pressure high temperature (HPHT) environment. Int. J. Mech. Eng. Technol. (IJMET). 2018;9:545-559.
- [Google Scholar]
- Uncertainties quantification and modelling of different rheological models in estimation of pressure losses during drilling operation. Int. J. Eng. Technol.. 2018;7:694-701.
- [Google Scholar]
- Experimental investigation of fluid loss and cake thickness control ability of zirconium (IV) oxide. Int. J. Eng. Technol.. 2018;7:702-707.
- [Google Scholar]
- Data analyses on temperature-dependent behaviour of water based drilling fluid rheological models. Data Brief. 2018;21:289-298.
- [Google Scholar]
- Capability of synthesized sulfonated aromatic cross-linked polymer covalently bonded montmorillonite framework in productivity process of biodiesel. J. Cleaner Prod.. 2020;261:120995.
- [Google Scholar]
- Polyvinylpyrrolidone-Aminopropyl-SBA-15 schiff Base hybrid for efficient removal of divalent heavy metal cations from wastewater. J. Hazard. Mater. 2020:122675.
- [Google Scholar]
- Effect of molecular flexibility on the rheological and filtration properties of synthetic polymers used as fluid loss additives in water-based drilling fluid. RSC Adv.. 2019;9:8608-8619.
- [Google Scholar]
- Antioxidant films based on cross-linked methyl cellulose and native Chilean berry for food packaging applications. Carbohydr. Polym.. 2016;136:1052-1060.
- [Google Scholar]
- Surface-enhanced Raman spectroscopy as a probe for orientation of pyridine compounds on colloidal surfaces. J. Mol. Struct.. 2009;935:92-96.
- [Google Scholar]
- 1H NMR evidence for the bi-pyridinium nature of the pyridine salt of H3PW12O40. Catal. Commun.. 2005;6:539-541.
- [Google Scholar]
- Effect of polyanionic cellulose polymer nanoparticles on rheological properties of drilling mud. Int. J. Nanosci. Nanotechnol.. 2012;8:171-174.
- [Google Scholar]
- Enhanced catalytic activity of composites of NiFe2O4 and nano cellulose derived from waste biomass for the mitigation of organic pollutants. Arab. J. Chem.. 2020;13:783-798.
- [Google Scholar]
- Highly selective epoxidation of olefins using vanadium (IV) schiff base- amine-tagged graphene oxide composite. Colloids Surf., A. 2020;591:124520.
- [Google Scholar]
- Nonappa, Inverse thermoreversible mechanical stiffening and birefringence in a methylcellulose/cellulose nanocrystal hydrogel. Biomacromolecules. 2018;19:2795-2804.
- [Google Scholar]
- Formulation of a water based drilling fluid system with synthesized graft copolymer for troublesome shale formations. J. Nat. Gas Sci. Eng.. 2017;38:171-181.
- [Google Scholar]
- Cellulose nanocrystals and methyl cellulose as costabilizers for nanocomposite latexes with double morphology. ACS Sustain. Chem. Eng.. 2017;5:10509-10517.
- [Google Scholar]
- Greek lignites as additives for controlling filtration properties of water–bentonite suspensions at high temperatures. Fuel. 2007;86:1112-1121.
- [Google Scholar]
- Applications of micro and nano technologies in the oil and gas industry-overview of the recent progress. In: Abu Dhabi International Petroleum Exhibition and Conference. Society of Petroleum Engineers; 2010.
- [Google Scholar]
- Synthesis and characterization of methylcellulose/PVA based porous composite. Carbohydr. Polym.. 2012;88:1364-1372.
- [Google Scholar]
- Cellulose nanoparticles as modifiers for rheology and fluid loss in bentonite water-based fluids. ACS Appl. Mater. Interfaces. 2015;7:5006-5016.
- [Google Scholar]
- Surface-chemistry-tuned cellulose nanocrystals in a bentonite suspension for water-based drilling fluids. ACS Appl. Nano Mater.. 2018;1:7039-7051.
- [Google Scholar]
- NMR studies of the effect of adsorbed water on polyelectrolyte multilayer films in the solid state. Macromolecules. 2003;36:3616-3625.
- [Google Scholar]
- Effects of carbon ash on rheological properties of water-based drilling fluids. J. Petrol. Sci. Eng.. 2012;100:1-8.
- [Google Scholar]
- Homogeneous methylation of wood pulp cellulose dissolved in LiOH/urea/H2O. Eur. Polym. J.. 2010;46:1726-1735.
- [Google Scholar]
- Mercury removal from aqueous solution via functionalized mesoporous silica nanoparticles with the amine compound. Egypt. J. Pet.. 2019;28:289-296.
- [Google Scholar]
- Amine functionalization of microcrystalline cellulose assisted by (3-chloropropyl) triethoxysilane. Int. J. Biol. Macromol.. 2019;130:280-287.
- [Google Scholar]
- Review of biodegradable synthetic-based drilling fluid: progression, performance and future prospect. Renew. Sustain. Energy Rev.. 2018;90:171-186.
- [Google Scholar]
- Ueber die Strömung einer elastischen Flüssigkeit durch eine Kapillare. Kolloid-Zeitschrift. 1926;39:80-87.
- [Google Scholar]
- Comparison of gamma radiation crosslinking and chemical crosslinking on properties of methylcellulose hydrogel. Eng. J.. 2012;16:15-28.
- [Google Scholar]
- Decreasing of water loss and mud cake thickness by CMC nanoparticles in mud drilling. Int. J. Nano Dimens.. 2012;3:101-104.
- [Google Scholar]
- Functionalized cellulose-preyssler heteropolyacid bio-composite: An engineered and green matrix for selective, fast and in–situ preparation of Pd nanostructures: synthesis, characterization and application. Arab. J. Chem.. 2020;13:4644-4660.
- [Google Scholar]
- Zinc aluminate nanoparticles: Preparation, characterization and application as efficient and economic catalyst in transformation of waste cooking oil into biodiesel. J. Mol. Liq.. 2020;302:112377.
- [Google Scholar]
- Hybrid cellulose nanocrystal/alginate/gelatin scaffold with improved mechanical properties and guided wound healing. RSC Adv.. 2019;9:22966-22979.
- [Google Scholar]
- Effect of silane functionalized graphene prepared by a supercritical carbon dioxide process on the barrier properties of polyethylene terephthalate composite films. RSC Adv.. 2019;9:21903-21910.
- [Google Scholar]
- Adsorption of heavy metal ions from aqueous solution by carboxylated cellulose nanocrystals. J. Environ. Sci.. 2013;25:933-943.
- [Google Scholar]
- Novel nanoparticle-based drilling fluid with improved characteristics. In: SPE International Oilfield Nanotechnology Conference and Exhibition. Society of Petroleum Engineers; 2012.
- [Google Scholar]
- The occurrence of ultra-deep heavy oils in the Tabei Uplift of the Tarim Basin, NW China. Org. Geochem.. 2012;52:88-102.
- [Google Scholar]


