

Translate this page into:
Effect of methanolic plant extract on copper electro-polishing in ortho-phosphoric acid
-
Received: ,
Accepted: ,
This article was originally published by Elsevier and was migrated to Scientific Scholar after the change of Publisher.
Peer review under responsibility of King Saud University.
Abstract
The behavior of copper electro-polishing in ortho-phosphoric acid using the galvanostatic polarization method was ascertained. This was examined via measuring and comparing anode potential –limiting current relationship in solution of regularly mounting concentrations (from 50 to 1800 ppm of methanolic Allium sativum (garlic extract), Tilia cordata (Tilia leafs), Foeniculum vulgare (fennel seeds), and Lablab purpureus (Dolichos lablab extract) and weight loss method. Influence of temperature on the dissolution kinetics were investigated. First order kinetic is applicable to the copper dissolution in solution containing plant extracts. Surface morphologies, brightness and roughness of polished specimens were examined with a scanning electron microscope (SEM), reflectance and atomic force microscope (AFM). Addition of methanolic plant extract to electro-polishing solution produce a lesser limiting current. According to SEM, UV–VIS-NIR spectra and surface roughness measurements, addition of high concentration (1800 ppm) of methanolic plant extract to the electrolytic solution is highly effective to enhance surface quality. High reflection property is obtained when the different type of methanolic plant extract is added to the electro-polishing electrolyte. The minimum Ra and PV values are achieved by garlic extract, which records the highest reflectance value and inhibition efficiency. Weight loss data obtained is excellent conformity with the result obtained by electrochemical measurements.
Keywords
Copper
Electro-polishing
Scanning electron microscope (SEM)
Methanolic plant extract

1 Introduction
Electro-polishing technique (EP) has been broadly used as a surface-adjustment method to improve tissue-to-matter communication via creating a flat hydrophilic surface and forming a new defensive oxide film. It has entertained more awareness due to its useful and educational interests, some workers tried to achieve smooth and bright surface of several metals and alloys by applying EP techniques (Abdel Rahman et al., 2015; Vignal et al., 2000; Wynick and Boehlert, 2005).
The EP reaction is controlled via diffusion depending on the difference in concentration incline forming a discriminating electrochemical dissolution and enhancing planarization effectiveness of metal surface, where the peaks and valleys thickness differences are removed (Taha et al., 2020). It typically takes place at the mass transfer limiting current at highly anodic potential, where the metal surface is smoothed out. At the same time, during EP process, some defects and pitting over the surface can be formed due to high oxygen gases evolution adjoining to the surface at elevated electric potential (Hegazy, 2009; Abouzeid and Abubshait, 2020, Dafali et al., 2002).
Understanding the surface processes occurring on the metal surface during electro-polishing is the key to derive its mechanism. It can also help optimize the parameters of practical operations. (Lopes et al., 2010) Electro-polishing may be limited by mass transport, more specifically, diffusion of the dissolving metal ion, acceptor species from the electrolyte and water molecules. Commonly the diffusion limitation is the metal ion. Subsequently, a salt film precipitates on the surface, either, porous or both compact and porous. It is believed that salt layer formation takes place at the bottom of pits and there is an ionic transport through this layer because of the presence of a high electric field across the layer (Williams and Barrett, 1956). A compact film on the surface will be formed during electro-polishing and gas bubble evolution does not occur on the surface even though the potentials are high enough to thermodynamically allow bubble formation due to the non-electron-conducting nature of the film (Kojima and Tobias, 1973).
The limiting current (IL) value that establishes the polishing effectiveness depends on the mass transfer rate of metal ions from the diffusion layer to the solution bulk. The mass transfer rate is a function of the virtual ionic mobility, anode geometry, temperature, and the electrolyte physical properties. Moreover others studied using several acid concentrations like phosphoric acid, acetic acids, sulfuric acid, and citric acid to maintain the best mixture ratio achieving a highly lustrous and smooth surface (Hmimou et al., 2012).
Electro-polishing electrolytes usually contain a number of additives for various purposes. Some agents are used to increase electrolyte conductivity (supporting electrolytes). Others may be used for increasing bath stability (stabilizers), activating the surface (surfactants or wetting agents), improving levelling or metal distribution (levelling agents), or optimizing the chemical, physical or technology properties of the surface. These properties include corrosion resistance, brightness or reflectivity, hardness, mechanical strength, ductility, internal stress, wear resistance or solder ability (Christophersen et al., 2003; Piotrowski et al., 1998; Lee and Lai, 2003; Kao and Hocheng, 2003).
Copper is extensively used in all kinds of industry because his chemical, physical and mechanical properties which make it the world third most widely used metal after iron and aluminum. It is used in very necessary industry such as electrical applications, industrial machinery, building structure, apparatus, transportation and shopper products.
H3PO4 shows strong corrosiveness on copper and copper alloys. An immense require to save copper materials used in H3PO4 acid industry. There are most of papers have been done to investigate the inhibition of copper dissolution in H3PO4 (Taha et al., 2013a, 2013b; Abouzeid, 2016) via addition organic compounds containing N, S and O atom. These compounds contain π electrons and heteroatom which persuade superior inhibitor molecules adsorption onto the metal surface.
Plants are sources of naturally occurring compounds, some with complex molecular structures and having different chemical, biological, and physical properties. The naturally occurring compounds are mostly used because they are environmentally acceptable, cost effective, and have abundant availability. These advantages are the reason for use of extracts of plants and their products as dissolution inhibitors for metals and alloys under different environment. Different plant extracts can be used as dissolution inhibitors commonly known as green dissolution inhibitors. Green dissolution inhibitors are biodegradable and do not contain heavy metals or other toxic compounds. (Obot et al., 2011; Fouda et al., 2014; Akalezi et al., 2012; Patel et al., 2013; Bouammali et al., 2013). That’s why they became a subject of awareness and has great useful and scientific value. Consequently the goal of this research is to inspect the copper dissolution behavior in presence of methanolic plant extract which is low cost materials, biodegradable and environmentally friendly.
2 Materials and Methods
2.1 Solution preparation
The solution 8 M H3PO4 was planned via analytical grade (85% w/w H3PO4) dilution with de-ionized water with a measured resistivity >18 MΩ/cm. Methanol was used in the natural products preparation. All chemicals were analytical grade reagents and supplied by BDH Chemicals Ltd. All experiments were operated in acid free solution and acid containing several concentrations (50 to1800 ppm) of the natural compounds.
2.2 Material sample composition
The copper composition in weight percent was as a follow: Cd: 0.001, Ag: 0.011, Pb: 0.003, Sn: 0.005, and, Cu 99.98.
2.3 Methanolic plant extracts preparation
Four different green inhibitors, Allium sativum (garlic extract), Tilia cordata (Tilia leafs), Foeniculum vulgare (fennel seeds), and Lablab purpureus (Dolichos lablab extract) were procured from the local market, washed by purify water then dried out in the laboratory at room temperature. Fresh garlic (Allium sativum) bulbs was chopped into small pieces and other green inhibitors were separately grounded using electrical mill into fine powder then stored in clean glass bottles at room temperature. About 20 g of samples were soaked in 400 ml methanol for a week (for mixing of the samples with the solvent) at room temperature, and whatman filter papers to remove undesirable solid residues and contamination.
This crude extract of each extracts was kept in refrigerator until it was used. The concentrations of crude extract solutions of each plant was determined by the remained weight of dry solid residue in conical flask after the methanol evaporation completely (and this weight equal the equivalent weight dissolved in 10 ml filtrate). By this relation we can prepare stock plant extract solution with desired concentration
2.4 Electrochemical measurements
The cell used consists of rectangular plexiglass container with a base of 15 × 5 and a height of 10 cm with copper electrodes of 10 cm height and 5 cm width. Electrode separation was 15 cm. The electrical circuit consisted of a 6 V D.C. power supply, a variable resistance and a multi range ammeter connected in a series with cell. A high impedance voltammeter was connected in parallel with the cell to measure its potential. The temperature was regulated by placing the cell in thermostatic water bath at different temperatures (20, 30, 40 and 50 °C) ± 0.5 °C
2.5 Surface investigation:
2.5.1 Scanning electron microscope
The analysis by SEM (JEOL JSM-5300 Scanning Electron Microscope.) was carried out on the surface of copper samples with and without the optimum concentration of plant extract.
2.5.2 Atomic force microscopy (AFM)
The metal samples were used for atomic force were cutted to dimensions (3 × 3) cm and its thickness approximately ∼1 mm. All samples degreased by acetone, washed by tap water and by distilled water, EP process occurred for specimens in electrolytic cell containing H3PO4 acid free solution and H3PO4 acid containing several natural extracts concentration. After polishing, the samples were cleaned by tap water then by de-ionized water again, and then stored these specimens in desiccators until it was analyzed.
2.5.3 Reflectance measurements:
A Shimadzu UV-3101 PC Spectrophotometer (UV–VIS-NIR) was used to obtain reflection spectra for specimens in the range of 300–1500 nm.
2.6 Fourier Transform-Infrared spectroscopy (FTIR)
For FT-IR studies, A Bruker Tensor 37 Fourier transform infrared spectrophotometer, instrument was used, vacuum dried plant extract liquid was used. The sample was mixed with KBr. The spectra of all investigated specimens were determined in 400–4000 cm−1 range.
2.7 Gas chromatography
GC analysis was carried out using Gas Hewlett Packard HP-5890 series II with split/split less injector and capillary column (30 m, 0.25 mm, 0.25 µm) fused with phenyl polysilphenylene Siloxane. The injector and detector temperatures were set at 280 and 300 °C, and the oven temperature were kept at 80 °C for 1 min, rose to 300 °C at 20 °C/min. Helium was used as carrier gas at a constant flow of 1.0 ml/min. A volume of 2 µl was injected in the split less mode and the purge time was 1 min.
2.8 Gas Chromatography–Mass Spectrometry (GC–MS) analysis
The MS (Hewlett-Packard 5889 BMS Engine) with selected ion monitoring (SIM) was used. The mass spectrometer was operated at 70 eV and scan fragments from 50 to 650 m/z.
2.9 Identification of components
The methodology carried out for identification of individual components of plant extract was based on chromatographic retention indices and via comparing the attained mass spectra with those accessible in NIST library
3 Results and discussion
3.1 Leveling process (Electro-polishing in H3PO4 -natural extracts free solution):
The leveling study is based on the traditional cell voltage-anodic current curves of EP as shown in Fig. 1. Atypical polarization curve is obtained for an electrolyte consisting of ortho-phoshoric acid of concentration ranged from (6–14) M as represented in (Table 1). The curve is divided into three parts which are represents electrolytic etching, polishing of copper surface and O2 gas evolution with pitting occurs in the ascending portion of the curve. The H3PO4 concentration effect on the value of IL can be interpreted via the mass transfer concept according to Eq. (1) (Landolt, 1987).
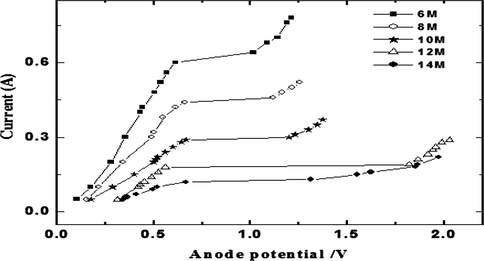
Typical copper EP polarization curve at 20 °C in H3PO4 acid different concentrations.
Conc. of H3PO4
MIL (A)
103 Ccu+2
(Mol·cm−3)106 D
(cm2·sec−1)Η
(g·cm−1·sec−1)
6
0.600
0.98
4.1
1.879
8
0.460
0.95
3.55
4.203
10
0.280
0.85
3.33
5.732
12
0.180
0.78
1.01
6.196
14
0.120
0.70
0.89
14.326
Increasing H3PO4 acid concentration leads to decreases the saturation solubility of Cu3(PO4)2 with a consequential diminish in IL consistent with Eq. (1).Also, raising H3PO4 concentration lead to raise solution viscosity (η), which effects in a diminish of Cu2+ ions diffusivity (D) in proportion to Stokes-Einstein equation (D η/T = constant). In addition the augment in ( ) (which signify the resistance to the mass transfer rate for Cu2+ ions from anode surface to the solution bulk. Due to these effects IL decreases with increasing H3PO4 concentration.
Mechanistic studies of EP have revealed that during copper EP in H3PO4 (Fig. 1), when a current passes crosswise the electrolyte, the anode surface will be coated with a viscous film. This film has superior viscosity and superior electrical resistivity than the solution bulk. The film breadth change from spot to spot: above protrusions the film is thinner than above the valleys. Therefore peaks dissolve more quickly than valleys. Also the diffusion of metal salt out of a scratch or cavity is slow compared with that over a peak. Due to the non -identical current density metal from projections dissolves more rapidly than from crevices which resulting in a surface leveling effect. Thus, the observed behavior of IL is due to the fact that the dissolution is controlled by mass transport (Landolt et al., 2003).
In which the reaction products diffusion is limited and is in turn determining the overall reaction rate. The salt -film precipitated mechanism engages rate limiting diffusion of cations of the dissolving metal from the anode into the bulk (Datta and Landolt, 2000; Sedahmed et al., 2001). At IL, a thin salt film with a saturated concentration of metallic cation is present on the anode surface and limits the rate at which metal ions depart the surface. Copper anodic dissolution in H3PO4 demonstrates a limiting current plateau. In the potential range below IL, copper dissolution involves simultaneous formation of Cu2+, the Cu2+ formation amount becoming significant at elevated potential. In the potential range corresponding to the limiting current plateau, copper dissolution leads to formation of Cu2+only. At potentials higher than IL copper dissolution is accompanied by O2 progression.
3.2 Electropolishing of copper in H3PO4 acid containing different concentrations of plant extracts:
Fig. 2 illustrates polarization curves for anodic dissolution of copper in solution containing several concentrations of Allium sativum (garlic extract), Tilia cordata (Tilia leafs), Foeniculum vulgare (fennel seeds), and Lablab purpureus (Dolichos lablab extract) methanolic extract respectively. The limiting current values (IL) were calculated by extrapolation of linear parts of the dissolution potential to the intersection of the corresponding dissolution current. Values of IL are given in (Table 2). Appearance of a characteristic IL plateau enlarging over a wide potential range in presence of different concentrate of plant extract, proofs that the extracts do not change the diffusion controlled mechanism of copper (mass transport controlled process) dissolution to charge transfer process.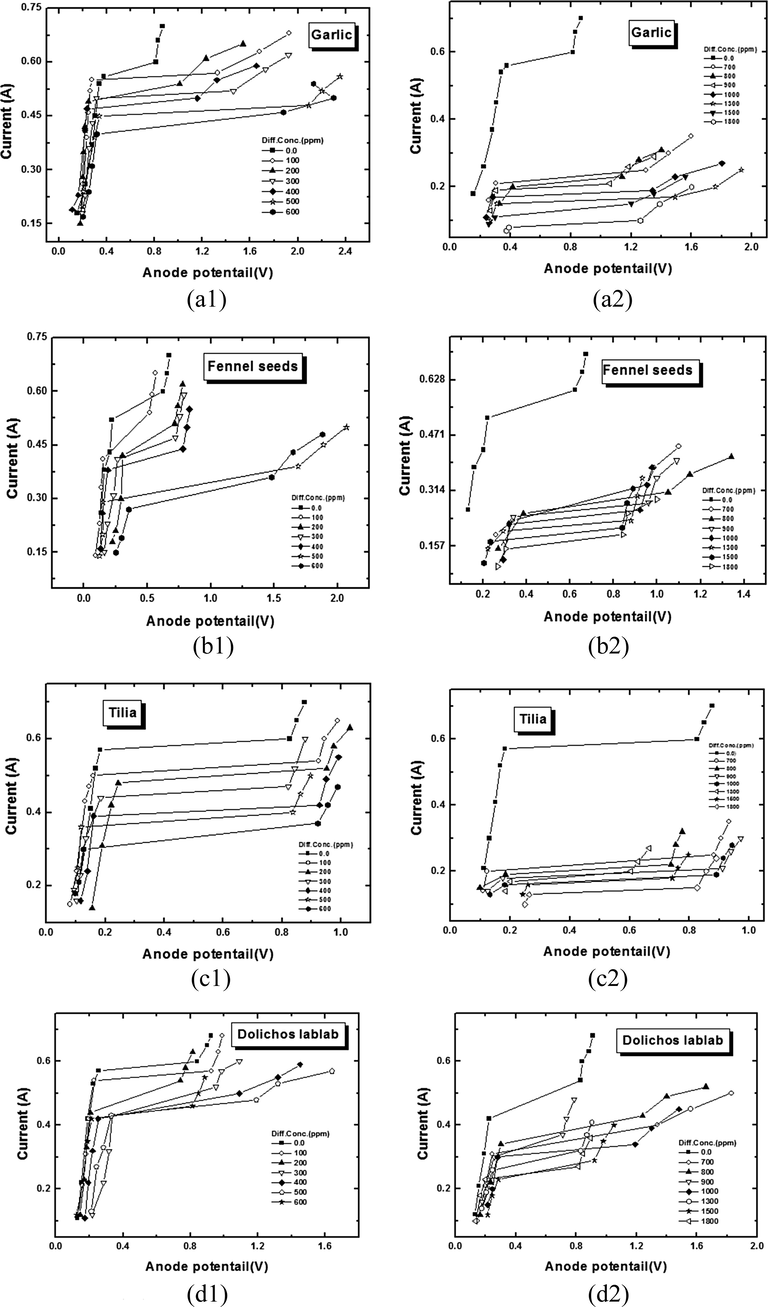
Typical polarization curve for vertical copper plate electropolishing in 8 M H3PO4 in presence of different concentrations (a) Garlic(Allium Sativum),(b) Fennel seeds (Foeniculum Vulgre), (c) Tilia leaves (Tilia cordata) and (d) Dolichos lablab (Lablab purpureus) at 20 °C.
Natural Compound
Conc
(ppm)20 °C
30 °C
40 °C
50 °C
IL (A)
%IE
IL (A)
%IE
IL (A)
%IE
IL (A)
%IE
Blank
0.45
0.60
0.69
0.80
Garlic (Allium Sativum)
100
0.43
4.44
0.56
6.67
0.63
8.70
0.72
10
200
0.40
11.11
0.52
13.33
0.58
15.94
0.65
18.75
300
0.36
20.00
0.47
21.67
0.52
24.64
0.59
26.25
400
0.33
26.67
0.43
28.33
0.47
31.88
0.53
33.75
500
0.30
33.33
0.38
36.67
0.41
40.58
0.47
41.25
600
0.28
37.78
0.33
45.00
0.35
49.28
0.40
50.00
700
0.25
44.44
0.30
50.00
0.32
53.62
0.36
55.00
800
0.23
48.89
0.28
53.33
0.29
57.97
0.32
60.00
900
0.21
53.33
0.26
56.67
0.27
60.87
0.29
63.75
1000
0.19
57.78
0.23
61.67
0.24
65.22
0.27
66.25
1300
0.17
62.22
0.19
68.33
0.21
69.57
0.23
71.25
1500
0.15
66.67
0.16
73.33
0.17
75.36
0.19
76.25
1800
0.10
77.78
0.11
81.67
0.12
82.61
0.13
83.75
Fennel seeds (Foeniculum Vulgre)
Blank
0.45
0.60
0.69
0.80
100
0.37
17.78
0.54
10.00
0.64
7.25
0.76
5.00
200
0.34
24.44
0.51
15.00
0.60
13.04
0.72
10.00
300
0.30
33.33
0.47
21.67
0.55
20.29
0.69
13.75
400
0.29
35.56
0.44
26.67
0.51
26.09
0.66
17.50
500
0.27
40.00
0.39
35.00
0.46
33.33
0.60
25.00
600
0.25
44.44
0.36
40.00
0.42
39.13
0.54
32.50
700
0.23
48.89
0.33
45.00
0.39
43.48
0.47
41.25
800
0.22
51.11
0.31
48.33
0.36
47.83
0.42
47.50
900
0.20
55.56
0.28
53.33
0.33
52.17
0.40
50.00
1000
0.19
57.78
0.26
56.67
0.31
55.07
0.36
55.00
1300
0.17
62.22
0.23
61.67
0.29
57.97
0.34
57.50
1500
0.15
66.67
0.21
65.00
0.25
63.77
0.30
62.50
1800
0.12
73.33
0.19
68.33
0.23
66.67
0.28
65.00
Tilia leaves (Tilia cordata)
Blank
0.45
0.60
0.69
0.80
100
0.37
17.78
0.54
10.00
0.64
7.25
0.76
5
200
0.34
24.44
0.52
13.33
0.60
13.04
0.73
8.75
300
0.32
28.89
0.47
21.67
0.56
18.84
0.70
12.5
400
0.31
31.11
0.42
30.00
0.53
23.19
0.66
17.5
500
0.29
35.56
0.40
33.33
0.50
27.54
0.62
22.5
600
0.27
40.00
0.37
38.33
0.47
31.88
0.56
30
700
0.25
44.44
0.34
43.33
0.42
39.13
0.51
36.25
800
0.22
51.11
0.32
46.67
0.38
44.93
0.45
43.75
900
0.21
53.33
0.30
50.00
0.35
49.28
0.41
48.75
1000
0.19
57.78
0.28
53.33
0.33
52.17
0.39
51.25
1300
0.20
55.56
0.27
55.00
0.32
53.62
0.38
52.5
1500
0.18
60.00
0.25
58.33
0.29
57.97
0.35
56.25
1800
0.15
66.67
0.22
63.33
0.26
62.32
0.31
61.25
Dolichos lablab (Lablab purpureus)
Blank
100
0.43
4.44
0.57
5.00
0.64
7.25
0.73
8.75
200
0.41
8.89
0.54
10.00
0.61
11.59
0.68
15.00
300
0.40
11.11
0.52
13.33
0.58
15.94
0.65
18.75
400
0.38
15.56
0.50
16.67
0.56
18.84
0.61
23.75
500
0.37
17.78
0.48
20.00
0.54
21.74
0.55
31.25
600
0.35
22.22
0.46
23.33
0.48
30.43
0.51
36.25
700
0.34
24.44
0.43
28.33
0.46
33.33
0.48
40.00
800
0.33
26.67
0.40
33.33
0.42
39.13
0.43
46.25
900
0.31
31.11
0.37
38.33
0.38
44.93
0.40
50.00
1000
0.30
33.33
0.34
43.33
0.36
47.83
0.38
52.50
1300
0.28
37.78
0.32
46.67
0.34
50.72
0.35
56.25
1500
0.27
40.00
0.29
51.67
0.30
56.52
0.31
61.25
1800
0.26
42.22
0.27
55.00
0.28
59.42
0.29
63.75
If IL(blank) is the limiting current in natural extract –free solution and IL(extract) is the limiting current in natural extract containing solution, then percentage inhibition efficiency (%IE) can be calculated from the following Eq. (2):
The anodic dissolution rate IL values and percentage inhibition efficiency (%IE) for the studied natural extract at concentration range from 100 to 1800 and temperature range of 20–50 °C with an increment of 10 °C are given in (Table 2).
Fig. 6 and Table 2 show that %IE increases as the studied methanolic extract concentrations increases and temperature increases in case of Allium sativum (garlic extract), and Lablab purpureus (Dolichos lablab extract). While in case of Tilia cordata (Tilia leafs) and Foeniculum vulgare (fennel seeds) %IE amplifies via mounting concentration and decreasing temperature. The %IE of different methanolic extracts could be arranged in the order:
Allium sativum (garlic extract) > Foeniculum vulgare (fennel seeds) > Tilia cordata (Tilia leafs) > Lablab purpureus (Dolichos lablab extract)
The difference in inhibition efficiencies of the studied methanolic extracts may be due to the fact that each extract contains a large number of compounds (identified using GC–MS their relative percentages are reported in Table 4, which are present in different amounts depending on the type of extract.
The net effect of these compounds was a retardation of the dissolution process of copper in H3PO4 solution. It can be proposed that the effective compounds in these extracts contains functional groups which can be used as adsorption centers, since they contain sulphur or oxygen and may contain nitrogen atoms. The electron density on the adsorption centers and consequently the strength of the extract adsorption on the metallic surface depends on its chemical structure, its molecular size and the distribution of charge over the whole inhibitor molecule. This reflects the observed differences in the %IE between the various extracts and lead to the order:
Allium sativum (garlic extract) > Foeniculum vulgare (fennel seeds) > Tilia cordata (Tilia leafs) > Lablab purpureus (Dolichos lablab extract)
This order indicates that the methanolic extract of the cloves of garlic bulb has the highest %IE (83.75% at 1800 ppm) on the dissolution of copper in H3PO4 acid. This effect may be attributed, as above mentioned, to high organo-sulphur compound content and also the presence of conjugate double bonds in these compounds as identified from GC–MS (Table 4) and FTIR (Table 3). Additionally the high Garlic retardation performance proposes powerful bonding of the effective compounds and copper surface owing to hetero-atoms (O, N, S) lone pairs electrons and π- orbital blocking the active sites and decreasing the dissolution rate. Therefore, bonding between inhibitor molecules and copper surface occurs through sharing electrons of the sulphur and oxygen atoms (OH groups) present in the identified compounds (Table 4) of the methanolic extract of garlic (Allium sativum) and vacant copper d-orbital. Also Garlic (Allium sativum) molecules can absorb on the metal surface on the basis of donor–acceptor interaction between aromatic rings π-electrons and vacant d-orbital of copper (Mahmoud, 2006; Rodriguez-Clemente et al., 2015).
Garlic (Allium sativum)
Fennel seeds (Foeniculum vulgare)
Assignment
Before EP
After EP
Assignment
Before EP
After EP
Functional group
Wave number (cm−1)
Wave number (cm−1)
Functional group
Wave number (cm−1)
Wave number (cm−1)
O—H stretching
3434.9
3433.7
O—H stretching
3373.3
3394.7
3175.5
C—H stretching
2935.7
2391.6
C—H stretching
2931.6
2393.9
C⚌C stretching,
C⚌O stretching1637.9
1638
C⚌O stretching
1608.5
1639.5
N—O stretching
1513.6
–
C—H bending,
1408.6
1401
C—H bending,
1405.9
1390.9
O—H bending
1408.6
1401
S⚌O stretching
1131.9
1155.9
C—O stretching
1055.5
1137.8
C—O stretching,
S⚌O stretching1056.7
1073.2
C⚌C bending
924.1
988.4
C⚌C bending
–
997.8
S—S stretching
552.6
503.8
Tilia leaves (Tilia cordata)
Dolichos Lablab (Lablab purpureus)
O—H stretching
3727.1
–
O—H stretching
3383.6
3429.4
O—H stretching,
N—H stretching3426.8
3398.1
C—H stretching
2926.2
2393.5
C—H stretching,
2935.5
2396.1
C⚌O stretching
1742.1
–
C⚌C stretching,
C⚌O stretching1613.7
1637.1
C⚌C stretching
1636.1
1637.5
C—H bending
1447.6
1400.8
C—H bending
1411.3
1400.1
O—H bending
1371.1
–
C—O stretching
1236.8
1142.3
1057.31143.2
C—N stretching
1208.2
1125.5
C—H stretching
871.2
799.8–
C—O stretching
1062.6
1069.6
C⚌C bending
927.8
994.7
887.1
C⚌C bending
817.1
992.4
C—Cl stretching
585.8
552.6
501.1
C—H bending
774.3
714.5
NO
Identified Compound
Molecular formula
Molecular weight
RT
% Compositions
Probability
Garlic (Allium sativum)
1
Methyl 2-propenyl disulfide
C4H8S2
120.236
5.15
48.32
69.3%
2
Allyl propyl disulfide
C6H12S2
148.16
6.28
1.67
59.5%
3
Diallyl disulfide
C6H10S2
146
6.55
11.50
93.9%
4
Desulphosinigrin
C10H17NO6S
279
6.84
3.79
5.04%
5
1.2,4-Dimethyl-3-hexanol
C8H18O
130
7.62
7.96
10.4%
6
3-Vinyl-1,2-dithiacyclohex-4-ene
C6H8S2
144
8.52
5.33
38.2%
7
3-Vinyl-1,2-dithiacyclohex-5-ene
C6H8S2
144
8.93
2.88
72.4%
8
Diallyl trisulfide
C6H10S3
178
10.56
18.55
97.2%
9
Diallyl sulfide
C6H10S
114
10.92
1.54
33.8%
10
Linolelaidic acid, methyl ester
C19H34O2
294
24.04
1.27
6.52%
Fennel seeds (Foeniculum vulgare)
1
D-Limonene
C10H16
136
5.38
27.11
72.5%
2
L-Fenchone
C10H16O
152
6.58
1.29
33.4%
3
Estragole
C10H12O
148
8.48
0.87
14.8%
4
n-Hexadecanoic acid
C16H32O2
256
21.79
5.28
59.5%
5
Myrcene
C10H16
136.238
24.0 9
0.62
6.51%
6
β-pinene
C10H16
136.238
24.22
60.14
15.2%
7
Oleic acid, methyl ester
C19H36O2
296
25.56
3.56
17.5%
8
cis-Vaccenic acid
C18H34O2
282
31.54
1.12
18.2%
Tilia leaves (Tilia cordata)
1
Estragole
C10H12O
148
8.54
2.83
29.2%
2
Piperitone
C10H16O
152
9.65
4.37
22.1%
3
3-Allyl-6-methoxyphenol
C10H12O2
164
11.48
3.93
10.2%
4
P-coumaric acid
C9H8O3
164
14.80
37.47
13.8%
5
3-Ethyl-3-hydroxyandrostan-17-one
C21H34O2
318
16.68
2.99
6.73%
6
Tiliroside
C30H26O13
594.525
19.43
3.76
12.1%
7
Dasycarpidan-1-methanol, acetate (ester)
C20H26N2O2
326
21.73
4.48
13.5%
8
Quercetin
C12H10O7
302
25.04
18.92
21.9%
9
Kaempferol
C15H10O6
286
29.40
10.39
16.8%
10
Olean-12-en-3-one
C30H48O
424
48.73
10.86
12.1%
Dolichos lablab extract (Lablab purpureus)
1
Docosahexaenoic acid, 1,2,3-propanetriyl ester
C69H98O6
1022
5.37
4.89
10.7%
2
Hexadecanoic acid, methyl ester
C17H34O2
270
20.93
5.10
38.0%
3
Oleic Acid
C18H34O2
282
21.67
5.36
15.1%
4
7,10-Octadecadienoic acid, methyl ester
C19H34O2
294
24.10
11.13
6.19%
5
Linoleic acid chloride
C18H31ClO
298
24.19
6.65
15.4%
6
α-Glyceryl linolenate
C21H36O4
352
24.99
28.50
8.50%
7
Giganteumgenin N
C30H50O6
506
28.06
4.07
7.69%
8
Linoleic acid
C18H32O2
280
31.04
21.49
20.0%
9
Diisooctyl phthalate
C24H38O4
390
31.53
12.80
37.8%
Further inspection of Fig. 6 and Table 2 demonstrate that retardation effectiveness values enlarge via mounting concentration but decrease with increasing experiment temperatures for Fennel seeds (Foeniculum vulgare)and Tilia leaves (Tilia cordata), the inhibition efficiency attains a maximum of 73.33% and 66.67% at (1800 ppm) for Fennel (Foeniculum vulgare)and Tilia (Tilia cordata) respectively. Decrease in %IE with increasing temperature indicates that the molecules of Fennel (Foeniculum vulgare) and Tilia (Tilia cordata) were physically adsorbed on the copper surface.
The dissolution inhibiting effect of Fennel (Foeniculum vulgare) and Tilia (Tilia cordata) extracts can be attributed to the adsorption of effective constituents including D-limonene, β-pinene, myrecene and L-Fenchone in Fennel seeds and kaempherol, Quercetin, Tilirosid and p-coumaric acid in Tilia leaves (Tilia cordata). The effective constituents of these extracts are shown in Table 4. FTIR results also shows that Fennel (Foeniculum vulgare) and Tilia extracts (Tilia cordata) contains oxygen and nitrogen atoms in functional groups (OH, C⚌O, C—O, C⚌N, C—N, N—H, C⚌C) and aromatic rings, which meets the general consideration of typical corrosion inhibitors. In aqueous acidic solutions Fennel Foeniculum vulgare) and Tilia (Tilia cordata) may be protonated and exists in the form of cations. However, copper in H3PO4 is positively charged, so it is complicated for the protonated Fennel (Foeniculum vulgare) and Tilia (Tilia cordata) to approach the positively charged copper surface due to the electrostatic repulsion since phosphate being weakly adsorbed on the surface of copper there by given rise to negatively charged copper surface. The protonated component of Fennel (Foeniculum vulgare) and Tilia (Tilia cordata) may adsorb through electrostatic interaction between the positively charged molecules and negative charged metal surface (physisorption). When cations (protonated components) are adsorbed on metal surface a coordinate bond may be formed by partial transference of electrons from polar atoms to copper surface (Poornima et al., 2011). In addition owing to lone-pair electrons of polar atoms Fennel (Foeniculum vulgare) and Tilia (Tilia cordata) components may combine with freshly generated Cu2+ ions on copper surface forming metal inhibitor complexes. These complexes might get adsorbed onto copper surface by vander waals force to form a protective film to keep copper from dissolution. Results in Table 2 show increasing trend in inhibition efficiency values with increasing experimental temperature for Garlic (Allium sativum) and Dolichos lablab seeds (Lablab purpureus). Inhibition of copper dissolution in 8 M H3PO4 by Garlic (Allium sativum) and Dolichos lablab (Lablab purpureus) may be attributed to the adsorption of the effective compounds in these extracts onto the copper surface leading to dissolution inhibition phenomenon. Dissolution inhibition is initiated by the displacement of adsorbed H2O molecules by the inhibitor leading to specific adsorption of the inhibitor on copper surface increase in %IE with temperature can be attributed to the chemisorptions of the Garlic (Allium sativum) and Dolichos lablab (Lablab purpureus) on the copper surface (Abd El-Maksoud, 2008; Xiang-Hong et al., 2010).
Finally it could be said that the synergistic interaction of the major components in the four studied methanolic extract with other chemical constituents adds for the appreciable inhibitive property of the extracts.
3.3 Characterization of methanolic natural extracts
-
Fourier Transform-Infrared spectroscopic analysis (FTIR):
The existence of the hetero-atoms such as (N, S, O), aromatic ring, beside varied functional groups (O—H, C⚌C, C⚌O) in plants methanolic extract may assist the inhibitor molecules adsorption on copper surface to reduce the copper dissolution. In this work the FTIR spectroscopy was employed to identify whether the plants extract contains some of these functional groups or not. Table 3 show some important functional groups that are present in the methanolic extracts.
The comparison between the absorbance bands observed by FTIR spectra of Allium sativum (garlic extract), Tilia cordata (Tilia leafs), Foeniculum vulgare (fennel seeds), and Lablab purpureus (Dolichos lablab extract) before and after EP is shown in Fig. 3. This absorbance bands are sometimes appear, disappear or shifted after EP to indicate the formation of copper -plant extract complex. Also it is found that almost all the peaks observed for dried plants extract before EP are also noticed for plants extract after EP.
Obviously:
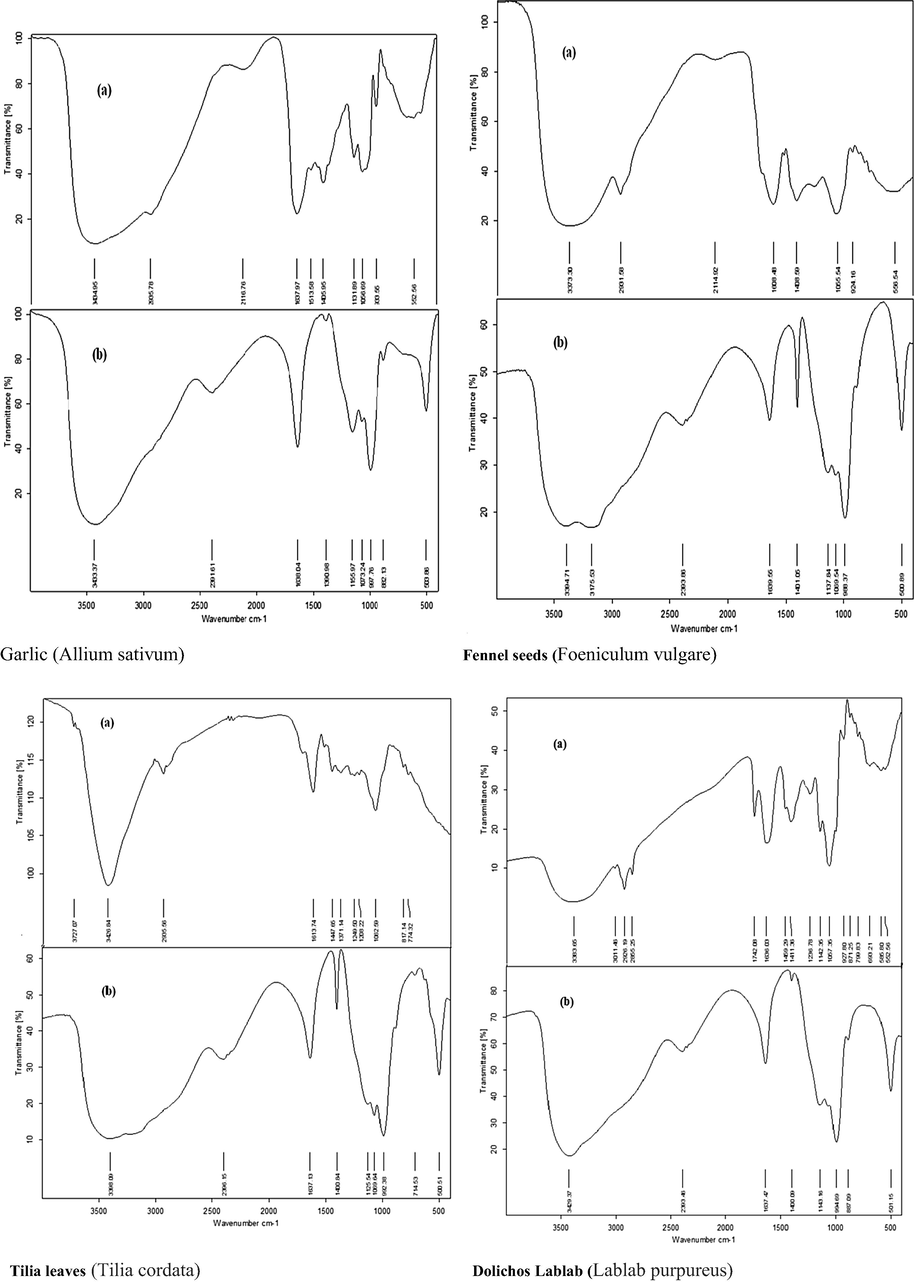
- FTIR spectra of methanolic plant extract (a) before EP and (b) after EP.
In Garlic (Allium sativum): A strong and broad peak of —OH stretching is observed at 3434.9 cm−1 before EP and is also observed at 3433.7 cm−1 after EP. Stretching peak —C—H is shifted from 2935.7 to 23916 cm−1. Stretching peak of —N—O disappeared after EP. Furthermore, the vibration peak of —N—O stretching is located in 1513.6 cm−1, which may overlap with other characteristic absorption peaks. The new absorption peaks at 997.8 and 882.1 cm−1 indicate the presence of C⚌C bending which appear after EP.The absorption peak of S⚌O stretching appeared at 1131.9 and shifted to1155.9 cm−1 and S—S stretching has shifted from 552.6 to 503.8 cm−1 (Lu et al., 2011, Barreto et al., 2017). In Fennel seeds (Foeniculum vulgare): The absorption peak of —OH stretching located at 3373.3 shifted to 3175.5 cm−1. Additionally —C—H stretching peak is shifted from 2931.6 to 2393. The stretching frequency of C⚌O and C—O bands are shifted from 1608.5 to 1639.5 cm−1 and 1055.5 to 1069.5 cm−1 respectively, due to electron cloud density shift from O atoms to coordinate with Cu2+ to form copper plant extract complex (Hussein et al., 2016). In Tilia leaves (Tilia cordata): A broad band at 3426.8 cm−1 is attributed to —OH and/or N—H stretching vibrations which shifted to 3398.1 cm−1. The stretching peak C—H is shifted from 2935.5 to 2396.1 cm−1, O—H bending peak is located at 1371.1 cm−1 which disappeared after EP. The absorption bands at 1208.2 and 774.3 cm−1 are shifted to1125.5 and 714.5 cm−1 which could be assigned to C—N stretching and C—H bending vibration, respectively (Fouda et al., 2017). In Dolichos lablab (Dolichos lablab extract): A strong —OH band at 3383.6 has shifted to 3429.4 cm−1, C—H stretching band at 2926.2 is shifted to 2393.5 cm−1. The absorption band 1742.1 cm−1 indicates the presence of C⚌O stretching group and this band disappeared after EP. C⚌C bending is shifted from 927.8 to 887.1 cm−1 and C—Cl stretching band are shifted from 552.6 to 501.1 cm−1 (Kahsay et al., 2018).
Finally, the surface analysis using FTIR reveals that function groups like —OH, —COOH, —N—O, C⚌N, C⚌O, S⚌O and S—S are present in the organic constituent of plants extract which indicate that the extracts contains several bioactive molecules (good for corrosion inhibition). The presence and shifted stretching peaks of the functional groups confirm the formation of active compound —Cu2+ complex on the copper surface. Hence, the FTIR spectra show that there is an interaction between the extract and the copper substrate which resulted in the inhibition effect (Alaneme et al., 2016).
UV–Visible spectroscopy:
Fig. 4 shows the UV–Visible spectrum of Garlic Allium sativum (garlic extract), Tilia cordata (Tilia leafs), Foeniculum vulgare (fennel seeds), and Lablab purpureus (Dolichos lablab extract) extract. As seen in Fig. 3a–d, the solution having Cu2+ ions display three absorption bands at 209, 252 and 816 nm. Otherwise, the garlic (Allium sativum) extract solution reveals two bands only at 229 and 279 nm. Cu2+ ions adding to garlic (Allium sativum) results in substitute the 252 and 816 nm absorption bands of Cu2+ ions by powerful absorption band at 323 and 813 nm investigative of Cu-plant extract complex formation. The solution containing fennel (Foeniculum vulgare) extract demonstrates only two bands at 287 and 421 nm. Cu2+ ions addition to fennel (Foeniculum vulgare) extract lead to replace the 252 and 816 nm Cu2+ ions absorption bands by forceful absorption band at 260 and 813 nm pinpointing to Cu-plant extract complex formation. Conversely, tilia (Tilia cordata) extract containing solution illustrates only two bands at 274 and 379 nm. Cu2+ ions addition to tilia (Tilia cordata) extract lead to alternate the 252 and 816 nm Cu2+ ions absorption bands by concentrated absorption band at 284 and 804 nm investigative of Cu-plant extract complex formation. But, dolichos lablab (Lablab purpureus) extract containing solution demonstrates only two bands at 218 and 268 nm. Cu2+ ions addition to dolichos lablab (Lablab purpureus)extract lead to change the 209, 252 and 816 nm Cu2+ ions absorption bands by powerful absorption band at 257 and 807 nm which indicate that Cu-plant extract complex formation. Therefore, Cu-plant extract may be as a stable complex adsorbed over the metal surface resulting in retardation influence or it may be as a soluble complex leading to catalytic effect. In systems that contain several chemical species, there is a opportunity to two types of complexes formation. Therefore, plant extract influence on the copper corrosion behavior in 8 M phosphoric acid could be interpreted on the basis of two issues: stable complex retardation effect and other soluble metal complex catalytic effect. It clear that the adsorbed metal complex retardation effect is primarily principal till a certain concentration where a definite leveling off value of their retardation efficiency is attained. Increasing the plant extract amount lead to appear of other soluble species accelerating effect which lead to diminish of the greatest retardation effectiveness. (Karthiga et al., 2018; Abdel-Gaber et al., 2006)
Gas Chromatography–Mass spectrometry (GC–MS) analysis:
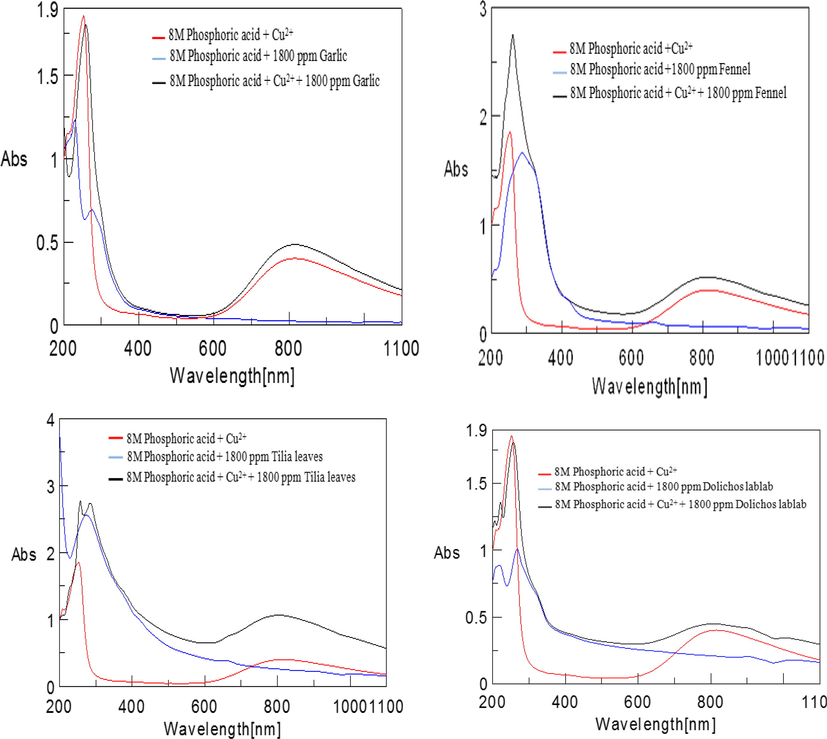
- UV–visible spectrum of Garlic Allium sativum (garlic extract), Tilia cordata (Tilia leafs), Foeniculum vulgare (fennel seeds), and Lablab purpureus (Dolichos lablab extract).
The organic compounds are found in Allium sativum (garlic extract), Tilia cordata (Tilia leafs), Foeniculum vulgare (fennel seeds), and Lablab purpureus (Dolichos lablab extract) were identified through GC–MS analysis Fig. 5. The molecular formula, molecular weight, retention time (RT), % compositions and probability percentage are presented in Table 3.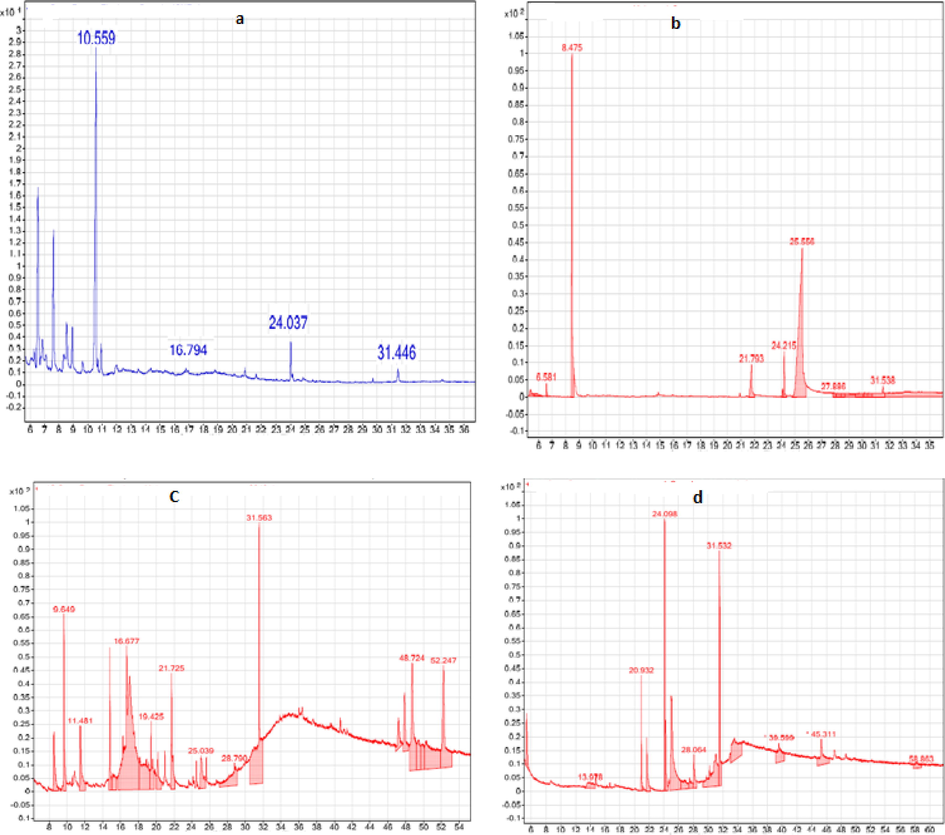
GC–MS spectrum of (a) Allium sativum (garlic extract), (b) Foeniculum vulgare (fennel seeds), (c) Tilia cordata (Tilia leafs), and (d) Lablab purpureus (Dolichos lablab extract).
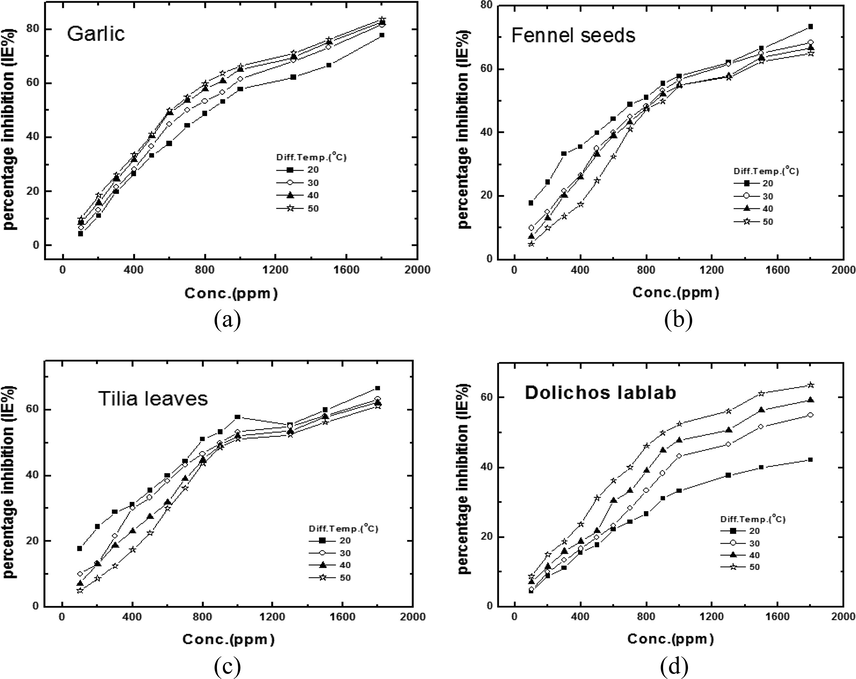
Percentage inhibition efficiency (% IE)- concentration dependence curves for copper in 8 M H3PO4 solution containing different concentration of (a) Garlic (Allium sativum), (b) Fennel seeds (Foeniculum vulgare), (c) Tilia leaves (Tilia cordata) and (d) Dolichos lablab (Lablab purpureus).
3.4 Temperature effect
The temperature effect on metal dissolution reaction is extremely difficult, since several modification take place on the metal surface for instance speedy etching and desorption of additives and the additives themselves many undergo decomposition and/or rescheduling. The effect of temperature on the dissolution rate of copper in 8 M H3PO4 and in the presence of different plant extract concentrations was studied in the temperature range of 293–323 K using galvanostatic measurements. We curiosity in discover the dissolution process activation energy. This was consummate by inspecting the temperature as function of dissolution current.
The activation parameters for the copper dissolution process were calculated from Arrhenius-type plot according to Eq. (3):
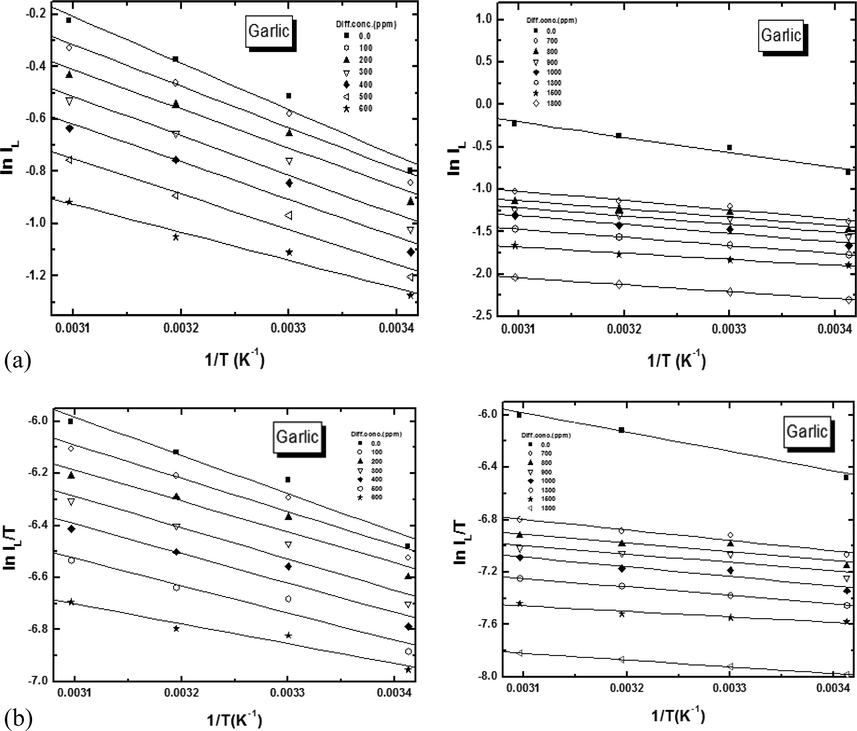
(a) Arrhenius plot and (b) Transition state plot of the dissolution for copper in presence of different concentration of Garlic (Allium sativum) extracts.
Compound
Garlic
(Allium Sativum)Fennel
(Foeniculum Vulgre)
Conc.
(ppm)Ea
kJ·mol−1
A
ΔH*
kJ·mol−1
−ΔS*
J·mol−1·K−1
ΔG*
kJ·mol−1
Ea
kJ·mol−1
A
ΔH*
kJ·mol−1
−ΔS*
J·mol−1·K−1
ΔG*
kJ·mol−1
0.0
14.74
198.24
12.19
209.43
75.65
14.74
198.24
12.19
209.51
75.67
100
12.87
98.48
10.60
215.32
75.84
18.42
750.76
15.87
206.75
78.51
200
12.38
67.15
9.83
218.49
76.03
19.09
914.21
16.54
196.80
76.17
300
12.52
63.86
9.96
218.91
76.29
21
1771.39
18.44
191.30
76.41
400
11.95
46.39
9.39
221.56
76.52
20.64
1458.71
18.09
192.92
76.54
500
11.24
31.18
8.68
224.81
76.80
20.19
1107.38
17.63
195.21
76.78
600
8.89
10.92
6.34
233.61
77.12
19.44
756.05
16.88
198.379
76.99
700
9.14
10.89
6.587
233.62
77.37
18.26
433.73
15.71
203
77.21
800
8.12
6.65
5.72
237.69
77.74
16.53
204.18
13.97
209.26
77.38
900
7.99
5.80
5.42
238.8
77.78
17.72
299.29
15.16
206.08
77.61
1000
8.66
6.83
6.11
237.52
78.07
16.54
175.71
13.99
210.51
77.77
1300
7.93
4.41
5.37
241.14
78.44
18.25
312.83
15.69
205.72
78.02
1500
6.03
1.76
3.47
248.77
78.85
17.80
232.55
15.25
208.18
78.32
1800
6.88
1.69
4.33
249.14
79.81
21.63
920.95
19.07
196.74
78.68
Compound
Tilia leaves
(Tilia cordata)
Dolichos lablab
(Lablab purpureus)
Conc.
(ppm)
Ea
kJ·mol−1
A
ΔH*
kJ·mol−1
−ΔS*
J·mol−1·K−1
ΔG*
kJ·mol−1
Ea
kJ·mol−1
A
ΔH*
kJ·mol−1
−ΔS*
J·mol−1·K−1
ΔG*
kJ·mol−1
0.0
14.74
198.24
12.19
209.51
75.67
14.74
198.24
12.19
209.50
75.67
100
18.42
749.94
15.87
198.44
75.99
13.47
112.84
10.92
214.17
75.31
200
19.27
987.47
16.71
196.16
76.15
12.97
88.09
10.42
216.24
75.94
300
19.92
1192.95
17.37
194.59
76.33
12.39
67.21
9.83
218.49
76.03
400
19.70
1022.49
17.14
195.86
76.49
12.15
58.44
9.59
219.65
76.15
500
19.73
977.79
17.18
196.24
76.64
10.40
27.93
7.85
225.78
76.26
600
19.16
722.91
16.61
198.75
76.83
9.32
17.09
6.77
229.88
76.42
700
18.54
516.76
15.98
201.54
77.05
8.76
13.05
6.21
232.12
76.54
800
18.34
431.01
15.78
203.05
77.31
6.71
5.43
4.16
239.42
76.70
900
17.10
246.93
14.54
207.68
77.47
6.28
4.24
3.73
241.36
76.86
1000
18.37
378.88
15.81
204.12
77.66
6.06
3.68
3.51
242.60
77.02
1300
16.54
183.56
13.99
210.15
77.66
5.78
3.09
0.62
252.33
77.08
1500
16.93
194.74
14.371
209.66
77.90
3.55
1.17
0.99
252.19
77.40
1800
18.55
320.35
15.99
205.52
78.26
2.86
0.84
0.31
254.92
77.55
Extract adsorption on copper surface might modify the surface through jamming fraction or the complete active sites; thus they may reduce electrochemical reactions rate on that surface which leading to enlarge Ea values, also the type of adsorption is typical of physical adsorption. In another word, an enlarge of dissolution activation energy in solution containing Fennel seeds (Foeniculum vulgare) and Tilia leaves (Tilia cordata), accompanied with an inhibition efficiency diminishing with mounting temperature, is regularly explained owing to adsorption film formation which have physical nature, i.e. linking electrostatic interactions with the metal surface. On the other hand, a chemisorption mechanism matches to an amplify in inhibition efficiency with temperature and lower activation energy in the presence of Garlic (Allium sativum) and Dolicus lablab (Lablab purpureus) (Fouda and Elabbasy, 2019; Dahmani et al., 2017).
It can be seen in Table 5 that Ea is lower in attendance of plant extract than in the plant extract free solution. This surveillance additional sustain, the proposed chemisorptions mechanism because lower activation energy in inhibited systems compared to blank has been reported to be indicative of chemical adsorption mechanism (Ekanem et al., 2010). Further in section of Table 5 also revealed that activation energy decreases with increases in concentration of Garlic (Allium sativum) and Dolichos lablab (Lablab purpureus) with the lower values 6.88 kJ·mol−1 and 2.86 kJ·mol−1 respectively being obtained at the highest extract concentration 1800 ppm studied. This is in agreement with the previous study of temperature effects on the corrosion inhibition of mild steel in acidic solutions of aqueous extract of Fenugreek leaves. The fall in the value of Ea may probably attribute to increase of metal surface area sheltered by the inhibitor molecules as the temperature rises (Noor, 2007).
The enthalpies (ΔH*) positive signs reveal the copper dissolution process is endothermic nature, ΔH* value increases with the addition of Fennel seeds (Foeniculum vulgare) and Tilia leaves (Tilia cordata), which means more energy is needed for the copper dissolution in the presence of Tilia (Tilia cordata), as a result, the dissolution of copper is inhibited. Entropies (ΔS*) value entail that at the rate determining step, the activated complex signifies an organization more than dissociation, significance that a reduce in disordering occur on departing from reactants to the activated complex (Fouda et al., 2016). (ΔH*) and (ΔS*) values designate the dissolution process energy barrier enlarges in the attendance of extract. The (ΔG*) values in solution containing the four plant extracts were more positive than that for free solution enlightening that in the solution containing plant extracts, the activated complex becomes less stable as compared to its free solution.
3.5 Weight loss measurements
Results gained from weight loss measurement were fitted into equation (5) to test for the order of dissolution reaction in the presence of plant extracts.
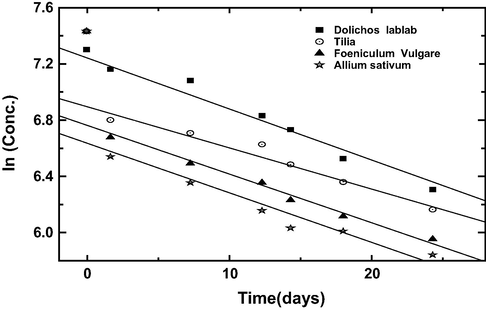
Variation of different concentration for natural extracts with time for copper coupons in 8 M H3PO4 acid solution at 25 °C.
Values of rate constant (k1) obtained from the slope of the plots of Eq. (5) and the half life calculated from Eq. (6) is presented in Table 6. From the results obtained it is significance to note that half life time increases in the following trend;
Garlic (Allium Sativum) < Fennel seeds (Foeniculum Vulgre) < Tilia leaves (Tilia cordata) < Dolichos lablab (Lablab purpureus)
| Methanolic extract Conc.(ppm) |
Garlic (Allium Sativum) |
Fennel seeds (Foeniculum Vulgre) |
Tilia leaves (Tilia cordata) |
Dolichos lablab (Lablab purpureus) |
||||||||
|---|---|---|---|---|---|---|---|---|---|---|---|---|
| k, min−1 | t1/2(min) | k, min−1 | t1/2(min) | k, min−1 | t1/2(min) | k, min−1 | t1/2(min) | |||||
| 0.0 | 1690 | 0.052 | 13.32 | 1690 | 0.049 | 14.14 | 1690 | 0.042 | 16.50 | 1690 | 0.040 | 17.32 |
| 200 | 1290 | 754 | 612 | 485 | ||||||||
| 600 | 1190 | 671 | 541 | 466 | ||||||||
| 800 | 825 | 626 | 508 | 425 | ||||||||
| 1200 | 744 | 600 | 478 | 417 | ||||||||
| 1500 | 683 | 578 | 453 | 408 | ||||||||
| 1800 | 627 | 548 | 437 | 382 | ||||||||
Also the rate constant increase by following order;
Garlic (Allium Sativum) > Fennel seeds (Foeniculum Vulgre) > Tilia leaves (Tilia cordata) > Dolichos lablab (Lablab purpureus)
The results of gravimetric experiments for the copper dissolution in 8 M H3PO4 solution free solution and 8 M H3PO4 solution containing several concentrations of plant extract for at 298 K are given in Table 7. It is clear that the dissolution rates decrease and the retardation efficiencies increase with the increasing plant extract concentrations, the inhibition efficiency obtained is excellent conformity with the result obtained by electrochemical measurements.
Natural extract
Garlic (Allium Sativum)
Fennel seeds (Foeniculum Vulgre)
W1
W2
WΔ(g)
EP Rate
W1
W2
WΔ(g)
EP Rate(g.s.cm–2)
Blank
59.335
59.433
0.0981
1.96E−03
59.335
59.433
0.0981
1.96E−03
100
46.3558
46.2713
0.0845
1.69E−03
125.4932
125.4505
0.0427
8.54E−04
200
46.2260
46.1573
0.0687
1.37E−03
125.4495
125.4269
0.0226
4.52E−04
300
46.1598
46.1221
0.0377
7.54E−04
125.4259
125.4051
0.0208
4.16E−04
400
46.0875
46.0570
0.0305
6.10E−04
125.4029
125.3862
0.0167
3.34E−04
500
46.0537
46.0257
0.0280
5.60E−04
125.3799
125.3635
0.0164
3.28E−04
800
45.9545
45.9339
0.0206
4.12E−04
125.3017
125.2887
0.0130
2.60E−04
1200
45.8950
45.8796
0.0154
3.08E−04
125.2539
125.2421
0.0118
2.36E−04
1500
121.6356
121.6254
0.0102
2.04E−04
125.2249
125.2157
0.0092
1.84E−04
1800
121.6214
121.6119
0.0095
1.90E−04
125.2102
125.2042
0.0060
1.20E−04
Natural extract
Tilia leaves (Tilia cordata)
Dolichos lablab (Lablab purpureus)
W1
W2
WΔ(g)
EP Rate
W1
W2
WΔ(g)
EP Rate(g.s.cm–2)
Blank
59.335
59.433
0.0981
1.96E−03
59.335
59.433
0.0981
1.96E−03
100
122.3905
122.3402
0.0503
1.01E−03
59.2669
58.8020
0.0958
1.92E−03
200
122.3382
122.3005
0.0377
7.54E−04
59.0632
58.7182
0.0934
1.87E−03
300
122.3000
122.2710
0.0290
5.80E−04
58.8893
58.6320
0.0873
1.75E−03
400
122.2703
122.2459
0.0244
4.88E−04
58.7990
58.2919
0.0808
1.62E−03
500
122.2056
122.1844
0.0212
4.24E−04
58.7100
57.9641
0.0780
1.56E−03
800
122.1189
122.1056
0.0133
2.66E−04
58.3363
121.7774
0.0444
8.88E−04
1200
121.9358
121.9237
0.0121
2.42E−04
57.9956
121.7587
0.0315
6.30E−04
1500
121.8724
121.8634
0.0090
1.80E−04
121.7982
58.8020
0.0208
4.16E−04
1800
121.8573
121.8429
0.0056
1.12E−04
121.7729
58.7182
0.0142
2.84E−04
3.5.1 Electropolishing rate calculation
The weight of the copper specimen was measured before and after EP. The electropolishing rate was calculated according to Eq. (7)
3.6 Surface characterization:
3.6.1 Scanning electron microscope (SEM)
Surface morphology was inspected on sample that electro-polished at 20 °C for 10 min. Fig. 9a demonstrates copper morphology before EP at the magnification of 5000. Etch pits were found with huge size and elevated deepness dispersed above the surface are observed. On the contrary, after EP in 8 M H3PO4, A smooth surface without major defects, the grain structures were observed (Fig. 9b).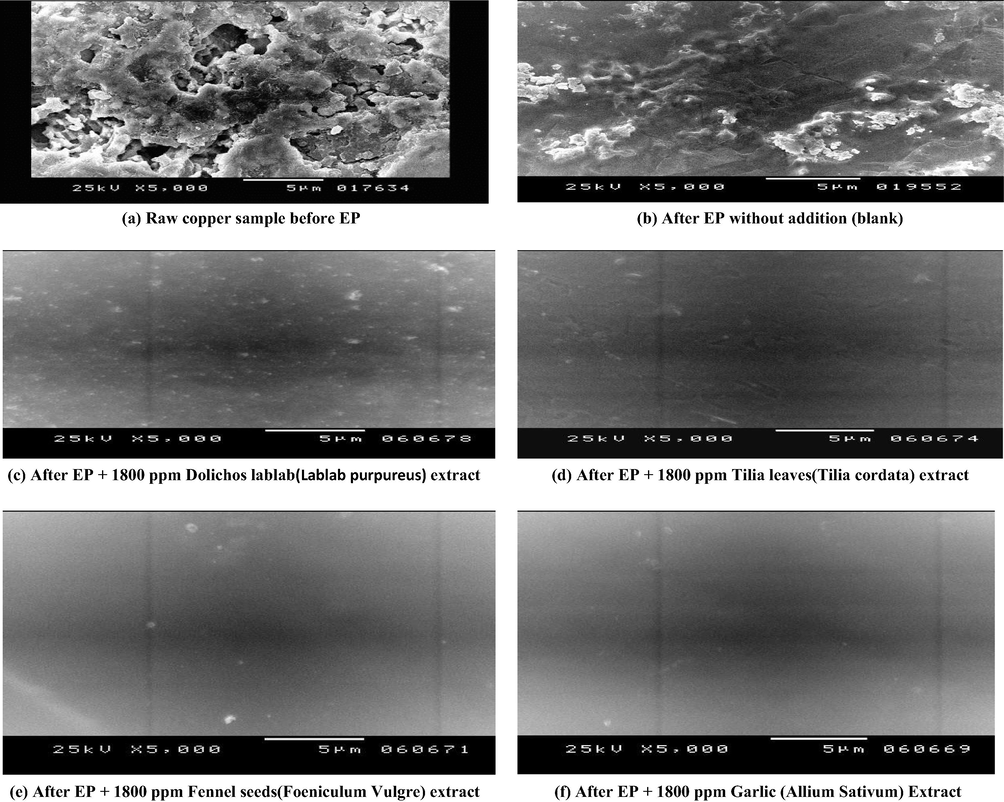
The surface morphology before and after EP at 293 K in the absence and presence of natural extracts.
Inspection of Fig. 9c (After EP + 1800 ppm Dolichos lablab (Lablab purpureus), it is observed that there is a gradual increase in surface quality to some extent as proved by the absence of pits grooves and cracks on the surface. By examination of Fig. 9d (After EP + 1800 ppm Tilia leaves(Tilia cordata) it was found that, uniformity increased, the surface is well polished and increase in surface appearance to great extent. By further inspection of Fig. 9e (After EP + 1800 ppm Fennel seeds (Foeniculum Vulgre), the surface appear smooth and completely uniform, in the other hand, Fig. 9f show the SEM of copper specimen after EP in presence of 1800 ppm Garlic (Allium Sativum). Leveling and brightening consequences were noticeably improved by the addition of Garlic (Allium Sativum) which is filling up the grooves and grain boundaries, also etching effect are eliminated. This behavior might be attributed to increase in the adsorption power of Garlic (Allium Sativum) methanolic on copper surface which confirms the superior retardation efficiency % recorded for 1800 ppm Garlic.
3.6.2 Degree of brightness
The Vis-IR spectra of unpolished copper specimen that electro-polished in 8 M H3PO4 (blank) and copper that electro-polished in 8 M H3PO4 electrolyte containing 1800 ppm of different methanolic plant extracts is shown in Fig. 10.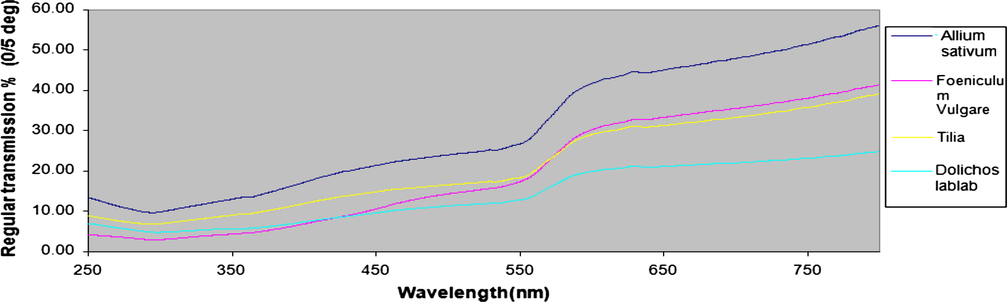
Reflectance diagram in the absences and presence of methanolic natural extract different concentrations (I) Garlic (Allium sativum), (II) Fennel seeds (Foeniculum vulgare), (III) Tilia leaves (Tilia cordata) and (IV) Dolichos lablab (Lablab purpureus).
It is seen that the electro-polished specimens reflectance is a function of the type of methanolic plant extracts. It is clear that the reflectance of the specimen that electro-polished at 8 M H3PO4 electrolyte increases compared with untreated specimen. From Table 8, the specular reflectance value before EP is 35.8. After an EP in 8 M H3PO4 electrolyte is 40.11. By addition of Dolichos lablab (Lablab purpureus), Tilia leaves (Tilia cordata), Fennel seeds (Foeniculum vulgare) and Garlic (Allium sativum), the degree of surface brightness and reflectance increased to 45.66, 49.77, 52.43 and 56.26 respectively.
1800 ppm
methanolic extractRaw sample
Blank
Dolichos lablab
(Lablab purpureus)Tilia leaves
(Tilia cordata)Fennel seeds
(Foeniculum vulgare)
Garlic
(Allium sativum)
Ra (μm)
141.92
112.3
69.09
62.87
58.99
28.88
Rq (RMS) (μm)
179.50
141.3
82.82
80.90
78.11
35.24
PV (μm)
133.00
101
94.09
59.69
49.14
46.11
Reflectance value
35.81
40.11
45.66
49.77
52.43
56.26
Gloss value
42.67
48.98
53.44
57.83
60.34
67.98
It is clear that the development of the insulating layer on the anode is very significant. The anode layer is a slim film of solid material or adsorbed atoms and molecules. The polishing accomplishment is considered to be due to a diffusion-controlled anodic dissolution procedure being set up through the anode layer and film. The depth and confrontation of insulating layer increase by addition of the four studied methanolic plant extracts. It is credible that the adsorption of the four studied methanolic plant extracts, the behavior of the normal anodic film in improving the microstructure of the surface, i.e. the four studied methanolic plant extract will increase the insulating layer thickness to great extent.
3.6.3 Atomic force microscope (AFM)
The surface roughness of the electropolished copper surface sample, various roughness values have been defined which are used to quantitatively describe the roughness of a material surface, one of them are shown in Figs. 11 and 12 as an example, including average roughness Ra, root mean square roughness Rq, and maximum peak-to-valley height PV.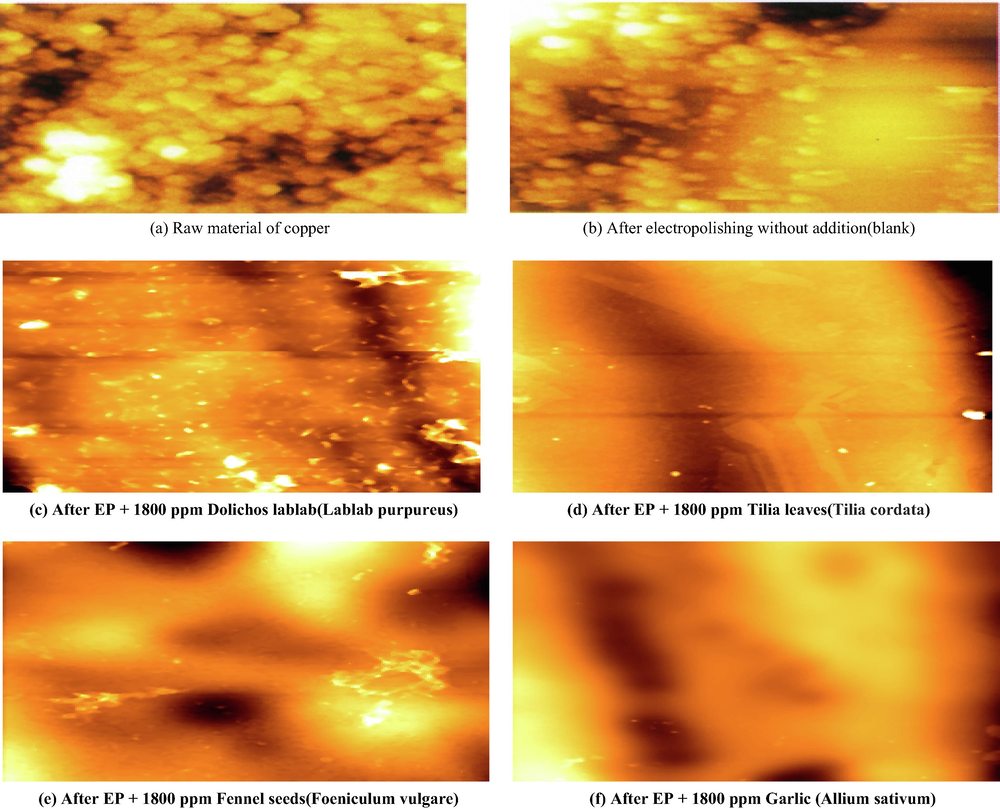
Two dimensional AFM images before and after EP at 298 K in the absence and presence of natural extracts.
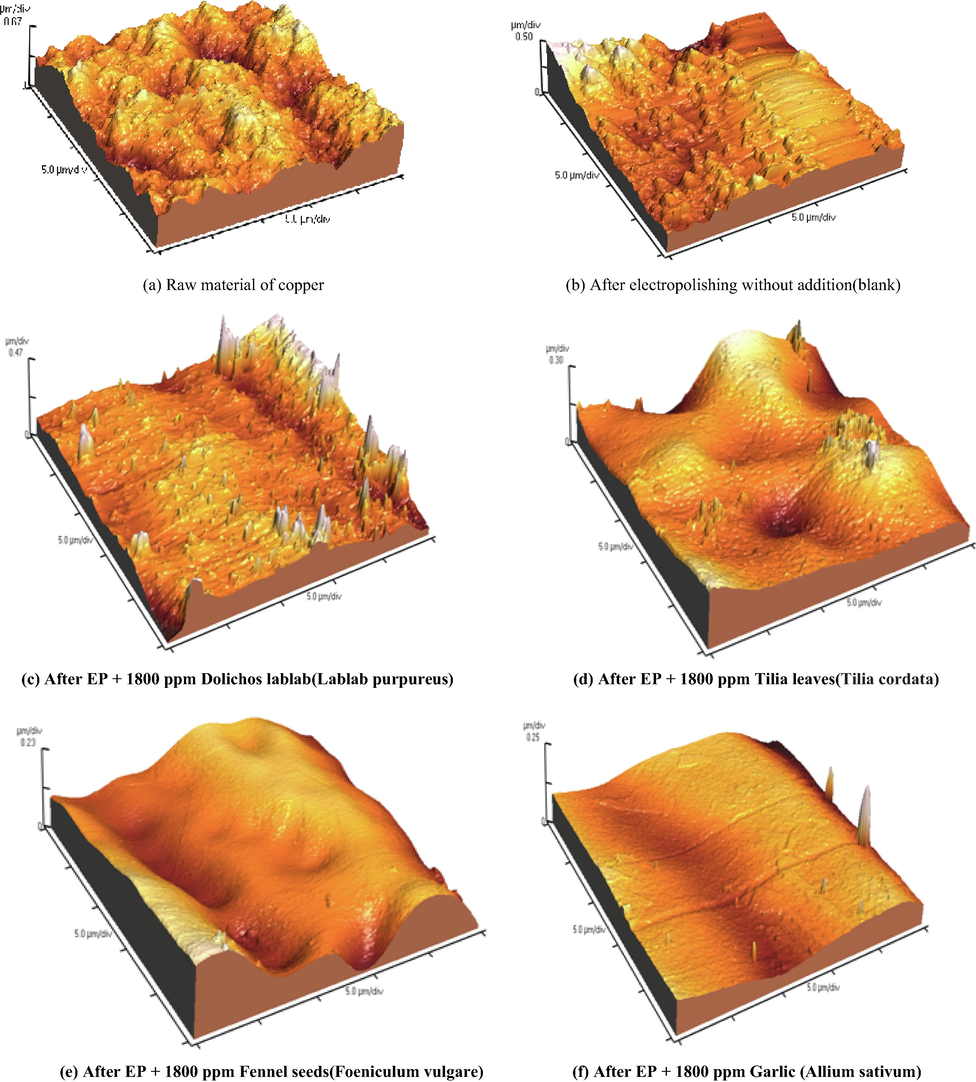
Three dimensional AFM images before and after EP at 298 K in the absence and presence of natural extracts.
From Table 8, the surface roughness will be reduced by the addition of different types of natural extracts. Since the trends of Ra and RMS are almost the same, only Ra values are provided for the following discussion.
From an examination of Table 8, it is observed that, raw copper sample records highest surface roughness (141.92 μm). Oppositely, the electropolished copper with a low Ra value of (112.3 μm) obtained from the bath containing 8 M H3PO4 solution without any addition (Blank). EP in the solution containing 8 M H3PO4 and 1800 ppm of plant extract should be very different from the case containing phosphoric acid only. Hence, their corresponding surface roughness parameters are mainly decreased to a great extent.Ra value decreases depending on the type of plant extract. Where Ra values are 69.09, 62.87, 58.99 and 28.88 μm in the presence of Dolichos lablab (Lablab purpureus), Tilia leaves (Tilia cordata), Fennel seeds (Foeniculum vulgare) and Garlic (Allium sativum) respectively.
4 Conclusion
-
Addition of methanolic plant extract to the electropolishing solution results in a lower limiting current since methanolic plant extract suppresses dissolution rate of copper by increasing surface viscosity, which influence planarization capacity of electrolyte
-
Ea increased in the presence of methanolic plant extract which is a good evidence of the strong retardation behavior of methanolic plant extract for the electro-dissolution processes for Cu metal.
-
Activation parameters values confirm that copper dissolution process was controlled by diffusion also it is endothermic in nature
-
The electro-polishing behavior of Cu surface is significantly affected by temperature and concentration of different type of methanolic plant extract.
-
According to SEM, UV–VIS-NIR spectra and surface roughness measurements, addition of high concentration (1800 ppm) of methanolic plant extract to the electrolytic solution is highly effective to enhance surface quality.
-
High reflection property is obtained when the different type of methanolic plant extract is added to the electro-polishing electrolyte.
-
Ra values are 69.09, 62.87, 58.99 and 28.88 μm in the presence of Dolichos lablab, Tilia leaves, Fennel seeds and Garlic respectively
-
The minimum Ra and PV values are achieved by garlic extract, which records the highest reflectance value and inhibition efficiency. This is attributed high active sites number for garlic extract, which can achieve great compact surface coverage
-
Weight loss data obtained is excellent conformity with the result obtained by electrochemical measurements.
-
Activation parameter values (ΔG*, ΔH*, and ΔS*) indicated that the copper dissolution process is controlled by diffusion and endothermic nature.
Declaration of Competing Interest
The authors declared that there is no conflict of interest.
References
- Inhibitive action of some plant extracts on the corrosion of steel in acidic media. Corros. Sci.. 2006;48:2765-2779.
- [Google Scholar]
- the effect of organic compounds on the electrochemical behaviour of steel in acidic media. A review. Int. J. Electrochem. Sci.. 2008;3:528-555.
- [Google Scholar]
- Study of electropolishing inhibition of steel using natural products as a green inhibitor in ortho-phosphoric acid. Green Chem. Lett. Rev.. 2015;8:88.-94.
- [Google Scholar]
- A study of vitamin B influence on the morphology, roughness, and reflectance of electropolished aluminum in H3PO4–H2SO4 mixture Arab. J. Chem.. 2020;13:2579-2595.
- [Google Scholar]
- Comparison between electropolishing behavior of copper and mild steel in the presence of lactic and mandolic acid. Int. J. Electrochem. Sci.. 2016;11:7269-7281.
- [Google Scholar]
- Application of aqueous extracts of coffee Senna for control of mild steel corrosion in acidic environments. Inter. J. Ind. Chem.. 2012;3(13):1-12.
- [Google Scholar]
- Corrosion inhibitory properties of elephant grass (Pennisetum purpureum) extract: effect on mild steel corrosion in 1 M HCl solution. Alex. Eng. J.. 2016;55:1069-1076.
- [Google Scholar]
- Evaluation of the anticorrosion performance of peel garlic extract as corrosion inhibitor for ASTM 1020 carbon steel in acidic solution. Rev. Mater.. 2017;22(3):1-14.
- [Google Scholar]
- The anticorrosion behavior of lavandula dentata aqueous extract on mild steel in 1M HCl. Int. J. Electrochem. Sci.. 2013;8:6005-6013.
- [Google Scholar]
- Organic and aqueous electrolytes used for etching macro- and mesoporous silicon’. Phys. Status Solidi (a). 2003;197:34-38.
- [Google Scholar]
- Corrosion inhibition of copper in 3 percent NaCl solution by new bipyrazolic derivatives. Anti-Corros. Method Mater.. 2002;49:96-104.
- [Google Scholar]
- Cinnamon essential oil as a novel eco-friendly corrosion inhibitor of copper in 0.5 M sulfuric acid medium. J. Mater. Environ. Sci.. 2017;8(5):1676-1689.
- [Google Scholar]
- Fundamental aspects and applications of electrochemical microfabrication. Electrochim. Acta. 2000;45(15):2535-2558.
- [Google Scholar]
- Inhibition of mild steel corrosion in HCl using pineapple leaves (Ananas comosus L.) extract. J. Mater Sci.. 2010;45:5558-5566.
- [Google Scholar]
- Zygophllum coccineum L. Extract as green corrosion inhibitor for copper in 1 M HNO3 solutions. Inter. J. Adv. Res.. 2014;2(11):517-531.
- [Google Scholar]
- Mitigation of corrosion of carbon steel in acidic solutions using an aqueous extract of Tilia cordata as green corrosion inhibitor. Int. J. Ind. Chem.. 2017;8:61-73.
- [Google Scholar]
- Corrosion inhibition effect of methanol extract of nerium oleander on copper in nitric acid solutions. Int. J. Electrochem. Sci.. 2019;14:6884-6901.
- [Google Scholar]
- Trigonella stellate extract as corrosion inhibitor for copper in 1M nitric acid solution. J. Chem. Pharm. Res.. 2016;8(2):86-98.
- [Google Scholar]
- A novel Schiff base-based cationic Gemini surfactants: Synthesis and effect on corrosion inhibition of carbon steel in hydrochloric acid solution. Corros. Sci.. 2009;51(11):2610-2618.
- [Google Scholar]
- Study of corrosion inhibition of mild steel in acidic medium by 2-propargyl-5-p-hlorophenyltetrazole: Part I. J. Mater. Environ. Sci.. 2012;3(3):543-550.
- [Google Scholar]
- Study of chemical composition of Foeniculum vulgare using Fourier transform infrared spectrophotometer and gas chromatography–mass spectrometry. J. Pharmacognosy. Phytother.. 2016;8(3):60-89.
- [Google Scholar]
- Synthesis of silver nanoparticles using aqueous extract of Dolichos lablab for reduction of 4-Nitrophenol, antimicrobial and anticancer activities. OpenNano. 2018;3:28-37.
- [Google Scholar]
- Optimization of electrochemical polishing of stainless steel by grey relational analysis. J. Mater. Process. Tech.. 2003;140:255-259.
- [Google Scholar]
- corrosion inhibition of mild steel by an aqueous extract of allium sativum. European J. Biomed. Pharm. Sci.. 2018;5(2):838-843.
- [Google Scholar]
- Interpretation of the impedance properties of the anode-surface film in the electropolishing of copper in phosphoric Acid. J. Electrochem. Soc.. 1973;120:1202-1205.
- [Google Scholar]
- Electrochemical micromachining, polishing and surface structuring of metals: fundamental aspects and new developments’. Electrochim. Acta. 2003;48:3185-3201.
- [Google Scholar]
- The effects of electropolishing (EP) process parameters on corrosion resistance of 316L stainless steel. J. Mater. Process. Tech.. 2003;140:206-210.
- [Google Scholar]
- Effects of electropolishing surface treatment on the cyclic fatigue resistance of BioRace nickel-titanium rotary instruments. J. Endod.. 2010;36:1653-1657.
- [Google Scholar]
- Infrared and Raman spectroscopic studies of the antimicrobial effects of garlic concentrates and diallyl constituents on foodborne pathogens. Anal. Chem.. 2011;83(11):4137-4146.
- [Google Scholar]
- Port. Corrosion inhibition of muntz (63% Cu, » 37% Zn) alloy in HCl solution by some naturally occurring extracts. Electrochim. Acta. 2006;24:441-455.
- [Google Scholar]
- Temperature effects on the corrosion inhibition of mild steel in acidic solutions by aqueous extract of fenugreek leaves. Int. J. Electrochem. Sci.. 2007;2:996-1017.
- [Google Scholar]
- Corrosion inhibition and adsorption behaviour for aluminuim by extract of Aningeria robusta in HCl solution: Synergistic effect of iodide ions. J. Mater. Environ. Sci.. 2011;2(1):60-71.
- [Google Scholar]
- Mild steel corrosion inhibition by various plant extracts in 0.5 M sulphuric acid. Int. J. Electrochem. Sci.. 2013;8:2635-2655.
- [Google Scholar]
- Azadirachta indica extracts as corrosion inhibitor for mild steel in acid medium. Int. J. Electrochem. Sci.. 2010;5:978-993.
- [Google Scholar]
- The mechanism of electropolishing of titanium in methanol-sulfuric acid electrolytes. J. Electrochem. Soc.. 1998;145:2362-2369.
- [Google Scholar]
- Effect of 4-(N,N-diethylamino)benzaldehyde thiosemicarbazone on the corrosion of aged 18 Ni 250 grade maraging steel in phosphoric acid solution. Corros. Sci.. 2011;53(11):3688-3696.
- [Google Scholar]
- Evaluation of Allium sativum as corrosion inhibitor for carbon steel in sulphuric acid under hydrodynamic conditions. Green Chem. Lett. Rev.. 2015;8:49-58.
- [Google Scholar]
- A mass transfer study of the electropolishing of metals in mechanically agitated vessels. Int. Comm. Heat Mass Transfer. 2001;28(2):257-265.
- [Google Scholar]
- A study of factors influencing on dissolution behavior of copper in orthophosphoric acid using rotating cylinder electrode (RCE) and rotating disc electrode (RDE) Int. J. Electrochem. Sci.. 2013;8:9041-9059.
- [Google Scholar]
- The effect of surfactants on the electropolishing behavior of copper in orthophosphoric acid. Appl. Surf. Sci.. 2013;277:155-166.
- [Google Scholar]
- Some drugs effect on the electropolishing of C-steel in H3PO4 acid under normal and compulsory convection circumstances. Russ. J. Electrochem.. 2020;56:189-205.
- [Google Scholar]
- Nanoscopic studies of stainless steel electropolishing. Corros. Sci.. 2000;42:1041-1053.
- [Google Scholar]
- The nature of the film formed on copper during electropolishing. J. Electrochem. Soc.. 1956;103:363-366.
- [Google Scholar]
- Use of electropolishing for enhanced metallic specimen preparation for electron backscatter diffraction analysis. Mater. Charact.. 2005;55:190-202.
- [Google Scholar]
- Inhibition by Jasminum nudiflorum Lindl. leaves extract of the corrosion of cold rolled steel in hydrochloric acid solution. Appl. Electrochem.. 2010;40:1641-1649.
- [Google Scholar]


