

Translate this page into:
Environmentally friendly acylaminocarboxylates yttrium (III) complexes: Synthesis, solubility and aggregation behavior
⁎Corresponding author. naren88@hotmail.com (Gerile Naren)
-
Received: ,
Accepted: ,
This article was originally published by Elsevier and was migrated to Scientific Scholar after the change of Publisher.
Peer review under responsibility of King Saud University.
Abstract
Abstract
In order to investigate the effect of differences in amino acid alkyl chains, In order to investigate the effect of difference amino acid alkyl chains on the Rare earth complexes, the lipoaminic acids rare earth surfactant complexes of yttrium hexanoyl alaninc acid (Y(hex-ala)3), yttrium octanoyl alaninc (Y(oct-ala)3) and yttrium dodecanoyl alaninc acid (Y(dod-ala)3) are synthesized by the reaction of C9H17NO3, C11H21NO3, C15H29NO3 with YCl3, respectively. These complexes have been compared to the yttrium octanoate soap (Y(octnt)3). At the same time, the formation of molecular glasses of these complexes are compared with the aggregation behavior in solution, evaluate properties as glass. Furthermore, the aggregation behavior of the above surfactant complexes in the pure solvent are studied using nuclear magnetic resonance (NMR) spectrometry, vapor pressure osmometry (VPO), electrical conductivity and Fourier Transform-Infrared spectroscopy (FT-IR). As results, these Y(III) complexes aggregate in the organic solvents system and tend to form aggregates. After the organic solvents evaporated, organic rare earth vitreous bodies was obtained.
Keywords
Aggregation
Organic rare earth vitreous bodies
Glassy state
Yttrium complexes
Crystalline state

1 Introduction
The complete evaporation of organic solvents, such as methanol and chloroform, the solutions of octanoylalaninato metal (Ca, Mg, La, Eu) complex forms a series of stable molecular vitreous solids (Bai and Cherumuttathu, 2020; Gerile et al., 2015, 2020; Hua et al., 2011; Iida et al., 2006; Naren et al., 2009). In this paper, to investigate the alkyl chain length effect on properties of the yttrium (III) complex, we have synthesized the yttrium (III) complex of hexanoyl alaninate (Y(hex-ala)3) and dodecanoylalaninate (Y(dod-ala)3), which are compared with yttrium (III) complex of octanoylalaninate (Y(oct-ala)3). The formation of molecular glasses of these complexes is compared with the association behavior in solution, and the properties as glasses are evaluated. The comparison results of metal octanoate soap (Y(octnt)3) show that it has a different polar group. For the Y complexes, such as Y(oct-ala)3, Y(hex-ala)3, and Y(dod-ala)3), in high concentration solutions, we discovered that after the solvents in these gels completely evaporated, glassy substances formed. The glass of amorphous solids are normally formed through slowly or rapidly cooling down the material at room temperature after the material melted, which freezes the disordered states through the position and orientation of the gravity center of each molecule (Iida et al., 2006; Hirao, 2003; Seki, 1995). These low molecular compounds are limited to a set of organic π - electron compounds (Yasuhiko, 2000). Comparing the alaninnate Yttrium complexes with the non-alkyl chain, we found that the existence of the alkyl chain was important for the formation of glass phase. Moreover, when the Molecular alkyl chain length is long enough, the amorphous tendency of the yttrium complex are weakened and the crystallization tendency are increased. The hydrophilicity was enhanced by adding amino acid functional group into the yttrium complexex molecule (Naren et al., 2009; Taha et al., 2016). The structure and properties of amorphous molecular glasses were studied using X-ray diffraction (XRD), polarized light microscopy (PLM), and differential scanning calorimetry (DSC). To examine the property of the complex in solution, the self-diffusion coefficient in methanol and chloroform and the vapor pressure drop measurements were carried out. The association behavior in these solutions was examined using Knauer Vapour Pressure Osmometer (VPO) and NMR measurements. The alkyl chain length and the solvent effects were explored. The results of the aggregation behavior of these Y complexes showed that these rare earth complexes easily formed a transparent sol-gel-aerogel, and heat treatment at 110°made the sol-gel aerogel form a stable amorphous solid. These low molecular compounds are confined to a group of π-organic electron compounds (Yasuhiko, 2000).
Other researchers also revealed that after dissociation of rare earth complexes into rare earth metal ions and ligand ions, the rare earth metal ions chelate with 1,4 hydroxyl oxygen and C-9 and C-10 carboxyl groups contained in cell DNA (Taha et al., 2016; Wei et al., 2015; Santos et al., 2017; Marastoni et al., 2017; Palchaudhuri and Hergenrother, 2007; Zhou et al., 2013). The rare earth complexes are promising for new anticancer drugs. The synthesized rare earth complexes can not only reduce the toxicity of rare earth, but also enhance their antitumor activity. More importantly, their stability is higher (The solid rare earth organic complex in the storage tank has not been decomposed for 3 years). The solubility of drugs is one of the important factors affecting drug absorption. The complexation of rare earth with special ligands can greatly enhance the solubility and improve the bioavailability (Santos et al., 2017; Marastoni et al., 2017; Palchaudhuri and Hergenrother, 2007; Zhou et al., 2013). Therefore, these new amphoteric surfactant Yttrium complexes with good solubility are promising for further applications in the near future. Specific applications will be explored in the near future.
2 Experimental
2.1 Isolation of the metal complexes
Ligands and the metal complexes were prepared following previous reports [4.15]. N-hexanoyl-DL-alanine (hex-ala), N-octanoyl-DL-alanine (oct-ala), and N- dodecanoyl-DL-alanine (dod-ala) were obtained by the reported procedures. Three yttrium complexes were prepared by reaction between ligands (3 × 10.2 mol) and yttrium chloride (1.1 × 10.2 mol) in methanol solution, and the reaction needs controlling pH with KOH in methanol solution. The mole ratio ligands: yttrium chloride is 3:1, and the yttrium complexes were purified in organic solution. The materials in white-powder form are obtained by purifying with ethanol and acetone (Taha et al., 2016). Elemental analysis of the samples, 13C NMR, and moisture test were used to examine the purity of the rare earth complexes. The results of the mass fraction of carbon, hydrogen, and nitrogen elemental analyses of these rare earth complexes were in good agreement with the requirements of Theoretical calculation results. Table 1 shows the experimental and calculated results of CHN elemental analysis of Y(hex-ala)3·2H2O, Y(hex-ala)3·H2O, Y(oct-ala)3·0.5H2O, and Y(dod-ala)3·0.5H2O complexes.
Y complexes
Calculated value %
Measured value %
C
H
N
C
H
N
Y(octnt)3·2H2O crystalline
51.98
8.91
–
51.72
8.94
–
Y(hex-ala)3·H2O glassy
48.73
7.52
6.31
48.72
7.43
6.23
Y(oct-ala)3·0.5H2O glassy
53.51
8.30
5.67
53.28
8.55
5.71
Y(dod-ala)3·0.5H2O crystalline
59.45
9.42
4.62
59.43
9.45
4.63
2.2 Measurements
2.2.1 NMR and pulsed field gradient spin echo (PGSE) measurements
The 13C NMR spectra of Y complex solution were obtained using a JEOL EX-270 FT NMR spectrometer operating at 67.9 MHz. The self-diffusion coefficients (D) of the lipoaminic acids metal complex surfactants and of the solvents were measured using PGSE.
2.2.2 Vapor pressure osmometry measurements
The association behavior of these Y complexes in methanol solution was studied using a Knauer Vapor Pressure Osmometer (VPO) K-7000 at 45 °C. The apparent molecular weight of these Y complexes were obtained using the relationship between temperature (T) and the concentration of the solution.
2.2.3 Polarizing optical micrographs
The surface morphology of the rare earth complexes was obtained using a LABOPHOT-POL Nikon polarized light microscope.
2.2.4 Calorimetric measurements
The Characterization of the solid state and loss of water from the complex solids were studied using DSC (Shimadzu DSC-50), TG-DTA (Rigaku TG8101 or Shimadzu DTG-60) in a temperature range of 0–300 °C.
2.2.5 Powder X-ray diffraction measurements
X-ray diffraction experiments were carried out to determine the crystalline state and glass state of the complex. Wide-angle (2θ = 5 ∼ 60°) X-ray diffraction (WAXD) and small-angle (2θ = 1 ∼ 10°) X-ray scattering (SAXS) experiments were carried out at room temperature with a 0.8 KW generator of Cu Ka radiation (PANalytical X'pert Pro) and with a 1.6 KW generator of Cu Ka radiation (Rigaku RINT-Ultima III), respectively.
2.2.6 FT-IR measurements
The FT-IR spectra were obtained in a range of 2800–4000 cm−1 using a SHIMADZU 8300 FT-IR spectrometer using the KBr pellet sample preparation for the glassy and crystalline specimens.
2.2.7 Theoretical calculations
To further examine the experimental results, we used density functional theory (DFT) to optimize the structure of the yttrium complexes, analyze the molecular electrostatic potential and 13C NMR spectra of the yttrium complexes.
3 Results and discussion
3.1 Solubility of yttrium complex in pure solvent
As previously reported, the solubility of calcium, magnesium, zinc and lanthanum octanoylalaninatatan complexes in organic solvents are significantly larger than those of the corresponding metal carboxylates, soaps, having the same alkyl chains, and the higher solubility results in extensive aggregation in the organic solutions and the mixed solutions of water and organic solvent (Gerile et al., 2015; Naren et al., 2009, 2008). The solubility of this series of acylaminocarboxylic acid yttrium(III) complexes are alkyl chain-length and head group dependent, and they are remarkably soluble in many solvents. The solubility of the yttrium(III) complexes were classified into three categories: (1) higher than 10% (W/V), (2) ranging from 0.1% (W/V) to 10% (W/V), and (3) less than 0.1% (W/V); The solubility of the yttrium complexes are presented in Table 2. 1: >10%, 2: 0.1–10%, 3: <0.1%.
Solvent
Y(hex-ala)3·H2O
Y(oct-ala)3·0.5H2O
Y(dod-ala)3·0.5H2O
Y(octnt)3·2H2O
Water
2
2
3
3
Methanol
1
1
1
3
Ethanol
1
1
1
3
Cyclohexanol
2
1
1
2
Hexanol
2
1
1
2
THF
1
1
1
2
Ethylacetate
3
2
3
3
Cloroform
1
1
1
2
Benzene
3
1
1
1
Dioxane
1
1
3
3
Compared with Y(octnt)3, due to the presence polar groups of amino acid, Y(hex-ala)3, Y(oct-ala)3, and Y(dod-ala)3 complexes have higher solubility in alcoholic solvent, and the higher solubility is exhibited for solvents with high inductions, such as methanol or ethanol. Besides, Y(hex-ala)3, Y(oct-ala)3 and Y(dod-ala)3 complexes are highly soluble in methanol. The aggregation initiated in the solution and a glassy compound was produced after the evaporation of the solvent or a heating and cooling treatment. Y(octnt)3 also has a higher solubility in benzene, but the evaporation of the solvent or the heating and cooling treatment produced a crystalline compound instead of the glassy compound. Therefore, Y(octnt)3 is not a multi domain application material.
3.2 1H NMR and 13C NMR spectra of the rare earth complexes in methanol solutions
Information on the number and position of hydrogen atoms in yttrium complexes can be obtained by 1H NMR spectra. The results for yttrium complexes were Y(hex-ala)3 complex: 1H NMR (600 MHz, Methanol‑d4) δ = 2.10 – 1.85 (m, 1H), 1.59 (p, J = 7.3, 1H), 1.31 (dq, J = 36.4, 7.5, 2H), 0.92 (t, J = 7.2, 1H), 0.52 – 0.34 (m, 1H). Y(oct-ala)3 complex: 1H NMR (600 MHz, Methanol‑d4) δ = 4.27 (q, J = 7.1, 1H), 2.29 – 2.17 (m, 2H), 1.61 (p, J = 7.3, 2H), 1.32 (dt, J = 18.2, 9.6, 12H), 0.89 (t, J = 6.8, 3H). Y(dod-ala)3 complex: 1H NMR (600 MHz, Methanol‑d4) δ = 4.86 (d, J = 1.9, 2H), 1.88 (s, 1H), 1.65 – 1.49 (m, 1H), 1.30 (s, 9H), 0.90 (t, J = 7.0, 2H). The chemical structure of the yttrium complexes were studied by an using elemental analysis, 13C NMR and moisture tests (Fig. 1). Table 3 shows the chemical shift results of 13C NMR of the yttrium complexes in methanol from 0 to 200 ppm. The 13C NMR spectrum of the yttrium complex showed eleven resonance peaks, corresponding to varied functional groups. The 13C NMR spectra of the ligands and complexes were used to examine the purity of the rare earth complexes and to determine the chemical structure of yttrium complexes.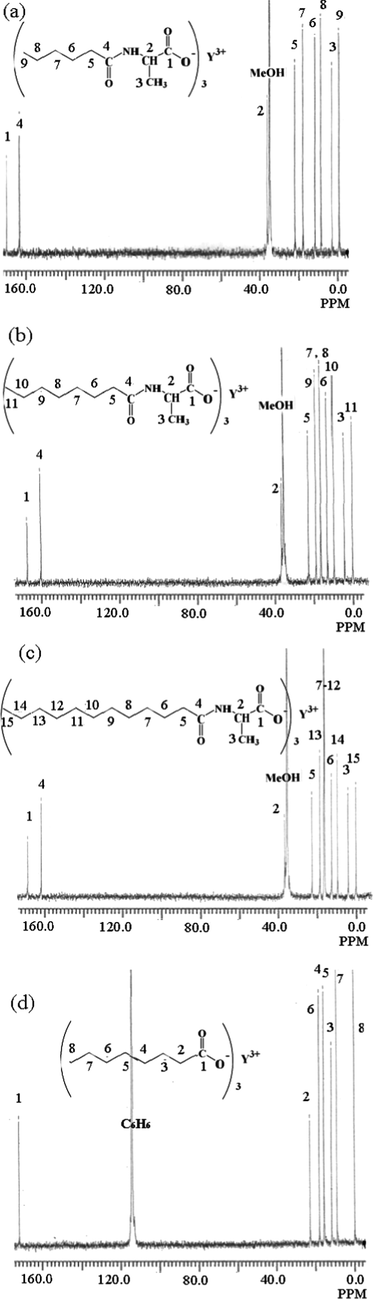
13C NMR spectrum of (a) Y(hex-ala)3·H2O; (b) Y(oct-ala)3·0.5H2O; (c) Y(dod-ala)3·0.5H2O; (d) Y(octnt)3·2H2O.
Peak Sequence
Functional Group
Chemical Shift ((δ)/ppm)
H(hex-ala)
Y(hex-ala)3
H(oct-ala)
Y(oct-ala)3
H(dod-ala)
Y(dod-ala)3
C-1
—COO—
170.1
161.41
167
168
C-2
—CH
38.2
34.8
37.5
36.2
C-3
—CH3
4.0
3.3
4.0
4.0
C-4
—C⚌O
162.1
161.32
160
161.3
C-5
—CH2—
22.9
22.3
23
23.0
C-6
—CH2—
12
12.4
13
12.9
C-7
—CH2—
19.1
15.7
10
17.0
C-8
—CH2—
9.2
15.6
10
17.0
C-9
—CH2—, —CH3
0
18.4
19
17.0
C-10
—CH2-
–
–
9.2
10
17.0
C-11
—CH2, —CH3
–
–
0
0
17.0
C-12
—CH2
–
–
–
–
17.0
C-13
—CH2
–
–
–
–
19.1
C-14
—CH2
–
–
–
–
9.0
C-15
—CH3
–
–
–
–
0
3.3 Differential scanning calorimetry and polarization microscopy investigation
DSC curves, PM images, and X-ray scattering curves can be used to reveal the formation of glassy state or crystalline state materials. Water content of the rare earth complex affects the DSC results significantly. When a rare earth complex molecule has 2 ∼ 2.5 water molecules, the DSC results showed a wide endothermic peak between 130 °C and 180 °C, which is considered a crystalline structure peak (Naren et al., 2019). The rare earth complex has a low water content after the heating and cooling treatment, the number of water molecules in a rare earth complex molecule decreased to 0.5–1.0. The glass transition point could also be obtained from DSC. As shown in Fig. 2, the glass transition temperature of the rare earth complexes, Y(oct-ala)3·0.5H2O and Y(hex-ala)3·H2O, are 59 °C and 45 °C, respectively.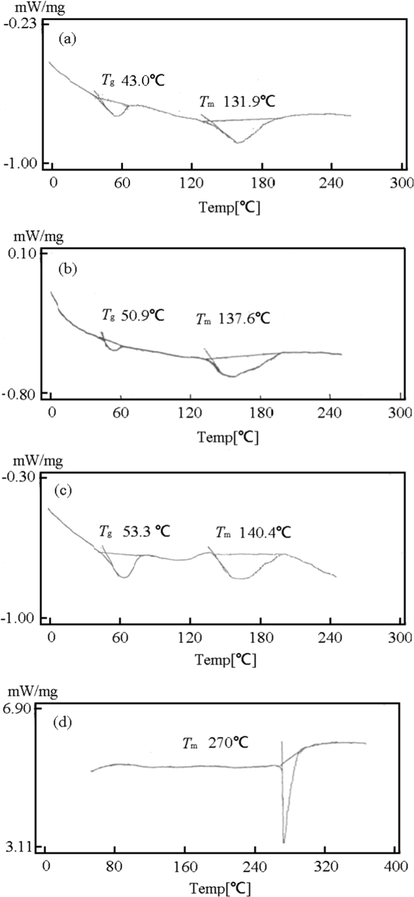
DSC plots of the of (a) Y(hex-ala)3·H2O; (b) Y(oct-ala)3·0.5H2O; (c) Y(dod-ala)3·0.5H2O; (d) Y(octnt)3·2H2O.
The glass transition temperature of Y(oct-ala)3·H2O is 50 °C, while for Y(dod-ala)3·0.5H2O, the temperature is 55 °C. Polarization microscopy results of the Y(octnt)3 complex, the Y(octnt)3 solid state material obtained after evaporation of the solvents, to name a few, benzene, toluene, and ethanol, from the concentrated solution, showed a crystalline endothermic peak at around 107 °C, indicating an anisotropic nature of the surfactant. When the temperature is higher than the glass transition temperature, the complex changed from the hard glass state to the rubber state. Table 4 shows the melting temperature (Tm) and the glass transition temperature (Tg) of the metal organic complexes. As shown in the table, the glass transition temperature of the complex with the number of water molecule of 0.5–1.0 appeared in a range of 43–55 °C.
Metal complexes, Metal soap
Tg/ °C
Tm/ °C
ΔHfus/kJ mol−1
Y(hex-ala)3·H2O
43.0
131.9
3.1 + 13.5
Y(oct-ala)3·0·.5H2O
50.9
137.6
3.3 + 17.5
Y(dod-ala)3·0·.5H2O
53.3
140.4
5.6 + 18.8
Y(octnt)3·2H2O
–
270.0
47.6
At molecular level, the glass transition point of the organic rare earth complexes is the critical state of the “start” or “cease” point of the chain segment motions of the complex molecules. When undergoing glass transition, many physical properties of the organic rare earth complexed change abruptly, which can be used to determine their Tg. The molecular structure of organic rare earth complexes affects the glass transition temperature Tg and the crystallization melting point Tm in a similar manner. Both intermolecular force and chain flexibility influence the Tg and Tm in the same way. Therefore, for the organic rare earth complexes with similar structures, there tends to be a similar relationship between Tg and Tm. The ratio of Tg / Tm of the rare earth complexes in our study is between 3.0 and 4.0.
Comparing the fusion enthalpy (ΔHm), the energy required for the molecular chain or segment to leave the lattice, of complexes with different polar groups, we obtained: ΔHm(Y(hex-ala)3·H2O) < ΔHm(Y(oct-ala)3·0.5H2O) < ΔHm(Y(dod-ala)3·0.5H2O) < ΔHm(Y(octnt)3·2H2O). The magnitude of fusion enthalpy is related to the magnitude of the intermolecular force. The greater the intermolecular force is, the greater the ΔHm is, and the better the crystallization ability of rare earth complexes is. It shows that the difference of crystallization ability correlated to the structure of rare earth organic complexes.
Fig. 3 shows the surface morphology of the glass state of yttrium Complex using polarized light microscope. The images illustrate that the glassy material is uniform, transparent, and does not have color. The morphology of the glassy complex is similar to the morphology inorganic glass. Through the observation of the surface morphology of the complex, we can get the information of the glass state structure.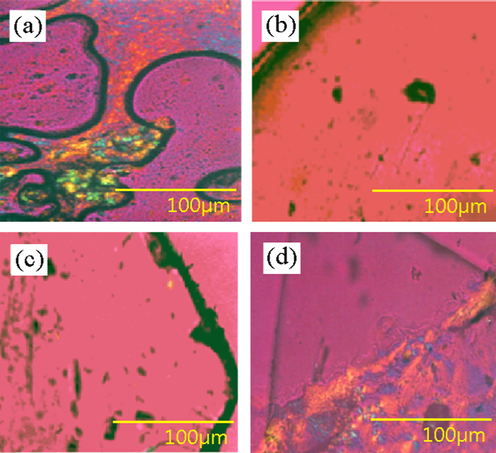
Polarized light microscopy images of the complexes: (a) crystalline Y(oct-ala)3·2H2O; (b) glassy Y(oct-ala)3·0.5H2O; (c) glassy Y(hex-ala)3·0.5H2O; (d) crystalline Y(dod-ala)3·0.5H2O.
Fig. 4 presents the TG-DTA curve of lanthanum complexes, among which TGA is the curve of thermal gravimetric analysis, and DTA the endothermic curve of the complex. Fig. 4 shows that the TGA curve of the Lanthanum complex has a significant weight loss step, and that the weight loss can determine the molar mass of the complex lost water. The decrease corresponds to 2.0, 0.5 and 0.5 mol water per mol of the metal complex for the 2.0, 0.5 and 0.5 hydrate complexes, respectively.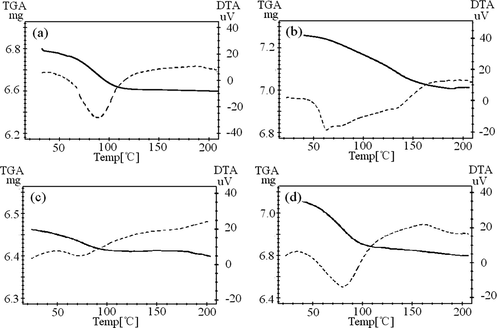
TG-DTA measurements of the complex (a) crystalline Y(oct-ala)3∙2H2O, (b) glassy Y(oct-ala)3·0.5H2O, (c) glassy Y(hex-ala)3·0.5H2O, (d) crystalline Y(dod-ala)3·0.5H2O.
3.4 Wide angle X-ray diffraction and small angle X-ray scattering analysis of the solid state complexes
To examine the periodic long-range (or short-range) ordered (or disordered) crystallization (or amorphorization) and the structures of the complexes, we conducted the WAXD and SAXS analyses. The d-spacing was estimated from the 2θ obtained from the measurement. The WAXD patterns showed that a broad peak appeared only at about 2θ = 21° in the Y monohydrated and 0.5 hydrated complexes in glass state. The appearance of this broad peak indicates the interaction between the methylene chains of the Y complexes. As shown in Fig. 5, for a crystalline Y complex, many other peaks appeared. The interaction of methylene chain entanglement affects the formation of glass state Y complex. For the crystalline Y complex, the SAXS results showed a sharp peak based on the Bragg reflection and an amorphous diffraction wide peak. The sharp peak, a characteristic of the crystal state, was not observed for the complexes in glass state.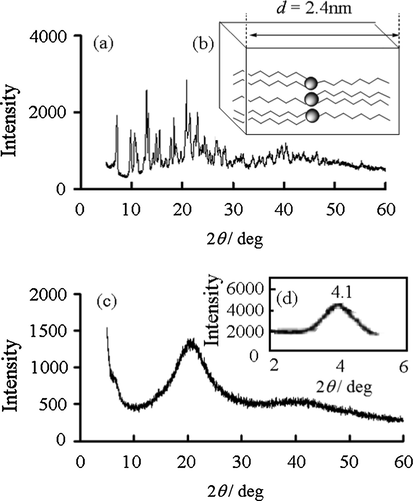
XRD patterns for (a) crystalline Y(oct-ala)3·2H2O; (b) an expected model of the crystalline state of Y(oct-ala)3; (c) glassy Y(oct-ala)3·0.5H2O and (d) SAXS patterns for glassy Y(oct-ala)3·0.5H2O.
As shown in Fig. 6, based on the molecular model, the d-spacing estimated for each lattice in the Y complex crystal structure is 2.2 nm for Y (hex-ala)3·H2O, 2.7 nm for Y(oct-ala)3·0.5H2O, and 3.8 nm for Y(dod-ala)3·0.5H2O. The d-spacing of the glass state obtained from SAXS is 1.9 nm for Y(hex-ala)3·H2O, 2.2 nm for Y(oct-ala)3·0.5H2O, and 3.3 nm for Y(dod-ala)3·0.5H2O containing polar groups. The results suggests that the Y(dod-ala)3·0.5H2O appeared as a glassy complex, as shown in Table 5. Comparing the results of Y(octnt)3 and Y(oct-ala)3 in Table 5, we discovered that Y(oct-ala)3 complexes with larger polarity have broad peaks on the wide-angle side. Peaks in the small angle range having the d-spacing of 2.2 nm, 2.5 nm, and 2.4 nm correspond to the glass Y(oct-ala)3, crystal Y(octnt)3, and crystalline Y(oct-ala)3, respectively. This is because the glass has a denser structure, so the d-spacing estimated are smaller. Incorporating the lipoaminic acids made it easier for the Y complexes to form glasses. Comparing the diffraction patterns of Y(hex-ala)3, Y(oct-ala)3, and Y(dod-ala)3, we found that the amorphous broad diffraction peaks of Y(hex-ala)3 complex with the shortest alkyl chain appeared on the wide-angle side. The shorter the alkyl chain, the denser the structure of the glass is.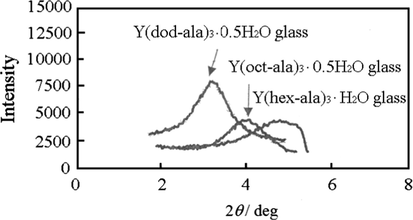
SAXS patterns of Y complexes.
Metal complexes, Metal soap
2θ/ ◦
d/nm
Y(hex-ala)3·H2O (glass)
4.7
1.9
Y(oct-ala)3·0.5H2O (glass)
4.1
2.2
Y(oct-ala)3·2H2O (crystalline)
3.7
2.4
Y(dod-ala)3·0.5H2O (glass)
4.2
3.3
Y(dod-DL-ala)3·2H2O (crystalline)
2.1
4.2
Y(octnt)3·2H2O (crystalline)
3.7
2.4
3.5 1H NMR self-diffusion coefficient of Y complexes in methanol or chloroform system and measurement of methanol relaxation time of Y(oct-ala)3 complex
Fig. 7 shows the diffusion coefficient D versus concentration plots of Y(hex-ala)3·H2O, Y(oct-ala)3·0.5H2O, Y(dod-ala)3·0.5H2O in methanol and chloroform. The diffusion coefficients of the three Y complexes in methanol showed the same trend as a function of concentration. The diffusion coefficients decreased to a small extent as the concentration increased. The self-diffusion coefficient D0 of each complex was obtained by extrapolating (Naren et al., 2019; Yan et al., 2006; Liu et al., 2017) linearly the diffusion coefficient versus concentration curves to infinite dilution. The results show that for these three Y complexes, the D0 is in a range of 4.3 ∼ 5.0 × 10⁻¹⁰ [m2 s -1]. Therefore, in infinite dilution, the stokes radius is obtained knowing that the methanol viscosity η0 is 0.57 × 10⁻³ [Pa s]. The stokes radius obtained for Y(oct-ala)3 is 0.9 nm; Y(hex-ala)3 is 0.9 nm; and Y(dod-ala)3 is 1 nm. The Stokes radii of these three rare earth complexes are all close to 1 nm.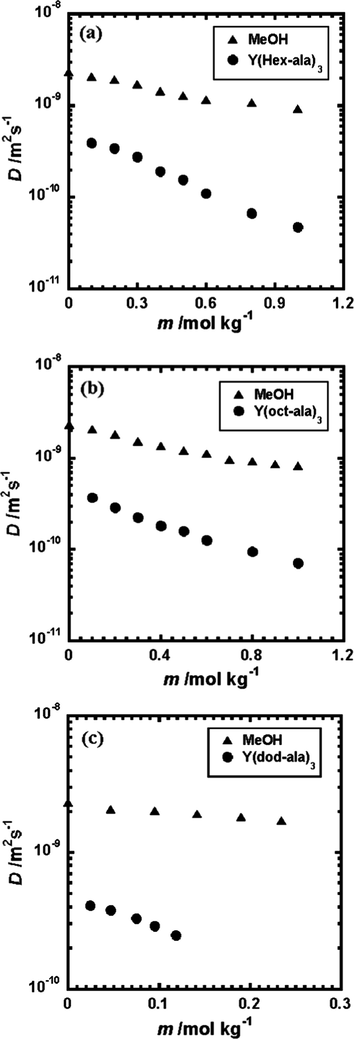
Diffusion coefficient of the Y complex and the methanol solvent, respectively, as a function of the concentration, respectively. (a) Y(hex-ala)3·H2O in methanol solvent; (b) Y(oct-ala)3·0.5H2O in methanol solvent; (c) Y(dod-ala)3·0.5H2O in methanol solvent.
Fig. 8 shows the diffusion coefficients of the Y complexes and the solvent, chloroform, versus concentration plots. It is known that these three Y complexes have almost the same solubility and viscosity in both chloroform (Fig. 8) and methanol (Fig. 7), but unlike in methanol, the diffusion coefficient of the Y complexes decreased dramatically in chloroform, and significant aggregations were observed. In chloroform, these Y complexes started to aggregate at low concentrations. The critical aggregation concentrations of the Y complexes in chloroform increased in the following order: Y(dod-ala)3·0.5H2O < Y(hex-ala)3·H2O < Y(oct-ala)3·0.5H2O. The critical aggregation concentration of Y(hex-ala)3·H2O, even with a shorter alkyl chain compared to Y(oct-ala)3·0.5H2O, is smaller than that of the Y(oct-ala)3·0.5H2O. This could be ascribed to the different degree of hydration of these two complexes.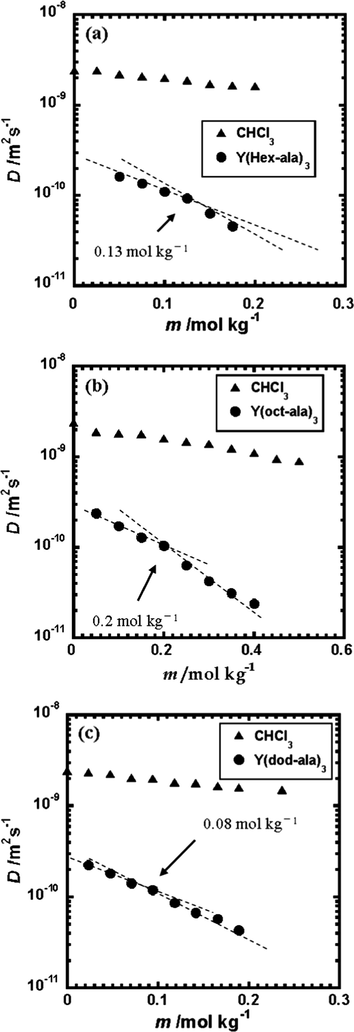
Plots of the Diffusion coefficient of the Yttrium complexes as a function of solute concentration at 25 ± 1 °C (a) Y(hex-ala)3·H2O in chloroform; (b) Y(oct-ala)3·0.5H2O in chloroform; (c) Y(dod-ala)3·0.5H2O in chloroform.
For the Y(oct-ala)3 methanol solution, the 2H NMR longitudinal relaxation time (R1) was obtained to investigate the aggregation of the complexes in the concentrated solution. In 1H NMR experiments, to obtain the self-diffusion coefficients, Y(oct-ala)3 methanol solutions with varied concentrations region were examined. The result of longitudinal relaxation time measurement were combined. Fig. 9 shows the concentration dependence of the longitudinal relaxation rate of the complexes. The relaxation rate of the Y(oct-ala)3 complex increased by 0.7 mol kg−1 as the concentration increased from 0 to 0.7 mol kg−1. In low concentration range, the dissociation of rare earth solution resulted in the formation of metal ions and ligand ions. As the Y complex concentration increases, dissociation became smaller and the complexes tended to aggregate. Micelles formed. In methanol, the complexes did not aggregate at low concentrations but aggregated at high concentrations. In other words, the yttrium complexes changed from a highly concentrated solution to complex aggregates and aggregates shrunk gradually and formed varied sized aggregates. A stable glassy complex was obtained after further heating and cooling.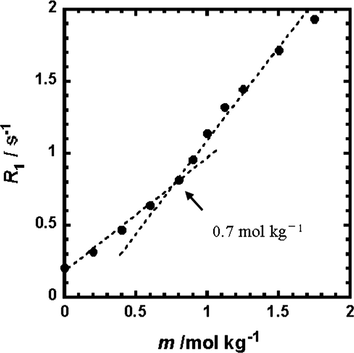
2H-relaxation rates of MeOH‑d4 as a function of the Y(oct-ala)3·0.5H2O concentration.
3.6 Dissociation of metal complexes in solution and the test of vapor pressure drop
The apparent molecular weight and aggregation number of the glassy complexes, prepared by the heating and cooling process, were determined using vapor pressure osmometry (VPO). The results of the self-diffusion coefficients of the complexes show that Y(hex-ala)3·H2O, Y(oct-ala)3·0.5H2O, and Y(dod-ala)3·0.5H2O complexes are high rendezvous aggregations in chloroform. In our study, to determine the dissociation aggregation of complexes in solution, the VPO tests in the chloroform system was conducted. The VPO results revealed the relationship of the mass concentration dependent vapor pressure lowering (ΔT) for yttrium complexes. The VPO measurement in the methanol solution was 0.4 mol/kg. At low concentrations of methanol solution, the complexes did not form a low molecular weight aggregation. The complexes existed as monomers in methanol. However, as the content of rare earth complexes in the solution increased, the aggregates started to present in the high concentration region. For the rare earth complexes, the mass concentration dependence of ΔT in chloroform of has been further investigated. The number of aggregation was obtained from the following equation
where M is the molecular weight of the aggregates [g mol−1], Mw is the monomer molecular weight [g mol−1], and k pn is the slope of the ΔT [Kg−1 kg]. First, the calibration curve of Benzyl base solution was obtained. Then the ΔT versus mass concentration m' curves of the yttrium complexes in methanol were examined. To compare the aggregations in methanol and chloroform solutions, the mass concentration m' dependent ΔT curves of the yttrium complex/chloroform system were studied. Fig. 10 (a), (b), and (c) shows the vapor pressure lowering versus yttrium complex concentration in chloroform for Y(hex-ala)3·H2O, Y(oct-ala)3·0.5H2O, and Y(dod-ala)3·0.5H2O, respectively. In methanol, the aggreatin number N = 1.0 for Y(hex-ala)3N = 0.93 for Y(oct-ala)3, and N = 0.93 for Y(dod-ala)3. The N of the three complexes were either equals to or close to 1indicating that the complexes in the methanol solution exist as monomers. Compared with the methanol solutions, the aggregation number of the Y complexes in chloroform is larger. For Y(oct-ala)3·0.5H2O, Y(hex-ala)3·H2O, and Y(dod-ala)3·0.5H2O, the aggregation numbers are 4, 7, and 15, respectively. Compared to Y(oct-ala)3·0.5H2O, the aggregation number of Y(hex-ala)3·H2O, in which the alkyl chain is shorter, is larger. This is attributed to the difference in number of hydrate in these two complexes. Y(hex-ala)3·H2O is monohydrated while the hydrate number for Y(oct-ala)3·0.5H2O is 0.5. For vapor pressure lowering versus concentration curves of the chloroform solutions of the complexes, there is a turning point that the slope of the curve changed for each of the curve. For Y(hex-ala)3·H2O, the point is at the concentration of 0.13 mol/kg; for Y(oct-ala)3·0.5H2O, 0.2 mol/kg; for Y(dod-ala)3·0.5H2O, 0.08 mol/kg. The turning points observed in the VPO results are consistent with the results of the self-diffusion coefficient and the aggregation started in the low concentration region.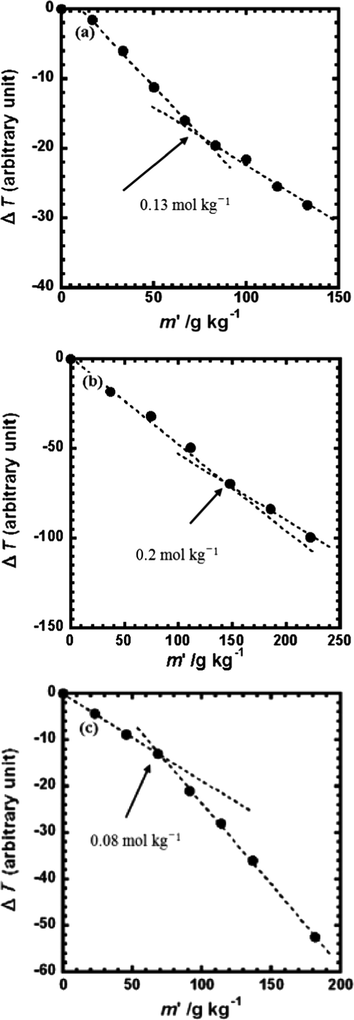
Vapor pressure lowering as a function of the yttrium complex concentration (g kg−1) in CHCl3 (a) Y(hex-ala)3·H2O; (b) Y(oct-ala)3·0.5H2O; (c) Y(dod-ala)3·0.5H2O.
3.7 FT-IR characterizations
FT IR absorption spectra of homogeneous phase of the Y complexes were obtained and the OH telescopic vibrations of the water near 3300 cm−1 were qualitatively analyzed. Fig. 11(a) and (b) show the FT IR infrared absorption spectra of Y(oct-ala)3 complexes in CHCl3. As shown in Fig. 11(a), the intensity of the vibrational absorption peaks of the Y(oct-ala)3 complexes increase as the concentration. In addition, as the concentration of the complex solution increases, the blue shift phenomenon of the absorption peak occurs. The blue shifts could be attributed to the fact that the reticular structure of the water in the reverse micelles is similar to the structure of the free water (Hua et al., 2003, 2007; Perju et al., 2015; Iida, 2002; Iida et al., 1996; Yang and Zhang, 2014; Mizuno et al., 1998). The FT IR results show that the hydration water of Y(oct-ala)3 complex mainly existed in the form of Bound water, and a small amount of the hydration water existed in the form of Bulk water, as shown in Fig. 11(b).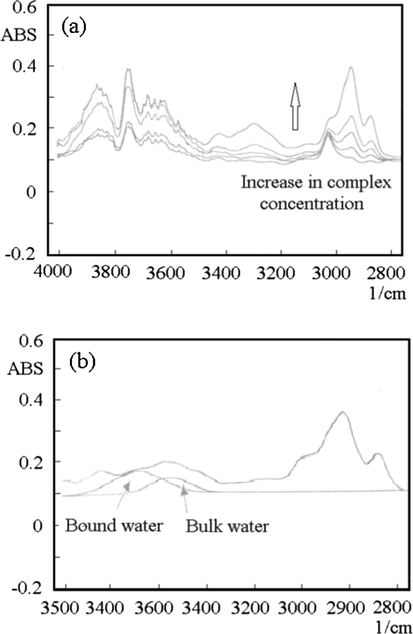
FTIR absorption spectra of (a) the yttrium complex solution in CHCl3; (b) the Bound water (3360 cm−1) and Bulk water (3350 cm−1) were obtained by the wave form separation of OH stretching band in the yttrium complex solution (W0 = 0.6, 0.1 mol kg−1).
3.8 Theoretical calculations
The structure of Rare earth yttrium organic complex, analyze the molecular electrostatic potential and 13C NMR spectra have been investigated via density functional theory (DFT) calculations (Khalid et al., 2020). The DFT calculations were performed using Gaussian 09 (Chen et al., 2010; Cairesa et al., 2017).
The 13C NMR chemical shift theoretical calculation results of acylaminocarboxylates ligands and yttrium complexes are shown in Fig. 12. The geometry optimization was computed using the optimized algorithm of Berny (Schelege et al., 1989). The peaks from MeOH solvent were not included in the calculated 13C NMR spectrum. In the spectrum, the displacement of C-spectrum in the complex appeared mainly in the 0–175 PPM field, which is consistent with the experimental results, and the chemical structure of Y complex was further determined by combining with the results of elemental analysis. Theoretical spectral results of these chemical structures are consistent with the calculation results of other kind of Rare earth organic complexes in literature (Cairesa et al., 2017).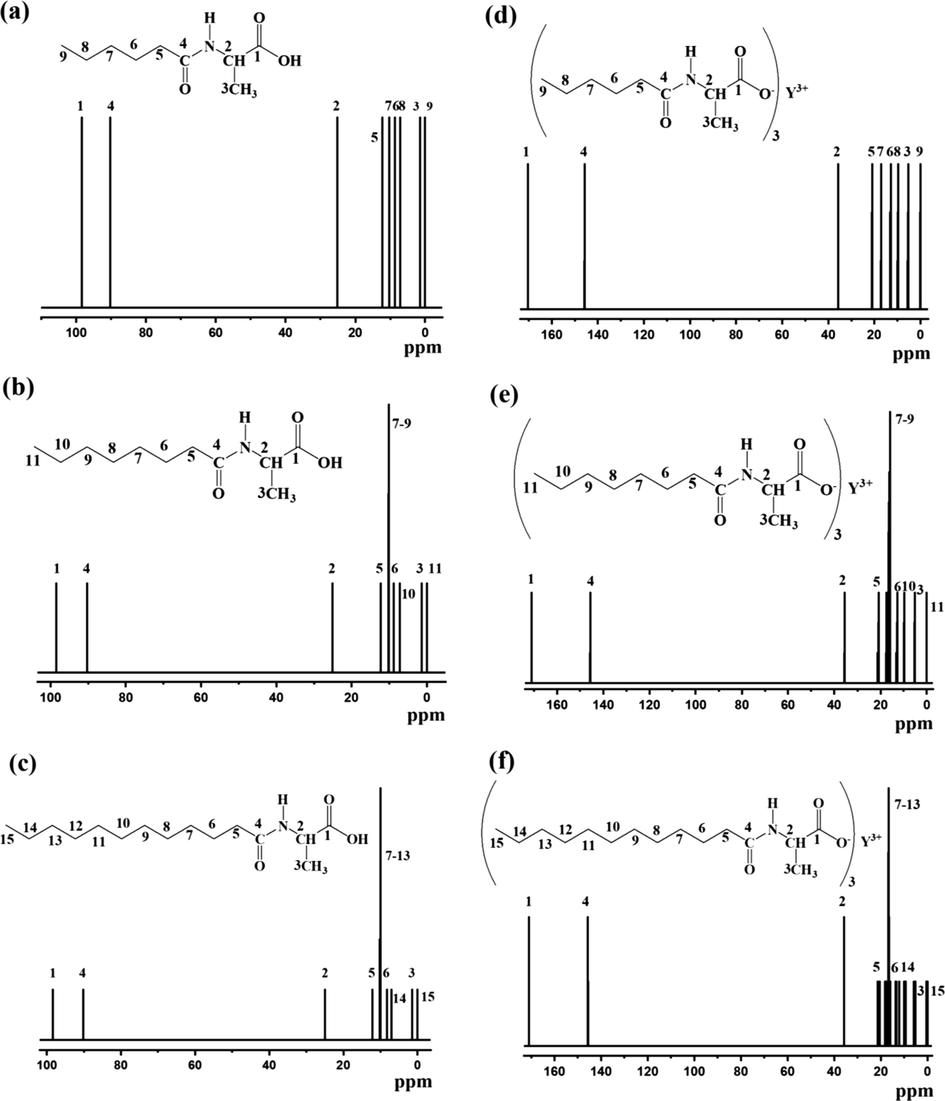
The calculated 13C NMR spectra of yttrium complexes (a) H(hex-ala); (b) H(oct-ala); (c) H(dod-ala); (d) Y(hex-ala)3; (e)Y(oct-ala)3; (f) Y(dod-ala)3.
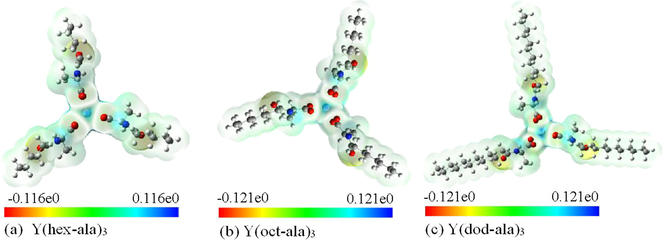
Then, the Yttrium complexes molecular electrostatic potential surface diagram (Fig. 13) were plotted using the results of the calculations. The color map of molecular surface electrostatic potential is often drawn in the study of computational chemistry. The electrostatic potential of different surface areas is displayed by different colors, which makes the distribution of electrostatic potential of molecular surface clear at a glance. The molecular electrostatic potential surface diagram (Frisch et al., 2013; Bai and Cherumuttathu, 2020) revealed that there is a positive electrostatic potential around the central atom Yttrium. In addition, the carbonyl oxygen is negative value, where electrons are easily given, for example, to form ionic bonds. Other places are relatively stable. The larger the electrostatic potential, the darker the color in the corresponding picture is.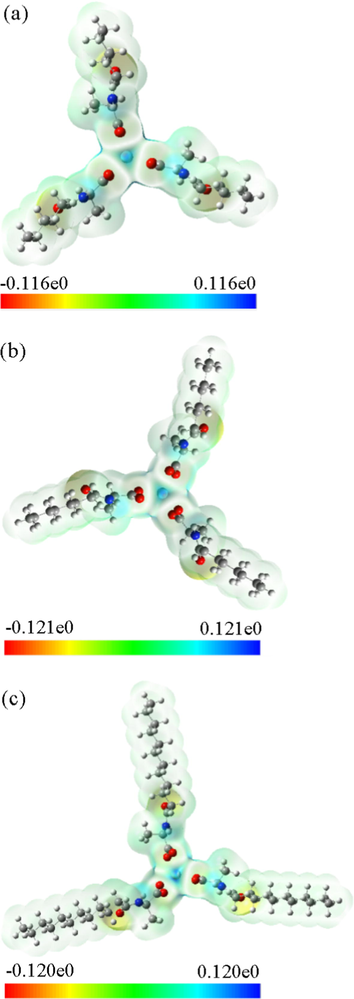
Molecular electrostatic potential surface maps of the yttrium complexes (a) Y(hex-ala)3; (b) Y(oct-ala)3; (c) Y(dod-ala)3.
Present calculations are consistent with the experimental results and could provide new insights into the development of rare earth organic complexes for highly selective reactions.
4 Conclusion
In this study, the results of the association behavior of the Y complexes in solution show that there is no aggregation for Y complexes at low concentrations in methanol. However, the significant association of the complex molecules was observed even in the low concentration region in chloroform. The Y(hex-ala)3 and Y(oct-ala)3 complexes are formed glassy materials by natural evaporation of the solvents, while for Y(dod-ala)3 complex, the glass material formed by annealing. The crystallinity of Y(octnt)3 retained even by annealing. Considering the length of the polar groups and alkyl chains of the complexes, the ease of the formation of a glassy body is in the order of Y(hex-ala)3 > Y(oct-ala)3 > Y(dod-ala)3 > Y(octnt)3.
The concentration dependent on glass state formation of Y(oct-ala)3 was investigated. The self-diffusion coefficient and the 1H NMR longitudinal relaxation time results show that the complexes in methanol aggregated at high concentrations and a stable molecular glass was formed from the highly concentrated solution through gel. A wide amorphous diffraction peak was observed at 2θ = 21° in the X-ray scattering patterns of the Y complex in the glass state and the polarization microscopy images show that the glassy materials were isotropic. The methylene chains of the triple chain surfactant are easily entangled. The interaction of methylene chains is essential for the formation of glassy bodies. However, if the alkyl chain is too long, the effect is reversed.
The results of the vapor pressure osmometry, the self-diffusion coefficient using 1H NMR, and the FTIR absorption spectra of the Y complexes with different mass molar concentrations, we discovered that the yttrium complexes in organic solvents tended to aggregate and form aggregates. This is attributable to the hydrophilic-hydrophobic equilibrium due to coexistence of hydrophilic and hydrophobic radicals in a molecule of the yttrium complex surfactant. These materials can be applied in many fields such as medicine in the future.
Acknowledgement
Project supported by the National Science Foundation of China (Grant Nos. 21663018, 51662034), the Natural Science fund Project of Inner Mongolia (Grant Nos. 2018MS02011).
Declaration of Competing Interest
The authors declare that they have no known competing financial interests or personal relationships that could have appeared to influence the work reported in this paper.
References
- Solubility and aggregation behavior of capryloyl alaninate magnesium(II), calcium(II) and zine(II) complexes. Fine Chem.. 2015;32(7):741.
- [Google Scholar]
- Optical properties and aggregation behavior of environmentally friendly Lanthanum(III) acyl-alaninnate complexes. Arabian J. Chem.. 2020;13(6):5864.
- [Google Scholar]
- Aggregation of bis (N-octanoylaminocarboxylato) magnesium (II) complexes in water/organic solvents. Colloids Surfaces A Physicochem. Eng. Asp.. 2011;392(1):213.
- [Google Scholar]
- Aggregation in methanol and formation of molecular glasses for europium(III) N-acylaminocarboxylates: effects of alkyl chain length and head group. Dalt. Trans.. 2009;5512
- [Google Scholar]
- Formation of molecular glasses of (N-acylalaninato) europium (III) complexes and the luminescence properties. J. Alloys Compd.. 2006;408:1022.
- [Google Scholar]
- Hirao, K., Hiroyuki, N., Tanaka, K., 2003. Amorphous materials for photonics. SHOKABO Co., Ltd.
- Organic materials for electronic and optoelectronic devices. J. Mater. Chem.. 2000;10:1.
- [Google Scholar]
- Complexation and molecular modeling studies of europium(III)-gallic acid-amino acid complexes. J. Inorg. Biochem.. 2016;157:33.
- [Google Scholar]
- Water-soluble oxoglaucine-Y(III), Dy(III)complexes: in vitro and in vivo anticancer activities by triggering DNA damage, leading to S phase arrest and apoptosis. Dalton Trans.. 2015;44(25):11409.
- [Google Scholar]
- Antitumor and anti- Mycobacterium tuberculosis agents based on cationic ruthenium complexes with amino acids. Inorg. Chim. Acta.. 2017;463:1.
- [Google Scholar]
- Naphthoquinone amino acid derivatives, synthesis and biological activity as proteasome inhibitors. J. Enzym. Inhib. Med. Ch.. 2017;32(1):865.
- [Google Scholar]
- DNA as a target for anticancer compounds: methods to determine the mode of binding and the mechanism of action. Curr. Opin. Biotech.. 2007;18(6):497.
- [Google Scholar]
- Synthesis, characterization, and antitumor activity of rare earth metal complexes of benzoic acid nitrogen mustard. Med. Chem. Res.. 2013;22(6):2862.
- [Google Scholar]
- Formation of molecular glasses and the aggregation in solutions for lanthanum (III), calcium (II), and yttrium (III) complexes of octanoyl-DL-alaninate. Dalt Trans. 2008 1698
- [Google Scholar]
- Effect of moisture content on the diverse structure state of the octanoyl alanine metal(Mg, Ca) complexes. Solid State phenom.. 2019;288:1.
- [Google Scholar]
- review on theoretical calculation of diffusion coefficients in non-electrolytic solutions. CIESC J.. 2006;57(10):2263.
- [Google Scholar]
- Binary diffusion coefficients and non-premixed flames extinction of long-chain alkanes. Proc. Combus. Inst.. 2017;36(1):1523.
- [Google Scholar]
- Effects of metal-counterion interactions on the percolation in microemulsions composed of bis(N-octylethylenediamine)metal(II) complexes in water/benzene and water/chloroform systems. Colloids Surf., A.. 2003;221:119.
- [Google Scholar]
- Semiflexible thermotropic polyazomethines based on o-dianisidine mesogenic core. Liq. Cryst.. 2015;42(9):1309.
- [Google Scholar]
- Aggregation behavior of alkylethylenediamine palladium(II) complexes in water and in water/organic solvent mixtures. Colloids Surf., A.. 2007;301:189.
- [Google Scholar]
- Aggregations of metal complex surfactants in solutions. Curr. Top Collo Interf. Sci.. 2002;5:203.
- [Google Scholar]
- Multinuclear NMR Studies on Micellar Formation of Aqueous [Co (N-octyl-or N-dodecylethylenediamine)(3, 7-Diazanonane-1, 9-diamine)]3+ Solutions. Bull. Chem. Soc. Jpn.. 1996;69:3217.
- [Google Scholar]
- Analysis of global rare earth production and consumption structure. Chin. Rare Earths.. 2014;35(1):100.
- [Google Scholar]
- Effects of tripositive cobalt (III)-complex ions on the structure of a cholesteric mesophase composed of potassium N-dodecanoyl-L-alaninate. Langmuir. 1998;14:7058.
- [Google Scholar]
- Khalid, K., Silvia, A.B., Yusuf, S., Hakima, E., Smaail, R., Marilena, F., My ElAF, Yann, G., M’hammed, A., 2020. Synthesis, X-ray structure, vibrational spectroscopy, DFT, biological evaluation and molecular docking studies of (E)- N’ -(4-(dimethylamino)benzylidene)-5-methyl-1H -pyrazole-3-carbohydrazide. J. Mol. Struct. 2020; 1219(5): 128541.
- DFT calculations on hydrogen-bonded complexes formed between guanine and acrylamide. J. Solution Chem.. 2010;39(9):1341.
- [Google Scholar]
- Thermoanalytical, spectroscopic and DFT studies of heavy trivalent lanthanides and yttrium (III) with oxamate as ligand. Mater. Res.. 2017;20(4):937.
- [Google Scholar]
- Some practical suggestions for optimizing geometries and locating transition states. In: Bertrán J., Csizmadia I.G., eds. New Theoretical Concepts for Understanding Organic Reactions. Dordrecht: Springer; 1989. p. :33.
- [Google Scholar]
- Frisch, M.J., Trucks, G.W., Schlegel, H.B., Scuseria, G.E., Robb, M.A., Cheeseman, J.R., et al., 2013. Gaussian, Inc.
- Absorption and emission properties of 5-phenyl tris (8-hydroxyquinolinato) M(III) complexes (M = Al, Ga, In) and correlations with molecular electrostatic potential. J. Comp. Chem.. 2020;41(16):1497.
- [Google Scholar]


