

Translate this page into:
Successful spectrofluorometric and chemiluminescence methods for the estimation of azathioprine as an immunosuppressive drug in pharmaceutical preparation
⁎Corresponding authors. almohry@kku.edu.sa (Albandary Mohammad Almahri), m.jabli@mu.edu.sa (Mahjoub Jabli)
-
Received: ,
Accepted: ,
This article was originally published by Elsevier and was migrated to Scientific Scholar after the change of Publisher.
Peer review under responsibility of King Saud University.
Abstract
The determination of azathioprine (AZA), a mercaptopurine derivative, has attracted a particular attention in most researches. Herein, spectrofluorometric (I) and chemiluminescence (II) methods were successfully confirmed to estimate azathioprine (AZA) in bulk powder form and pharmaceutical preparation. The optimum conditions to improve the fluorescence and chemiluminescence intensity of AZA were investigated. The method (I) measured the native fluorescence intensity of AZA in methanol as solvent, without any addition. The micelle-enhanced fluorescence of AZA was affected by the surfactant addition, type of solvent, pH value, and the volume of sodium dodecyl sulfate (SDS). The method (II) consisted in the improvement of the weak signal of calcein–KMnO4 chemiluminescence system by introducing synthesized silver nanoparticles (AgNPs) in the presence of AZA. The analytical curves were linear in the concentrations range 5.0 × 10⁻⁸ − 1.0 × 10⁻⁴ M and 5.0 × 10⁻⁹ − 2.0 × 10⁻³ M with a detection limit equal to 1.5 × 10⁻⁹ M and 2.6 × 10 −10 M for techniques (I) and (II), respectively. The statistical analysis indicated no significant difference between the proposed and reported methods. The suggested techniques were successfully used to determine azathioprine in its tablet form and were validated according to ICH guidelines.
Keywords
Spectrofluorometric
Chemiluminescence
Azathioprine
Sodium dodecyl sulfate
Silver nanoparticles

1 Introduction
Azathioprine is chemically identified as (6-[(1-methyl-4-nitro-1H-imidazol-5-yl) sulfanyl]-7H-purine. It is a crystalline solid mercaptopurine derivative form. It suppresses T-lymphocyte borne late immune responses. It was principally used to prevent the rejection of transplants (Newton et al., 1982). Azathioprine was studied to treat chronic active hepatitis, rheumatoid arthritis, organ transplantation, and systemic lupus erythematous (Nielsen et al., 2001). It was also used to treat leukemia and skin cancer (Elion and Hitchings, 1975). Azathioprine is sparingly soluble in water and in aqueous solutions. It is soluble in organic solvents including dimethyl sulfoxide (DMSO) and methanol (Newton et al., 1982).
The determination of azathioprine was the subject of many investigations (Fazio et al., 2007; Mei et al., 2017; Shahrokhian and Ghalkhani, 2010; De Nicolò et al., 2014). Following the literature review, azathioprine could be determined either in its pharmaceutical formulation or in biological fluids using different analytical methods; spectrophotometry (Bhaskar et al., 2010; Ramachandra and Naidu, 2016); chemiluminescence (Wang et al., 2012); high performance liquid chromatography (Weller et al., 1995; Boulieu et al., 1993), electrophoresis (Shafaati and Clark, 2000), voltammetry (Asadian et al., 2016); 1H NMR (Goger et al., 1999), and spectrofluorimetry (Gajewska et al., 1992). In this sense, many studies were carried out for the determination of azathioprine. As examples, Vais et al., developed a sensitive electrochemical sensor based on the gold hierarchical dendrites for the estimation of azathioprine (Vais et al., 2015). Asadian et al., constructed an electrochemical platform based on graphene nanosheets covered with silver nanoparticles for the determination of azathioprine (Asadian et al., 2016). Davarani et al., developed a molecular solid-phase extraction method to determine azathioprine (Davarani et al., 2017). Rezaei et al., developed a sensitive sensor for monitoring azathioprine using poly (vinyl alcohol)/chitosan nanofibers and silver nanoparticles (Rezaei et al., 2018). Recently, Miao et al., proposed a sensitive determination of azathioprine in blood lysate using a combination of liquid chromatography and mass spectrometry (Miao et al., 2020).
Indeed, both spectrofluorimetric and chemiluminescence techniques were proved to be efficient analytical techniques in the quality control of pharmaceutical formulations. They are well recognized for their highest sensitivity and simplicity, as well as their low cost compared to electrochemical and chromatographic methods (Meilin et al., 2010). Herein, our current study aims to determine azathioprine in tablets by developing simple, rapid, and highly sensitive spectrofluorimetric and chemiluminescence methods. The fluorescence response of azathioprine was evaluated with regards to the change of the surfactant, solvent, pH value, and the volume of sodium dodecyl sulfate. The chemiluminescence (CL) method has been developed based on the improvement of the weak signal of calcein–KMnO4 CL system in the presence of silver nanoparticles and azathioprine in its pure form, as well as in pharmaceutical formulation. The analytical curves and the statistical analysis were assessed.
2 Experimental
2.1 Chemicals and reagents
Pure azathioprine, cetyltrimethyl ammonium bromide, triton-X 100, sodium dodecyl sulfate, tween-80, silver nitrate, potassium borohydride, potassium ferricyanide, potassium permanganate, potassium periodate, hydrogen peroxide, and cerium(IV) sulfate were purchased from Sigma‐Aldrich, Augsburg, Germany. HPLC-grade, methanol (99.8%), ethanol (96.0%), dimethysulfoxide, acetonitrile, acetone, sodium citrate, sulfuric acid and sodium hydroxide were purchased from BDH Ltd, Poole, UK. Imuran® 50 mg/tablet (Glaxo Smith kline pharmaceutical company, British) were provided from a local pharmacy in Saudi Arabia. Different buffer solutions as borate and acetate buffer solutions were prepared using distilled water (Pesez and Bartos, 1974). The physico-chemical characteristics of azathioprine were given in Table 1.
Chemical name
Supplier
Chemical structure
Molecular weight (g/mol)
Azathioprine (C9H7N7O2S)
Sigma‐Aldrich
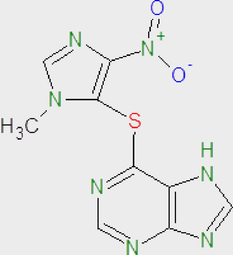
277.26
2.2 Preparation of standard and reagent solutions
A weighted amount of azathioprine (10.0 mg) was added to a volumetric flask of 100 mL. The azathioprine was dissolved in a volume of 20 mL of methanol to get a standard solution of 100 µg mL−1. The solution was then diluted with methanol to get operational drug solutions. The obtained solutions were further kept in a refrigerator which could be stable for at least a period of 4 weeks.
To synthesis silver nanoparticles solution (2.4 × 10⁻⁴ M), a volume of 10.0 mL of silver nitrate (1.0 × 10⁻³ M) was dropped in 30.0 mL of an aqueous solution of sodium borohydride (2.0 × 10⁻³ M). The mixture was continuously stirred for 20 min. After which 3.0 mL of sodium citrate solution (1.0%) was added drop wise in order to stabilize the obtained silver nanoparticles. The yellowish product was finally refrigerated at 4 °C before use (Manzoori and Lotfi, 2016).
2.3 General procedure
2.3.1 Spectrofluorimetric method (I)
Samples of standard solution of azathioprine were moved into volumetric flasks of 10 mL to get final concentrations of 5.0 × 10⁻⁸ – 1.0 × 10⁻⁴ M. To each flask, a volume of 1.5 mL of acetate buffer solution (0.2 M) of pH 4.0 was added. To this mixture, 2.0 mL of 0.02 M SDS was added and well mixed. The fluorescence intensity response (FI) was determined first at λem 390 nm and after excitation at λex295 nm. The azathioprine concentration was plotted versus FI values to reach a standard calibration graph. A linear regression equation was further computed.
2.3.2 Chemiluminescence method (II)
In this investigation, the developed flow injection chemiluminescence (FI-CL) contains three-channel manifolds by means of two pumps P1 and P2. For FI-CL system calcein–KMnO4, the pump P2 delivered KMnO4 and calcein which were mixed in the three-paths ‘‘T1′’ connector of the FIA system. However, pump P1 delivered silver nanoparticles solution which is after mixed with a solution containing the target analyte through the injection valve. Both streams were combined with the second ‘‘T2′’ connector and after enter into the flow cell in the fluorimeter. The improvement in the CL intensity happened when the silver nanoparticles solution was inserted into the carrier stream. The acquired CL signal corresponding to a blank was proportional to the azathioprine concentration. The calibration curve representing the evolution of CL intensity against the concentration of azathioprine was plotted at 7 experimental points.
2.4 Preparation of tablet sample
Twenty tablets of Imuran® (50 mg) were weighted, grounded into fine powders and well mixed. An aliquot of the tablets powders equivalent to 50 mg of azathioprine was dissolved in methanol in a 100-mL volumetric flask. The flask was sonicated for a period of 15 min and the volume was ended to the mark using methanol. The resulting solution was filtered using a filter paper and used for the experiments following the procedures described using methods I and II.
2.5 Apparatus
A Shimadzu RF-5301 luminescence spectrometer (Kyoto, Japan) was used to measure the FIs. It was equipped with a 150 W Xenon lamp, excitation, and emission monochromators. A quartz cell of 1 cm was employed. The widths for the excitation and the emission monochromators were equal to 5 nm. The data acquisition was carried out using FI Winlab software, version 4.00.03.
The schematic diagram of the developed flow-injection analysis system was shown in Fig. 1. The peristaltic pumps were used to conduct the operational solutions. Pump P1 transported the silver nanoparticles solution mixed with the analyte solution in a Rheodyne six-path injection valve using a loop. Pump P2 carried the other CL reagents. The flow rate for each line was similarly maintained. A Spex spectrofluorimeter was used to identify and record the CL intensity of the reaction. The analysis of the data was reached using a Spex DM 3000 program. The light source of the spectrofluorimeter was maintained switched off. The high voltage of the photomultiplier tube was set at a value of 950 V.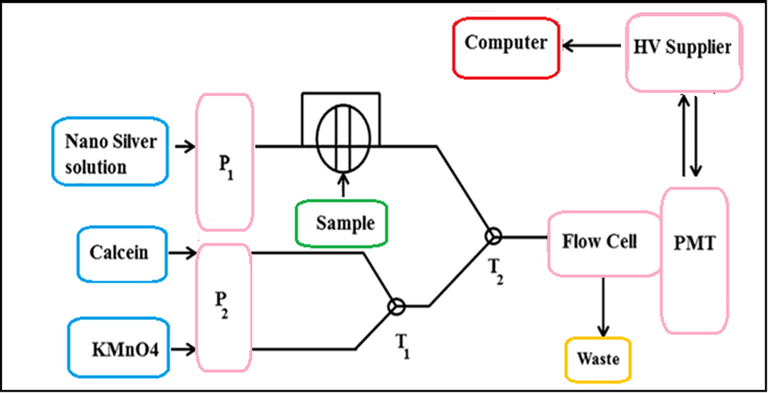
Schematic diagram of the FIA-CL manifold. P1, P2 peristaltic pumps, T1, T2 Y-pieces.
An UV–visible spectrophotometer, and a transmission electron microscopy model JEM‐1400 Plus (JEOL, USA) were used to characterize the prepared silver nanoparticles. A pH meter was used for pH measurement and adjustment. A centrifuge model Hermle Z206A (Germany) was used for the preparation of the required samples.
3 Results and discussion
3.1 Method (I): Spectral characteristics and effect of experimental conditions on the fluorescence intensity
The fluorescence spectra of azathioprine in aqueous acetate buffer (pH = 4.0) and 0.02 M SDS as a fluorescence enhancer were studied. Results were depicted in Fig. 2. Data showed clearly a significant improvement effect of micelle which could be explained by the fact that the addition of a surfactant beyond its critical micellar concentration amplified the fluorescence quantum of the fluorophores (Belal et al., 2015). Indeed, it is shown that the percentage of FI using SDS as a surfactant was about 200% compared with the initial FI of the azathioprine in acetate buffer solution.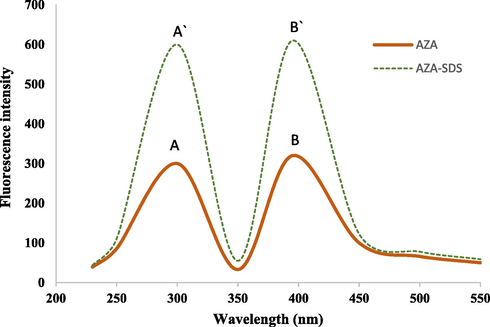
Fluorescence spectra of: (A, B) azathioprine (100 µg mL−1) in acetate buffer of pH 4.0 system and (Á, B́) Azathioprine (100 µg mL−1) in acetate buffer of pH 4.0/SDS. (A, Á) are the excitation spectra and (B, B́) are the emission spectra λex/λem 295/ 390 nm.
The fluorescence characteristics of azathioprine were checked in various micellar media; SDS, CTAB, Tween-80, Triton-X 100, and B-CD (Fig. 3). Results indicated that all the media led to an increase in the native fluorescence of azathioprine or do not reveal a significant effect on its FI. It was also observed that the SDS medium exhibited the maximum increase in the FI of AZA. Indeed, micelle binding could improve the fluorescence intensity of AZA by decreasing the electrostatic attractions and collisions between the molecules of AZA. This could be attributed to the ability of AZA to associate and bind with SDS. In the micellar phase, SDS could form an ion-paired species with AZA by the interaction between SDS negative sulfonyl group and the protonated tertiary amine group of AZA. (Ohannesian, 2002).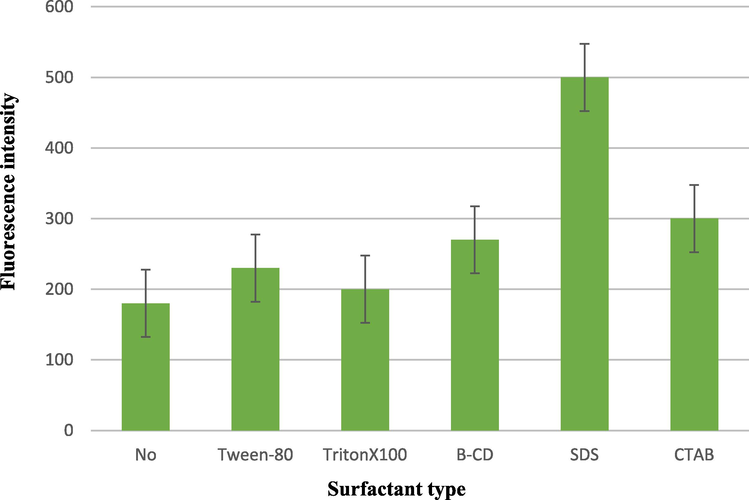
Effect of different surfactants 1.0 mL of 0.02 M solution of each on the FI of Azathioprine (100 µg mL−1).
Fig. 4 depicts the influence of 0.02 M SDS on the fluorescence intensity of azathioprine. The SDS quantity was studied in the range of 0.5 mL to 4 mL and it was seen that the increase of the volume of SDS resulted in an increase in FI values up to 2.0 mL. Beyond this value, no further increase in FI of azathioprine was observed. Hence, a volume of 2.0 mL of SDS was selected as the optimum volume.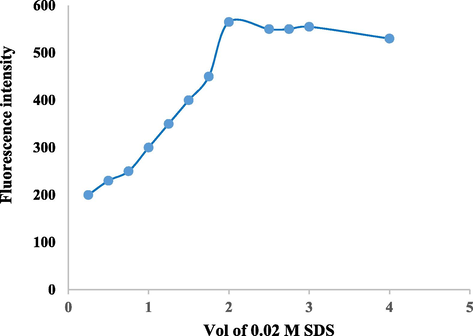
Effect of 0.02 M SDS volume on FI of azathioprine (100 µg mL−1).
The influence of pH on the micelle-enhanced fluorescence of azathioprine was given in Fig. 5. Different buffers were investigated; an acetate buffer (0.2 mol L−1) of pH = 3.5–5.6 and a borate buffer (0.2 mol L−1) of pH = 6.5–9.0. The results indicated that the maximum FI was achieved at pH 4.0. The increase of pH value above 4.0 caused a decrease in the FI value. In fact, the fluorescence intensity registered within the protonated species was higher than that for neutral species. The protonated species interacted more powerfully with the anionic micelles of SDS than the neutral form of the AZA (Alarfaj and El-Tohamy, 2013). The adequate volume of the acetate buffer, investigated in the range 0.5–3 mL, was detected using a volume of 1.5 mL of 0.2 M acetate buffer (pH 0.4).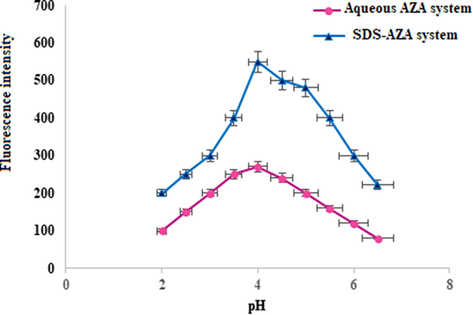
Effect of pH on FI of Azathioprine (100 µg mL−1) in the presence of 0.02 M SDS and in aqueous medium.
The influence of different diluting solvents on the FI values of azathioprine in the presence of SDS was examined using, DMSO, ethanol, methanol, acetone, acetonitrile, DMF and distilled water. As it was observed in Fig. 6, the best solvent used to reach the maximum sensitivity and due to the lower blank reading at 390 nm was methanol. This is attributed to the denaturating effect on the micelles, where short-chain alcohols (methanol) are solubilized mainly in the aqueous phase and affect the micellization process by modifying the solvent properties. A distinct and sharp decrease in FI was observed using acetonitrile or acetone. Indeed, the addition of these solvents may result in a reduction in the size of the micelles and a progressive breakdown of the surfactant aggregate at very high concentrations.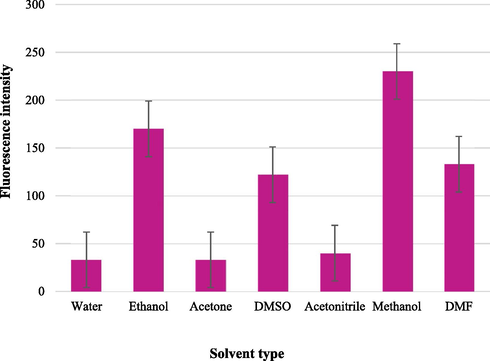
Effect of diluting solvent on the fluorescence intensity of azathioprine (100 µg mL−1).
3.2 Method (II): Characterization of the synthesized silver nanoparticles and study of the influence of the experimental parameters on CL intensity
The UV–Vis spectrum and the TEM characteristics of the synthesized silver nanoparticles were depicted in Fig. 7. The silver nanoparticles exhibited a specific absorption peak at 410 nm because of their surface plasmon resonance (Fig. 7A). The TEM images of the silver nanoparticles (Fig. 7B, C) showed spherical and hexagonal shaped particles. Their size ranged from 5 to 30 nm.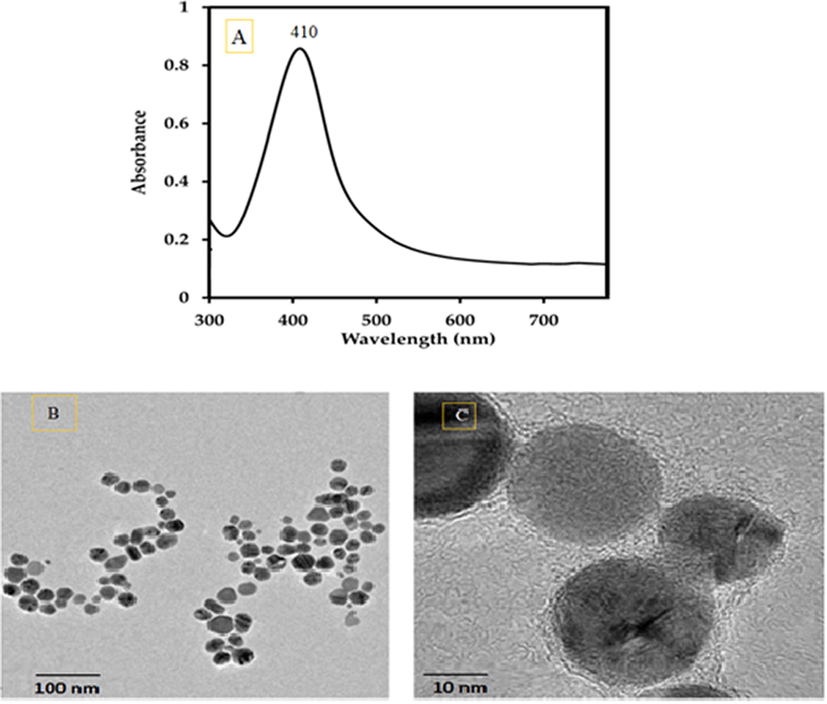
(A) Uv–Vis spectrum, (B) and (C) TEM micrographs of silver nanoparticles observed at different magnifications.
The effect of K3Fe(CN)6, KIO4, Ce(SO4)2, H2O2, and KMnO4 as oxidant agents on CL intensity was given in Fig. 8. The results indicated that the CL intensity strongly depended on the nature of the oxidant agent. Indeed, the maximum CL intensity signal was achieved using KMnO4. Consequently, calcein-KMnO4-CL system was chosen and the effect of the variation in calcein and KMnO4 concentration was investigated.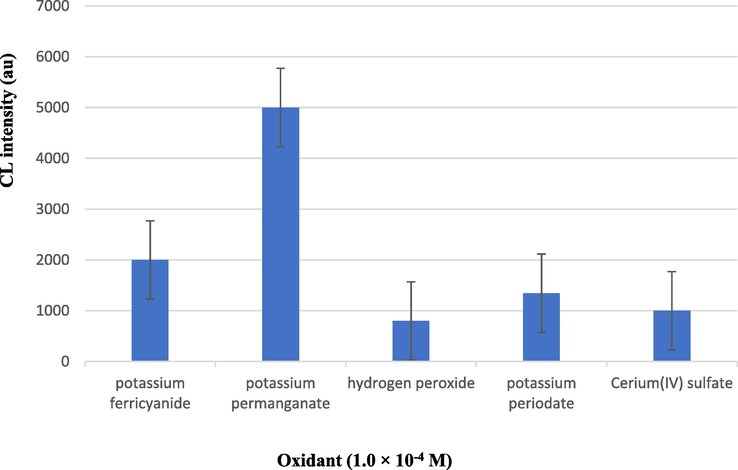
Effect of different kinds of oxidants on CL intensity.
Indeed, the effect of calcein and KMnO4 concentrations on the CL signals for the determination of AZA was considered as one of the most important factors. To reach this, various concentrations of calcein and KMnO4 were checked in the range 1.0 × 10⁻⁶ − 1.0 × 10⁻¹ M. It was shown in Fig. 9 that the CL signals sharply increased using a concentration of 1.0 × 10⁻⁴ M for both calcein and KMnO4. This concentration was selected for further essays.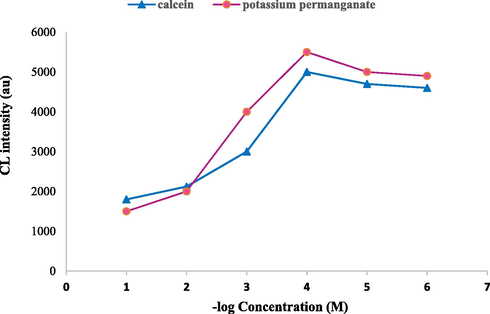
Effect of 1 × 10⁻⁴ M calcein and 1 × 10⁻⁴ M potassium permanganate concentration on CL intensity, Azathioprine (100 µg mL−1).
The concentration of NaOH in KMnO4 solution was also discussed using a concentration of azathioprine equal to 100 µg mL−1. The NaOH concentration was varied in the range 1.0 × 10⁻⁴ M to 0.1 M and its effect on the progress of CL was studied. The highest CL intensity registered for the system calcein-KMnO4-CL was observed at a concentration of NaOH equal to 1.0 × 10⁻² M.
The flow rate of reagent solution was also proved to be an important parameter affecting the CL intensity (Wabaidur et al., 2015). In this study, the flow rate was varied in the range 1.0–5.0 mL min−1 with equal flows in each channel. The results indicated that the maximum CL intensity was reached when the flow was equal to 2.0 mL min−1 . This behavior might due to the decrease of dispersion. Any further increase in the flow rate does not affect the CL signal.
The effect of silver nanoparticles concentration and volume on the CL intensity of calcein–KMnO4 was investigated in the ranges of 1.0 × 10⁻⁵ M to 1.0 × 10⁻³ M and 0.25–5.0 mL. The concentration of AZA, calcein and KMnO4 were maintained constant at 1.0 × 10⁻⁴ M for all the experiments. The results showed that the appropriate concentration and volume of AgNPs necessary to reach the highest value of CL intensity signal were equal to 1 × 10⁻⁴ M and 1 mL. Above these values, the CL intensity was not affected by the increase in the AgNPs concentration and volume.
The CL intensity of calcein–KMnO4 system in the absence and in the presence of AZA was carried out using an emission monochromator. The results showed that the weak CL intensity of the system calcein–KMnO4 was significantly improved in the presence of AZA. It was proportional to the concentration of AZA added to the system. Furthermore, the addition of silver nanoparticles into the reaction leads to a further increase in the CL intensity (Fig. 10). AgNPs were capable of enhancing the intensity of the CL reaction of calcein-KMnO4 in alkaline medium. The light emitters excited calcein molecules which were generated through the energy transferring of calcein–KMnO4 reaction to unreacted calcein molecules. It was also reported that AZA–calcein–KMnO4 CL system could be further improved by the addition of AgNPs into the CL system. Based on this phenomenon, CL methods were developed for the determination of AZA.![CL spectra for the quantitative analysis of AZA; (A) calcein– KMnO4 system, (B) calcein–KMnO4–AZA system, and (C) calcein– KMnO4–AZA–AgNPs system; conditions: [AZA] = 100 µg mL−1, [calcein] = 1.0 × 10⁻⁴ M, [KMnO4] = 1.0 × 10⁻⁴ M, [NaOH] = 1.0 × 10⁻² M, silver nanoparticles volume = 1 mL.](/content/184/2020/13/12/img/10.1016_j.arabjc.2020.10.001-fig10.png)
CL spectra for the quantitative analysis of AZA; (A) calcein– KMnO4 system, (B) calcein–KMnO4–AZA system, and (C) calcein– KMnO4–AZA–AgNPs system; conditions: [AZA] = 100 µg mL−1, [calcein] = 1.0 × 10⁻⁴ M, [KMnO4] = 1.0 × 10⁻⁴ M, [NaOH] = 1.0 × 10⁻² M, silver nanoparticles volume = 1 mL.
3.3 Analytical features of the studied methods
The above studied methods were confirmed according to ICH Q2 guidelines (ICH, 1996). The calibration plots for the determination of AZA using FL and CL detection methods were realized using standard drug solutions of AZA under the optimum registered conditions. In method (I), the graph representing the variation of the FI against the AZA concentration was plotted at seven experimental points. Based on the data summarized in Table 2, the calibration graph was linear in the concentration range of 5.0 × 10⁻⁸ to 1.0 × 10⁻⁴ M. The correlation coefficient was equal to 0.9998 and the %RSD = 0.84. In method (II), the calibration graph of the CL signal was also plotted using seven experimental points. It was linear in the concentration range of 5.0 × 10⁻⁹ to 2.0 × 10⁻³ M. The correlation coefficient was determined to be 0.9999 and the %RSD was equal to 1.20.
Parameter
Method I
Method II
Linear range, M
5.0 × 10⁻⁸ –1.0 × 10⁻⁴
5.0 × 10⁻⁹ –2.0 × 10⁻³
Detection limit, M
1.5 × 10⁻⁹
2.6 × 10 −10
Quantification limit, M
5.0 × 10⁻⁸
5.0 × 10⁻⁹
Correlation coefficient, r
0.9998
0.9999
% RSD (n = 7)
0.84
1.20
The limit of detection was evaluated using the signal-to-noise ratio. It was detected by the lower limit of detection S/N = 3. The limit of quantitation was determined using signal-to-noise ratio equal to 10. The evaluation of quantification limit was N = 10 σ/S. The limit of detection values registered within the studied methods were 1.5 × 10⁻⁹ M and 2.6 × 10⁻¹⁰ M for method (I) and method (II), respectively. Whereas the limit of quantitation values were equal to 5.0 × 10⁻⁸ M and 5.0 × 10⁻⁹ M for method (I) and method (II), respectively (Table 2).
Three concentrations of AZA standard solutions were analyzed using methods (I) and (II). The mean percentage recoveries obtained were 99.53 ± 0.84% and 99.24 ± 1.20% for methods (I) and (II), respectively (Table 3). The calculated %RSD values were 0.90 and 1.17 for methods (I) and (II), respectively. The %RSD values were < 2%, indicating therefore a good precision.
Method I
Method II
Taken (Log Cocn, M)
Found (Log Cocn, M)
%Recovery
Taken (Log Cocn, M)
Found (Log Cocn, M)
% Recovery
7.3
7.31
100.37
8.3
8.24
99.27
7
6.95
99.28
8
7.99
99.87
6.3
6.27
99.52
7
6.84
97.71
6
5.91
98.5
6
5.85
97.5
5.3
5.25
99.05
5
4.97
99.40
5
4.95
99
4
40.05
101.25
4
4.05
101.25
3
2.99
99.66
Mean ± SD
99.53 ± 0.84
99.24 ± 1.19
%RSD
0.84
1.20
3.4 Analytical application
The methods (I) and (II) were applied for the determination AZA in its pharmaceutical dosage form Imuran® 50 mg/tablet. The results were summarized in Table 4. The statistical analysis (Miller and Miller, 1993) indicated similarity between the proposed and reported methods with regard to the accuracy and precision. In fact, the method to be compared with consisted in a flow injection chemiluminescence based on the estimattion of a weak chemiluminescent reaction of cerium(IV) with the presence of azathioprine in acidic suspension. It was emproved by the addition of rhodamine 6G in bulk, human fluid and in pharmaceutical formulations. The CL intensity was linearly related to the concentration of AZA in the range of 1.0 × 10⁻⁷- 1 × 10⁻⁵ M and the detection limit was 4.5 × 10⁻⁸ M (Wang et al., 2012).
Method
Sample
n
Linear range (M)
Mean ± SD
Variance
%RSD
%SE
F-test
t-test
I
Pure Imuran® 50 mg/tablet
7
75.0 × 10⁻⁸–1.0 × 10⁻⁴
5.0 × 10⁻⁸ –1.0 × 10⁻⁴
99.53 ± 0.84
99.43 ± 0.71
0.70
0.500.84
0.710.31
0.261.94(4.39)*
1.38(4.39)*
0.78(2.20)*
0.59(2.20)*
II
Pure Imuran® 50 mg/tablet
7
75.0 × 10⁻⁹ –2.0 × 10⁻³
5.0 × 10⁻⁹ – 2.0 × 10⁻³
99.24 ± 1.20
99.31 ± 1.12
1.44
1.251.20
1.120.45
0.424(4.39)*
3.47(4.39)*
0.54(2.20)*
0.19(2.20)*
Reported (Wang et al., 2012)
6
1.0 × 10⁻⁷–1 × 10⁻⁵
99.21 ± 0.63
0.36
0.36
0.15
3.5 Interference study
The specificity of the suggested methods was confirmed by detecting if there is any interference from tablet excipients which were commonly present i.e. heavy metals, some ions, lactose, starch, gelatin, amino acids, and ascorbic acid. Indeed, these excipients did not show any interference with the results of the studied methods. This was proved based on the registered acceptable percentage recoveries values of the studied concentrations. The interference study was carried out using samples containing a fixed amount of AZA equivalent to 1.0 × 10⁻⁷ M and variable concentrations of foreign substances. The obtained results of the tolerated concentrations for studying interferences were summarized in Table 5.
Interferents
Tolerable level
Method (I)
Method (II)
Fe+2, Fe+3, Cu+2, Ni+2, Mn+2
90
120
Glucose, sucrose, lactose, gelatin, starch, cysteine, histamine. Ascorbic acid
50
45
Na+, K+, Cl−, Mg+2, NO−3
100
80
4 Conclusion
In summary, two sensitive, rapid and simple spectrofluorometric and chemiluminescence methods for azathioprine determination in bulk form and pharmaceutical formulation were successfully applied. The micelle-enhanced fluorescence of azathioprine was affected by the surfactant, solvent, pH value, and the volume of sodium dodecyl sulfate. The weak signal of calcein–KMnO4 chemiluminescence system was improved in the presence of silver nanoparticles and azathioprine. The analytical curves were linear in the concentration ranges of 5.0 × 10⁻⁸ − 1.0 × 10⁻⁴ M and 5.0 × 10⁻⁹ − 2.0 × 10⁻³ M with a detection limit of 1.5 × 10⁻⁹ M and 2.6 × 10 −10 M for I and II, respectively. The studied methods displayed good validation criteria according to official guidelines. The comparison with previously reported chemiluminescence method indicated no significant difference. The proposed methods provided clinical benefits for azathioprine drug monitoring system and quality control applications.
Acknowledgment
The author would like to express their gratitude to King Khalid University, Saudi Arabia for providing administrative and technical support.
References
- Dissociation, solubility and lipophilicity of azathioprine. Int. J. Pharm.. 1982;11:209-213.
- [Google Scholar]
- The treatment of inflammatory bowel disease with 6-mercaptopurine or azathioprine. Aliment. Pharmacol. Ther.. 2001;15:1699-1708.
- [Google Scholar]
- Azathioprine, Antineoplastic and Immunosuppressive Agents. Springer; 1975. p. :404-425.
- Quantitative determination and sampling of azathioprine residues for cleaning validation in production area. J. Pharm. Biomed. Anal.. 2007;43:1495-1498.
- [Google Scholar]
- Highly sensitive electrochemical determination of azathioprine using a glassy carbon electrode modified with Au neuronal-like nanostructures. Sens. Actuators, B. 2017;240:996-1002.
- [Google Scholar]
- Glassy carbon electrodes modified with a film of nanodiamond–graphite/chitosan: application to the highly sensitive electrochemical determination of Azathioprine. Electrochim. Acta. 2010;55:3621-3627.
- [Google Scholar]
- UPLC–MS/MS method for quantification of the azathioprine metabolites 6-mercaptoguanosine and 6-methylmercaptopurine riboside in peripheral blood mononuclear cells. J. Pharm. Biomed. Anal.. 2014;98:271-278.
- [Google Scholar]
- Spectrophotometric determination of azathioprine in bulk and pharmaceutical dosage forms. Int. J. Chem. Tech. Res.. 2010;2:376-378.
- [Google Scholar]
- UV-Visible Spectrophotometric method for the determination of azathioprine. J. Pharm. Biol. Sci.. 2016;4:179-186.
- [Google Scholar]
- Direct determination of azathioprine in human fluids and pharmaceutical formulation using flow injection chemiluminescence analysis. J. Chin. Chem. Soc.. 2012;59:239-244.
- [Google Scholar]
- HPLC analysis of azathioprine metabolites in red blood cells, plasma and urine in renal transplant recipients. Int. J. Clin. Pharmacol. Ther.. 1995;33:639-645.
- [Google Scholar]
- High-performance liquid chromatographic determination of thiopurine metabolites of azathioprine in biological fluids Author links open overlay panel. J. Chromat. B: Biomed. Sci. App.. 1993;615:352-356.
- [Google Scholar]
- Determination of azathioprine and its related substances by capillary zone electrophoresis and its application to pharmaceutical dosage forms assay. Drug Dev. Ind. Pharm.. 2000;26:267-273.
- [Google Scholar]
- Voltammetric studies of Azathioprine on the surface of graphite electrode modified with graphene nano sheets decorated with Ag nanoparticles. Mater. Sci. Eng. C. 2016;58:1098-1104.
- [Google Scholar]
- Quantitative determination of azathioprine in tablets by H-1NMR spectroscopy. J. Pharm. Biomed. Anal.. 1999;21:685-689.
- [Google Scholar]
- Spectrofluorometric assay of azathioprine and 6-mercaptopurine in human blood plasma. Acta Pol. Pharm.. 1992;49(4):13-16.
- [Google Scholar]
- Green electrodeposition of gold hierarchical dendrites of pyramidal nanoparticles and determination of azathioprine. Sens. Actuators, B. 2015;215:113-118.
- [Google Scholar]
- Voltammetric studies of Azathioprine on the surface of graphite electrode modified with graphene nanosheets decorated with Ag nanoparticles. Mat. Sci. Eng. C.. 2016;58:1098-1104.
- [Google Scholar]
- Highly selective solid phase extraction and preconcentration of Azathioprine with nano-sized imprinted polymer based on multivariate optimization and its trace determination in biological and pharmaceutical samples. Mat. Sci. Eng. C.. 2017;71:572-583.
- [Google Scholar]
- In-situ decorated silver nanoparticleson electrospun poly(vinyl alcohol)/chitosan nanofibers as a plasmonic sensor for azathioprine determination, Colloids and Surfaces A: Physicochem. Eng. ASP. 2018;559:266-274.
- [Google Scholar]
- Highly sensitive and rapid determination of azathioprine metabolites in whole blood lysate by liquid chromatography–tandem mass spectrometry. J. Chromat. B.. 2020;1136:121802.
- [Google Scholar]
- A review on applications of chemiluminescence detection in food analysis. Anal. Chim. Acta. 2010;670:1-10.
- [Google Scholar]
- Colorimetric and Fluorimetric Analysis of Organic Compounds and Drugs. New York: Marcel Dekker Inc.; 1974.
- Determination of fluoxetine in pharmaceutical and biological samples based on the silver nanoparticle enhanced fluorescence of fluoxetine–terbium complex. Luminescence. 2016;31:1349-1357.
- [Google Scholar]
- Micelle-enhanced spectrofluorimetric method for determination of lacidipine in tablet form; application to content uniformity testing. Luminescence. 2015;30:805-811.
- [Google Scholar]
- Handbook of Pharmaceutical Analysis. New York, Basel, Electronic version: Marcel Dekker Inc.; 2002.
- Determination of the anti-viral drug Ribavirin in dosage forms via micelle-enhanced spectrofluorimetric method. Luminescence. 2013;28:190-194.
- [Google Scholar]
- Flow-injection chemiluminescence method for the determination of moxifloxacin in pharmaceutical tablets and human urine using silver nanoparticles sensitized calcein–KMnO4 system. Bioprocess Biosyst. Eng.. 2015;38:1803-1810.
- [Google Scholar]
- ICH technical requirements for registration of pharmaceuticals for human use, complementary guidelines on methodology Washington, DC, 1996, 13.
- Statistics for analytical chemistry (3rd ed.). Chichester: Ellis Horwood-Prentice Hall; 1993.


