

Novel HPTLC-densitometric method for concurrent quantification of linalool and thymol in essential oils
⁎Corresponding author at: Department of Pharmacognosy, College of Pharmacy, Prince Sattam Bin Abdulaziz University, Alkharj – 11942, P.O. Box 173, Saudi Arabia. m.alqarni@psau.edu.sa (Mohammad H. Alqarni)
-
Received: ,
Accepted: ,
This article was originally published by Elsevier and was migrated to Scientific Scholar after the change of Publisher.
Abstract
Monoterpenes, linalool and thymol have been widely used in not only the treatments of several diseases but also food flavouring, dental, perfumery, and toilet products. Plants of the several Lamiaceae family are good sources of linalool and thymol. A rapid, simple, and precise high-performance thin layer chromatography (HPTLC) method was developed for the concurrent estimation of linalool and thymol, and this method was orchestrated using the essential oils extracted from two Lamiaceae plants leaves i.e. O. basilicum and T. vulgaris. Two standards were separated using pre-coated thin-layer chromatography glass plates. The developed HPTLC method was validated by following ICH guidelines (linearity; limit of detection, LOD; limit of quantitation; specificity; accuracy; precision; and robustness). The calibration curves of both the compounds were linear (100–700 ng/spot), with a correlation coefficient (r2) of >999. The developed HPTLC method was effectively applied to the concurrent detection and quantification of linalool and thymol in commercial essential oils.
Keywords
HPTLC
Method development
Linalool
Thymol
Ocimum basilicum
Thymus vulgaris

1 Introduction
High-performance thin-layer chromatography (HPTLC) is the simplest, precise, rapid, robust, and efficient method used to detect and quantitatively analyse secondary metabolites. In this method, separation can be improved through the repetitive development of thin-layer chromatography (TLC) plates by using different mobile phases for better resolution. Hence this method is accepted worldwide and remains one step ahead when correlate with other chromatography methods (Attimarad et al., 2011).
Linalool (3,7-dimethyl-1,6-octadien-3-ol) is a dietary monoterpene alcohol having anti-inflammatory, analgesic, anxiolytic, anticancerous, antioxidative, antiseptic, antidepressive and neuroprotective, antispasmodic, antimicrobial, antifungal, expectorant, antihelminthic, diaphoretic, expectorant, anti-hyperlipidemic properties; it can be used as a sedative, a tonic, an immune stimulant, and a carminative and to treat gastrointestinal and respiratory disorders, rheumatism, menstrual disorders, wounds, and eczema (Joshi, 2014; Pereira et al., 2018). Moreover, linalool is an active component used in the management of smell loss, food flavourings, various mouthwash and toothpastes, deodorants, soaps and perfumes, and pharmaceutical products (Sacchetti et al., 2004). There are several chemotypes (differences based on the composition of essential oil) species in genus Ocimum (Family- Lamiaceae). Ocimum basilicum a common chemotype of genus Ocimum is a good source of linalool. In addition to O. basilicum, other Ocimum species, O. sanctum (Khan et al., 2010), O. carnosum (Ricarte et al., 2020), and O. Gratissimum (Martins et al., 1999) are also reported to as good sources of linalool. The other genus of family Lamiaceae such as Lavandula (Robu et al., 2011), Aeollanthus spp., Thymus spp. are also reported to as sources of linalool (Karpiński, 2020). Apart from Lamiaceae the other plants such as genus Cinnamomum spp. of Lauraceae family (Cheng et al., 2012; Liang et al., 2019), and genus Coriandrum of Apiaceae family (Caputo et al., 2016) are reported as good sources of linalool.
Thymol (2-isopropyl-5-methylpheno) is a dietary monoterpene phenol that possesses antimicrobial, larvicidal, acaricidal, antileishmanial, antiepileptogenic, antioxidant, anti-inflammatory, radioprotective and analgesic properties and exhibits anti-hemolytic activity; it prevents menstrual cramps, facilitates the process of wound healing, and acts as antimutagenic and anticonvulsant (Mancini et al., 2015). Furthermore, it relaxes smooth muscles, alleviates respiratory difficulties, averts menstrual cramps, and is used an active component in topical ointments, food flavourings, various toothpastes, mouthwash, shampoos, deodorants, and soaps (Sancheti et al., 2014). Due to its powerful antibacterial properties, thymol is commonly used in dentistry to treat oral infections (Meeran et al., 2017). Thymus vulgaris, is a common chemotype present in genus Thymus is a good source of thymol (Khan et al., 2017). In addition to T. vulgaris, other Lamiaceae plants, such as Thymus serpyllum, Monarda fistulosa, and Origanum species contain thymol as a major composition (Verma et al., 2011; Khan et al., 2019). The other plants such as Carum copticum and Trachyspermum ammi (Family-Apiaceae), Lippia multiflora (Family-Verbenaceae), Centipeda minima (Family-Asteraceae), and Nigella sativa seeds (Family-Ranunculaceae), are also reported as good sources of thymol (Salehi et al., 2018; Gruľová et al., 2020).
Due to the incalculable health benefits and wide distribution of the aforementioned monoterpenes in medicinal plants, development of a technique for the rapid detection of the chemotypes of plants present in raw materials, foods, cosmetics, and pharmaceutical products has received substantial consideration. Several studies on method development for the detection of several monoterpene markers used in previous studies (Haque et al., 2012; Stan et al., 2014; Yusufoglu et al., 2019). However, to the best of our knowledge, a method for the simultaneous detection and quantification of linalool and thymol (Fig. 1) by using HPTLC has not been developed so far. Thus, this study developed a validate HPTLC method for simultaneously quantifying linalool and thymol and conducted using the essential oils of O. basilicum and T. vulgaris leaves.
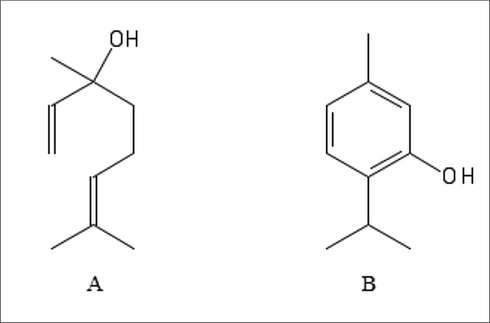
- Chemical structure of linalool (A) and thymol (B).
2 Materials and methods
2.1 Chemicals and instrument
Standard thymol (purity > 98.5%) and linalool (purity > 97%) were procured from Sigma-Aldrich (USA). All other reagents utilised for extraction and method development were of analytical grade. Pre-coated, glass-baked TLC plates obtained from E. Merck (silica gel-60F254; thickness: 0.2 mm; area: 20 × 10 cm) were used for separating standard linalool and thymol. A TLC sampler-linomat V (Camag-Automatic), an automatic development chamber (ADC2, Camag), an ultraviolet (UV) cabinet-4 (Camag), a TLC-derivatization chamber (Camag), a TLC-plate heater (Camag), and a TLC-scanner 4 (Camag) were the main apparatus used.
2.2 Plant materials
The leaves of O. basilicum (sweet basil) and T. vulgaris (thyme), Family-Lamiaceae were obtained from the market of Al-Kharj, Saudi Arabia. The voucher specimens O. basilicum (PSAU-10-CPH-2019) and Thymus vulgaris (PSAU-13-CPH-2019) were identified using the identification key provided by the Flora of Saudi Arabia and deposited at the Department of Pharmacognosy, the College of Pharmacy, Prince Sattam Bin Abdul-Aziz University, Al-Kharj, Saudi Arabia. The raw materials obtained from the markets were powdered using a grinder, passed through a sieve (0.5 mm), and the obtained powder was used for the extraction of essential oils.
2.3 Preparation of essential oils
Both the raw materials (≈200 g) were separately hydro distilled for 4 h by using a Clevenger type apparatus (For oil lighter than water, 10 mL, Borosil®, India) and purified and stored for further HPTLC analysis and quantification by following an earlier method (Foudah et al., 2019).
2.4 Preparation of the sample and standard solution
Each essential oil (100 mg) was transferred in a 10-mL volumetric flask containing 5 mL of methanol (HPLC grade), sonicated for 5 min, and then the volume was made up to 10 mL with methanol to obtain a 10 mg/mL solution. Standard 1 mg/mL solutions of linalool and thymol were prepared separately in methanol. These solutions were filtered (0.22-μm filter syringe) and used for HPTLC analysis.
2.5 Mobile phase selection
Numerous solvent systems containing toluene, hexane, chloroform, ethyl acetate, benzene, and methanol in single and different combinations were analysed for selecting the mobile phase. Finally, a suitable mobile phase containing toluene, ethyl acetate, and glacial acetic acid in the ratio of 8:2:0.3 (v/v/v) was selected to simultaneously separat standard and sample solutions.
2.6 HPTLC conditions
HPTLC was performed on glass-backed TLC silica-gel plates (W × L = 20 cm × 10 cm). Standard (linalool and thymol) and sample (essential oils of O. basilicum and T. vulgaris) solutions were separately spotted with nitrogen flow on a plate with a 6-mm-wide band at 8-mm from the bottom by using the automatic Camag-TLC (Linomat V) applicator. The (linear ascending) development of TLC plates was performed in a twin glass Camag chamber (automatic ADC2, Camag). The chamber was filled with 20 mL of mobile phase for a fixed time of 5 min, at the temperature and humidity of 25 ± 2 °C and 60 ± 1%, respectively, for saturation.
2.7 Qualitative analysis
At the time of TLC chamber saturation, the plates spotted with standards and samples were fixed in an automatic Camag developing chamber. The chamber was programmed to auto-stop after the saturated mobile phase travelled 85% height of the total plate. The reagent containing anisaldehyde–sulphuric acid mixture was used for the derivatization of the developed HPTLC plates, and then the plates were heated up to 90 °C by using a Camag plate heater. The dried plate was observed after 5 min at high-UV (366 nm) and low-UV (254 nm) wavelengths under a Camag UV chamber. The accurate detection of the band colours and retention-factor (Rf) values of linalool (0.60 ± 0.02) and thymol (0.74 ± 0.03) was confirmed by comparing the similar band colours (Pink-colour for thymol and brown-colour for linalool) and Rf values of the samples (Fig. 2).
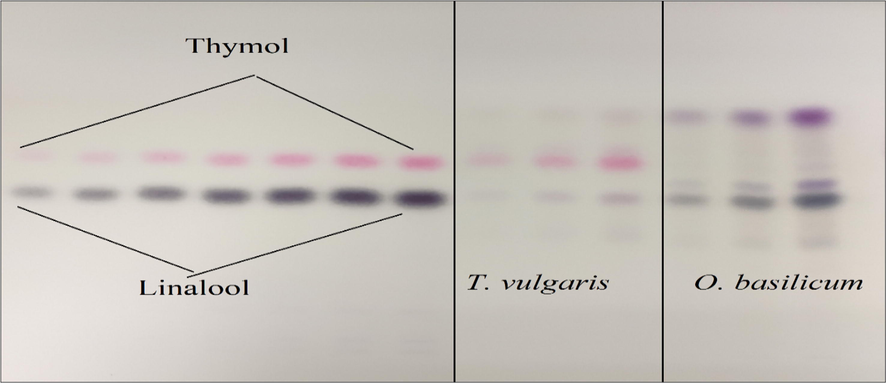
- TLC-Chromatoplate of Linalool, Thymol, and essential oils O. basilicum and T. vulgaris after derivatized and heated at 90 ◦C.
2.8 Quantitative analysis
Standard compounds were quantitatively analysed by scanning the plates developed at 610 nm in the absorbance mode by using Camag-HPTLC scanner (CATS-V 1.4.2) software. The percentage of linalool and thymol in the essential oils of O. basilicum and T. vulgaris was calculated using the developed method.
2.9 Method validation
The method developed for the concurrent detection and quantification of linalool and thymol was validated for linearity, specificity and sensitivity (limit of detection, LOD, and limit of quantitation, LOQ), accuracy and precision, and robustness, according to International Conference on Harmonisation (ICH) guidelines (Alam et al., 2014; Ajay and Saluja, 2017).
2.9.1 Calibration curve and linearity
Different volumes (100, 200, 300, 400, 500, 600, and 700 ng/spot) of different standard solutions (linalool and thymol) were spotted using automatic samplers on TLC plates, considering 6-mm band width and 12-mm distance between tracks. The calibration curve for the peak area versus concentration of standard compounds was plotted, and the linear regression (r2 ≥ 0.999) and linear regression lines of linalool (y = 20.38x + 204.14) and thymol (y = 15.471 × + 262.4) were determined. The outcome of the regression data exhibited good linearity over the concentration range of 100–700 ng/spot.
2.9.2 Specificity and sensitivity
The specificity of the developed method was determined by assaying the standards and samples. The detection of linalool and thymol bands was confirmed by comparing the Rf and spectra of the bands of the samples with those of the standards. Peak purity was evaluated by relating spectra at different positions (start, apex, and end) of the spot.
The LOD (3.3 σ/s) and LOQ (10 σ/s) were used to validate the sensitivity of the developed method (Alam et al., 2014), where σ is the standard deviation (SD) of response at low-concentrations and s is the slope of the calibration curve.
2.9.3 Accuracy and precision
Accuracy was defined as % recovery. The results were obtained by spiking the preanalysed samples with standard solutions (linalool and thymol) at four different (0%, 50%, 100%, and 150%) concentrations of the analyte.
Precision was defined as % relative standard deviation (RSD). Precision was employed to limit the repeatability and reproducibility of the developed method. Intra-day and Inter-day precisions were determined by analysing three different standard solutions (300, 400, and 500 ng/spot) on the three different consecutive days and on the same day.
2.9.4 Robustness
The robustness of this method was determined to measure its ability to remain unaffected by small changes in method parameters (ratio of the mobile phase, distance front, and saturation time) in terms of the peak area and Rf value of linalool and thymol. The robustness of the method revealed its uniformity during normal applications.
2.10 Estimation of linalool and thymol in essential oils
To quantify the contents of linalool and thymol in essential oils, the analysis was repeated three times by following method developed. In the chromatogram of standard compounds, the bands observed at Rf of 0.60 and 0.74 corresponded to linalool and thymol, respectively (Fig. 3).
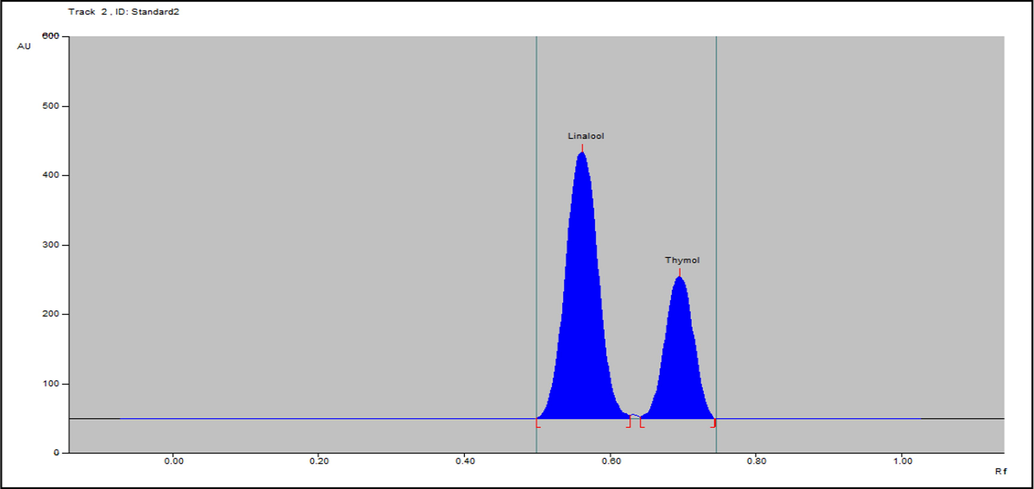
-
. Densitometric-chromatogram of essential oil of linalool and thymol at 610 nm.
The bands corresponding to standard compounds (linalool and thymol) along with other compositions were observed in the chromatogram of the essential oil of O. basilicum (Fig. 4) and T. vulgaris (Fig. 5).
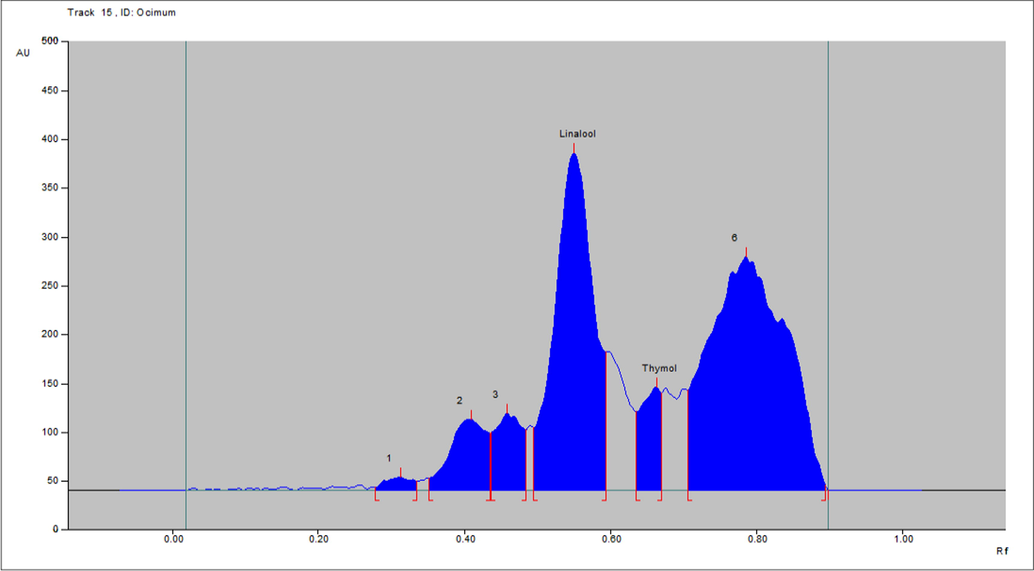
- Densitometric-chromatogram of essential oil of leaf of O. basilicum after derivatization at 610 nm.
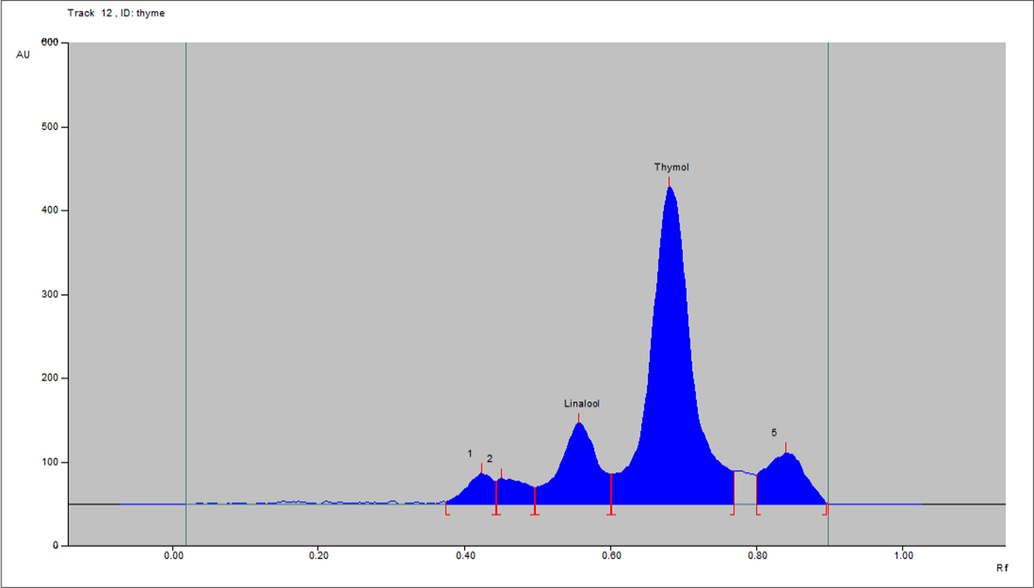
- Densitometric-chromatogram of essential oil of leaf of T. vulgaris after derivatization at 610 nm.
No interference of spots from other compositions of essential oils was detected in the chromatogram (Fig. 6)
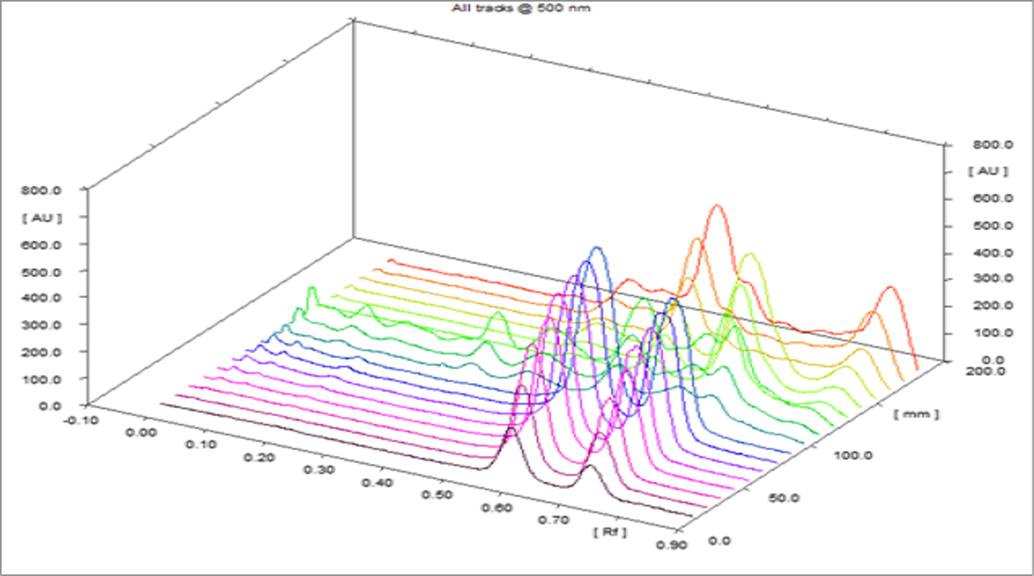
- Densitometric-chromatogram of linalool, thymol and essential oils of O. basilicum and T. vulgaris at 610 nm (3D View).
3 Results and discussion
3.1 Fingerprints and chromatography of standard and essential oils
The analysis using chromatographic fingerprints is a coherent and reasonable method for the quality assessment and confirmation of species with active chemotypes in traditional medicines. The established fingerprint pattern of essential oil compositions can be used to determine not only the availability of the markers of interest but also other components. However, the HPTLC method presents some limitations, that is, the low efficacy of TLC plates and the limited developing distance compared with other chromatographic techniques (Ahadi et al., 2011). Due to its simplicity, cost-effectiveness, open system, fingerprint development, and easy handling, HPTLC remains an effective approach to the quality evaluation and chromatographic fingerprint of medicinal plants and distinguish the chemotype diversity of species.
HPTLC method was developed and validated for the quantification of linalool and thymol in the O. basilicum and T. vulgaris essential oils. The linalool and thymol standards were quantitated using glass-TLC pre-coated silica gel F254 plates and solvent system toluene, ethyl acetate, and glacial acetic acid (8:2:0.3). The Rf values of linalool and thymol were approximately 0.60 and 0.73, respectively. Fig. 2 illustrates the chromatoplate, and Figs. 3–5 present the chromatographs of linalool, thymol, and the essential oils of O. basilicum and T. vulgaris, respectively. No interference of spots from other compositions of essential oils was observed (Fig. 6).
In our previous study, we reported the quantitative analysis of linalool, in O. basilicum and Lavandula angustifolia by using HPTLC (Yusufoglu et al., 2019). In another study, thymol, cineole, and linalool present in O. basilicum were identified through TLC fingerprinting (Soran et al., 2009). The densitometric quantification of ursolic present in O. basilicum, O. sanctum (white and purple) leaves, stems, and flowers (Rout et al., 2012) and that of Apigenin (Parikh and Kothari, 2016) was performed using HPTLC. In addition to O. basilicum, other species such as parsley, dill, and celery were studied for simultaneously quantifying myristicin and linalool (Stan et al., 2014). Thymol and carvacerol were identified in the essential oil of T vulgaris L. and Salvia officinalis by using HPTLC fingerprinting (Jesionek et al., 2017). A densitometry method of HPTLC was developed to identify and quantify luteolin in the liquid extract of T. vulgaris (Bazylko and Strzelecka, 2007).
3.2 Concurrent HPTLC-densitometric quantification of linalool and thymol
According to our literature survey, no study has reported the simultaneous quantification of linalool and thymol in the essential oils of O. basilicum and T. vulgaris by using HPTLC. Hence, we developed the simple, rapid, and precise method for simultaneous quantification of the two markers linalool and thymol in the essential oils. The solvent system containing toulene: ethayl acetate: acetic acid (8:2:0.3) led to sharp, accurate, and well-defined peak resolution. The bands appearing near the Rf of 0.60 and 0.74 were identified as linalool and thymol bands by using the chromatogram of standard compounds. The well-defined spots were achieved when the TLC chamber was saturated for 20 min at room temperature with the solvent system; plates were visualised through necked eyes after derivatization.
An TLC plate photograph was captured after chromatography of linalool and thymol standards. The essential oils of O. basilicum and T. vulgaris and the detection of linalool and thymol bands in the sample chromatogram were confirmed by the matching the chromatoplate and chromatogram obtained for the essential oil samples with that for the standard reference and by comparing the Rf value and peak of linalool and thymol of the sample and standards (Figs. 2 and 3).
The developed method of HTLC densitometric was validated for linearity, specificity and sensitivity, accuracy and precision, and robustness (Tables 1–4).
| Parameters | Linalool | Thymol |
|---|---|---|
| Linearity-range (ng-per-spot) | 100–700 | 100–700 |
| Regression equation (Y) | 20.38x + 204.14 | 15.471x + 262.4 |
| Correlation coefficient (r) | 0.999 | 0.9995 |
| Slope ± Std. dev. | 20.38 ± 0.07320 | 15.471x ± 0.05895 |
| Intercept ± Std. dev. | 204.14 ± 35.66 | 262.4 ± 24.65 |
| Slope stand. error | 0.0287 | 0.0212 |
| Intercept stand. error | 13.44 | 9.66 |
| 95 (%) slope-confidence interval | 7.115–7.618 | 6.234–6.459 |
| 95 (%) intercept confidence interval | 278.1–433.4 | 184.1–261.6 |
| P value | < 0.0001 | < 0.0001 |
| LOD (ng/spot) | 5.77 | 5.25 |
| LOQ (ng/spot) | 17.5 | 15.93 |
| Excess standard added to analyte (%) | Theoretical content (ng) | Conc. Found (ng) ± SD | % Recovery | % RSD |
|---|---|---|---|---|
| Linalool | ||||
| 0 | 200 | 193.50 ± 2.88 | 96.75 | 1.49 |
| 50 | 300 | 293.50 ± 2.81 | 97.83 | 0.96 |
| 100 | 400 | 396.83 ± 2.32 | 99.21 | 0.58 |
| 150 | 500 | 490.17 ± 1.72 | 98.03 | 1.12 |
| Thymol | ||||
| 0 | 200 | 195.17 ± 1.94 | 97.58 | 0.99 |
| 50 | 300 | 293.67 ± 3.14 | 97.89 | 1.07 |
| 100 | 400 | 396.67 ± 1.86 | 99.17 | 0.47 |
| 150 | 500 | 490.00 ± 5.44 | 98.00 | 1.11 |
| Linalool | ||||||
|---|---|---|---|---|---|---|
| Intra-day precision | Inter-day precision | |||||
| Conc. (ng per spot) | Avg-conc. ± SD | Stand- Error | % (RSD) | Avg-conc. ± SD | Stand. Error | % (RSD) |
| 300 | 6337.20 ± 22.90 | 9.35 | 0.36 | 6314.60 ± 29.55 | 12.06 | 0.47 |
| 400 | 8227.00 ± 27.58 | 11.26 | 0.34 | 8221.00 ± 42.86 | 17.50 | 0.52 |
| 500 | 10556.80 ± 33.74 | 13.78 | 0.32 | 10492.20 ± 38.85 | 15.86 | 0.37 |
| Thymol | ||||||
| 300 | 3754.20 ± 31.16 | 12.72 | 0.83 | 3762.20 ± 40.25 | 16.44 | 1.07 |
| 400 | 4748.60 ± 42.64 | 17.41 | 0.90 | 4743.60 ± 41.56 | 16.97 | 0.88 |
| 500 | 5536.00 ± 23.38 | 9.55 | 0.42 | 5548.00 ± 35.02 | 14.30 | 0.63 |
| Linalool | ||||||
|---|---|---|---|---|---|---|
| Solvent composition (Toluene: ethyl-acetate) | ||||||
| Conc. (ng per spot) | Actual | Used | changed | Peak-area ± (SD) (n = 3) |
% (RSD) | Rf |
| 7.9: 2: 1 | −0.1, +0.1 | 8218.50 ± 38.94 | 0.47 | 0.58 | ||
| 400 | 8: 2 | 8: 2 | 0.0 | 8206.83 ± 48.98 | 0.60 | 0.57 |
| 8.1: 1: 9 | +0.1, −0.1 | 8175.17 ± 38.88 | 0.48 | 0.55 | ||
| Thymol | ||||||
| Solvent composition (Toluene: ethyl-acetate) | ||||||
| 7.9: 2: 1 | −0.1, +0.1 | 4752.33 ± 39.12 | 0.82 | 0.72 | ||
| 400 | 8: 2 | 8: 2 | 0.0 | 4750.67 ± 37.27 | 0.74 | 0.70 |
| 8.1: 1: 9 | +0.1, −0.1 | 4757.33 ± 43.04 | 0.90 | 0.68 | ||
The linearity of both the standards was in the range of 100–700 ng/band (Table 1). The peak area of the seven concentrations (100–700 ng/band) of linalool and thymol was calculated, and a graph of standard linalool and thymol solutions versus peak area was plotted separately. For linalool and thymol, the regression equations were y = 20.38x + 204.14 and y = 15.471x + 262.4, respectively, correlation coefficients were 0.999 and 0.9995, respectively, slopes were 20.38 ± 0.07320 and 15.471x ± 0.05895, respectively, and intercepts were 204.14 ± 35.66 and 262.4 ± 24.65, respectively, which all conformed the linearity of the presented method.
The results of accuracy (% recovery) for linalool and thymol were presented in Table 2. Recovery was within an acceptable range (96.75%–99.21%), which is nearly 100, indicating that no intervention occurred in the analysis by other compositions present in the samples, which evidenced the accuracy of the developed method. The LOD and LOQ were 5.77 and 17.5 ng/spot, respectively, for linalool and 5.25 and 15.93 ng/spot, respectively, for thymol (Table 1), which revealed the acceptable sensitivity of the developed method.
The results of precision (% relative standard deviation or % RSD) for linalool and thymol were presented in Table 3. The precision of the inter-day analysis was in the range of 96.75%–99.21% and 96.75%–99.21% RSD for linalool and thymol, respectively. The precision of intra-day analysis was in the range of 96.75%–99.21% and 96.75%–99.21% RSD for linalool and thymol, respectively. The % RSD value of both inter-day and intra-day analysis was <2%, which indicated the reproducibility and excellent precision of the proposed method.
The results of robustness (in terms of the range of % RSD) for linalool and thymol were presented in Table 4. The robustness of this method was reported by slightly changing the proportions of the solvent system. The % RSD range of 0.47%–0.60% and 0.55%–0.58% for linalool and thymol, respectively, provided the highest robustness for the proposed HPTLC method.
The linalool contents quantified using the developed HTLC-densitometric method were 12.8% ± 0.15% and 1.6% ± 0.11% w/w in the essential oil of O. basilicum and T. vulgaris respectively. The thymol contents quantified using the developed HTLC-densitometric methods were 16.8% ± 0.16% and 2.2% ± 0.02% w/w in the essential oil of T. vulgaris and O. basilicum respectively.
4 Conclusions
An accurate, simple, precise, specific, and rapid HPTLC-densitometric method for concurrently detecting and quantitatively analysing linalool and thymol present in the essential oils of O. basilicum and T. vulgaris was established and validated. The data of this method can be used for the rapid identification of linalool and thymol chemotypes present within the same species, genus, and families of plant kingdom and for the quality control of products containing these compounds.
The developed method resulted in satisfactory peak shape and showed the favourable resolution of linalool and thymol compared with other components of essential oils. The recovery of nearly 100% indicated no peak interference among standard compounds and other components present in the essential oil. HPTLC images indicated that the samples and standards were separated without diffusing and tailing.
The results of the linalool sample showed that linalool was present in higher and lower quantities in the essential oil of O. basilicum and T. vulgaris, respectively. Similarly, the results of the thymol sample showed that thymol is present in higher and lower quantities in the essential oil of T. vulgaris and O. basilicum, respectively.
The HPTLC-densitometric method was proposed for the simultaneous analysis of linalool and thymol present in essential oils. This method is considerably simple, accurate, sensitive, and precise and can be fit for the rapid and simultaneous quantification and standardisation of linalool and thymol present in essential oils, foods, and pharmaceutical products.
Acknowledgements
This work was supported by by Support Research Projects with the Global Partnership Program, Deanship of Scientific Research, Prince Sattam Bin Abdulaziz University, Al-Kharj, KSA (Grant No. 2020/03/16815). The authors would like to express their gratitude to the Deanship of Scientific Research of Prince Sattam Bin Abdulaziz University, Al-Kharj for their assistance. Authors thankfully acknowledge Dr. Osman El-Makki, Dept.of Pharmacognosy, Prince Sattam Bin Abdulaziz University (Al-Kharj, Saudi Arabia) for authentication of the plant material, also thankful to the Editag India for editing this manuscript.
References
- Comparison of liquid-liquid extraction-thin layer chromatography with solid-phase extraction-high-performance thin layer chromatography in detection of urinary morphine. J. Biomed. Res.. 2011;2011(25):362-367.
- [Google Scholar]
- Development of validated HPTLC method for quantification of stigmasterol from leaf and stem of Bryophyllum pinnatum. Arab. J. Chem.. 2017;10(2):S2644-S2650.
- [Google Scholar]
- Quantitative estimation of hesperidin by HPTLC in different varieties of citrus peels. Asian Pac. J. Trop. Biomed.. 2014;4:262-266.
- [Google Scholar]
- High-performance thin layerchromatography: a powerful analytical technique in pharmaceutical drug discovery. Pharm. Methods.. 2011;2:71-75.
- [Google Scholar]
- HPTLC densitometric determination of luteolin in Thymus vulgaris and its extracts. Fitoterapia.. 2007;78:391-395.
- [Google Scholar]
- Coriandrum sativum and Lavandula angustifolia essential oils: chemical composition and activity on central nervous system. Int J Mol Sci.. 2016;17:1999.
- [Google Scholar]
- Potential source of S-(+)-linalool from Cinnamomum osmophloeum ct. linalool leaf: essential oil profile and enantiomeric purity. J. Agric. Food Chem.. 2012;60:7623-7628.
- [Google Scholar]
- Development of high-performance thin-layer chromatography (HPTLC) validated method for simultaneous quantification of eucalyptol and α-Pinene in Lamiaceae Plants. J Pharm. Res. Int.. 2019;31:1-11.
- [Google Scholar]
- Thymol chemotype Origanum vulgare L. essential oil as a potential selective bio-based herbicide on monocot plant species. Molecules.. 2020;25:595.
- [Google Scholar]
- Validated HPTLC analysis method for quantification of thymol content in Trachyspermum ammi and polyherbal Unani formulation Arq Zeera. Int. J. Pharm. Pharm. Sci.. 2012;4:478.
- [Google Scholar]
- TLC–direct bioautography as a method for evaluation of antibacterial properties of Thymus vulgaris L. and Salvia officinalis L. essential oils of different origin. J. Liquid Chromatogr. Related Technol.. 2017;40:292-296.
- [Google Scholar]
- Chemical composition and antimicrobial activity of the essential oil of Ocimum basilicum L. (sweet basil) from Western Ghats of North West Karnataka. India. Anc Sci Life.. 2014;33:151-156.
- [Google Scholar]
- Essential oils of lamiaceae family plants as antifungals. Biomolecules.. 2020;10:103.
- [Google Scholar]
- Ocimum sanctum essential oil and its active principles exert their antifungal activity by disrupting ergosterol biosynthesis and membrane integrity. Res. Microbiol.. 2010;161:816-823.
- [Google Scholar]
- Chemical diversity in leaf and stem essential oils of Origanum vulgare L. and their effects on microbicidal activities. AMB Express.. 2019;9:176.
- [Google Scholar]
- Thymol and carvacrol induce autolysis, stress, growth inhibition and reduce the biofilm formation by Streptococcus mutans. AMB Express.. 2017;7:49.
- [Google Scholar]
- Chemical compound identification and antibacterial activity evaluation of cinnamon extracts obtained by subcritical n-butane and ethanol extraction. Food Sci. Nutr.. 2019;7(6):2186-2193.
- [Google Scholar]
- Studies on chemical composition, antimicrobial and antioxidant activities of five Thymus vulgaris L. essential oils. Molecules.. 2015;20:12016-12028.
- [Google Scholar]
- Composition of the essential oils of Ocimum canum, O. gratissimum and O. minimum. Planta Med.. 1999;65:187-189.
- [Google Scholar]
- Pharmacological properties and molecular mechanisms of thymol: prospects for its therapeutic potential and pharmaceutical development. Front. Pharmacol.. 2017;8:380.
- [Google Scholar]
- Development and validation of a high-performance thin-layer chromatographic—densitometric method for the quantification of apigenin in Ocimum basilicum L. Seed (Takhmaria) JPC-J. Planar. Chromat.. 2016;29:216-220.
- [Google Scholar]
- Linalool bioactive properties and potential applicability in drug delivery systems. Colloids Surf. B Biointerfaces.. 2018;171:566-578.
- [Google Scholar]
- Chemical composition and biological activities of the essential oils from Vitex-agnus castus, Ocimum campechianum and Ocimum carnosum. An Acad. Bras Cienc.. 2020;92:e20180569
- [Google Scholar]
- Studies regarding chemical composition of lavender volatile oils. Rev. Med. Chir. Soc. Med. Nat. Iasi.. 2011;115:584-589.
- [Google Scholar]
- Thin-layer chromatographic separation and validated HPTLC method for quantification of ursolic acid in various ocimum species. J. Food Drug. Anal.. 2012;20:865-871.
- [Google Scholar]
- Composition and functional properties of the essential oil of Amazonian basil, Ocimum micranthum Willd., Labiatae in comparison with commercial essential oils. J. Agric. Food Chem.. 2004;52:3486-3491.
- [Google Scholar]
- Thymol, thyme, and other plant sources: health and potential uses. Phytother. Res.. 2018;32:1688-1706.
- [Google Scholar]
- Characterization of anticonvulsant and antiepileptogenic potential of thymol in various experimental models. Naunyn-Schmiedebergs Arch. Pharmacol.. 2014;387:59-66.
- [Google Scholar]
- The extraction and chromatographic determination of the essentials oils from Ocimum basilicum L. by different techniques. J. Phys. Conf. Ser.. 2009;182:012016
- [Google Scholar]
- Stan, M., Opriş, O., Lung, I. Soran, M.L., High-Performance Thin-Layer Chromatographic Quantification of Myristicin and Linalool from Leaf Extracts of Microwave-Irradiated Parsley, Dill, and Celery. JPC-J Planar Chromat. 27, 97–101.
- Seasonal variation in essential oil content and composition of Thyme, Thymus serpyllum L. cultivated in uttarakhand hills. Indian J. Pharm. Sci.. 2011;73(2):233-235.
- [Google Scholar]
- Development a validated HPTLC method for quantification of linalool in the oils and extracts of Saudi Arabian Ocimum basilicum and Lavandula angustifolia. Indo Am. J. Pharm.. 2019;6:14408-14417.
- [Google Scholar]


