

Translate this page into:
Lead-sensitive membrane electrode based on chelating ion exchanger
*Corresponding author a_khalaf@yahoo.co.uk (A.S. Alasier)
-
Received: ,
Accepted: ,
This article was originally published by Elsevier and was migrated to Scientific Scholar after the change of Publisher.
Available online 10 Februray 2010
Abstract
A new selective membrane electrode for the measurement of lead activities is proposed. The preparation of active components of the membrane is described. The ready made electrode insert was used in which the PVC membrane was replaced by the prepared membrane. Experimental results document the emf response of profile, the selectivity, the detection limit and the effect of the sample media. The prepared electrode was applied for the measurement of the lead concentration in water samples. Activated alumina micro-column was used for the pre-concentration of lead in the analyzed water samples. The obtained results were compared with those determined by atomic absorption spectrometry.
Keywords
Lead
Ion selective electrode
Atomic absorption spectrophotometer

1 Introduction
It is well documented that chelating ion-exchangers in the form of (R–S–CH2COO)2M where (M) is a divalent metal and (R) can be any of several organic groups which can be used as electrode membranes (Peters et al., 1974). On the other hand, the liquid ion exchangers in the form of or RSCH2COO− have been used as electrode membranes (Braun, 1987). The liquid ion exchangers such as potassium tetrakis(p-chlorophenyl)borate (KTPB) is known for anionic species such as carbonate ion (Robert et al., 1982).
Recent years have witnessed the development of a number of interesting ion selective electrodes, referring to the range of membrane electrodes which are selectively sensitive to particular ionic species in the presence of others. The development includes elemental cations, anions and anionic groups such as sulfates, nitrates, sulfides, and cyanates. In the year 1961, the field of ion selective electrodes was first introduced in the literature by Pungor and Hollos-Rokosinyi (1961). He described an anomalous interpretation of the working mechanism of the ion selective electrodes as his findings were based on the phenomenon observed by Habber and Clemensiewicz (1909).
Recently, Pungor experimentally amended his previous interpretations (Pungor, 2001). As regards selectivity of electrodes towards particular ions, it varies from one electrode to another and this depends upon the composition of the membrane. The selectivity, which may be defined as a degree of tolerance of undesired ions in the measuring solution, is also limited for each electrode. As none of the electrodes developed are entirely specific to a particular ion, therefore, it can respond to certain other ions which act as interferants.
Solid state or precipitate electrodes have non-glass pellets as the membrane component of the electrode. This approach has proved effective for numerous cations and anions. Ion selective electrodes are fundamentally different from metal electrodes in that the former do not depend on redox processes. The key feature of an ideal ion selective electrode is a thin membrane across which only the intended ion can migrate. Other ions cannot cross the membrane (Harris, 1999).
For our knowledge, the trans-1,2-diaminocyclohexane N,N,N′N′-tetra acetic acid (I) as a chelating agent has not been tested as an ion exchange membrane for lead ion selective electrode. Therefore, the present study addresses the possible preparation, application and evaluation of a new lead ion exchange membrane electrode using trans-1,2-diaminocyclohexane N,N,N′N′-tetra acetic acid ligand as a chelating agent.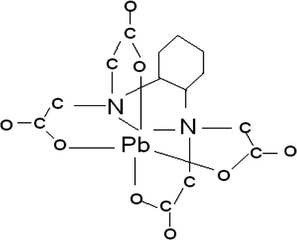
The work aimed to provide substantial informative data facilitates the laboratory use of the proposed electrode to simplify the determination of lead ion as an environmental contaminant.
2 Experimental
2.1 Reagents
For all experiments, doubly distilled water and chemical of puriss or analytical grade were used. All sample solution used were buffered with 2-amino-2-hydroxy-methyl-1,3-propanediol. The desired pH values were adjusted by adding calculated amounts of 1 M sulfuric acid. Trans-1,2-diaminocyclohexane N,N,N′N′-tetra acetic acid (DCTA) (Sigma, UK) was used without further purification. Lead nitrate. Spectral grade activated charcoal fine powder (GR for analysis), sodium hydroxide and hydrochloric acid purchased from MERK Germany. Liquid paraffin for spectroscopy was used.
2.2 Apparatus
2.2.1 Ion analyzer
Type (PHM250) from RADIOMETER, Meterlab, France. Electrode insert M27 Ag-9 RADIOMETER, Fig. 1. SAM Sample Stand (Bayonet) version with three delivery tips. Stirring magnet, 40–100 ml plastic beakers.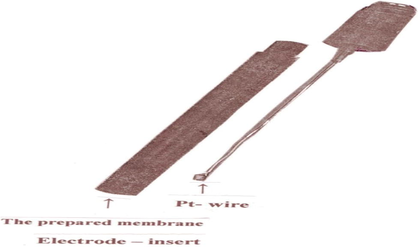
The electrode insert and the Pt wire assembly.
2.2.2 Atomic absorption spectrophotometer
Type (AA-6701F) equipped with graphite furnace and autosampler from Shimadzu Japan. The analytical conditions for the analysis of lead in water samples were as follows:
Analytical conditions for the analysis lead.
Element lamp
Lamp current
Wavelength (λ)
Slit width
Correction mode
Pb
10 mA
283.3 nm
0.5
BGC-D2
Temperature (°C)
Time
Heat mode
Sensitivity
Gas type
Flow rate (ml/min)
120
30 s
Ramp
Regular
Argon
1
250
10 s
Ramp
Regular
Argon
1
300
25 s
Step
High
Argon
0.0
1800
3 s
Step
High
Argon
0.0
2.3 Preparation of electro-active material
The membrane electro-active material was prepared through complexation from 0.1 M aqueous solution of trans-1,2-diaminocyclohexane N,N,N′N′-tetra acetic acid (DCTA) and lead nitrate. The solution of 0.1 M DCTA was slowly added to the lead nitrate solution with a constant stirring in the ratio of 2:1, respectively. The complex was instantly formed. The yield was improved by warming up and leaving the complex overnight to precipitate. The final product was filtered on Whatman filter paper No. 1, and was washed twice with distilled water, finally it was washed with the acetone and dried in a desiccator. The complex was ground to a powder form.
2.4 Preparation of a membrane based on carbon paste as a binding matrix
Spectral grade activated charcoal fine powder was used to prepare carbon paste by mixing with liquid paraffin. The paste was used as a binding matrix for the electro-active material. A manageable paste was obtained by mixing measured quantities of graphite powder and liquid paraffin in a ratio of 3:1 (w/v). In all cases, the constituents were hand mixed to obtain a homogeneous paste.
The DCTA-Pb(II) complex in its powder form was added to the carbon paste and was mixed thoroughly so as the ion sensing material may evenly be distributed in the paste. The electro active paste was tamped as a thin film into one end of M27 pint-9 electrode insert tube from RADIOMETER. (It was not possible to measure the thin film thickness.) The electric contact was provided with the tube through an inner Pt-wire, one end of which was inserted into the membrane and the other end was soldered to the inner wire of a coaxial cable connected to the ion analyzer.
2.5 Potential measurements
The performance of the prepared carbon-paste ion selective electrodes was assessed for potentiometric studies. Using ion analyzer (PHM250) and a normal single junction calomel electrode as a reference electrode, the potentiometric measurements were carried out in a conventional manner and all measurements were performed at constant temperature. The temperature of the electrochemical cell was maintained at 25 °C using thermostated water bath. The system provides the acquired sample temperature ±0.2 °C. An electromagnetic stirrer was used for mixing the sample solution. The electrochemical behavior of the electrode was evaluated as regards sensitivity and selectivity.
2.6 Selectivity of the electrode
The interfering effect of some divalent cations on the response of the proposed electrode was tested for Hg2+, Cu2+, Cd2+ and Fe2+ ions over the range of 10−2 M to 10−6 M of Pb2+ ions. The selectivity of the electrode was also tested in the presence of some other ions including Mg2+, Co2+, Ca2+ and Sr2+ at concentrations of 10−2M of Pb2+ ions.
2.7 Reversibility of the membrane potential
Reversibility of the membrane potential was studied experimentally. The proposed lead ion selective electrode and the reference electrode forming a cell of unknown potential as a reversible cell potential was tested against a known potential (standard cell) using a galvanometer and variable resistance.
By varying the concentration of lead solution, the potential of the electrode cell was measured under reversible conditions at zero current. The resistance of the cell at concentration of 1.0 × 10⁻⁴ M Pb+2 was 28.3 kΩ as was measured by an Avometer. The resistance is small enough to allow the cell potentials to be measured with many types of digital voltammeter; potentials were measured with a pH meter with high input impedance.
2.8 Response time
The time to reach an equilibrium emf was tested at optimal experimental conditions using solutions of various lead ion concentrations ranged from 10−2 M to 10−6 M of Pb+2 ions.
2.9 Optimum pH for electrode response
The response of the electrode was tested against various pH solutions containing 10−4 M and 10−5 M lead ion concentration measured at constant temperature. Dilute perchloric acid and sodium hydroxide solutions were used to vary the pH of the measured Pb2+ ion solutions.
2.10 Long-term measurements
The electrode response towards a range of 10−2 M to 10−6 M Pb2+ ions at the optimum conditions was studied in three different periods of time including 24 h, after10 days and after 5 weeks time.
2.11 Application of the electrode for the analysis of lead content in water samples
Water samples collected at the source were immediately acidified with 2 M nitric acid and then kept in polyethylene containers before analysis. About 1 ml/100 ml of 0.5 M tartaric acid was added as a complexing agent. The lead content in water samples was pre-concentrated using micro-column of activated alumina. The method of pre-concentration described elsewhere (Bushina et al., 1997) was followed. The evaluation of the method applicability and performance were assessed by the synthetic prepared water samples have the same composition of the real samples and contain the known quantities of lead ion.
3 Results
3.1 Evaluation of the proposed electrode
The prepared electrodes were tested to study and evaluate their electrochemical behavior regarding sensitivity and selectivity towards lead ions and other divalent cations. It becomes evident that the new membrane electrode constitutes a nearly ideal sensor for lead activity. Experiments were performed on various electrode constituents ratios resulted in that the membrane containing 60% of the electro-active material showed the most promising characteristics. Therefore, it was selected for all the experimental studies described in this work as can be concluded from Table 1. Further increments in the DCTA-Pb(II) complex ratios were not possible as a difficulty in preparing the thin film membrane was encountered.
Membrane constituent ratio
Measured electrode potential (mV)
DCTA-Pb(II) complex
Carbon paste binding matrix
20
80
108.7
30
70
164.3
40
60
204.8
50
50
238.4
60
40
244.4
Table 2 shows the experimental emf response E vs. molar concentration. These results are graphically presented in Fig. 2. The presented experimental results suggested that the steady-state response of the electrode is correctly described by the equation:
as the electrode responds linearly in a Nernstian manner and only to the changes in lead ion activity.
(Pb2+) ion activity (M)
Electrode potential (mV)
Within 24 h
After 10 days
After 5 weeks
1 × 10⁻⁶
298.0 ± 2.0
326.3 ± 3.5
347.1 ± 3.0
5 × 10⁻⁶
290.3 ± 1.3
315.0 ± 2.1
342.0 ± 2.3
1 × 10⁻⁵
244.4 ± 4.3
275.8 ± 2.1
305.8 ± 1.1
1 × 10⁻⁴
196.0 ± 3.3
235.4 ± 1.6
269.4 ± 1.6
1 × 10⁻³
145.6 ± 1.5
192.2 ± 3.4
230.2 ± 3.2
1 × 10⁻²
97.4 ± 1.4
151.6 ± 1.8
191.3 ± 2.5
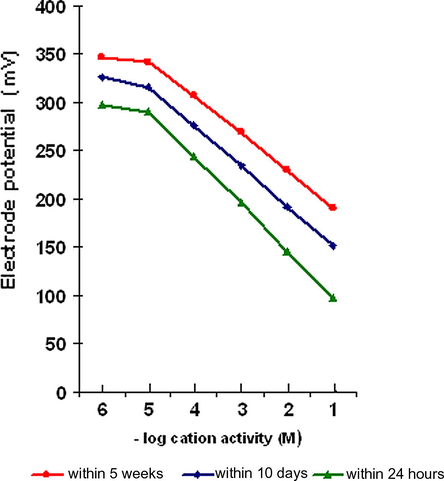
The experimental emf response E vs. the molar concentration of Pb2+ ions.
A meaningful response of the electrode is observed over lead ion activity in the range of 10−2 M to 10−6 M. Though, linear potential-activity slope of 51.66 is obtained over the range 10−2 M to 5 × 10⁻⁶ M solutions. A constant drift in the electrode potential towards negative side was observed over a period of about 5 weeks. The drift was in the range of 94–52 mV in solutions of 1 × 10⁻² M to 5 × 10⁻⁶ M Pb2+ ion, respectively, and a decrease in slope by 9.1 is noticed. Although no change in the colour of the electrode membrane throughout the working period, the long-term measurements were limited by 5 weeks time, after which performance of the electrode would be deteriorated.
3.2 Selectivity data
The electrode function and the selectivity of the prepared electrode were determined by the separate solution method (SSM, 0.1 M aqueous lead nitrate solutions buffered to pH of about 8) described elsewhere (Guilbault et al., 1976). The emf response function of the membrane electrode is given by the equation: with the selectivity factor, KPbM = 1/η > 1, where the efficiency factor η depends on (Pb2+) permeability of the membrane relative to the total permeability of the membrane and aqueous boundary layer.
It is evident from Tables 3 and 4 that Ca2+ and Hg2+ ions must be considered the most serious interfering ions. This is clearly approved as the response of the Pb2+ refrain from linearity upon the addition of constant Ca2+ or Hg2+ ion concentration to the serial Pb2+ standard solutions as shown in Fig. 3 in case of calcium ions interference. Therefore, the above-mentioned equation permits easy assessment of the selectivity coefficient and the value of η. This implies that careful masking of the Ca2+ and Hg2+ in the measured sample solution is a prerequisite for a reliable measurement of Pb2+ ion using this proposed electrode.
Ion activity (M)
Electrode potential (mV)
Pb2+
Hg2+
Fe2+
Cd2+
Cu2+
10−2
142.5
147.0
80.0
67.0
68.0
10−3
115.5
122.0
69.0
46.0
40.0
10−4
88.0
90.0
51.0
37.0
30.0
10−5
61.0
58.0
42.0
31.0
26.0
5 × 10⁻⁶
47.0
–
–
–
–
10−6
38.0
35.0
31.0
25.0
20.5
Ion (X)
(mV)
Pb2+
0.00
Mg2+
−11.3
Co2+
−79.2
Ca2+
−8.7
Sr2+
−54.5
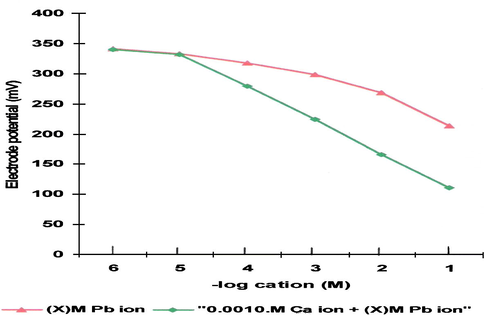
Comparison of the observed emf response for the calibration curve of the proposed electrode with that in the presence of constant Ca2+ ion concentration.
If the interference by the present ions is eliminated or fixed, it should be resulted in a calculated detection limit equal to 8.93 × 10⁻⁵ M Pb2+, which is approximately as gleaned from the calibration curve given in Fig. 2. Therefore, an increase in the activity of interfering ions in the measured sample should clearly reduce the linear range of the Pb2+ response function.
3.3 The effect of the solution pH
The pH range for satisfactory measurements with the proposed Pb2+ selective electrode was found from 5.5 to 10. Below pH 5.5 hydrogen ion H+ interfere; above pH 10, Pb(OH)+ is formed. Since the lead electrode responds only to free lead ions, any Pb2+ ions bound or complexed to the other species will not be measured.
3.4 Variation of the electrode response with the solution temperature
The effect of temperature changes on response of the electrode towards Pb2+ ion in solution was studied using 10−4 M Pb2+ ion. The observations are given in Table 5.
Temperature (°C)
E (mV)
25
196.2 ± 0.01
30
196.8 ± 0.04
35
197.9 ± 1.2
40
198.5 ± 0.2
45
199.2 ± 0.5
50
200.1 ± 1.1
55
201.3 ± 0.06
In an attempt to apply the proposed electrode for the real determination of trace lead concentrations in water samples, we found that pre-concentration for all the collected samples was necessary. Therefore, Table 6 shows the quantitative analysis of the trace Pb2+ ion present in water samples. As demonstrated in the table, the comparative study of Pb2+ content with those obtained with atomic absorption spectrophotometer for the same samples supports the use of the electrode.
Sample no.
Pb2+ (μg/l)
Using AAS
Using ISE
W1
2.51 ± 0.2
2.07 ± 0.07
W2
0.048 ± 0.03
0.13 ± 0.05
W3
0.55 ± 0.13
0.78 ± 0.04
W4
1.12 ± 0.4
1.04 ± 0.08
W5
1.00 ± 0.05
0.88 ± 0.3
W6
1.24 ± 0.07
1.36 ± 0.5
W7
11.00 ± 1.6
9.78 ± 1.8
W8
1.00 ± 0.4
1.19 ± 0.1
W9
1.00 ± 0.6
1.05 ± 0.08
W10
2.00 ± 0.02
1.09 ± 0.6
3.5 Tarhouna water samples composition
TDS: 550 mg/l, pH 7.8, CO3: 12 mg/l, Cl−: 67.7 mg/l, Na: 43.9 mg/l, K: 0.1 mg/l, Ca: 48 mg/l, Mg: 30 mg/l, Fe: 0.11 mg/l, Mn: 0.01 mg/l, Zn: 0.2 mg/l.
3.6 Evaluation of the performance of the proposed method
The recovery percentage of the added lead ion Pb2+ to the synthetic water samples mimics those of Tarhouna samples, treated and analyzed by the proposed method was studied. Lead ions from the spiked samples were eluted from the micro-column of the activated alumina and measured with the proposed electrode with recoveries of 89.6–98.4%. The results of five replicates of each concentration are summarized in Table 7. The lead ions can be sensitively concentrated from large volumes of diluted solutions the use of alumina column. The values are in good agreement with the added lead concentrations. The pre-concentration factor was estimated to be 100 with average RSD ≈ 6.21.
Relative standard deviation (RSD)
Recovery (%R)
Lead amount found (mg)
Lead amount added (mg)
Pre-concentration ratio factor (P)
Sample volume (ml)
6.79
98.4
49.2
50
2.5
25
5.88
97.8
48.9
50
10
100
6.98
94.6
47.3
50
25
250
4.75
93.0
46.5
50
50
500
6.66
89.6
44.8
50
100
1000
4 Conclusion
Lead-sensitive membrane electrode based on chelating ion-exchange in the form of (R–S–CH2COO)2M has been prepared and used successfully to permit the analysis of water samples. Calibration is straightforward, with linear correlations observed that produce relative sensitivity factors (RSFs) match the standard RSFs collected by Huneke and co-workers (1991). However, a suitable pre-concentration method for the analyzed samples was necessarily as the lead content falls below the electrode detection limits.
References
- Braun D., ed. Introduction to Instrumental Analysis. Singapore: McGraw-Hill; 1987. p. :723.
- Petroleum Res. J.. 1997;9:67.
- Pure Appl. Chem.. 1976;48:127-132.
- Z. Z. Phys. Chem.. 1909;67:385.
- Quantitative Chemical Analysis (fifth ed.). New York: W. H. Freeman and Company; 1999. (Chapter 15)
- Spectrochim. Acta. 1991;46B:137.
- Chemical Separations and Measurements. Philadelphia: Saunders Company; 1974. (Chapter 11)
- Sensors. 2001;1:1-12.
- Acta Chim. Hung. 1961;27:63.
- Anal. Chem.. 1982;54(3):423.


