

Translate this page into:
Combination of FIA-CL Technique with ion-exchanger for determination of sulphate in various water resources in Erbil City
*Corresponding author dr.diar@uni-sci.org (Diyar Salahuddin Ali) diyar@kurdchemists.org (Diyar Salahuddin Ali)
-
Received: ,
Accepted: ,
This article was originally published by Elsevier and was migrated to Scientific Scholar after the change of Publisher.
Available online 21 August 2010
Abstract
A new flow injection chemiluminescence system is developed for determination of anions like sulphate. The method is based on the displacement of an equivalent amount of bromide ion on a Br− from an ion-exchange minicolumn by sulphate. The released Br− then reacts with in acidic medium to produce bromine water which catalyzes the Luminol/H2O2 chemiluminescence. Working conditions for these determinations were optimized. The emission intensities produced were recorded as peak height (mm) on a chart recorder and they were proportional to the amount of sulphate injected. This method allowed determination of 0.96 mg/l .
The developed FIA-CL system was applied for determination of sulphate in water (well and waste water) in different regions in Erbil City – North of Iraq. Interference effects of various anions were eliminated by inserting a suppressor minicolumn in the FIA-CL system after injection port, which allowed for sulphate only to pass through. The method provided a very simple, rapid and sensitive method for sulphate determination without any pretreatment. The present method was applied for sulphate and could be used for other ions with some improvement in the suppressor column.
Keywords
Flow injection analysis
Chemiluminescence
Sulphate
Ion-exchanger
Water
Erbil City

1 Introduction
Sulphate is a highly widespread anion, and its determination in environmental objects (such as sweet, mineral and sea water; atmospheric precipitation, in particular, acid rain), in various products and raw materials of chemical and pharmaceutical industry, in food, etc., has been an important task. Existing methods for sulphate determination have several drawbacks such as long duration and unacceptability for low concentrations (gravimetric methods); laboriousness, insufficient selectivity and reproducibility (optic methods including nephelometry and turbidimetry) (Lomako et al., 2006).
Different methods used for determination of sulphate were done. A novel capillary electrophoresis (CE: one of chromatographic methods) with chemiluminescence (CL) detection method for determination of sulphate has been developed. This method is based on the chemiluminescence reaction of potassium ferricyanide with luminol in sodium hydroxide medium sensitized by sulphate (Shuting et al., 2009).
The diffuse reflectance Fourier transform infrared spectroscopy (DRS-FTIR for knowing the functional groups and determined directly) is used as a sensitive tool for sulphate determination in water and environmental samples (Santosh et al., 2007).
Also sensitive SIA method was developed for sulphate determination in real samples such as fuel and water (Fabio et al., 2006).
The present work is described for the determination of sulphate in water. The method is based on the generation of bromine water from the –Br−–H3O+ reaction; the bromine then reacts with H2O2 to liberate oxygen, which will oxidize luminal in an alkaline medium. The sample sulphate displaces an equivalent amount of Br− from an exchange column. The Br− then reacts with in an acidic medium to produce bromine water which catalyses the luminal/H2O2 CL system as mentioned before.
For the determination of sulphate in water a new method is described. It is based on inserting a combined suppressor column into the FIA-CL manifold for providing the selectivity of anion determinations. This new method can apply for the determination of sulphate in different well waters in Erbil City.
A sample size of (60 μl) was used with a flow rate (3.7 ml/min). The range of determination were 48–960 mg/l; also 0.96 mg/l considered as a detection limit for sulphate determination using a combined suppressor column. Linear regression of the Log–Log plot of concentration (mg/l) versus chemiluminescence intensity (peak height (mm)) gave a correlation coefficient of 0.999 for sulphate in the concentration range studied.
The rapid growth of flow injection analysis which utilizes chemiluminescence technique reflects its many advantages relative to conventional procedures. The chemiluminescence from the oxidation of luminal by hydrogen peroxide in alkaline medium has been used to detect and determine the trace amount of material in a variety of analytical techniques (Ali and Faizullah, 1999).
Ion-exchange can be incorporated in the flow injection manifold by using a resin column in the sample stream and as a result a simple and stable system is obtained (Bergamin et al., 1980).
Compared with other analytical methods (e.g. spectrophotometrically, gas chromatography and mass spectrometry) (Yang et al., 1997), chemiluminescence is highly sensitive, selective and accurate for sulphate determination.
The fundamentals of suppressor columns used for improving the selectivity of anion determination have been described extensively (Faizullah and Townshend, 1986). They can involve one of a number of types of reactions. One is the conversion of an ionic species to a molecular form, e.g., hydroxide to water or hydrocarbonate to carbon dioxide and water.
2 Experimental
2.1 Apparatus
A multi channel peristaltic pump (Desaga), a six way injection valve with a 60 μl sample loop, silicon rubber tubing (0.5 mm i.d.), a reaction cell (60 μl). A photo tube of a spectrophotometer (Type Ultra spec. LKB 4050 UV/Visible) as a detector x-t recorder (Type PM 8251 A Philips). Power supply and micro voltmeter were used as associated electronics.
2.2 Reagents
Sodium carbonate solution; (0.1 M), dissolve 10.599 g of Na2CO3 in 1 l of water.
Hydrogen peroxide solution; (0.1 M), dilute 8.596 ml of 35% H2O2 to 1 l of water.
Luminol solution; (1 × 10⁻³ M), dissolve 0.17717 g of luminal in 1 l of 0.1 M Na2CO3 solution.
Potassium bromate solution; (0.4 M), dissolve 33.402 g of KBrO3 in 500 ml of water.
Potassium bromide solution; (0.1 M), dissolve 5.95 g of KBr in 500 ml of water.
Hydrobromic acid solution; (1 M), dilute 11.2 ml of concentrated HBr to 500 l of water.
Hydrochloric acid solution; (0.5 M), dilute 20.7 ml of concentrated HCl to 500 l of water.
Ammonium sulphate solution; (1 × 10⁻² M), dissolve 0.13214 g of (NH4)2SO4 in 100 ml of water.
2.3 General procedure
Fig. 1 shows a schematic diagram of the FIA-CL system used in which sulphate 60 μl is injected through the sample loop into a stream of distilled water and the signal is recorded as a single symmetrical peak.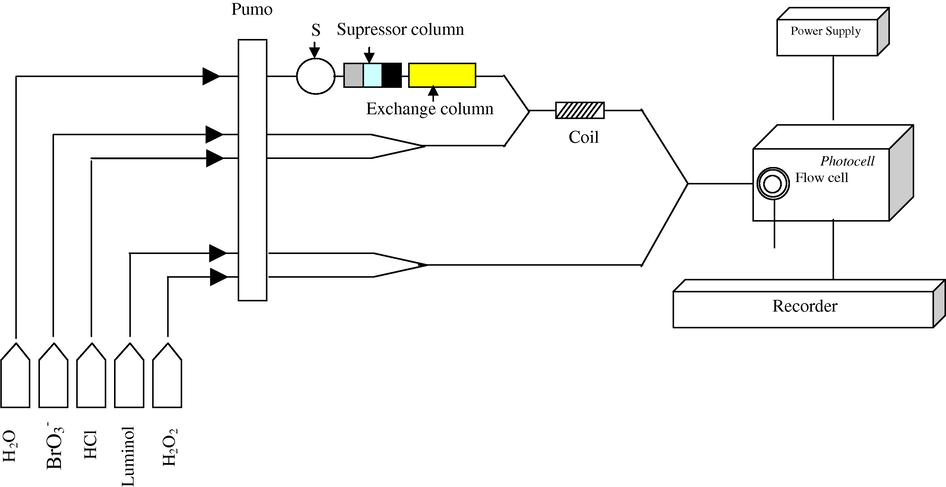
Combined suppressor column with FIA-CL system used for sulphate determination.
Streams of HCl and KBrO3 are mixed and then combined with a carrier stream of the sample, the resultant stream was then mixed in a flow cell with another combined luminol/H2O2 stream. During this stage no emission signal occurs due to the absence of Br−, which is essential to form bromine water, but when sample is injected they pass through a suppressor column Fig. 2, which includes a cation exchanger resin (H+-form) which is used to remove cations, whereas the second cation exchanger (Ag+-form) is used to remove anions, but some of the silver ions could be passed through in this column due to solubility factor, hence an anion-exchanger resin (Cl−-form) is used to trap any silver ion eluted and only the sulphate passes through in this column. Then they displace an equivalent amount of Br− on the exchanger column. The latter reacts with
in acidic medium to produce bromine water which catalyses the luminol/H2O2 CL system.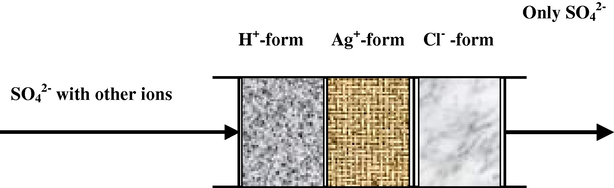
Arrangement of suppressor column used for eliminating interfering effects in sulphate determination.
3 Results and discussion
3.1 Optimization
The flow injection chemiluminescence system shown in Fig. 1 was used to determine sulphate in water samples according to two main stages
First stage before sample injection: Streams of KBrO3 and HCl are mixed and then combined with a carrier stream of the sample. The resultant stream is mixed in a flow cell with another combined luminol/H2O2 stream. During this stage no emission signal occurs due to the absence of Br−, which is essential to form bromine water as shown in the Eq. (1)?
Second stage after sample injection: Injection of 60 μl of sulphate sample displaces an equivalent amount of Br− on the exchanger column. The latter reacts with in an acidic medium according to Eq. (1) to produce bromine water which catalyses the luminol/H2O2 chemiluminescence system. The emission intensities produced were recorded as peak height (mm) on a chart recorder and was proportional to the amount of sulphate concentration injected.
Bromine is reacted with H2O2 to liberate oxygen, which is necessary for oxidizing luminal in alkaline medium. Generation of bromine water from (
) system occurs according to Eq. (1), which in turn reacts with hydrogen peroxide as followings.
For removal of all interferences in the determination of sulphate in real samples (water), we used a combined suppressor column. This column removed all anions and cations except sulphate; in this case only sulphate can be determined as shown in Fig. 1.
3.2 Reactant concentration
Effects of various reactant concentrations as shown in Fig. 1 were optimized.
3.2.1 Bromate concentration
Solutions containing (1 × 10⁻³ M) H2O2, (1 × 10⁻⁴ M) luminol, (0.1 M) HCl and different bromate concentrations (0.01–0.4 M) were prepared in 50-ml calibrated flasks. Column of 3 cm length was used in this work. Distilled water produced no significant response. Fig. 3 shows the variation of CL-intensity, expressed as peak height in (mm) (n = 3). A KBrO3 concentration of (0.17 M) was chosen for optimum sensitivity and reproducibility for the determination of sulphate when using a combined suppressor column. Higher concentrations were not studied owing to the low solubility of KBrO3.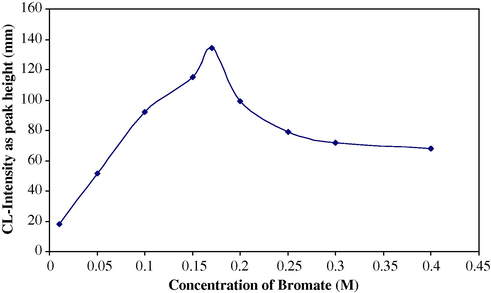
Effect of
concentration on CL-intensity for sulphate determination.
3.2.2 HCl Concentration
Using 0.17 M KBrO3 (see above) and keeping the luminol and hydrogen peroxide concentrations at 1 × 10⁻⁴ and 1 × 10⁻³ M, respectively.
Solutions containing different acid concentrations (0.05–0.45 M) were prepared in 50-ml calibrated flasks. Fig. 4 shows the variation of chemiluminescence intensity, expressed as peak height in (mm) (n = 3).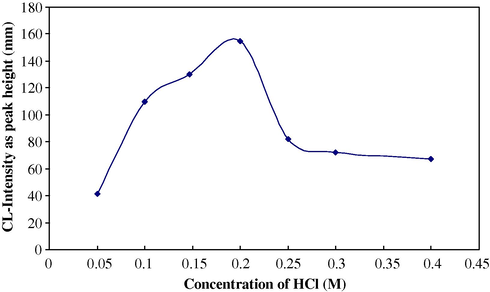
Effect of HCl concentration on CL-intensity for sulphate determination.
It can be seen that 0.147 M gives the largest emission signal for sulphate by using a combined suppressor column.
3.2.3 Hydrogen peroxide concentration
Using 0.17 M KBrO3, 0.147 M HCl and 1 × 10⁻⁴ M luminol concentration for sulphate determination, solutions containing different concentrations (5 × 10⁻⁵–1 × 10⁻² M) were prepared in 50-ml calibrated flasks. Fig. 5 shows the result obtained when using a combined suppressor column for the determination of sulphate in water. A 3.86 × 10⁻³ gave the largest emission signal.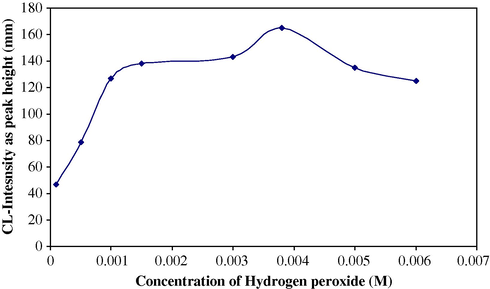
Effect of H2O2 concentration on CL-intensity for sulphate determination.
3.2.4 Luminol concentration
Under the optimized concentrations of H2O2, KBrO3, HCl and other physical parameters the effect of solutions containing different luminol concentrations (5 × 10⁻⁶–1 × 10⁻³ M) prepared in 50-ml calibrated flasks, using 0.1 M Na2CO3 solution to complete the prepared solutions. Fig. 6 shows the variation of chemiluminescence intensity expressed as peak height in (mm) (n = 3). The concentration 1 × 10⁻⁴ M luminol was select as optimum for sulphate determination.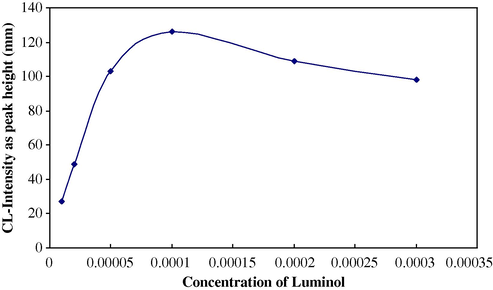
Effect of luminol concentration on CL-intensity for sulphate determination.
From these experiments the optimum reactant concentrations were found to be 0.17 M KBrO3, 0.147 M HCl, 3.86 × 10⁻³ M and 1 × 10⁻⁴ M luminol for determination of sulphate in water by using a combined suppressor column.
3.3 Length of exchanger column, combined suppressor column and delay reaction coil
Effects of different column lengths (2–4 cm) on the CL-intensity were studied. Emission signal recorded as peak height (mm) was 3 for sulphate determination, where the best combined suppressor column lengths were found to be H+-form (0.5 cm), Cl−-form (1.5 cm) and Ag+-form (2 cm) lengths for sulphate determination.
Delay reaction coil length Fig. 1 of 40 cm gave the best result for sulphate determination.
3.4 Calibration graph
The flow injection chemiluminescence system shown in Fig. 1 was used for the determination of sulphate. Calibration graph for sulphate was plotted between sulphate concentration and chemiluminescence intensity. The statistical treatments according to the linear equation are mentioned in Table 1.
Linear range mg/l
Slope (b)
Intercept (a)
r
9.5–48
0.541
45.6
0.999
The linear relationship between the dependent value of (Y) and analyte concentration (x) according to linear equation.
It was found that the calibration graph is linear in the concentration range of 9.5–48 mg/l sulphate.
The precision of the signal was studied by injection of 60 μl of different concentrations five times in a respective manner. Tables 2 and 3 indicate the statistical treatments.
Sample concentration
(mg/l)Mean of peak
height (mm)RSD
(%)
960
137.98
0.06
480
122.03
0.077
96
100.06
0.057
48
66.98
0.08
No.
Region
Temp. (°C)
Depth (m)
Data obtained by the proposed method (mg/l)
SD
n = 5Data obtained by the EDTA method (mg/l)
Relative error (%)
1
Kuran Ainkawa
21.5
154
112
0.056
110
1.81
2
Sixty Street
21
73
258
0.050
252
2.38
3
Rizgary
21.5
116
107
0.071
109
−1.83
4
Building Project
21
146
102
0.047
106
−3.77
According to the optimum conditions detection limits of 0.96 mg/l sulphate were obtained. The signal to noise was found to be 3.
3.5 Application
3.5.1 Determination of sulphate in water
In the determination of sulphate in real sample (water), two important considerations must be taken into account. First, removing interferences for some essential anions associated along with sulphate such as nitrate, chloride, and carbonate. Second, comparing results of this procedure with a standard method for the determination of sulphate.
To achieve that, it was necessary to make an instrumental modification by inserting a mini-combined suppressor column (H+-form, Ag+-form, Cl−-form) into the FIA-CL system shown in Fig. 1 after the sample injection port. The function of the column is illustrated in Fig. 2.
This study includes the determination of sulphate in drinking well waters regularly, and the City was divided geographically into five areas {North, South, Center, East and West of Erbil} to determine the water quality with respect to the presence of sulphate in the water; while many random samples were taken from wastewater in Erbil City to determine sulphate in these samples.
3.5.2 Sampling
Water samples were taken from 20 locations including 26 wells and 8 locations for wastewater, and the sulphate was determined in these samples with respect to temperature and depth in meters.
3.6 Results and discussion
Sulphate was determined according to optimum conditions for the FIA-CL manifold which include suppressor column as shown. The results obtained were compared with the standard procedures of tables including World Health Organization (WHO) classification 1984.
The results are shown in Tables 4–9.
No.
Region
Temp. (°C))
Depth (m)
Data obtained by the proposed method (mg/l)
SD
n = 5Data obtained by the EDTA method (mg/l)
Relative error (%)
1
Manticawa
21.5
137
219
0.071
221
−0.90
2
Azady
21
138
187
0.079
182
2.74
3
Roonaky
21.5
125
121
0.058
123
−1.62
4
Al-Adl
21
131
132
0.041
140
−5.7
No.
Region
Temp. (°C)
Depth (m)
Data obtained by the proposed method (mg/l)
SD
n = 5Data obtained by the EDTA method (mg/l)
Relative error (%)
1
Nawroz/2
21.5
161
182
0.041
187
2.67
2
Nawroz/4
21.5
151
168
0.039
165
−1.81
3
Kurdistan
21.5
136
201
0.067
199
−1.00
4
Al-Umal
21
160
287
0.055
289
0.69
No.
Region
Temp. (°C)
Depth (m)
Data obtained by the proposed method (mg/l)
SD
n = 5Data obtained by the EDTA method (mg/l)
Relative error (%)
1
Shorsh
21.5
203
99
0.089
98
−1.02
2
Braiaty
21.5
156
208
0.078
210
0.95
3
Raparin
21.5
168
153
0.054
156
1.92
4
Officers
21
170
145
0.065
148
2.02
No.
Region
Temp. (°C)
Depth (m)
Data obtained by the proposed method (mg/l)
SD
n = 5Data obtained by the EDTA method (mg/l)
Relative error (%)
1
Khanaqah
21
186
201
0.074
199.7
−0.65
2
Ashty/9
21.5
148
105
0.052
104.3
−0.67
3
Al-Arab/1
21
39
376
0.065
380
1.05
4
Shaikh Choly
21
–
450
0.055
449.2
−0.17
No.
Region
Temp. (°C)
Depth (m)
Data obtained by the proposed method (mg/l)
SD
n = 5Data obtained by the EDTA method (mg/l)
Relative error (%)
1
North Industrial/2
21.5
138
167
0.050
166.5
−0.30
2
North Industrial/1
21.5
106
287
0.048
288
−0.34
3
North Industrial/3
21.5
–
165
0.032
168
1.78
4
Center Storge’s
21
149
398
0.087
401.2
0.79
5
Al-Mamel/1
21.5
140
209
0.074
208.5
−0.23
6
Al-Mamel/4
21.5
150
123
0.062
123.22
0.17
No.
Region
Data obtained by the proposed method (mg/l)
SD
n = 5Data obtained by the EDTA method (mg/l)
Relative error (%)
1
Mantikawa
217
0.052
217.4
0.18
2
Raparin
102
0.042
102.5
0.048
3
Rizgary
220
0.065
219
−0.45
4
Narowz
503
0.087
504.5
0.29
5
Khanaqa
290
0.048
291.2
0.41
6
North Industrial
102
0.056
102.5
0.48
7
South Industrial
114
0.066
115.2
1.041
8
Hospital
112
0.049
114.3
2.01
7 Conclusion
This developed method is used to analyze the sulphate in well waters, natural waters and wastewater. The concentration of measured by this method ranged between 2.33 and higher than 298 mg/l. We obtained the same results by EDTA Titration method. This procedure should not be used for highly contaminated wastewater samples with a high solid content. An alternate procedure will be needed for clean type of samples. The method does not require uncommon or expensive reagents. The proposed procedure provides a very simple, rapid and sensitive method for sulphate determinations. However, it is essential to improve its selectivity so that one or two anions can be determined in the presence of the other. This work is used to determine the concentration of sulphate in water.
References
- JDU. 1999;2:2. (special issue)
- Analytical Chimica Acta. 1980;117:81.
- Talanta. 2006;68:992.
- Analytica Chimica Acta. 1986;179:233.
- Analytica Chimica Acta. 2006;562:216.
- Talanta. 2007;71:1546.
- Journal of Chromatography B. 2009;877:155.
- Clinical Chemistry. 1997;43:657.


