

Translate this page into:
Untargeted metabolomics analysis to unveil the chemical markers for the differentiation among three Gleditsia sinensis-derived herbal medicines by ultra-high performance liquid chromatography/quadrupole time-of-flight mass spectrometry
⁎Corresponding authors at: State Key Laboratory of Component-based Chinese Medicine, Tianjin University of Traditional Chinese Medicine, 10 Poyanghu Road, Jinghai, Tianjin 301617, China. tjdxsyx@163.com (Xue Li), liuwei628@hotmail.com (Erwei Liu), wzyang0504@tjutcm.edu.cn (Wenzhi Yang)
-
Received: ,
Accepted: ,
This article was originally published by Elsevier and was migrated to Scientific Scholar after the change of Publisher.
Abstract
Abstract
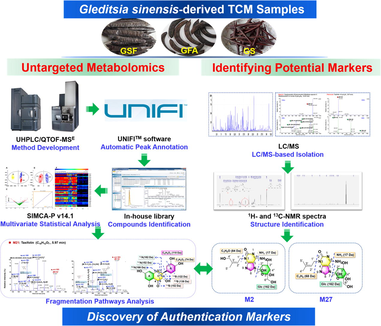
Precise identification and differentiation among those congeneric Traditional Chinese Medicines (TCMs) or derived from the same plant trend to be more challenging, particularly in the absence of appearance characteristics. Three TCMs, involving Gleditsiae Sinensis Fructus (GSF), Gleditsiae Fructus Abnormalis (GFA), and Gleditsiae Spina (GS), recorded in Chinese Pharmacopoeia (2020 edition) are derived from Gleditsia sinensis, but prescribed for different clinical uses. The documents aimed to compare their chemical differences are rare, to date. An untargeted metabolomics approach, based on ultra-high performance liquid chromatography/quadrupole time-of-flight mass spectrometry (UHPLC/QTOF-MS), was elaborated to unveil the potential chemical markers to differentiate among GSF, GFA, and GS. Good chromatographic separation of all the GSF/GFA/GS components was achieved within 33 min by utilizing a BEH C18 column, while data-independent MSE in the positive mode was selected for profiling the metabolic features. Notably, the high-mass saponins (1300–2500 Da) gave unique protonated precursors ([M + H]+) in the positive ESI mode, compared with those complicated ion species occurring in the negative mode. Pattern recognition chemometrics analysis of 45 batches of G. sinensis samples could unveil 70 significantly altered ions assigned as 46 potentially differential components. The positive/negative high-accuracy MS2 data analysis, phytochemical isolation/NMR analysis, and searching of an in-house library of G. sinensis, were utilized for structural elucidation. Three compounds (saikachinoside A, locustoside A, and locustoside B) rich in GSF could be the markers to differentiate from GFA/GS, while four components were characteristic for GS. These results obtained can greatly benefit the quality control of TCMs derived from G. sinensis.
Keywords
Gleditsiae Sinensis Fructus
Gleditsiae Fructus Abnormalis
Gleditsiae Spina
Chemical marker
Untargeted Metabolomics
Quadrupole time-of-flight mass spectrometry

1 Introduction
Traditional Chinese Medicine (TCM), has been used for the prevention and treatment of diseases for thousands of years, and recently has played a crucial role in the Chinese approach to treat and rehab from COVID-19 (He et al., 2020). Researches, aimed to elucidate the chemical basis and the mechanism of action, have greatly driven the process of TCM modernization and internationalization (Lin et al., 2018; Zhang et al., 2019a). Quality control is the practical solution to ensuring the correct use of TCM in clinic, which typically starts with the systematic multicomponent characterization. However, different from the western medicine or chemical drugs, the TCM often contains very complex chemical composition, which is featured by the large spans of acid-base property, polarity, molecular mass, and the content, etc. (Feng et al., 2021). Moreover, it’s very common that the congeneric multiple species (e.g. diverse Panax species), or the different parts of the same plant (such as the root/rhizome, stem, leaf, and flower, etc.), can be utilized as the source for different TCM species, which thus share very similar chemical components (Xu et al., 2021). To authenticate these TCMs and discriminate the adulterants, the simultaneous monitoring of multiple chemical markers has been proven to be feasible (Li et al., 2021; Zhang et al., 2020a), but the difficulty often originates from the discovery of the robust marker compounds which necessitates the consideration of all the components (rich and minor) contained (Choudhary et al., 2020; Liu et al., 2020).
Untargeted metabolomics, with the ability of unbiased detection and extensive coverage, has become an advanced method for the authentication of TCM, because of its holistic property conforming to the “Multi-component & Multi-target” feature of TCM (Cao et al., 2015; Dudzik et al., 2018; He & Zhou, 2021; Wang et al., 2011a; Zhou et al., 2021). The encountered issues that are troublesome to the conventional methods (including the physiochemical identification and thin-layer chromatography), such as the differentiation among the easily confusing species (Zhang et al., 2020a), different geographic origins (Wang et al., 2020), different developmental stages (Liu et al., 2019), and the discrimination of sulfur-fumigation and non-sulfur-fumigation TCM materials (Dai et al., 2017), etc., can be accomplished by the untargeted metabolomics workflows. Holistic metabolites profiling is currently achievable by various approaches, of which liquid chromatography/mass spectrometry (LC-MS) is the most preferably used because of its excellent separation performance and the high sensitivity, selectivity, and universality to most classes of the plant metabolites (Stavrianidi 2020; Wang et al., 2011b). The LC-MS technique has harvested great advances in the recent years greatly driving TCM analysis. On the one hand, multi-dimensional liquid chromatography (MDLC), operating either in the on-line or off-line mode, can integrate twice or more separations largely expanding the peak capacity (Pan et al., 2018; Zhang et al., 2019b). In particular, the selectivity of separation in MDLC can be significantly elevated by combining different mechanisms of chromatography, such as the hydrophilic interaction chromatography (HILIC) and reversed-phase chromatography (RPC), by which hundreds of compound analogs are efficiently characterized (Qiu et al., 2015; Yao et al., 2018). On the other hand, enhanced MSn strategies are currently available which enhance the coverage and sensitivity in characterizing the components of interest. In particular, the precursor ions list-containing data-dependent acquisition (PIL/DDA) endows the targeted precursors with the highest priority to trigger the data-dependent MSn acquisition (Fu et al., 2019). Data-independent acquisition (DIA, such as MSE for Waters QTOF-MS, All Ion Fragmentation-AIF for Thermo Fisher Scientific Q-Orbitrap-MS, and Sequential Window Acquisition for All Theoretical Spectra-SWATH for AB SCIEX QTOF-MS), in theory, is able to cover all the precursor ions to acquire the MS2 data (Shi et al., 2018; Xia et al., 2019). What’s more, the introduction of ion mobility-mass spectrometry (IM-MS) offers an additional dimension of separation for the gas-phase ions based on the charge state, size, and shape (e.g., the SYNAPT series and Vion IM-QTOF from Waters, and 6560 IM-QTOF from Agilent), and the IM-derived collision cross section (CCS) has shown potential to discriminate isomeric metabolites (Liu et al., 2015; Wang et al., 2021; Zhu et al., 2021; Zuo et al., 2020).
The plants from the Gleditsia genus have been utilized as the traditional herbal medicines to treat measles, indigestion, whooping, smallpox, arthrolithiasis, constipation, diarrhea, hematochezia, dysentery, and carbuncle, etc. (Zhang et al., 2016). As a major Gleditsia member in China, G. sinensis L. covers the wide range of medicinal use. Three herbal medicines derived from G. sinensis, including Gleditsiae Sinensis Fructus (GSF), Gleditsiae Fructus Abnormalis (GFA), and Gleditsiae Spina (GS), have been collected in the Chinese Pharmacopoeia (2020 version). Documents have revealed that the saponins and flavonoids are the predominant bioactive ingredients for GSF/GFA/GS (Liu et al., 2016a; Yang et al., 2016; Yu et al., 2019; Zhang et al., 2020b). Based on the TCM theory, GSF and GFA have the same “flavor and meridian tropism” and attending functions, which are largely different from those of GS. Several researches have performed the qualitative and quantitative analyses of these G. sinensis-derived TCMs based on HPLC or LC-MS, mainly focusing on the bioactive saponins and flavonoids (Li et al., 2017; Wang et al., 2018). In particular, an on-line comprehensive 2D-LC/ion-trap-MS approach was established by configuring an Agilent Zorbax Eclipse Plus C18 and a Poroshell 120 Phenyl-Hexyl columns, by which totally 72 saponins (with the molecular mass higher than 1500 Da) got identified or tentatively characterized from GFA (Wang et al., 2016). To clearly elucidate the metabolomic difference among GSF, GS, and GFA, is of great significance to support their correct use in clinic, however, it has been rarely conducted, hitherto.
The aim of this work was to develop a high-efficiency UHPLC/QTOF-MS-based untargeted metabolomics approach to probe into the holistic metabolome difference of three G. sinensis-derived TCMs (GSF/GFA/GS) by analyzing 45 batches of samples, and thus to establish the chemical markers enabling their differentiation. Holistic metabolite profiling was performed based on the reversed-phase UHPLC separation and data-independent MSE acquisition using a Waters Xevo G2-XS QTOF mass spectrometer operating in the positive electrospray ionization (ESI) mode. Key parameters that may affect the performance of UHPLC/QTOF-MSE were optimized by the single-factor experiments. Automatic and straightforward data processing workflows were created using the potent bioinformatics tool, Progenesis QI. Pattern recognition chemometrics (e.g. principal component analysis, PCA; orthogonal partial least squares discriminant analysis, OPLS-DA) and variable importance in the projection (VIP) plot were used to discover the potential differential components among GSF/GFA/GS (Liu et al., 2016b). To characterize those differentiated components, targeted MS/MS experiments in both the positive and negative modes were conducted for the primary structural elucidation, and moreover, some thereof got further confirmed by LC/MS-based isolation and NMR analyses. Hopefully, by this example, high-throughput metabolomics approach can be elaborated to conveniently characterize the marker compounds capable of the differentiation of those TCMs sharing the similar chemical compositions.
2 Materials and methods
2.1 Chemicals and reagents
Twenty-six compounds were used as the reference standards in this work. Isoquercitrin (1), quercitrin (2), (-)-catechin hydrate (14), gallic acid (25), and vanillic acid (26), were from Sichuan WeiKeqi Biological Technology Co., Ltd. (Chengdu, China). Cynaroside (3), kaempferol (4), apigenin (6), dihydrokaempferol (7), taxifolin (8), licochalcone B (10), isoliquiritigenin (11), butein (12), epicatechin (13), vitexin (15), orientin (16), betulin (17), betulinic acid (18), echinocystic acid (20), daucosterol (21), and forsythin (22), were purchased from Chengdu Desite Biotechnology Co., Ltd. (Chengdu, China). Meletin (5), eriodictyol (9), caffeic acid (23), and ethyl gallate (24), were from Shanghai Standard Biotech Co., Ltd. (Shanghai, China). Lupenone (19) was from Chengdu Pusi Biotechnology Co., Ltd. (Chengdu, China). Their purity was ≥ 97%. Structures of these reference standards are exhibited in Fig. 1, and the detailed information is given in Table S1. Acetonitrile, methanol, and formic acid (Fisher, Fair lawn, NJ, USA), were all LC-MS grade. Ultra-pure water was in-house prepared using a Milli-Q Integral 5 water purification system (Millipore, Bedford, MA, USA). Information of the GSF/GFA/GS samples (45 batches in total) is available in Table S2. Their authentication was performed according to the Chinese Pharmacopoeia, and the specimens were deposited at the authors′ laboratory in Tianjin University of Traditional Chinese Medicine (Tianjin, China).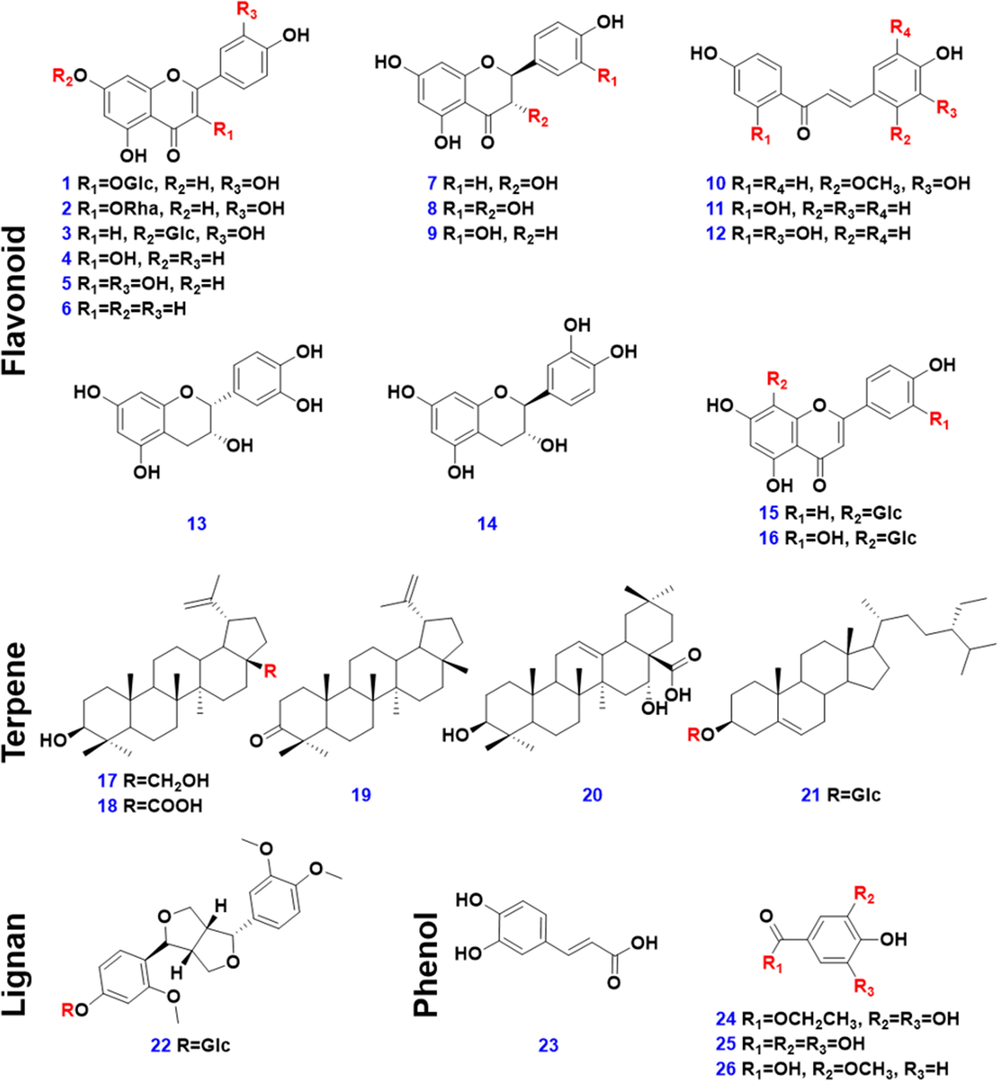
Chemical structures of the 26 reference compounds.
2.2 Preparation of the test solutions
To each of the sample of G. sinensis, 200 mg of the accurately weighed powder was soaked in 8 mL methanol. Samples were extracted on a water bath at 40℃ with ultrasound assistance for 1 h and centrifuged at 3219 g (4000 revolutions per min, rpm) for 10 min. The supernatant was transferred into a 10-mL volumetric flask and diluted to the constant volume. After mixing, the 1 mL of the liquid was transferred into a 1.5-mL EP tube and further centrifuged at 11,481 g (14000 rpm) for 10 min. the resultant supernatant was used as the test solution for 45 batches of G. sinensis-derived TCM samples (with the final concentration at 20 mg/mL). A QC sample (QC1), by mixing the equal volume of three representative samples (T-9/F-11/AF-10, Table S2), was used for the establishment of the LC-MS approach. Another QC sample (QC2), by pooling the equal volume of all test solutions (45 batches), was prepared for monitoring the system stability over the whole analysis batch for chemical markers discovery by untargeted metabolomics.
To the 26 reference compounds, an aliquot of 1.0 mg was accurately weighed and dissolved in methanol yielding a solution at 1 mg/mL as the stock solution for each compound. Equal volume of each stock solution was mixed to prepare four mixed standard samples. After being centrifuged at 11,481 g (14000 rpm) for 10 min, the supernatant obtained was used as the test solutions for the reference compounds.
2.3 Uhplc/Qtof-MSE
Metabolite profiling of G. sinensis was performed on a Waters ACQUITY UPLCTM I-Class Plus system coupled to a Xevo G2-XS QTOF high-resolution mass spectrometer (Waters Corporation, Milford, MA, USA). A Waters ACQUITY UPLC® BEH C18 column (2.1 × 100 mm, 1.7 μm) maintained at 40 °C was used. The mobile phase consisted of 0.1% formic acid in H2O (A) and acetonitrile (B), running in consistency with an optimal gradient program at a flow rate of 0.3 mL/min: 0–7 min: 5–25% (B); 7–8 min: 25–30% (B); 8–15 min: 30–34% (B); 15–16 min: 34–37% (B); 16–20 min: 37–40% (B); 20–20.5 min: 40–62% (B); 20.5–26 min: 62–80% (B); 26–28 min: 80–88% (B); 28–33 min: 88–95% (B); and 33–36 min: 95% (B). The injection volume was 3 μL. The QC2 sample was analyzed after every six injections of G. sinensis samples for monitoring the system stability. Positive MSE data were recorded under the ESI source parameters: capillary voltage, 3.0 kV; sampling cone voltage, 20 V; source offset voltage, 60 V; source temperature, 100 °C; desolvation temperature, 500 °C; cone gas (N2) flow, 50 L/h; and desolvation (N2) flow, 600 L/h. The QTOF mass analyzer scanned over 120–2400 Da to cover saponins under a low collision energy 6 V for full scan (MS1) and a high-energy ramp 10–30 V for MSE. Calibration of the high-resolution MSE data was performed by reference to leucine enkephalin (Sigma-Aldrich, St. Louis, MO, USA; 1 µg/mL) at m/z 556.2771. Data acquisition was controlled by MassLynx V4.1 (Waters). Random injection was adopted, and a blank control sample and the QC2 sample were injected after every six samples.
2.4 Multivariate statistical analysis
Raw MSE data ranging between 0 and 33 min were pretreated using Progenesis QI v2.1 (Waters). The adduct forms, including [M + H]+, [M + Na]+, [M + NH4]+, [M + K]+, and [2 M + H]+, were selected or self-edited. Menu-guide and batched processing finally generated a data matrix involving the information of tR, m/z, and normalized peak area. The obtained metabolic features were filtered by 80% rule and 30% variation limit in turn. The remaining were used as the variates for chemometric analyses by PCA and OPLS-DA facilitated by SIMCA-P v14.1 (Umetrics, Umea, Sweden) after UV scaling (the centered data are divided by the standard deviation of the column variable). Holistic chemical difference among GSF, GFA, and GS was visualized, and the variables showing a VIP value > 8.0 were considered as the major potential markers.
2.5 Elaboration of an in-house library of G. Sinensis
To tackle the lack of specific database in charactering the metabolites from G. sinensis, we sought to create an in-house chemical library, by comprehensively outlining the phytochemistry researches on the species of G. sinensis. The in-house library elaboration was mainly composed by the following steps. 1) Literature searching: focus on the phytochemical research and review of G. sinensis through the public database (e.g. Web of Science, CNKI, and ScienceDirect, etc.). 2) Formulating an Excel table and each structure file: prepare an Excel table with the structure information of each known compound entered and the structure file using the ChemDraw software saved as a single .mol file (name the .mol file consistent with the name of each compound recorded in the Excel table). 3) Import of both the Excel file and all the structure files into the UNIFI™ software.
2.6 Identification of two important marker compounds (saikachinoside A and locustoside A) by LC/MS-based isolation and NMR
To enable more convincing identification for the discovered chemical markers, LC-MS guiding and NMR were utilized to identify representative chemical markers, taking two compounds (M2#: tR, 2.14 min, m/z 398.1675 for [M + H]+; M27#: tR, 4.56 min, m/z 382.1724 for [M + H]+) as the examples. Briefly, the pulverized drug material of Gleditsiae Sinensis Fructus (2.0 kg) was ultrasonically extracted with 75% ethanol twice (v/v, 1 h for each time), and further filtered, yielding the dry extract (582.5 g) after removing the solvent. The crude extract was reconstituted with water and loaded onto a D101 macroporous adsorption resin column, which was sequentially eluted with water, 20%, 40%, 60%, 80%, and 100% ethanol (v/v). Thin layer chromatography (TLC) monitored the combination of elutes, and the combined fractions were further analyzed by LC coupled with an Agilent 6125B quadrupole mass spectrometer configured with an InfinityLab Poroshell 120 EC-C18 column (3.0 × 100 mm, 2.7 µm). The fraction Fr. 3 containing the target compounds was further separated by the MCI column, eluted with gradient ethanol–water (5%, 10%, 15%, 20%, 25%, 30%, and 35% ethanol, v/v). According to TLC examination, 16 MCI subfractions (MFr. 3–1 to 3–16) were obtained. Two samples, MFr. 3–3 (containing M2#) and MFr. 3–7 (containing M27#), were locked by HPLC-MS analysis, which were finally purified by semi-preparative HPLC using a Kinetex® EVO C18 100 Å column (250 × 10.0 mm, 5 µm; mobile phase A: 0.1% ammonia-water, B: acetonitrile, 2.5 mL/min) to obtain compounds M2# (saikachinoside A, 11.0 mg, purity: 98%) and M27# (locustoside A, 13.0 mg, purity: 98%). Chemical structures for these two markers were established by NMR analyses (1H NMR, 13C NMR, and DEPT; M2# in DMSO‑d6 at 500 MHz; M27# in a mixture of CD3OD:D2O = 1:9 at 600 MHz).
3 Results and discussion
3.1 Optimization of a reversed-phase UHPLC/QTOF-MSE approach dedicated to resolving the multicomponents simultaneously from GS, GSF, and GFA
With the view of developing a UHPLC/QTOF-MSE method that enables global profiling of the components simultaneously from GS/GSF/GFA, key parameters affecting the UHPLC separation (e.g. stationary phase, mobile phase, column temperature, and gradient elution program) and QTOF-MS detection (capillary voltage and cone voltage) were optimized. And as the first step, the extraction solvent on the components transformation from was evaluated by testing different ratios of methanol and H2O (pure water, 30% methanol, 50% methanol, 70% methanol, and 100% methanol). The base-peak chromatograms (BPCs) could indicate desirable coverage on both the polar and less-polar components by 50% aqueous methanol (Fig. S1), which was thereby utilized for the sample preparation.
Chromatographic column is a key factor affecting the chromatographic separation due to their differential selectivity and retaining capacity (Feng et al., 2021; Fu et al., 2019; Li et al., 2021). In this section, ten columns, which were purchased from different vendors (Waters, Agilent, and Phenomenex) and involved different silica gel core and functional groups, such as BEH C18, CSH Fluoro-Phenyl, HSS T3, BEH Shield RP18, CSH Phenyl-Hexyl, Cortecs UPLC T3, CSH C18, Zorbax SB-C18, Zorbax Eclipse Plus C18, and Kinetex XB-C18, were examined by observing the overall resolution of the components separated from QC1. Evidently, the BEH C18 (13377), HSS T3 (13275), and Zorbax Eclipse Plus C18 (12810) columns showed better selectivity than the other seven, and BEH C18 thereof was able to resolve the most peaks (Fig. 2). Moreover, the components separated by BEH C18 showed stronger response than HSS T3 and gave better peak shape than Zorbax Eclipse Plus C18. Notably, the BEH C18 column has ethylene bridge hybrid particles bonded with C18, and is suitable for the retention of medium or weak polar compounds with wide pH tolerance range. HSS T3 is a silica-based C18 column with triple bond bonding to reduce the carbon density, which can enhance the retention of polar molecules and is compatible with 100% aqueous phase. Zorbax Eclipse Plus C18 is spherical fully porous silica particle with double-end capped octadecylsilane chemically bonded phase, suitable for the analysis of acidic and neutral samples, and able to give improved peak shape for the basic compounds. Taking into account of the peak shape and selectivity, we selected the BEH C18 column in the subsequent experiments. Moreover, alternation of column temperature (25–40 °C) on the separation was evaluated, but very minor influence was witnessed (Fig. S2). Comparatively, the setting at 40 °C enabled the separation of the most peaks, which was thus chosen. The gradient elution program was carefully adjusted, which finally achieved the desirable resolution of the major peaks.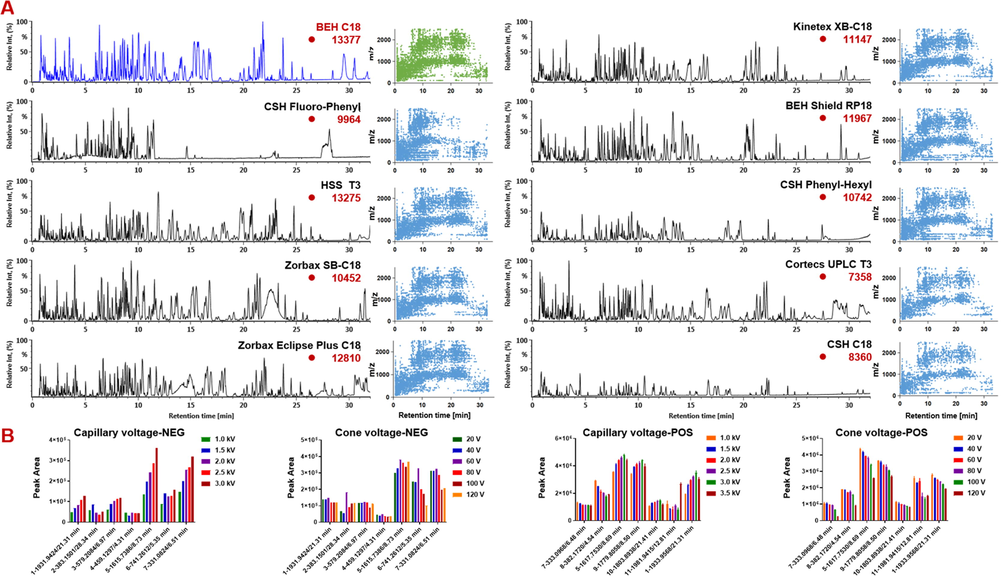
Method development for the reversed-phase UHPLC/QTOF-MSE approach. A-Selection of the stationary phase for the UHPLC separation by evaluating the base peak chromatograms (in the negative ESI mode) of QC1 on ten different sub-2 µm particles packed chromatographic columns; B-optimization of key parameters (capillary voltage and cone voltage) of the Waters Xevo G2-XS QTOF mass spectrometer in both the negative and positive ESI modes. In ESI-: 1: 21.31 min, m/z 1931.9424; 2: 28.34 min, m/z 383.1501; 3: 6.97 min, m/z 579.2084; 4: 4.31 min, m/z 459.1297; 5: 8.73 min, m/z 1615.7386; 6: 5.35 min, m/z 741.2612; 7: 6.51 min, 331.0824. In ESI+: 1: 21.31 min, m/z 1933.9568; 5: 8.69 min, m/z 1617.7530; 7: 6.48 min, m/z 333.0968; 8: locustoside A; 9: 8.50 min, m/z 1779.8058; 10: 21.41 min, m/z 1803.8938; 11: 12.81 min, m/z 1981.9415.
Capillary voltage and cone voltage are two key source parameters for the Xevo G2-XS QTOF mass spectrometer, of which the former determines the ionization efficiency and the latter affects the adduct ions and can cause the in-source fragmentation. The effects of capillary voltage (1.0–3.5 kV) and cone voltage (20–120 V) were assessed by comparing the ion response of the indicator components (negative mode: 1–7; positive mode: 1, 5, 7, and 8–11). In the positive mode, the alternations in the ion intensity showed compound-dependent characteristics while capillary voltage increased, and generally the setting between 2.0 and 3.0 kV could give rise to high response for most indicators. We thus chose to set the capillary voltage at 3.0 kV. Different variation trends were observed for the indicators when increasing cone voltage from 20 to 120 V, for which the response intensity negatively correlated to the ascended cone voltage. Therefore, the cone voltage of 20 V was selected. In the negative mode, the increasing of capillary voltage could favor the obtaining of high response for most of the indicator compounds, which prompted to select 3.0 kV as the negative capillary voltage. Compound-dependent intensity variation was also detected when increasing the cone voltage, and the setting of 60 V could be a good choice to balance all the indicator components. These optimal settings were adopted in the following untargeted metabolomics experiments.
3.2 Application of UHPLC/QTOF-MSE-based untargeted metabolomics to unveil the potential markers among GS, GSF, and GFA
Metabolomics can measure the global variations and changes of the small-molecule metabolites among different groups, which the untargeted mode more suits the discovery of potential marker compounds (Li et al., 2021; Shi et al., 2018; Wang et al., 2020). Global difference in the chemical compositions (mainly covering the secondary metabolites) among three G. sinensis-derived TCMs (GS/GSF/GFA) was probed following the untargeted metabolomics workflows.
Firstly, we assessed the ionization complexity of G. sinensis components between the negative and positive ESI modes. It was clear that, the ion species for the precursors in the negative mode was rather complex than those in the positive mode (Fig. S3). By ESI+, only the protonated molecules ([M + H]+) were generated for the saponin and flavonoid compounds. However, diverse doubly charged deprotonated ions of dimers-FA adducts and the monomers-FA adducts were observed in the negative mode for the saponin, while the deprotonated molecules, dimers, and even trimers, were readily generated for the flavonoid. To obtain simple MS1 information directly reflecting the contents, we applied UHPLC/QTOF-MSE in the positive mode to monitor the chemical compositions (120–2400 Da) of 45 batches of G. sinensis samples (Table S2). Secondly, the raw MSE data were pretreated using the informatics tool, Progenesis QI, to perform the data correction, peak alignment, and peak extraction, which could generate a data matrix consisting of totally 48,011 metabolic features (tR VS m/z). The metabolic features were further filtered by several criteria to simplify the marker discovery (80% rule and 30% variation limit). Thirdly, the resultant 33,912 metabolic features were used as the variables for chemometric analysis by PCA (unsupervised) and OPLS-DA (supervised), to deduce the potential marker components among GSF/GFA/GS.
PCA score plot displayed very tight clustering of the QC data, indicating good quality for the obtained multi-batch metabolomics data (Fig. S4). In addition, the GS group was remarkably separated from the others, while some samples of GSF and GFA were mixed, which informed the large chemical difference of GS from the other two. Base peak chromatograms of representative GSF (F-11), GFA (AF-10), and GS (T-9) samples, could intuitively embody the metabolomic difference among G. sinensis-derived three TCMs (Fig. 3). An outlier (F-6, from Shandong) was observed. Supervised OPLS-DA (Fig. 4A and 4B) and VIP values (Fig. 4C) were further utilized to exploit the potential marker components. As a result, complete separation among the GS, GSF, and GFA groups was accomplished in the score plot (Fig. 4A), while GFA and GSF that showed less separation could be completely grouped into two clusters (Fig. 4B). A total of 4596 ions were found displaying VIP > 1.0. To screen the major differential components, in the current work, we selected to analyze those with VIP > 8.0, and consequently, 70 differential ions among GSF/GFA/GS were obtained (Fig. 4C). Accordingly, 46 differential components were identified or tentatively characterized based on the integrated analysis of the positive and negative mode MSE data, and the searching of the in-house library (Table S3) and the literature. Detained information for these 46 potential markers is given in Table S4. High sensitivity and specificity were observed for these discovered differential ions, as the AUC reached 1.0 for the ROC curve (Fig. 4D). The heat map directly reflected the variations of the contents for these 46 significantly different components and the clustering of GSF, GFA, and GS, among the 45 batches of G. sinensis samples (Fig. 4E).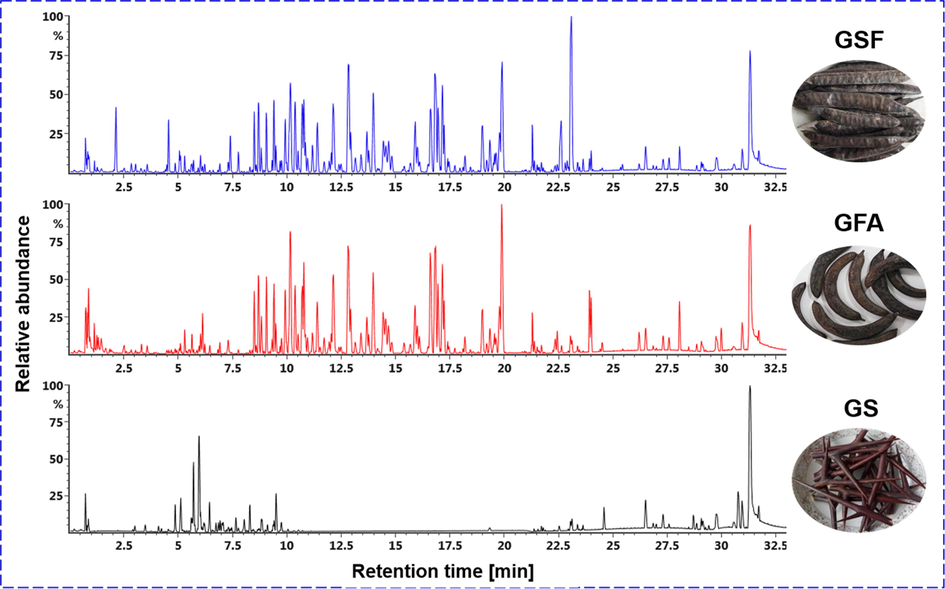
Base peak chromatograms (BPCs) of three herbal medicines derived from G. sinensis L.
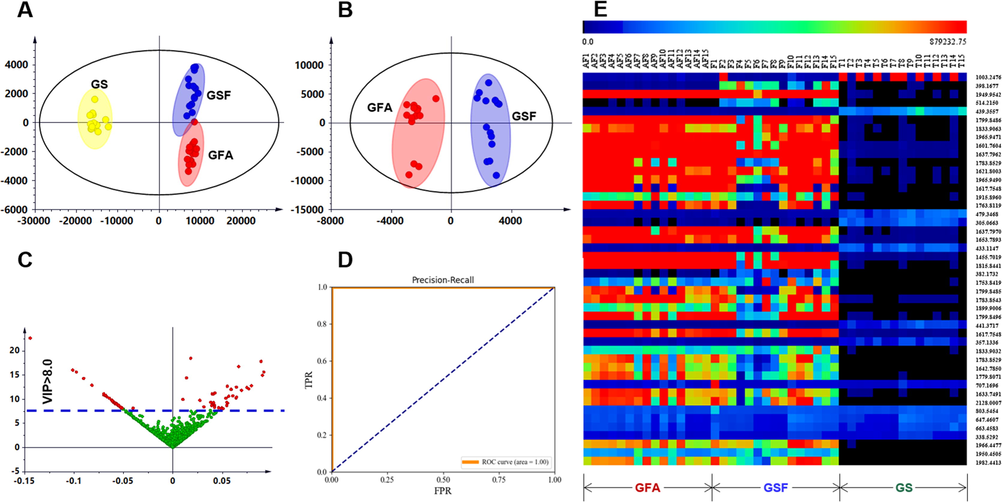
Multivariate statistical analysis of the positive MSE data for 45 batches of G. sinensis samples. A: OPLS-DA score plot of GSF/GFA/GS (GSF: Gleditsiae Sinensis Fructus, GFA: Gleditsiae Fructus Abnormalis, and GS: Gleditsiae Spina); B: OPLS-DA score plot of GSF/GFA; C: VIP plot with the cutoff at 8.0; D: ROC curve; E: Heat map displaying the content differences of 46 potential markers.
3.3 Structural elucidation of the discovered 46 differential components by automatic peak annotation workflows facilitated by UNIFI and the phytochemical isolation
The bioinformatics software platform UNIFI (Waters), by searching commercial or in-house library, can facilitate automatic peak annotation rendering highly reproducible characterization results independent of the professional skills (Wang et al., 2020; Wang et al., 2021). We applied the well-established UNIFI-based computational workflows to identify the potential marker components discovered by untargeted metabolomics (Zuo et al., 2020). Because of the lack of commercial database specific for G. sinensis, we sought to establish an in-house library of G. sinensis by searching the phytochemistry researches and summarizing the known compounds. Consequently, the chemical library contained the names, molecular formulae, and chemical structures of 203 known components (including 44 triterpenoid saponins, 14 triterpenoids, 10 alkaloids, 36 flavonoids, 15 flavonoid glycosides, 25 lignans, 18 phenols, 12 phenylpropanoids, 5 sterols, 4 amines, 6 coumarins, and 14 others). After processing by UNIFI, the components characterized from three G. sinensis samples were listed in a table, namely “Identified Components”. By comparing the retention time and high-accuracy MS1 data of these 70 differential ions with those in the “Identified Components” table, we could characterize 46 potential marker components (including 30 saponins, 2 terpenoids, 2 flavonoids, 4 alkaloids, and 8 others; Table S4). Adduct ions filtering and fragmentation pathways analysis based on the MS2 data analysis were performed to remove the possible false positive characterization results and confirm the ultimate identities.
3.3.1 Characteristic components (M2#/M7#/M27#) for GSF
The box charts of 46 characterized potential markers among GSF, GFA, and GS, are given in Fig. S5, which were utilized to screen the characteristic components that could be used as the markers for their differentiation. As a result, three key markers, including M2#, M7#, and M27#, were found characteristic for GSF, with the extracted ion chromatograms (EICs) of representative GS/GSF/GFA samples shown in Fig. 5. Evidently, they were relatively rich in GSF, but very rare in the other two species (GFA/GS). To enable the reliable structural elucidation, M2# and M27# were isolated from GSF guided by LC-MS, and their structures were established by both MS and NMR analyses.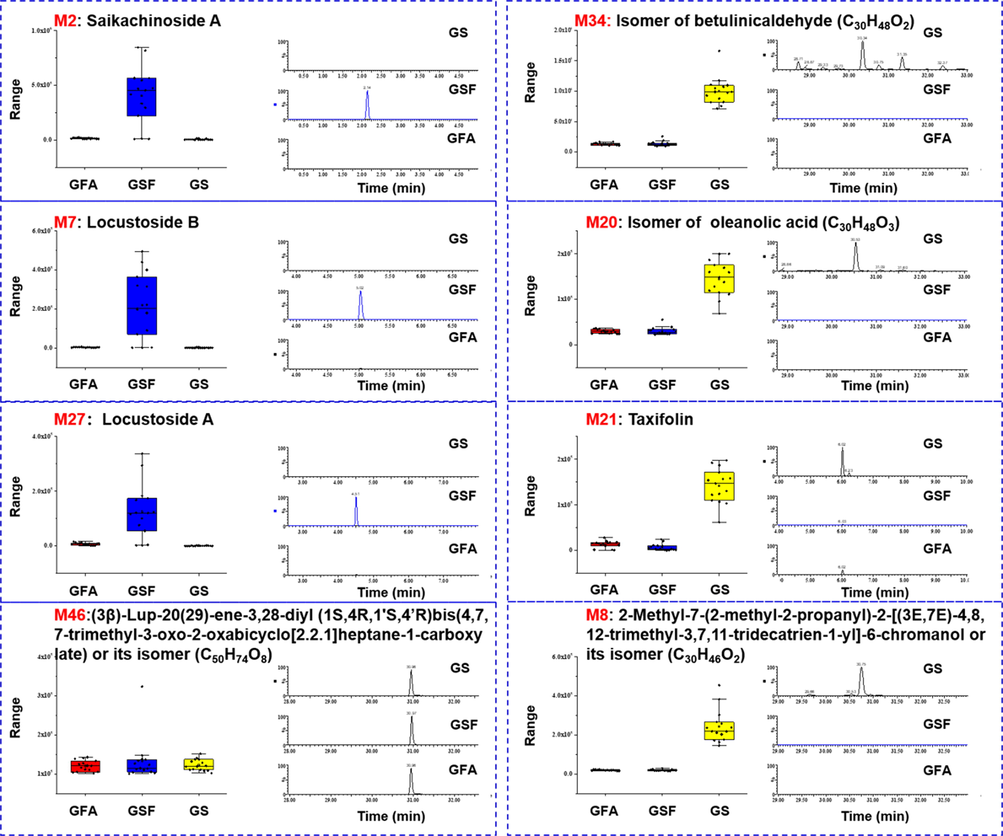
Box plots for the markers of GSF (M2#/M7#/M27#) and GS (M8#/M20#/M21#/M34#), and the corresponding extracted ion chromatograms (EICs) of three typical G. sinensis samples. M46 was used as the internal standard to calculate the peak area ratio.
M27# (tR: 4.56 min) exhibited rich molecular ions at m/z 382.1724 for [M + H]+ and 380.1570 for [M−H]–, based on which the molecular formula was established as C16H23N5O6. The UV (MeOH; 1.0 mg/mL) spectrum showed strong absorption peaks at 246 and 290 nm, suggesting the presence of a 3,7-disubstituted isoguanine skeleton (Kajimoto et al., 2010a), which could be supported by the 1H and 13C NMR data [δH 8.14 (s, 1H, H-8), δC 158.1 (C-2), 153.9 (C-4), 104.8 (C-5), 154.9 (C-6), 145.2 (C-8)]. Analysis of the 1H and 13C NMR data (Table S5), together with the DEPT spectrum, revealed the presence of two olefinic methyls [the C-4′ hydrogen signal at δH 1.68 (s, 3H) and the C-5′ hydrogen signal at δH 1.77 (s, 3H)], two hetero atom bearing methylenes [δC 42.8 (C-1′) and 88.1 (C-1″)], five oxygenated methines [δC 73.5 (C-2″), 76.7 (C-3″), 69.2 (C-4″), 80.1 (C-5″), 60.1 (C-6″)], an olefinic methine [the C-2′ hydrogen signal at δH 5.14 (t, J = 7.2 Hz, 1H)], and a quaternary olefinic carbon [δC 139.2 (C-3′)], in addition to the isoguanine unit. The presence of an isopentenyl unit could be testified by the transitions of m/z 382 ([M + H]+) → 314.1099 ([M + H–C5H8]+) and m/z 218 ([M−H−Glc]–) → 150.0420 ([M−H−Glc−C5H8]–) in the positive and negative MS/MS spectra, respectively (Fig. 6). What’s more, the presence of a hexose unit which was supported by the transition of m/z 314 ([M + H–C5H8]+) → 152.0570 ([M + H–C5H8–C6H10O5]+) in ESI + and m/z 380 ([M−H]–) → 218.1043 ([M−H−C6H10O5]–) in ESI–. By comparing the NMR data with the literature (Kajimoto et al., 2010a), M27# was identified as locustoside A (corresponding to compound 167 in the in-house library; Table S3). The similar approaches were utilized to establish the chemical structure of M2# (tR: 2.14 min). Its molecular formula was established as C16H23N5O7, based on the predominant precursor ions detected at m/z 398.1675 ([M + H]+) and 396.1517 ([M−H]–). The presence of an isoguanine unit was supported by the 1H and 13C NMR (DMSO‑d6) chemical shifts [δH 8.09 (s, 1H, H-8), δC 154.9 (C-2), 153.0 (C-4), 102.6 (C-5), 153.5 (C-6), 142.9 (C-8)]. The containing of a hexose could be informed by the transition of m/z 398 ([M + H]+) → 236.1144 ([M + H–C6H10O5]+) and m/z 396 ([M−H]–) → 234.0994 ([M−H−C6H10O5]–) in the positive and negative MS/MS spectra, respectively (Fig. 6), and further confirmed as β-D-glucose because of the signal δH 5.42 (d, J = 8.5 Hz, 1H; H-1″), δH 3.33–3.66 showing 6 signals of hydrogen on the sugar, and δC 86.4 (C-1″) together with the other 5 carbon signals [δC 72.5 (C-2″), 76.3 (C-3″), 68.0 (C-4″), 79.3 (C-5″), 58.9 (C-6″)]. Similar to M27#, a rich fragment at m/z 314.1100 was observed, which should be dissociated from the protonated precursors by eliminating 84 Da ([M + H–C5H8O]+). While the NMR data, [δH 4.59 (H-1′), 5.26 (H-2′), 4.11 (H-4′), 1.68 (H-5′); δC 121.0 (C-2′), 139.4 (C-3′), 59.9 (C-4′), 21.3 (C-5′)], could testify the presence of a hydroxylated isopentyl, consistent with an additional mass of 84.0575 Da (C5H8O). The comparison with the literature could assist to identify M2# as saikachinoside A, consistent with compound 166 in the in-house library (Table S3; Kajimoto et al., 2010b).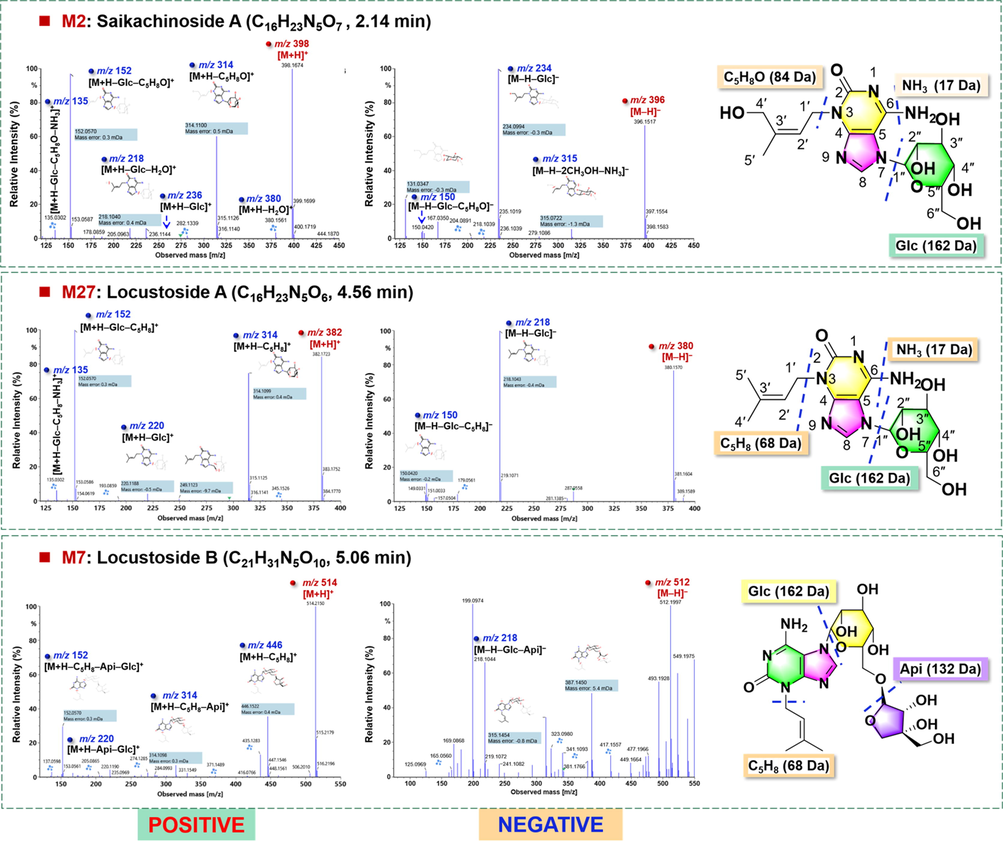
Fragmentation pathways analysis for the characterization of three marker compounds (M2#/M27#/M7#) for GSF.
M7# (tR: 14.35 min) was characterized as a furanose analogue of M27#. The protonated precursor ion at m/z 514.2150 ([M + H]+) and 512.1997 ([M−H]–) could suggest the molecular formula C21H31N5O10, indicative of one pentose more than M27#. By the MS/MS fragmentation in the positive mode, the typical product ions of m/z 446.1522 consistent with the elimination of the isopentane group ([M + H–C5H8]+), m/z 314.1098 because of the combinational loss of pentose + C5H8 ([M + H–C5H8–pentose]+), m/z 220.1190 by losing all the sugars ([M + H–pentose–Glc]+), as well as m/z 152.0570, were observed (Fig. 6). The alkaloid skeleton fragment at m/z 218.1044 was detected by the negative MS/MS fragmentation. By comparison with the literature (Harauchi et al., 2017), M7# was tentatively characterized as locustoside B (in accord with compound 171 in the in-house library, Table S3).
3.3.2 Characteristic components (M8#/M20#/M21#/M34#) for GS
In the similar manner, by analyzing the box charts, four components, including M8#, M20#, M21#, and M34#, were found characteristic for GS. It was clear, they were of certain content in GS, but almost undetectable in GFA and GSF (Fig. 5). By comparison with the reference compounds, M21# (5.97 min, C15H12O7) was identified as taxifolin (a flavonone compound; Table S4). Structural elucidation of the other three components (M8#/M20#/M34#), characteristic for GS, was conducted based on the MS data analysis.
M20# (tR: 30.55 min) gave rich precursor ions of m/z 457.3678 ([M + H]+)/479.3497 ([M + Na]+) by ESI+, and m/z 455.3515 ([M−H]–)/501.3572 ([M−H + HCOOH]–) by ESI–, based on which its molecular formula was established as C30H48O3. The positive-mode MS/MS fragmentation yielded the fragments of m/z 411.3619 by losing formic acid ([M + H–HCOOH]+), together with a series of fragments due to ring B cleavage (m/z 301.2163, 243.2109, and 137.1324), while the negative dissociation could generate the fragments at m/z 327.2897, 255.2325, and 237.2199, ascribed to the fragments because of ring cleavages (Fig. 7). In this experiment, we compared the retention time of M20# with those of the reference compounds, betulinic acid (25.78 min), oleanolic acid (26.24 min), and ursolic acid (26.36 min), but matched none of them. Accordingly, M20# was tentatively identified as an isomer of oleanolic acid (Table S4). M8# (tR: 30.77 min) exhibited the protonated molecular ion at m/z 439.3573, and accordingly, its molecular formula was calculated as C30H46O2. The MS/MS spectrum gave fragments at m/z 421.3459 ([M + H–H2O]+), 327.2684 ([M + H–C8H16]+), 233.1899 ([M + H–C15H26]+), and 191.1794 ([M + H–C18H32]+) (Fig. 7). The deduced molecular formula (C30H46O2) received no hit in the in-house library of G. sinensis, but was consistent with 2-methyl-7-(2-methyl-2-propanyl)-2-[(3E,7E)-4,8,12-trimethyl-3,7,11-tridecatrien-1-yl]-6-chromanol in the ChemSpider database. M8# was thus inferred to be this compound or its isomer. The retention time of M34# was observed at 28.70 min, and its molecular formula was deduced as C30H48O2, based on the positive protonated precursor ion at m/z 441.3729. By the MS/MS fragmentation, the fragments of m/z 423.3623 ([M + H–H2O]+) and 411.3622 ([M + H–HCOH]+) were generated. In addition, the fragments resulting from the cleavage of ring C were observed at m/z 233.1899 and 203.1796. By molecular formula searching, none was matched in the in-house library. Assisted by further searching the ChemSpider database, M34# was tentatively characterized as isomer of betulinaldehyde (Bhattacharyya et al., 1976).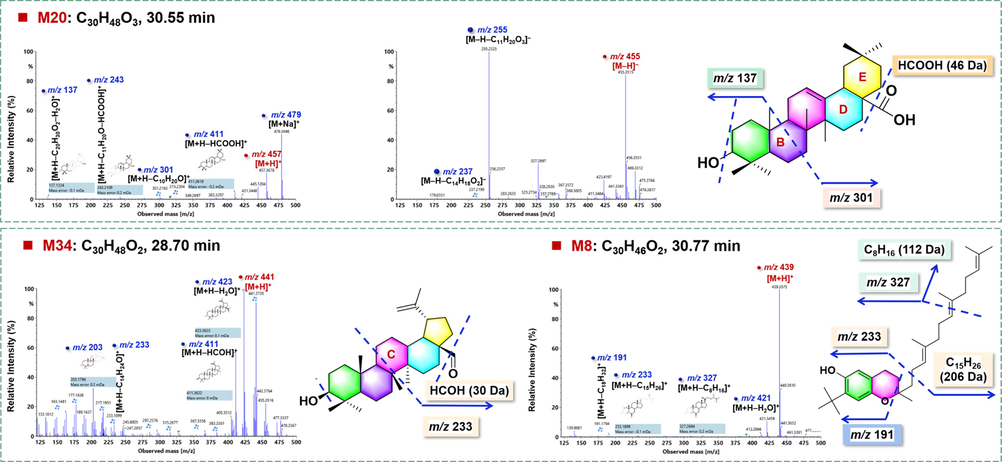
Fragmentation pathways analysis for the characterization of three marker compounds (M20#/M34#/M8#) for GS.
3.3.3 Characterization of triterpenoid saponins
Saponins are the most abundant bioactive ingredients occurring to G. sinensis, most of which have an oleanane or lupine skeleton (Zhang et al., 2016). The oleanane-type sapogenins mainly involve oleanolic acid (OA; C30H48O3) and 16α-hydroxyl oleanolic acid (echinocystic acid; EA; C30H48O4). The monosaccharide composing the saponins include glucose (Glc, 162.0528 Da), arabinose (Ara, 132.0423 Da), xylose (Xyl, 132.0423 Da), and rhamnose (Rha, 146.0579 Da), while some saponins are esterified with 6(R)-6-hydroxy-2,6-dimethyl-2,7-octadienolic acid (Ter, additional C10H16O3, 184.1099 Da) or 6(R)-6-hydroxy-2-hydroxymethyl-6-methyl-2,7-octadienolic acid (Ter-OH, additional C10H16O4, 200.1049 Da). In both the OA- and EA-type saponins, they could be ionized by the positive and the negative ESI modes. What’s different, the precursor ions by ESI– were very complex (e.g. [M−H]–, [M−H + HCOOH]–, and [M−2H]2–, etc), however, in the positive mode, only the [M + H]+ ions were readily observed. As previously reported (Wang et al., 2016), The deduced fragmentation rules mainly involve: 1) the characteristic fragmentations of G. sinensis saponins were the B/Y cleavage in the α chain (glycosylated to 28-COOH), easily generating the [Y0α]– in ESI– and [Bα]+ in ESI+; 2) the product ions ranging m/z 700–900 were useful for identifying the sapogenins. These reported features, elemental composition analysis based on the high-resolution MS1 data, and searching of an in-house library of G. sinensis, were utilized for structural elucidation of the potential saponin markers. For the convenient expression, Xyl was used to represent all the pentose residues characterized by 132.0423 Da (Table S4).
Structural elucidation of M3# was taken as an example for identifying the EA-type saponin markers. It gave abundant precursor ions at m/z 1965.9487 ([M + H]+) by ESI + and m/z 2009.9390 ([M−H + HCOOH]–) by ESI–, which could inform the molecular formula as C94H148O43. The MS/MS fragmentation of the [M + H]+ precursors yielded a series of sugar-eliminating product ions at m/z 1701.8638 for [M + H–2Xyl]+, m/z 1423.7630 for [M + H–3Xyl–Rha]+, and m/z 1291.7215 for [M + H–4Xyl–Rha]+ (Fig. 8). The fragment of m/z 1067.4556 was the characteristic fragment of [Bα + H]+, accompanied by m/z 935.4136 due to the further elimination of Xyl ([Bα + H–Xyl]+). What’s more, the fragment of m/z 477.2491 ([Rha+(Ter-OH) + Ter + H–H2O]+) could be a fragment of [Bα + H]+, while m/z 455.3527 could be assigned as [EA + H–H2O]+. By the negative-mode MS/MS, the deprotonated molecular ion of m/z 1964.9353 could continuously eliminate H2O (18 Da), HCOH (30 Da), C10H14O3 (182 Da), and C10H16O4 (200 Da), yielding the fragments at m/z 1946.9255, 1934.9246, 1782.8400, and 1764.8296, respectively, which were representative of the cleavages of the Ter-OH group. The combined loss of the Ter group generated a fragment at m/z 1598.7300. Notably, the medium-intensity ion of m/z 897.4852 was the characteristic fragment of [Y0α–H]–, accompanied by m/z 879.4745 after eliminating H2O. A fragment at m/z 469.1558 was assigned as [EA–3H]– obtained by eliminating both two saccharide chains. Based on these MS evidences, M3# was tentatively characterized as EA-2Glc-2Rha-4Xyl-(Ter-OH)-Ter, presumably as Caspicaoside J/ Caspicaoside K/Gleditsia saponin C/Gleditsioside E or their isomer (Table S4; Melek et al., 2014; Zhang et al., 1999b). Analogously, the other 17 markers (M4#, M5#, M9#, M10#, M11#, M16#, M17#, M18#, M23#, M26#, M31#, M33#, M36#, M38#, M41#, M44#, and M45#) were identified as the EA-type saponins.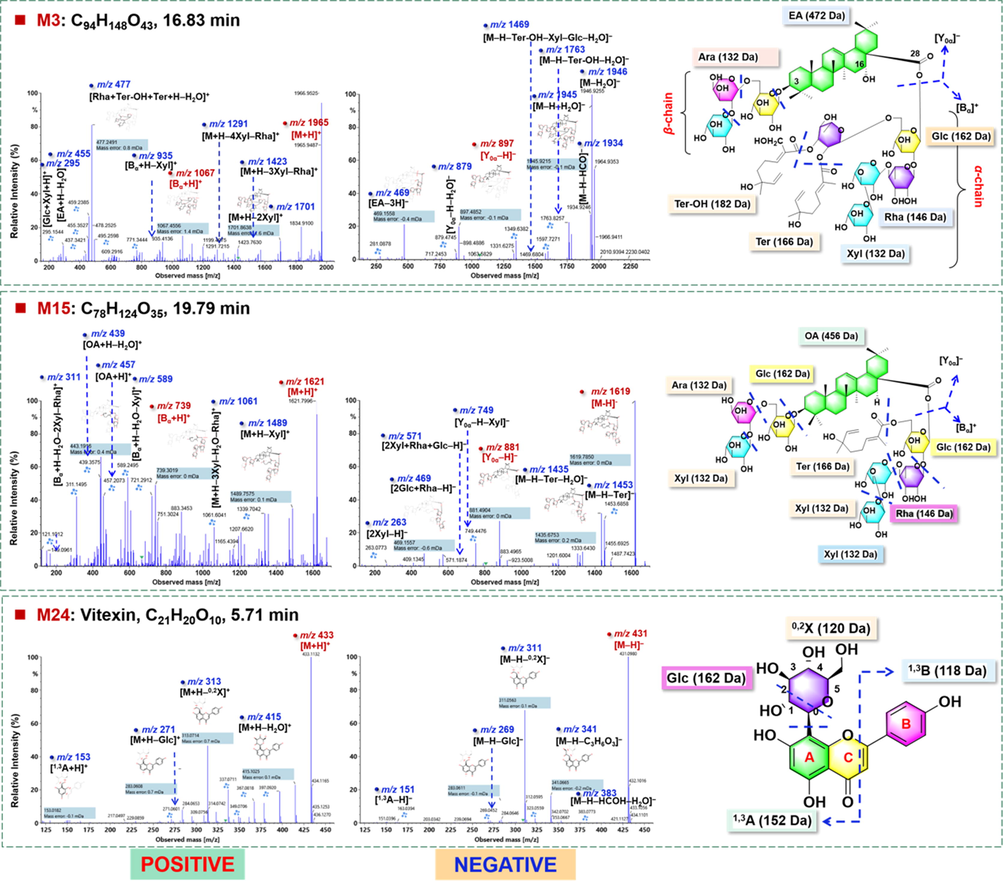
Fragmentation pathways analysis for the characterization of the representative EA- (M3#) and OA-type (M15#) saponin compounds and a flavonoid compound (M24#).
The high-accuracy MSE data of M15# (tR: 19.79 min) in both the positive and negative modes were analyzed as an example to illustrate the characterization of the OA-type saponin markers. Rich precursor ions at m/z 1621.7996 for [M + H]+ in the positive mode and m/z 1619.7795 for [M−H]–, 1665.7855 for [M−H + HCOOH]– in the negative mode, could aid to deduce the molecular formula as C78H124O35. Upon the positive MS/MS fragmentation, the fragments characteristic for the neutral losses of sugars were observed at m/z 1489.7575 for [M + H–Xyl]+ and 1061.6041 for [M + H–3Xyl–H2O–Rha]+. In addition, the diagnostic [Bα + H]+ fragment was detected at m/z 739.3019, together with its secondary fragments at m/z 589.2495 and 311.1495. Different from the EA-type, the entire sapogenin ion of OA could be generated at m/z 457.2073 ([OA + H]+), as well as its fragment of m/z 439.3575. The similar fragmentation pathways to those EA-type were observed in the negative mode, featured by the neutral loss of sugars and the Ter group (m/z 1453.6858 and 1435.6753). The characteristic [Y0α–H]– fragment at m/z 881.4904, together with its fragment of m/z 749.4476, could inform the β-sugar chain composed by Glc-Xyl-Xyl. By searching the in-house library, we tentatively characterized M15# as gleditsioside A or isomer (OA-4Xyl-2Rha-2Glc-Ter) (Fig. 8; Zhang et al., 1999a). In the similar manner, the other 11 markers (M6#, M12#, M13#, M14#, M19#, M22#, M25#, M28#, M30#, M32#, and M39#) were identified as the OA-type saponins (Table S4).
3.3.4 Characterization of flavonoids
Flavonoids have been known a class of bioactive compounds for G. sinensis, involving free flavonols, flavanonols, and flavone-O-/C-glycosides (Zhang et al., 2016). In addition to M21#, one characteristic compound for GS which was identified as taxifolin, M24# (tR 5.71 min, C21H20O10) was another marker compound identified as vitexin (Mohammed et al., 2014).
4 Conclusion
In this work, a UHPLC/QTOF-MSE-based untargeted metabonomics approach was established, aimed to compare the holistic metabolome difference and discover the potential chemical markers facilitating the differentiation among three G. sinensis-derived TCMs (GSF, GFA, and GS). Good chromatographic separation was achieved on a BEH C18 column with numerous peaks resolved (<33 min). The positive-mode ESI could efficiently ionize the multicomponents from G. sinensis, giving the sole precursor ions which were much simpler than those obtained in the negative mode. Untargeted metabolomics workflows based on UHPLC/QTOF-MSE profiling by ESI + and chemometrics analysis were established, which were employed to compare the metabolome difference among GSF/GFA/GS. Totally 46 differential components were discovered and structurally established by LC-MS, phytochemical isolation, and NMR analyses. Generally, GSF and GFA exhibited similar metabolome composition, which were largely different from that of GS. Saikachinoside A, locustoside A, and locustoside B, were rich in GSF, but very minor in GFA and GS, while four preliminarily characterized components (2-Methyl-7-(2-methyl-2-propanyl)-2-[(3E,7E)-4,8,12-trimethyl-3,7,11-tridecatrien-1-yl]-6-chromanol or isomer, isomer of oleanolic acid, taxifolin, isomer of betulinaldehyde) were characteristic for GS. By applying these seven marker compounds, these three TCMs derived from G. sinensis could be completely differentiated. The approaches established can be utilized to discover the marker compounds capable of the precise identification of the TCMs that share similar chemical compositions, and the results obtained will benefit the quality control and support the correct use of G. sinensis-derived TCMs in clinic.
Acknowledgments
This work was financially supported by National Natural Science Foundation of China (Grant No. 81872996), Tianjin Committee of Science and Technology of China (Grant No. 21ZYJDJC00080), and Natural Science Foundation of Tianjin of China (Grant No. 20JCYBJC00060).
Declaration of Competing Interest
The authors declare that they have no known competing financial interests or personal relationships that could have appeared to influence the work reported in this paper.
References
- The isolation from Sarracenia Flava and partial synthesis of betulinaldehyde. Phytochemistry. 1976;15(3):432-433.
- [CrossRef] [Google Scholar]
- The application of metabolomics in traditional Chinese medicine opens up a dialogue between Chinese and Western medicine. Phytother. Res.. 2015;29(2):159-166.
- [CrossRef] [Google Scholar]
- Development and validation of a novel, rapid gradient HPLC method for simultaneous estimation of bioactive marker compounds in a mixture of Convolvulus Pluricaulis, Withania Somnifera and Bacopa monnieri extracts. J. Chromatogr. Sci.. 2020;57(10):920-930.
- [CrossRef] [Google Scholar]
- Novelty application of multi-omics correlation in the discrimination of sulfur-fumigation and non-sulfur-fumigation Ophiopogonis Radix. Sci. Rep.. 2017;7:9971.
- [CrossRef] [Google Scholar]
- Quality assurance procedures for mass spectrometry untargeted metabolomics. a review. J. Pharm. Biomed. Anal.. 2018;147:149-173.
- [CrossRef] [Google Scholar]
- Configuration of the ion exchange chromatography, hydrophilic interaction chromatography, and reversed-phase chromatography as off-line three-dimensional chromatography coupled with high-resolution quadrupole-Orbitrap mass spectrometry for the multicomponent characterization of Uncaria sessilifructus. J. Chromatogr. A. 2021;1649:462237
- [CrossRef] [Google Scholar]
- Simultaneously targeted and untargeted multicomponent characterization of Erzhi Pill by offline two-dimensional liquid chromatography/quadrupole-Orbitrap mass spectrometer. J. Chromatogr. A. 2019;1584:87-96.
- [CrossRef] [Google Scholar]
- Analysis on application of Chinese materia medica in treatment of COVID-19 by suppressing cytokine storm. Chin. Tradit. Herb. Drugs.. 2020;51(6):1375-1385.
- [CrossRef] [Google Scholar]
- Prenylated purine alkaloids from seeds of Gleditsia japonica. Phytochemistry. 2017;143:145-150.
- [CrossRef] [Google Scholar]
- How to identify “material basis–Quality markers” more accurately in Chinese herbal medicines from modern chromatography-mass spectrometry data-sets: Opportunities and challenges of chemometric tools. Chin. Herb. Med.. 2021;13(1):2-16.
- [CrossRef] [Google Scholar]
- Locustoside A-A new purine alkaloid glucoside from seeds of Gleditsia japonica. Phytochem. Lett.. 2010;3(4):198-200.
- [CrossRef] [Google Scholar]
- Saikachinoside A, a novel 3-prenylated isoguanine glucoside from seeds of Gleditsia japonica. Tetrahedron Lett.. 2010;51(16):2099-2101.
- [CrossRef] [Google Scholar]
- Ultra-high performance liquid chromatography/ion mobility time-of-flight mass spectrometry-based untargeted metabolomics combined with quantitative assay unveiled the metabolic difference among the root, leaf, and flower bud of Panax notoginseng. Arab. J. Chem.. 2021;14:103409
- [CrossRef] [Google Scholar]
- HPLC-MS/MS determination of flavonoids in Gleditsiae Spina for its quality assessment. J. Sep. Sci.. 2017;41:1752-1763.
- [CrossRef] [Google Scholar]
- Internationalization of traditional Chinese medicine: current international market, internationalization challenges and prospective suggestions. Chin. Med.. 2018;13:9-15.
- [CrossRef] [Google Scholar]
- A new triterpenoid saponin from Gleditsia sinensis and its antiproliferative activity. Nat. Prod. Res.. 2016;30(18):2065-2070.
- [CrossRef] [Google Scholar]
- Quality evaluation of traditional Chinese medicines based on fingerprinting. J. Sep. Sci.. 2020;43(1):61-67.
- [CrossRef] [Google Scholar]
- Mass spectrometry based molecular profile dissects the complexity of traditional Chinese medicine. Anal. Methods. 2015;7(7):2902-2912.
- [CrossRef] [Google Scholar]
- Chemometrics applied to quality control and metabolomics for traditional Chinese medicines. J. Chromatogr. B. 2016;1015–1016:82-91.
- [CrossRef] [Google Scholar]
- Flavonoid constituents, cytotoxic and antioxidant activities of Gleditsia triacanthos L. leaves. Saudi J. Biol. Sci.. 2014;21:547-553.
- [CrossRef] [Google Scholar]
- Caspicaosides E-K, triterpenoid saponins and cytotoxic acylated saponins from fruits of Gleditsia caspica Desf. Phytochemistry. 2014;100:110-119.
- [CrossRef] [Google Scholar]
- An enhanced strategy integrating offline two-dimensional separation and step-wise precursor ion list-based raster-mass defect filter: Characterization of indole alkaloids in five botanical origins of Uncariae Ramulus Cum Unicis as an exemplary application. J. Chromatogr. A. 2018;1563:124-134.
- [CrossRef] [Google Scholar]
- A green protocol for efficient discovery of novel natural compounds: Characterization of new ginsenosides from the stems and leaves of Panax ginseng as a case study. Anal. Chim. Acta. 2015;893:65-76.
- [CrossRef] [Google Scholar]
- Systematic profiling and comparison of the lipidomes from Panax ginseng, P. quinquefolius, and P. notoginseng by ultrahigh performance supercritical fluid chromatography/high-resolution mass spectrometry and ion mobility-derived collision cross section measurement. J. Chromatogr. A. 2018;1548:64-75.
- [CrossRef] [Google Scholar]
- A classification of liquid chromatography mass spectrometry techniques for evaluation of chemical composition and quality control of traditional medicines. J. Chromatogr. A. 2020;1609:460501
- [CrossRef] [Google Scholar]
- A novel ion mobility separation-enabled and precursor ions list-included high-definition data-dependent acquisition (HSDDA) approach: Method development and its application to the comprehensive multicomponent characterization of Fangji Huangqi Decoction. Arab. J. Chem.. 2021;14:103087
- [CrossRef] [Google Scholar]
- Potential of near infrared spectroscopy and pattern recognition for rapid discrimination and quantification of Gleditsia sinensis thorn powder with adulterants. J. Pharm. Biomed. Anal.. 2018;160:64-72.
- [CrossRef] [Google Scholar]
- Separation and characterization of triterpenoid saponins in Gleditsia sinensis by comprehensive two-dimensional liquid chromatography coupled with mass spectrometry. Planta. Med.. 2016;82(18):1558-1567.
- [CrossRef] [Google Scholar]
- Holistic quality evaluation of Saposhnikoviae Radix (Saposhnikovia divaricata) by reversed-phase ultra-high performance liquid chromatography and hydrophilic interaction chromatography coupled with ion mobility quadrupole time-of-flight mass spectrometry-based untargeted metabolomics. Arab. J. Chem.. 2020;13:8835-8847.
- [CrossRef] [Google Scholar]
- Potential role of metabolomics approaches in the area of traditional Chinese medicine: As pillars of the bridge between Chinese and Western medicine. J. Pharm. Biomed. Anal.. 2011;55(5):859-868.
- [CrossRef] [Google Scholar]
- Ultra-performance liquid chromatography coupled to mass spectrometry as a sensitive and powerful technology for metabolomic studies. J. Sep. Sci.. 2011;34(24):3451-3459.
- [CrossRef] [Google Scholar]
- Rapid screening and characterization of triterpene saponins in Acanthopanax senticosus leaves via untargeted MSAll and SWATH techniques on a quadrupole time of flight mass spectrometry. J. Pharm. Biomed. Anal.. 2019;170:68-82.
- [CrossRef] [Google Scholar]
- Simultaneous quantitative assays of 15 ginsenosides from 119 batches of ginseng samples representing 12 traditional Chinese medicines by ultra-high performance liquid chromatography coupled with charged aerosol detector. J. Chromatogr. A. 2021;1655:462504
- [CrossRef] [Google Scholar]
- Chemical constituents of the spines of Gleditsia sinensis. Chem. Nat. Compd.. 2016;52(5):902-906.
- [CrossRef] [Google Scholar]
- Global profiling combined with predicted metabolites screening for discovery of natural compounds: Characterization of ginsenosides in the leaves of Panax notoginseng as a case study. J. Chromatogr. A. 2018;1538:34-44.
- [CrossRef] [Google Scholar]
- Anti-breast cancer triterpenoid saponins from the thorns of Gleditsia sinensis. Nat. Prod. Res.. 2019;33(16):2308-2313.
- [CrossRef] [Google Scholar]
- The quest for the modernization and internationalization of traditional Chinese medicine. Engineering. 2019;5(1):1-2.
- [CrossRef] [Google Scholar]
- Highly selective monitoring of in-source fragmentation sapogenin product ions in positive mode enabling group-target ginsenosides profiling and simultaneous identification of seven Panax herbal medicines. J. Chromatogr. A. 2020;1618:460850
- [CrossRef] [Google Scholar]
- A multidimensional analytical approach based on time-decoupled online comprehensive two-dimensional liquid chromatography coupled with ion mobility quadrupole time-of-flight mass spectrometry for the analysis of ginsenosides from white and red ginsengs. J. Pharm. Biomed. Anal.. 2019;163:24-33.
- [CrossRef] [Google Scholar]
- Gleditsia species: An ethnomedical, phytochemical and pharmacological review. J. Ethnopharmacol.. 2016;178:155-171.
- [CrossRef] [Google Scholar]
- Chemical constituents from the thorns of Gleditsia sinensis and their cytotoxic activities. J. Asian Nat. Prod. Res.. 2020;22(12):1121-1129.
- [CrossRef] [Google Scholar]
- Four new triterpenoidal saponins acylated with one monoterpenic acid from Gleditsia sinensis. J. Nat. Prod.. 1999;62:740-745.
- [CrossRef] [Google Scholar]
- Triterpenoidal saponins acylated with two monoterpenic acids from Gleditsia sinensis. Chem. Pharm. Bull.. 1999;47(3):388-393.
- [CrossRef] [Google Scholar]
- A strategy for rapid discovery of traceable chemical markers in herbal products using MZmine 2 data processing toolbox: A case of Jing Liqueur. Chin. Herb. Med.. 2021;13(3):430-438.
- [CrossRef] [Google Scholar]
- A five-dimensional data collection strategy for multicomponent discovery and characterization in Traditional Chinese Medicine: Gastrodia Rhizoma as a case study. J. Chromatogr. A. 2021;1653:462405
- [CrossRef] [Google Scholar]
- Offline two-dimensional liquid chromatography coupled with ion mobility-quadrupole time-of-flight mass spectrometry enabling four-dimensional separation and characterization of the multicomponents from white ginseng and red ginseng. J. Pharm. Anal.. 2020;10(6):597-609.
- [CrossRef] [Google Scholar]
Appendix A
Supplementary material
Supplementary data to this article can be found online at https://doi.org/10.1016/j.arabjc.2022.103762.
Appendix A
Supplementary material
The following are the Supplementary data to this article:Supplementary data 1
Supplementary data 1


