

Translate this page into:
Enhanced electrocatalytic degradation of 2,4-Dinitrophenol (2,4-DNP) in three-dimensional sono-electrochemical (3D/SEC) process equipped with Fe/SBA-15 nanocomposite particle electrodes: Degradation pathway and application for real wastewater
⁎Corresponding authors at: Social Determinants of Health Research Center, Ardabil University of Medical Sciences, Ardabil, Iran. a.dargahi29@yahoo.com (Abdollah Dargahi), mvn_20@yahoo.com (Mehdi Vosoughi)
-
Received: ,
Accepted: ,
This article was originally published by Elsevier and was migrated to Scientific Scholar after the change of Publisher.
Peer review under responsibility of King Saud University.
Abstract
2,4-dinitrophenol (2,4-DNP), which is a nitrophenol compound, is a carcinogenic and non-biodegradable pollutant, which is found at high concentrations in industrial wastewater. Degradation of 2,4-DNP using a three-dimensional sono-electrochemical (3D/SEC) process equipped with G/β-PbO2 anode and Fe/SBA-15 nanocomposite particle electrodes was evaluated in the present study. Investigating the effect of parameters including pH, electrolysis time, current density, and 2,4-DNP concentration on the performance of the 3D/SEC-Fe-SBA-15 process in 2,4-DNP degradation was considered, and optimization of these parameters was done using the Taguchi design technique. Field emission scanning electron microscopy (FESEM), X-ray diffraction analysis (XRD), energy-dispersive X-ray spectroscopy mapping (EDX-mapping), transmission electron microscopy (TEM), and Fourier Transform Infrared Spectroscopy (FTIR)) were the analyses techniques used to support the successful synthesis of Fe-SBA-15 and G/β-PbO2 anode. The optimum values obtained for pH, electrolysis time, current density, and 2,4-DNP concentration were 5.0, 60.0 min, 5.0 mA/cm2, and 50.0 mg/L, respectively. The experimental removal efficiencies of 2,4-DNP, COD, and TOC using 3D/SEC-Fe-SBA-15 process, under the mentioned conditions, were obtained to be 96.3%, 88.28%, and 83.82%, respectively. In addition, the AOS value was developed from −0.29 to + 0.88; this indicates the high mineralization of 2,4-DNP and improvement of the solution biodegradability. Detecting the intermediates produced during the degradation process was done by LC-MS analysis, and pathways for its degradation was proposed. Results were indicative of the high potential of the 3D/SEC-Fe-SBA-15 process for treating wastewater containing phenolic compounds, e.g., 2,4-DNP, and can provide acceptable efficiency.
Keywords
2, 4-Dinitrophenol (2 4-DNP)
3D/SEC process
Fe/SBA-15 particle electrodes
Degradation pathway
Real wastewater
Taguchi method

1 Introduction
Most materials that contain nitrophenol derivatives are resistant to bioremediation; thus, they are very important in terms of biodegradation resistance (Yang et al., 2010; Hooshyar et al., 2021; Afshin et al., 2021). 2,4-Dinitrophenol (2,4-DNP) is the most important compound of nitrophenol, which is widely used in the chemical industry to produce nitrous dyes and their derivatives, picric acid, picramic acid, diaminophenol dihydrochloride, wood preservatives, plasticizers, solvents, explosives, pesticides such as parathion, and nitrofen. It is also used as a polymerization inhibitor in the production process of vinyl aromatic compounds (Xiong et al., 2019). 2,4-DNP is found in wastewater released from chemical and petrochemical industries, as well as in smaller amounts in municipal and agricultural wastewater (Kuşçu and Sponza, 2005). The most important source for the production of DNP is the nitrobenzene industry, in which 2,4-DNP is the main component of wastewater known as red water, which is produced by caustic or ammonia washing of the petrochemical industry producing nitrobenzene from benzene (Gharbani et al., 2010; Dong et al., 2015).
2,4-DNP is a highly toxic substance that prolonged exposure with this substance in humans and animals through inhalation or skin absorption, affecting the bone marrow, central nervous system, and cardiovascular system, causing cataracts, swollen lymph nodes, eczema, Nail loss, increased metabolism, fever, headache, profuse sweating, thirst and fatigue (Rahmani et al., 2020).
LC50 of 2,4-DNP at 4 and 24 hr for Daphnia Magna is 4.1 and 4.5 mg/L, respectively (Rahmani et al., 2020). Due to the toxicity and environmental effects of this material to remove or reduce its concentration in industrial wastewater, various treatment methods have been introduced. These methods include adsorption, chemical oxidation, precipitation, concentration, evaporation, and incineration (Xiong et al., 2019; Zhou et al., 2018; Azari et al., 2021; Khoshravesh et al., 2022; Mohammadinezhad et al., 2018). Also, many studies have been done to use biotechnology methods to remove these compounds using various organisms such as bacteria and fungi (Zin et al., 2018).
Many studies have been conducted in the field of 3D electrochemical with different particle electrodes. However, no study has been done to evaluate the efficiency of three-dimensional sono- electrochemical (3D/SEC) process with Fe/SBA-15 nanocomposite particle electrodes for removal of non-biodegradable pollutants such as 2,4-DNP and application of the 3D/SEC-Fe-SBA-15 process with graphite anode coated with lead dioxide (G/β-PbO2) anode for treatment of real wastewater, which can be considered the main novelty of this study. Therefore, the aim of this study was to assess the efficiency of the 3D/SEC process with synthesized Fe/SBA-15 nanocatalyst as the third dimension to remove 2,4-DNP from aqueous solutions. The design and analysis of the experiments were done using the Taguchi design approach, which has been introduced as proper statistical tools to design and optimize the studied process.
2 Materials and methods
2.1 Chemicals and reagents
The employed chemicals in this study were sulfuric acid (H2SO4, >98% purity), lead nitrate (Pb(NO3)2, >99% purity), nitric acid (HNO3, 95% purity), Tetraethyl orthosilicate (TEOS, 98%), pluronic P123(EO20PO70EO20), iron (III) Nitrate Nonahydrateiron (Fe(NO3)3·9H2O), sodium sulfate (Na2SO4, >99% purity), Sodium chloride (NaCl, >99% purity), and Sodium nitrate (NaNO3, >99% purity), which have been provided by Sigma Aldrich (St. Louis, MO, USA). Furthermore, 2,4-Dinitrophenol (2,4-DNP, chemical formula: C6H4N2O5, >99% purity) (Table 1), sodium hydroxide (NaOH pellets, ≥98% purity), and Hydrochloric acid (HCl, ≥98% purity) were bought from Merck CO (Darmstadt, Germany). The mentioned chemicals were of analytical grade. HPLC grade distilled water was employed for detecting 2,4-DNP. For adjusting the solution pH, 0.1 M Hydrochloric acid (HCl) and 0.1 M sodium hydroxide (NaOH) were utilized. Preparing all aqueous solutions was done using deionized water.
Component
Information/schematic/value
Chemical formula
C6H4N2O5
structure

Molar mass
184.107 g/mol
Melting point
108 °C (226 °F; 381 K)
Boiling point
113 °C (235 °F; 386 K)
2.2 Preparation of the G/β-PbO2 electrode
Preparing the G/β-PbO2 anode was done by electrochemical deposition of PbO2 layers on graphite sheets with dimensions of 10 cm × 5 cm × 0.2 cm. The procedure of preparing the mentioned anode was done by sonication of the polished graphite sheets in 40% NaOH solution for 15 min and in a 1:1 (V/V) HNO3/H2SO4 mixture for another 15 min. At a constant current in a simple cell containing 0.5 mol L-1 lead nitrate and 0.1 mol L-1 nitric acid (MEGATEK, MP-3005, China), the electrochemical deposition process was performed. The prepared graphite sheet and the stainless-steel sheet with the same dimensions were employed as anode and cathode, respectively. The deposition of PbO2 film on the anode was performed at a constant current of 7.5 mA cm−2 for 180 min at room temperature. Following reactions (Eqs. 1–4) represent the electrochemical deposition process of PbO2 film on graphite sheet (Samarghandi et al., 2020):
At the end of the process, the synthesized G/β-PbO2 anode was rinsed several times with deionized water (Samarghandi et al., 2020; Dargahi et al., 2018).
2.3 Synthesis of particle electrode
2.3.1 Synthesis of SBA-15
SBA-15 was synthesized through the formation of liquid crystals by the hydrothermal method. The surfactant used in this nanostructured material is a pluronic oxide tri-block copolymer, which is called P123 in short. The characteristics of this surfactant are its regular internal structure, amphiphilic properties, and most importantly its biodegradability. The synthesis of SBA-15 was performed according to the optimized method of Zhao et al. (Zhao et al., 1998) under very acidic conditions and using tetraethyl ortho-silicate as a silica source (Zhao et al., 1998). For this purpose, 4 g of surfactant was dissolved in 80 mL of 2 M hydrochloric acid and 29 mL of distilled water in a suitable reactor using a magnetic stirrer. Then, 3.1 g of tetraethyl orthosilicate was added to the solution and stirred for 24 h at 40 °C. The resulting mixture was allowed to stand for 24 h at 90 °C. After cooling the mixture to room temperature, the mixture was filtered through a 0.45-µm filter and rinsed thoroughly with pure distilled water for several steps, and then rinsed with 25% ethanol, and after that, was again rinsed with distilled water to remove excess surfactant and ethanol. It was then dried at room temperature. The resulting product was placed in a 600 °C oven for 6 h to remove the surfactant frame and to provide empty cavities. The resulting white solid powder is called mesoporous silica SBA-15 (Zhao et al., 1998).
2.3.2 Synthesis of Fe/SBA-15 nanocatalyst
For the synthesis of Fe/SBA-15 catalyst, the incipient wetness impregnation method was performed according to Huang et al. In this method, iron nitrate was used as a precursor. First, SBA-15 was dried for 12 h at 80 °C, and iron nitrate was completely dissolved in deionized water to obtain a suitable concentration. One gram of SBA-15 was added to the iron nitrate solution and the solution was sonicated for 30 min. The mixture was dried at 100 °C and then calcined at 750 °C for 3 hr (Huang et al., 2011).
2.4 Sono-electrochemical treatments
The degradation of the 2,4-DNP by the 3D/SEC process was studied in a Plexiglas reactor (a useful volume of 250 mL). The anode and cathode of the studied system were prepared G/β-PbO2 electrode (10.0 × 5.5 × 0.4 cm) and SS 316 with equal dimensions, respectively. The distance of 4 cm was considered between the anode and the cathode. Filling the space between the two electrodes with the Fe/SBA-15 nanocatalyst (different concentrations of 0–8 g/250 mL) was done to provide the third dimension of the 3D electrode (Fig. 1). Different concentrations of Na2SO4 (0–0.5 gr/250 mL) as supporting electrolyte were employed to supply the desired potential. Eventually, the reactor was placed in the ultrasonic chamber (with a fixed frequency of 37 kHz), and the ultrasonic chamber was filled with a proper volume of water.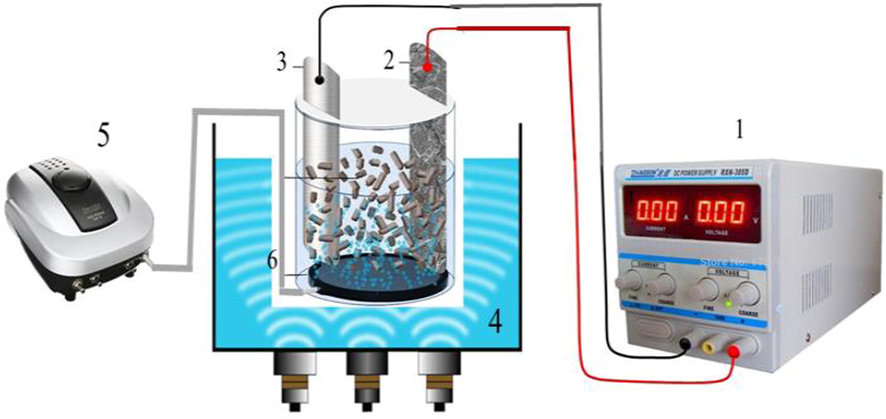
Schematic of the three-dimensional sono-electrochemical (3D/SEC) process (1. DC power supply 2. Anode, 3. Cathode, 4. Ultrasonic chamber, 5. Air pump, and 6. Fe/SBA-15 nanocomposite particle electrodes).
Electrolyte improves the solution conductivity, accelerates the electron transfer, and thereby enhances the performance of the electrochemical reaction. In this study, different types of support electrolytes (SE) such as Na2SO4, NaCl, and NaNO3 have been used as SE for electrochemical degradation of 2,4-DNP. Preparing the desired samples was done by dissolving 25–100 mg/L 2,4-DNP with 0.3 g/250 mL Na2SO4 in distilled water. Supplying the power for the degradation of 2,4-DNP was considered using a DC power supply. The magnetic stirrer and the magnet rotor were employed for ensuring the mixing effects. Two repetitions for all batch experiments were considered at room temperature. The included independent variables in this study were pH (3–9), current density (0.5–5 mA/cm2), initial concentration of 2,4-DNP (25–100 mg/L), Fe/SBA-15 nanocatalyst dose (0.5–8.0 gr/L), and electrolysis time (15–60 min).
Through the employment of Eq. (5), the efficiency of the 3D/SEC process was estimated for the removal of 2,4-DNP, chemical oxygen demand (COD), and total organic carbon (TOC). Moreover, Eq. (6) was used for the calculation of the kinetics of 2,4-DNP degradation in the 3D/SEC process. kobs represents the pseudo-first-order rate constant (min−1), and t (min) indicates the reaction time.
Where η (%) is representative of 2,4-DNP, COD, and TOC removal efficiency; C0 is indicative of the initial concentration of 2,4-DNP, COD, and TOC at the time 0, and Ct is indicative of the concentration of 2,4-DNP, COD, and TOC after 60 min (the end of the treatment). In equation (6), is the concentration of 2,4-DNP (mg/L) at t = 0, and represents the concentration of 2,4-DNP (mg/L) at t = t min. is pseudo-first-order kinetic coefficient (min−1), and t shows reaction time (min).
Moreover, using Equation (7), the average oxidation state (AOS) was estimated for evaluation of the oxidation degree and effectiveness of the oxidative process (Dargahi et al., 2021; Seidmohammadi et al., 2021; Dargahi et al., 2021). As observed, for calculating this parameter, the values of COD and TOC were estimated at different reaction times (Amat et al., 2007; Arques et al., 2007; Manenti et al., 2015; Vilar et al., 2012).
In the above equation, COD and TOC are the chemical oxygen demand at a sampling time of t (mg O2/L), and the total organic carbon of the solution at a sampling time of 0 (mg C/L), respectively. The range of AOS value is between + 4 to − 4; +4 is related to CO2, which is the most oxidized state of C, and − 4 is related to CH4, which is the most reduced state of C.
After optimizing the effective parameters in the removal of pollutants in this study, the efficiency of 3D/SEC-Fe/SBA-15 and 2D/SEC processes in the removal of 2,4-DNP from real wastewater was investigated.
2.5 Instrumentation and analysis procedures
A direct current (DC) power supply (DAZHENG PS-305D, China) with an electric current of 0–5 A and voltage of 0–40 V was used to supply the electrical current. To measure the residual concentration of 2,4-DNP, HPLC system (Knauer-V7603-Germany) equipped with an ultimate variable wavelength UV detector (2500) and Shimadzu RF-10AXL fluorescence detector was employed after collecting samples and filtration of them through 0.45 µm membrane filter. Separating the target analytes was performed using A Nucleosil 100–5 C18 (250 mm × 4.6 mm ID, particle size 5 µm; Macherey-Nagel, Duren, Germany). The aqueous 0.5% acetic acid-acetonitrile (50:50, v/v) was considered as mobile phase and used at a flow rate of 1.0 mL/min at 25 °C. The detection wavelength and the injection volume were 260 nm and 20 μL, respectively. The retention time of 2,4-DNP was 10 min. The limit of detection (LOD) and the limit of quantitation (LOQ) were 10 µg/L and 100 µg/L, respectively. Evaluation of lead leakage in the effluent from the 3D/SEC process (pre-treatment) after degradation of 2,4-DNP under optimal test conditions was done using inductively coupled plasma-optical emission spectrometry (ICP-OES, Optima-8300), and pH was measured by Hach pH meter (HQ430D, USA). Using a TOC analyzer (model Analytik Jena multi N/C 3100, Germany) and colorimetric method (5220-D), the mineralization levels of 2,4-DNP were evaluated in terms of TOC and COD. Moreover, identifying intermediates of 2,4-DNP degradation was done by LC-MS using a Waters Alliance 2695 HPLC-Micromass Quattro micro API Mass Spectrometer fitted with an Atlantis T3-C18 column (particle size 3 µm, 2.1 × 100 mm ID) at ambient temperature, with an injection volume of 20 µL and flow rate of 0.25 mL/min. The mobile phase was a mixture of 60% acetonitrile + 0.1 % formic acid and 40 % water + 0.1 % formic acid. Mass spectra (MS) conditions were as follows: Mode: ESI+, Cone Volt: 30 V, Capillary Volt: 4 kV, Extractor: 2 V, RF Lens: 0.2 V, Gas nebulizer: N2 (grade 5), Flow gas: 200 L/h, Source temperature: 120 °C, and desolvation temperature: 300 °C.
To study surface morphology and chemical composition of the G/β-PbO2 anode, Field emission scanning electron microscopy (FESEM, FEI-Nova NanoSEM 450) and energy-dispersive X-ray spectroscopy mapping (EDX; Bruker XFlash6L10) analysis were employed. For determining the phase type and crystallite structure of PbO2 film, X-ray diffraction analysis (XRD, Ultima IV, Rigaku) was used.
To determine the structure of SBA-15 compounds and synthesized Fe/SBA-15 nanocatalyst, various analyses such as XRD (PW1730 X-ray diffractometer, Philips, Netherlands), EDX (MIRA III TESCAN, Czech Republic), transmission electron microscope (TEM, Zeiss EM900, Germany), Fourier transform infrared spectroscopy (FTIR, Shimadzu FTIR-8400S, Japan), Brunaur–Emmett–Teller method (BET, BELSORP MINI II, Japan) were used.
2.6 Experimental design–Taguchi orthogonal array
By taking into consideration of four parameters, e.g., solution pH (3–9), initial 2,4-DNP concentration (25–100 mg/L), applied current (0.5–5 mA/cm2), and reaction time (15–60 min), the 3D/SEC process efficiency was evaluated. Table 2 shows the four levels of each parameter. Based on the Taguchi test design and using the L-16 design, 16 test steps were defined. In Table 3, details of the experiments have been documented. Two repetitions were considered for the experiments and analyzed by the model. The designing experiments, analyzing the variance (ANOVA), and optimizing the process were done by Minitab16 software. Notice: PPD1 and PPD2 introduce the percentage of pollutant degradation in the first and second tests, respectively. boldfaces; are also related to the test that has the maximum S/N value.
Factor
Description
Level 1
Level 2
Level 3
Level 4
A
pH (-)
3
5
7
9
B
Electrolysis time (min)
15
30
45
60
C
2,4-DCP concentration (mg/L)
25
50
75
100
D
Current density (mA/cm2)
0.5
1.5
3.0
5.0
Tests
Factor
PDE (%)
S/N
A
B
C
D
PPD1
PPD2
Tests 1
3
15
25
0.5
69.66
69.83
36.87
Tests 2
30
50
2
84.66
85.45
38.59
Tests 3
45
75
3.5
95.16
96.01
39.6
Tests 4
60
100
5
98.76
98.06
39.86
Tests 5
5
15
50
3.5
78.56
77.93
37.86
Tests 6
30
25
5
97.28
97.85
39.78
Tests 7
45
100
0.5
87.39
87.63
38.84
Tests 8
60
75
2
97.16
97.3
39.75
Tests 9
7
15
75
5
70.66
71.2
37.01
Tests 10
30
100
3.5
70.87
70.41
36.98
Tests 11
45
25
2
78.26
78.02
37.85
Tests 12
60
50
0.5
80.33
80.69
38.11
Tests 13
9
15
100
2
46.76
45.94
33.32
Tests 14
30
75
0.5
56.31
56.41
35.02
Tests 15
45
50
5
87.32
87.49
38.83
Tests 16
60
25
3.5
82.19
83.01
38.34
In the Taguchi method, a converted response function, which is defined as the ratio of the sign of each effect (S) to the effects caused by the error (N) is employed for the accurate analysis of the results. The percentage of pollutant degradation (PPD) was defined as the response in present study. Through the employment of the Equation (Eq. (8)), the S/N ratio was calculated (Dargahi et al., 2021; Seid-Mohammadi et al., 2019). The number of replication of the experiment was shown by n, and PPD is related to the results of the experiments.
3 Results and discussion
3.1 FESEM images, XRD pattern, EDX spectrum and EDX-mapping of G/β-PbO2
Different magnifications of FESEM images of graphite substrate and G/β-PbO2 anode were represented in Fig. 2; according to mentioned Fig., the compact, uniform, crack-free, and clustered structures of PbO2 electrodeposited on the graphite substrate could be detected (Samarghandi et al., 2020). Fig. 3 (a-c) represents the EDX spectrum and EDX-mapping of the G/β-PbO2 anode. The lead and oxygen were detected in the G/β-PbO2 anode with a weight percentage (wt.%) of 79.64 and 20.36, respectively. Also, the absence of carbon peak in the EDX spectrum clarifies the well covering of graphite substrate with PbO2 layers. In EDX-mapping images, uniform distribution of lead and oxygen at the anode surface is evidently perceived. Fig. 3(e) displays the XRD pattern of the G/β-PbO2 anode. The diffraction peaks, which are observed at 2θ = 25.4° (1 1 0), 32° (1 0 1), 36.2° (2 0 0), 40.4° (1 1 2), 45° (0 2 2), 49.2° (2 1 1), 52.2° (2 2 0), 55° (0 0 2), 58.9° (3 1 0), 60° (1 1 2), 62.7° (3 0 1), 67° (2 0 2), and 74.5° (3 2 1) is related to the tetragonal β-PbO2 structures; this can be indexed with the standard JCPDS data card no. 89–2805 (Li et al., 2014). In contrast, diffraction peaks observed at 2θ = 23.6° (1 1 0), 28.5° (1 1 1), 33.1° (0 0 2), and 56.5° (1 1 3) corresponds the α-PbO2 phase (indexed with JCPDS data card no. 72–2440) (Samarghandi et al., 2020).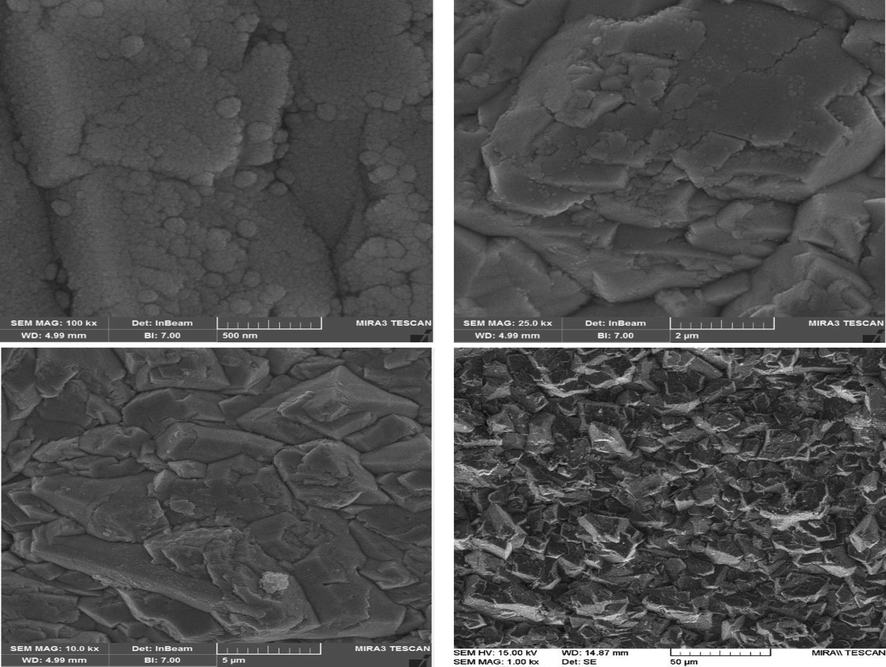
FESEM images of the surface morphology at different magnifications of the β-PbO2 electrodeposited on graphite substrates.
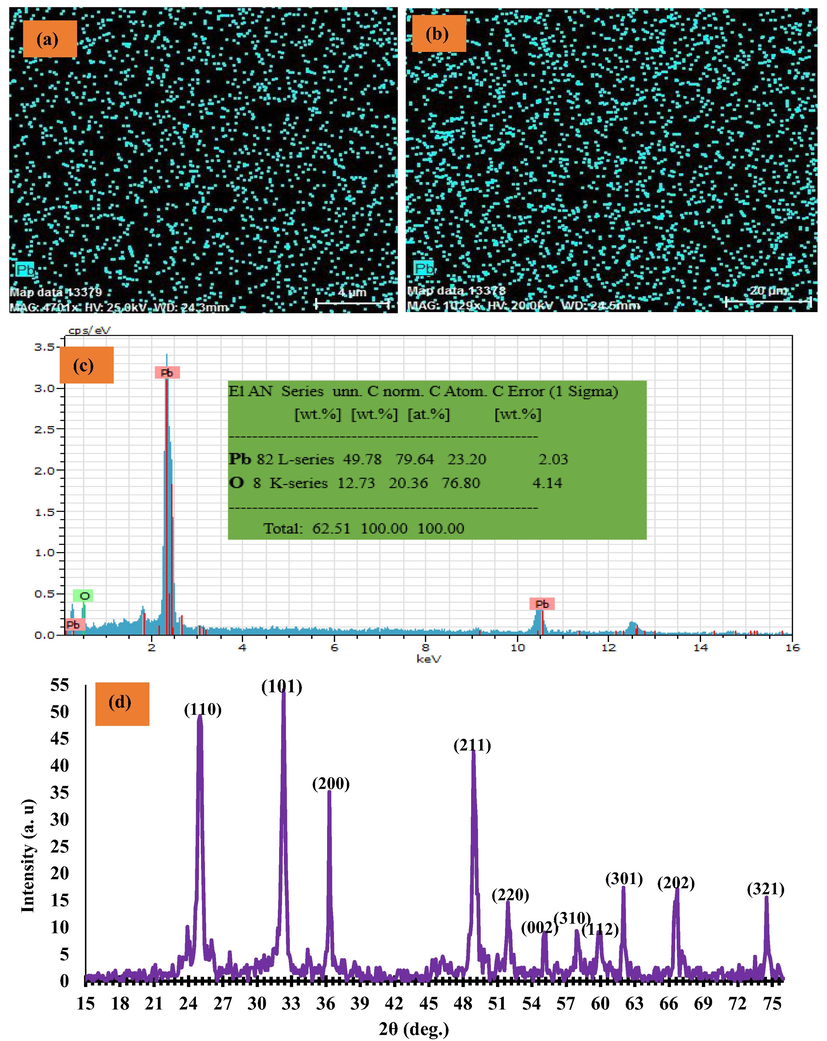
(a), (b) EDX mapping, (c) EDX spectrum, and XRD pattern of the G/β-PbO2.
3.2 Characterization of SBA-15 and Fe/SBA-15
Fig. 4 (a) shows the X-ray diffraction pattern for SBA-15 and Fe/SBA-15. In the SBA-15 model, three main peaks can be identified in this figure; they are related to X-ray diffraction from 100, 110, and 200 crystalline planes in the SBA-15 structure. The strongest peak was observed at 2 θ = 0.9, which is related to X-ray diffraction of the 100 crystalline plane and indicates the mesoporous structure. Also, the presence of two other peaks with low intensity at 2 θ = 1.5 and 2θ = 1.7 is related to X-ray diffraction from 110 and 200 crystalline planes, respectively. The observation of the three peaks indicates a hexagonal two-dimensional (p6mm) mesoporous structure in which the hexagonal cell units are repeated in a very regular crystal structure. By comparing the diffraction pattern of SBA-15 synthesized in the present study with other studies, the synthesized mesoporous cavity is consistent with the regular hexagonal two-dimensional mesoporous structure reported in SBA-15 (Pérez-Quintanilla et al., 2006). Comparing the Fe/SBA-15 pattern with SBA-15, the same peaks are observed, indicating that the compositional structure is preserved during iron synthesis in mesoporous cavities, and the synthesized nanocatalyst also corresponds to the regular two-dimensional hexagonal mesoporous structure in terms of crystal structure. The results of this study are consistent with the study of Sanjini and Velmathi, who used Fe/SBA-15 catalyst to degrade nitro-aromatic organic compounds, and the study of Ragavan and Pandurangan, which provided an easy method for the synthesis of carbon nanotubes on Fe/SBA-15 (Sanjini and Velmathi, 2014; Ragavan and Pandurangan, 2017).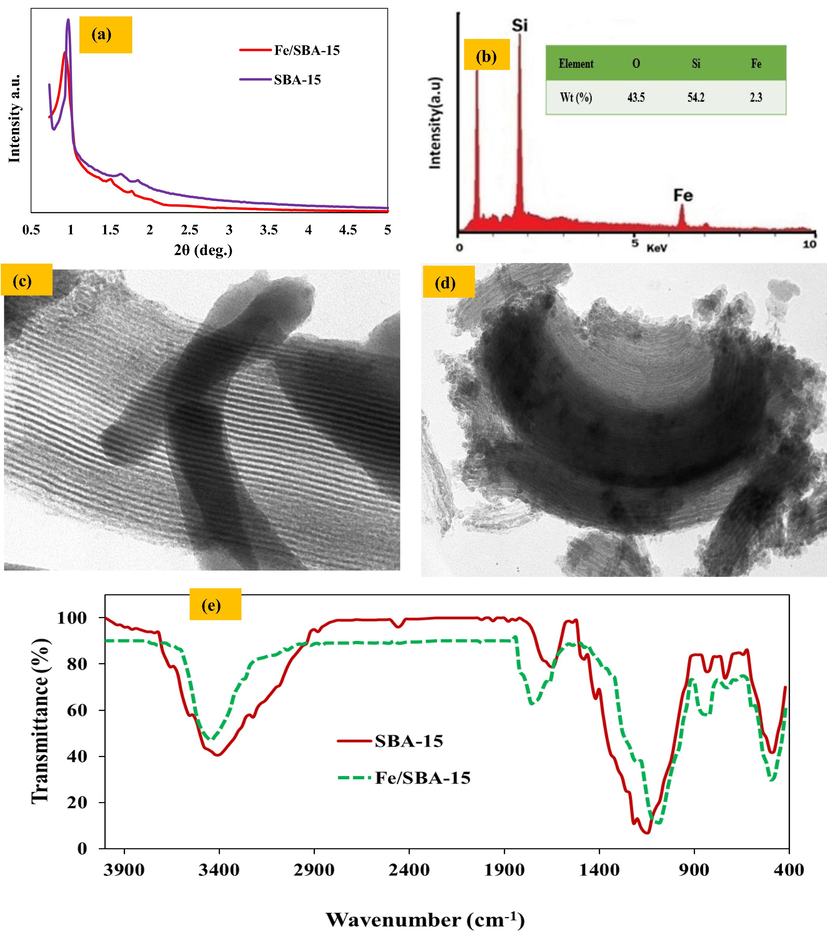
(a) XRD patterns of SBA-15 and Fe-SBA-15, (b) EDX image of Fe-SBA-15 catalyst, (c) TEM images of SBA-15, (d) TEM images of Fe-SBA-15, and (e) FT-IR spectra of SBA-15 and Fe-SBA-15.
EDX analysis was performed to determine the percentage of iron in Fe/SBA-15 nanocatalysts. The results of these analyses are presented in Fig. 4 (b). As shown in Fig. 4 (b), the amount of iron in the Fe/SBA-15 nanocatalyst was 2.3%.
Fig. 4(c, d) represents TEM images of SBA-15 and Fe/SBA-15; based on this, lack of evident change in morphology of both catalysts was confirmed, and a short rod-like morphology was observed for both of them. Fig. 4 represents the maintenance of the structure order of the Fe/SBA-15 even after the grafting procedure and immobilization of iron nanoparticles on the SBA-15 mesoporous. The black dot-like objects between the mesoporous channels are related to the Fe nanoparticles.
The FTIR spectroscopy results of SBA-15 and Fe/SBA-15 were shown in Fig. 4 (e). The peaks observed in 1150, 820, and 1480 cm−1 in Fig. 4 (e), seen in both compounds, are related to the asymmetric stretching, bending, and rocking modes of Si–O–Si. The broad peak observed at 3420 cm−1 is related to the presence of Si–OH groups present in both compounds. Also, the absence of a peak around 2850 to 13,000 cm−1, which is related to the C–H band, indicates the complete removal of the surfactant. The adsorbed band of about 1700 to 1800 cm−1 in both compounds is related to the bending vibrations of the O–H band in the adsorbed water molecules on the surface of SBA-15 and Fe/SBA-15. Comparison of the FTIR spectrum of the SBA-15 sample synthesized in this study with a similar sample synthesized by Sun et al. is a good confirmation of the synthesized sample in terms of surface chemistry and material (87). Finally, with the similarity of the pattern of both compounds, it can be concluded that during the synthesis of iron on SBA-15 mesoporous, the main structure of the mesoporous is preserved and the main composition is preserved, and the results are consistent with the study of Sanjini et al (Sanjini and Velmathi, 2014) and Beirami et al. (Beirami et al., 2017).
3.3 Determination of the type of supporting electrolyte
The electrochemical degradation process is influenced by different parameters, among which SE is one of the most important since it can represent a significant effect on the current applied to the electrochemical system. Thus, selecting its type and concentration should be performed cautiously so that reasonable voltage could be supplied for the process. In this study, Na2SO4, NaCl, and NaNO3 were the chemicals, which have been used as SE for electrochemical degradation of 2,4-DNP. According to results, among there studied compounds, the use of Na2SO4 was associated with obtaining the highest degradation efficiency of 2,4-DNP (96.85%) (Fig. 5(a)). The effects of Na2SO4 as SE on the process are as follows: a) increasing the electrical conductivity (EC) and enhancing the current density in the solution and b) the formation of oxidizing species such as hydroxyl radicals (°OH) through the electrolysis of water or by the semi-chain reactions (Domínguez et al., 2010; Samarghandi et al., 2019). In fact, a direct effect of SE on both the current density and the type of electrode material provides its critical role in the degradation of pollutants in electrochemical processes. Increasing the Na2SO4 concentration is led to enhance electron transfer and to improve the production rate of °OH at the anode surface, which consequently develops the removal efficiency of organic pollutants (Samarghandi et al., 2020). Nevertheless, in the presence of high concentrations of Na2SO4, the accumulation of excess ions is increased on the surface of the cathode, anode, and particle electrode; this inhibits direct and indirect oxidation of the contaminant (Cho et al., 2020; Dai et al., 2016). Mahmoudpoor et al. (2020) studied the degradation of diazinon from aqueous solutions using an electrochemical process and clarified that, among the investigated SE, i.e., Na2SO4, NaCl, and NaNO3, the best SE was Na2SO4 (Mahmoudpoor Moteshaker et al., 2020), which is in agreement with the present study. Thus, Na2SO4 electrolyte (0.05–0.5 g/250 mL) was used in our study. Fig. 5(b) indicates that all concentrations can provide the required current densities. However, higher potentials are required to apply at low SE doses. Since the addition of SE has a lower cost compared to applying the higher potential, and the real wastewater has inherently sufficient conductivity, the use of a higher dose of SE is more logical compared to using a higher potential (Zhou et al., 2021). Our results indicated that almost equal voltage for two doses of supporting electrolyte (0.3 and 0.5 g/250 mL) is observed; based on this, 0.3 g/250 mL was used as optimum SE dose in the present study.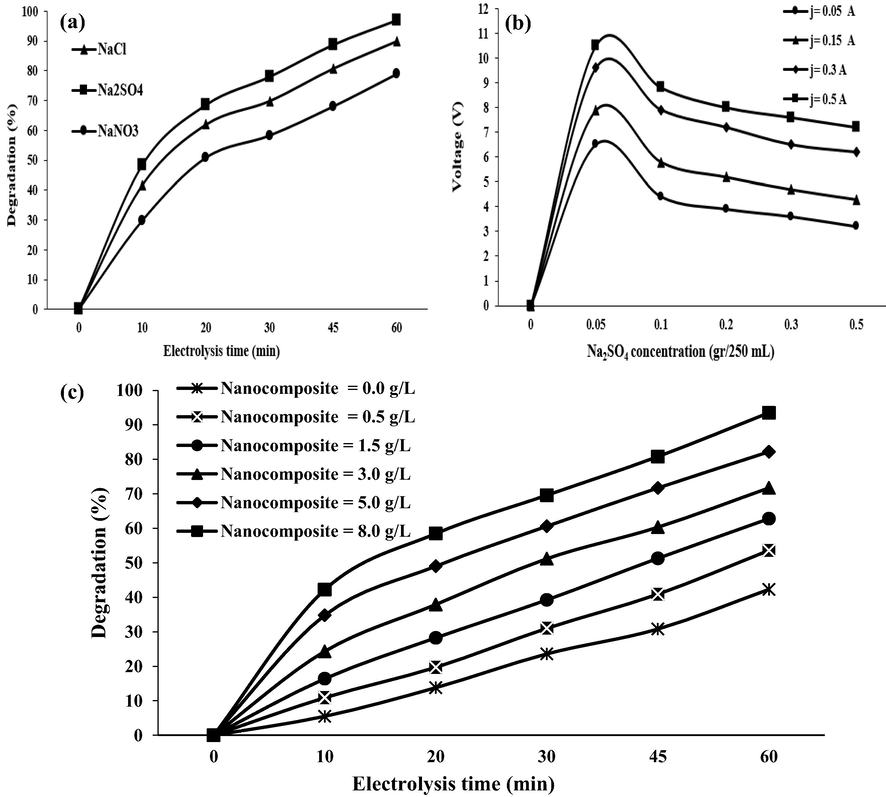
(a) The effect of different types of supportive electrolytes on 2,4-DNP removal (pH = 3.0, initial 2,4-DNP concentration = 50 mg/L, supporting electrolyte = 0.3 g/250 mL, current density = 5 mA/cm2); (b) The effect of Na2SO4 (2,4-D concentration = 50 mg/L; pH = 3, electrolysis time = 60 min, H2O2 concentration = 0.2 mL/L, current density = 5 mA/cm2, nanocomposite concentration = 5 g/L); (c) The effect of nanocomposite (Fe/SBA-15) on 2,4-DNP removal in 3D/SEC process (pH = 3.0, initial 2,4-DNP concentration = 50 mg/L, electrolysis time = 60 min, supporting electrolyte = 0.3 g/250 mL, current density = 5 mA/cm2).
3.4 The effect of nanocomposite (Fe/SBA-15) dose
The 2,4-DNP degradation efficiency in the 3D/SEC- Fe/SBA-15 process was also studied under different Fe/SBA-15 dosage as a particle electrode using optimum conditions of other parameters (pH = 3.0, initial 2,4-DNP concentration = 50 mg/L, electrolysis time = 60 min, SE dose = 0.3 g/250 mL, and current density = 5 mA/cm2). According to Fig. 5(c), which is related to results obtained in this part of the study, the highest degradation efficiency (93.5%) was obtained at a nanocomposite concentration of 8.0 g/L after 60 min, which is ascribed to the presence of a notable number of active sites and enhanced generation of the °OH due to decomposition of H2O2. Based on our results, in absence of nanocomposite or particle electrodes (nanocomposite dose = 0.0 g/250 mL), the highest system performance was 42.3% after 60 min; this represents that in presence of particle electrodes, the degradation efficiency of the 2,4-DNP is enhanced by about 51.2% in the 3D/SEC process.
3.5 Optimum conditions
In Table 3, the Signal/Noise (S/N) values for each test are represented, according to which the highest and lowest S/N values were achieved for experiments 4 (39.86) and 13 (33.32), respectively. Moreover, between the highest value observed in test 4 and the optimal state, a comparison should be considered. According to Fig. 6 (a, b), I) pH level 2 (pH: 5), II) Electrolysis time level 4 (Electrolysis time: 60 min), III) 2,4-DNP concentration level 2 (C0: 50 mg/L), and IV) Current density level 4 (Current density: 5 mA/cm2) were the optimum conditions for 3D/SEC process. Considering the values mentioned, the experiments were conducted with two repetitions, and the results were reported in Table 4. According to the table, the optimal conditions for Taguchi analysis were higher than S/N. In the optimal condition, the value obtained for the S/N ratio (39.92) was comparatively higher compared to the value of test 4 (39.86). Furthermore, under optimum conditions, the average PPD (99.05%) was observed to be higher than its value in Test 4 (98.41%). Moreover, clarifying the level of lead leaching from the electrode was performed using ICP-OES under optimal test conditions based on the mentioned test, levels of lead leaching into solution was 0.0019 mg/L; the observed amount was less than the permissible limit introduced by the world health organization (WHO) guidelines for drinking water (0.01 mg/L) (Tokimoto et al., 2005).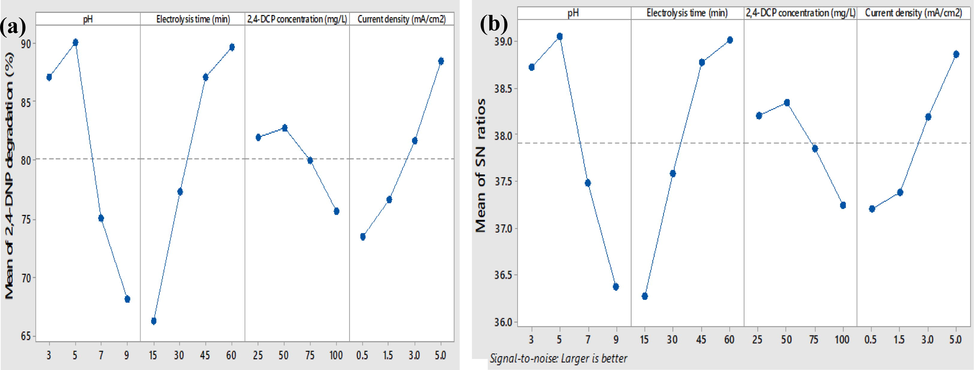
(a) The effect of different parameters on 2,4-DNP degradation; (b) The effect of different parameters on the S/N ratio in the degradation of 2,4-DNP.
Factor
A
B
C
D
PDE1
PDE2
S/N
Experiment 4 for 3D/SEC
3
60
100
5
98.76
98.06
39.86
Optimization condition
5
60
50
5
99.15
98.95
39.92
3.6 Effects of the operating parameters
3.6.1 Effect of initial pH of the solution
One of the most important identified factors, which has an effect on the speed of chemical reactions, and directly and indirectly influences the oxidation of organic matter, is the pH of the environment. In advanced oxidation processes, the oxidation of organic matter is affected by pH changes through the production of various radicals (Moussavi and Mahmoudi, 2009; García et al., 2018). In Figs. 6 and 6 (a), the effect of the initial solution pH (3 to 9) on the degradation of 2,4-DNP in interaction with the current density (1 to 5 mA/cm2) was represented. The contour plots based on pH and current density for the 2,4-DNP degradation process were presented in Figs. 6 and 7 (a). Considering the results, increasing current density and decreasing pH have a significant role in enhancing the degradation efficiency of 2,4-DNP; so that, at pH = 3 and current density = 5 mA/cm2, the highest degradation efficiency of 2,4-DNP was obtained. According to Figs. 6 and 7 (a), the suitable pH for 2,4-DNP degradation reactions is the acidic pH range. When a non-active anode is employed in an electrochemical oxidation system, competition at the anode surface competes occurs between degradation of organic contaminants and the oxygen evolution reaction. A decrease in the degradation efficiency of organic pollutants at the anode surface is detected in the alkaline conditions, which is due to intensifying the oxygen evolution side reaction in mentioned condition (Liu et al., 2018). However, in acidic conditions, the elevation of oxygen evolution overpotential occurs due to the high concentrations of hydrogen ions (H+). Mentioned condition is led to reducing the probability of side reactions of oxygen evolution and decomposition of °OH, which is led to develop degradation efficiency of 2,4-DNP by the electrochemical system (Bian et al., 2019; Duan et al., 2020; Jia et al., 2021). Moreover, the higher generation of powerful oxidizing species on G/β-PbO2 anode surface in acidic conditions may be the reason for an increased degradation efficiency of 2,4-DNP in these conditions (Liu et al., 2020). Similar results were also observed for diuron degradation by felt/PbO2 anode so that the best efficiency was detected in lower pH values (Rahmani et al., 2021).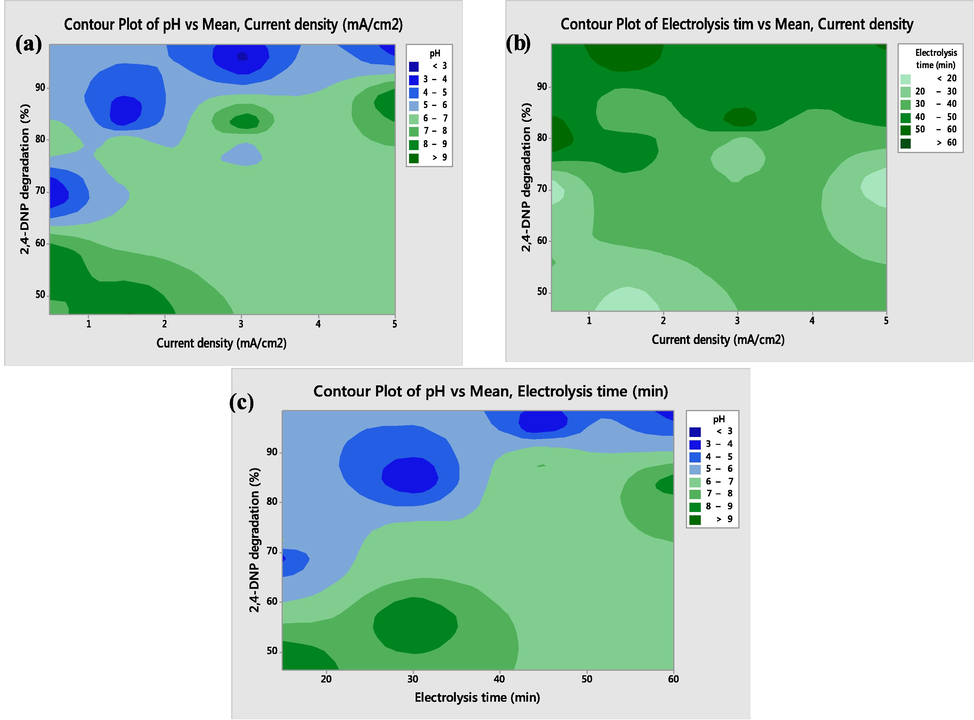
(a) Contour plots showing the interaction of current density and pH; (b) contour response surface plots showing the interaction of current density and electrolysis time; (c) contour response surface plots showing the interaction of electrolysis time and pH.
3.6.2 Effect of current density
Another parameter that is important in the performance of the electrochemical process is the changes in current density applied to the electrodes. Contour plots of 2,4-DNP degradation efficiency based on the electrolysis time and different values of current density (1 to 5 mA/cm2) have been represented in Figs. 6 and 7 (b). Obtained results were indicative of the role of current density in the generation of °OH in solutions (Li et al., 2019). Figs. 6 and 7 (b) specified the enhancement of 2,4-DNP degradation rate by increasing current density from 1 to 5 mAcm2 at different electrolysis times. An increase in the current density applied to the studied system is associated with an improvement of the production rate of °OH at the anode surface, which in turn is led to improving the radical to contaminant ratio. On the other hand, the rate of formation of hydrogen peroxide (H2O2) and °OH on the surface of the Fe/SBA-15 particle electrode is developed by increasing the current density (Gonzaga et al., 2021). In the lower values of current density, the unavailability of °OH required for the 2,4-DNP degradation process is observed. Dargahi et al. conducted a study to degrade 2,4-dichlorophenol (2,4-DCP) using a three-dimensional electrochemical process with Ti/SnO2–Sb/β-PbO2 anode. The results showed that with increasing current density, the degradation efficiency of 2,4-DCP increased (Seid-Mohammadi et al., 2019), which is consistent with the results of the present study.
3.6.3 Effect of electrolysis time
One of the advantages of increasing electrolysis time in many treatment methods is the possibility for greater contact between the pollutant and the treatment agent, which is led to increased process efficiency (Kisomi et al., 2018; Souri et al., 2018). Evaluation of the effect associated with electrolysis time on the degradation of 2,4-DNP was done by selecting its value in the range of 15–60 min. As depicted by Figs. 6 and 7 (c), electrolysis time affects the degradation efficiency so that its increase leads to develop the efficiency, since an increase in the electrolysis time results in an improvement in the amount of °OH produced, which provide the conditions suitable to obtain high efficiency of pollutants degradation by the electrochemical process (Samarghandi et al., 2021). Asgari et al. (Asgari et al., 2021) (Asgari et al., 2021) and Rahmani et al. (Rahmani et al., 2021) (Rahmani et al., 2021) also reported similar results.
3.6.4 Effect of initial 2,4-DNP concentration
Another effective parameter on the 3D/SEC-Fe/SBA15 process in 2,4-DNP degradation is the concentrations of the pollutant; thus, the effect of different concentrations of 2,4-DNP on the performance of the 3D/SEC-Fe/SBA15 process was investigated in the range of 50 and 100 mg/L. According to results reported in Fig. 6 (a) and 8 (a), increasing 2,4-DNP concentration was led to reducing the degradation efficiency of the contaminant; as can be seen, the highest degradation of 2,4-DNP (96.3%) was obtained for the concentration of 50 mg/L, while the 2,4-DNP degradation efficiency for a concentration of 100 mg/L was 75.34% at the same electrolysis time; this shows that the difference in the 2,4-DNP degradation efficiency at a concentration of 50 mg/L and 100 mg/L was about 21%. The rate of degradation reaction is quicker than mass diffusion at low concentrations of pollutants, which is led to efficient degradation of (Song et al., 2010; Yao et al., 2019). In the presence of a high concentration of the contaminant, greater levels of contaminant reach the anode surface, while sufficient °OH produced have not existed for the oxidation of the contaminant, which is led to diminishing the removal efficiency (Ansari and Nematollahi, 2018). In addition, more intermediates are produced during the degradation of high concentrations of pollutants; these intermediates compete with the main pollutant for the consumption of °OH, which is led to diminishing the radical to contaminant ratio, and reducing the removal efficiency (Ansari and Nematollahi, 2020).
3.7 Kinetics studies and synergy of 2,4-DNP degradation
By chemical kinetic, the speed of chemical reactions is evaluated. The basis of the description of the speed of a reaction is the drop in the concentration of reactive material in the time unit or rise in the concentration of a product in the time unit (Samarghandi et al., 2018). Since it is an important subject, its investigation was done in the present study. By these studies, estimating the quality of performance of the 2,4-DNP degradation reaction was done, and executing and modeling of the process was considered on an applied scale. The efficiency of different processes (3D/SEC-Fe/SBA15, 2D/SEC, 3D/EC-Fe/SBA15, and 2D/EC) for degradation of studied pollutant was evaluated based on the rate constants (K); these constants were calculated based on drawing Ln([2,4-DNP]0/[2,4-DNP]t) versus reaction time (t). The optimal conditions (2,4-DNP concentration = 50 mg/L; pH = 3; electrolysis time = 60 min; current density = 5 mA/cm2; nanocomposite dose = 5 g/L, and Na2SO4 concentration = 0.3 g/250 mL) were considered to evaluate degradation kinetics of 2,4-DNP (Fig. 9). The graphs with high R2 values (Fig. 9) indicates that a pseudo-first-order model (R2 ˃ 0.9) for describing the 2,4-DNP removal kinetics in all degradation systems. A significant linear relationship was confirmed by kinetic parameters. Fig. 9 shows kinetic coefficients of 2,4-DNP removal; results showed that the 2,4-DNP degradation kinetics occurs faster (about 3.17 times) in the 3D/SEC-Fe/SBA15 process compared to the 2D/EC process. This ratio for 3D/SEC-Fe/SBA15 and 2D/SEC processes with graphite anodes was obtained to be 2.26. Moreover, the 2,4-DNP degradation kinetics was about 1.43 times faster by the 3D/SEC-Fe/SBA15 process compared to the 3D/EC-Fe/SBA15 process.
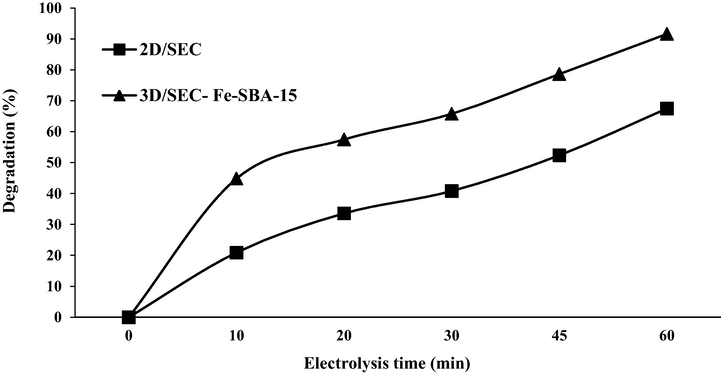
In order to determine the synergistic effect of 2,4-DNP degradation, the efficiency of different 3D/(3D/SEC-Fe/ SBA15 processes with the G/β-PbO2 anode, 2D/SEC with the G/β-PbO2 anode, and 2D/SEC with the G anode) in the degradation of 2,4-DNP under optimal test conditions (2,4-DNP concentration = 50 mg/L, pH = 3, current density = 5 mA/cm2, nanocomposite dose = 5 g/L; Na2SO4 concentration = 0.3 g/250 mL, and electrolysis time = 60 min) was examined. Fig. 8 (b) shows the degradation efficiency of 2,4-DNP under conditions optimized for a variety of 3D/SEC-Fe/SBA15 processes with the G/β-PbO2 anode, 2D/SEC with the G/β-PbO2 anode, and 2D/SEC with the G anode. As can be seen, the highest removal efficiency is related to the 3D/SEC-Fe/SBA15 process with the G/β-PbO2 anode with a removal efficiency of 97.5%, and the lowest removal rate was related to the 2D/SEC process with the G anode with a removal efficiency of 46.9%. In general, particle electrodes (Fe/SBA15) increase the degradation efficiency of 2,4-DNP by about 27% and the G/β-PbO2 anode increases the degradation efficiency of 2,4-DNP by about 24%. G/β-PbO2 anode is classified as a non-active anode while graphite anode is an active anode, respectively. The direct oxidation by °OH is the mechanism of degradation of organic pollutants in G/β-PbO2 anode, and direct electron transfer from organic pollutants at the anode surface is the degradation mechanism of graphite anode (Abdalrhman et al., 2019).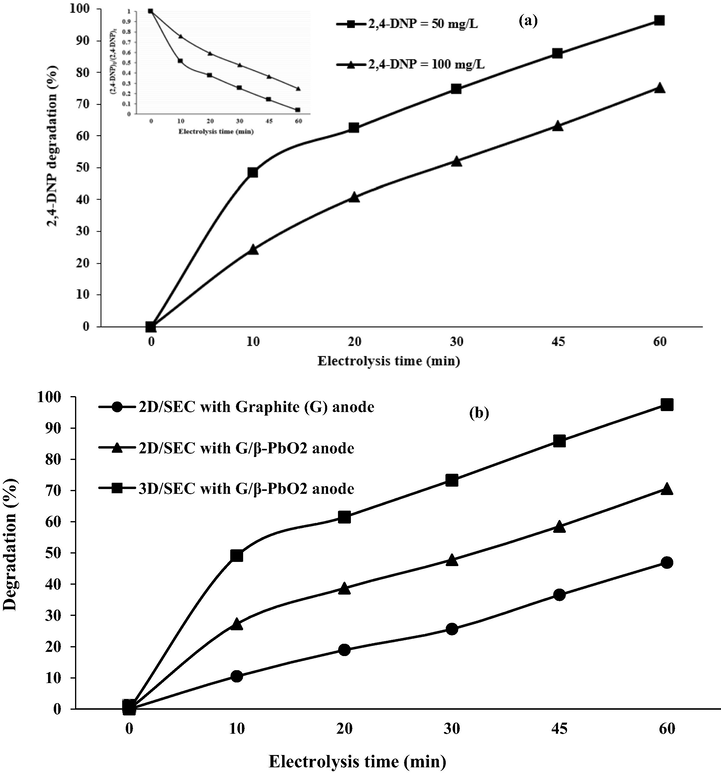
(a) Performance of 3D/SEC process in the degradation of 2,4-DNP (2,4-DNP concentration = 50 mg/L, pH = 3; current density = 5 mA/cm2; nanocomposite dose = 5 g/L; Na2SO4 concentration = 0.3 g/250 mL; electrolysis time = 60 min), (b)The degradation of 2,4-DNP by the 3D/SEC process (2,4-DNP concentration = 50 mg/L, current density = 5.0 mA/cm2, pH = 5.0, Na2SO4 concentration = 0.3 g/250 mL).
Estimation of the synergistic effect was done by evaluating 2,4-DNP removal efficiency in the processes of the 3D/SEC, 2D/SEC, 3D/EC, and 2D/EC under optimal conditions. As depicted, the kinetic rate of 2,4-DNP degradation using the 3D/SEC process was enhanced by nearly 2.5 times compared to the 2D/SEC process, which is indicative of its superiority over other studied processes. Eq. (9) was employed to calculate the synergy effect. At the observed positive synergy (S) value, the synergistic effect is validated, and zero or negative values of S are representative of additive and antagonist effects, respectively.
In the above equation, S represents the synergistic effects, and k is the kinetic constant. By placing the kinetic constants in the mentioned equation, the synergistic effect for 3D/SEC process was estimated to be 68.46% higher than the additive effect obtained from 2D/EC process. The difference observed was indicative of the effective occurrence of the distinct mechanism of HO° generation in the system and play a notable role in improving removal efficiency in the combined system. In addition, the half-life (t1/2) of 2,4-DNP degradation in the 3D/SEC-Fe/SBA15, 3D/EC-Fe/SBA15, 2D/SEC, and 2D/EC systems were estimated to be 13.32, 19.04, 30.13, and 42.26 min, respectively; mentioned parameter, i.e., t1/2 was calculated using Eq (10).
3.8 Biodegradability, mineralization, and identification of the degradation process intermediates
To clarify the degree of 2,4-DNP mineralization in the 3D/SEC-Fe/SBA-15 process, COD and TOC analyses were performed. In Fig. 10 (a, b), the results related to degradation efficiencies of COD and TOC at different times (0 to 60 min) for initial concentrations of 2,4-DNP (50 and 100 mg/L) under optimal conditions were represented. According to Fig. 10 (a), the highest COD removal efficiencies by the 3D/SEC process for 2,4-DNP concentrations of 50 and 100 mg/L were 88.28% and 70.65%, respectively. Also, the ratios of
for the initial concentration of 2,4-DNP = 50 mg/L at the electrolysis times of 10 and 60 min were 0.81 and 0.22, respectively. Also, the highest TOC removal efficiencies obtained by the 3D/SEC process for the two concentrations of 2,4-DNP (50 and 100 mg/L) were 83.82% and 64.51%, respectively) (Fig. 10 (b)), and
for the initial 2,4-DNP concentration of 50 mg/L at the electrolysis times of 10 and 60 min were obtained as 0.88 and 0.35, respectively (Fig. 10 (b)).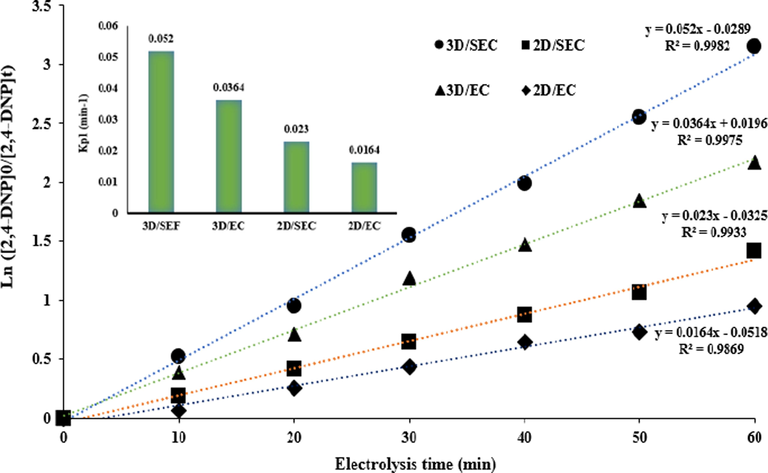
Kinetics of 2,4-DNP degradation by different processes (3D/SEC, 2D/SEC, 3D/EC, 2D/EC) at the optimum conditions (2,4-DNP concentration = 50 mg/L; pH = 3; electrolysis time = 60 min; current density = 5 mA/cm2; nanocomposite dose = 5 g/L; Na2SO4 concentration = 0.3 g/250 mL).
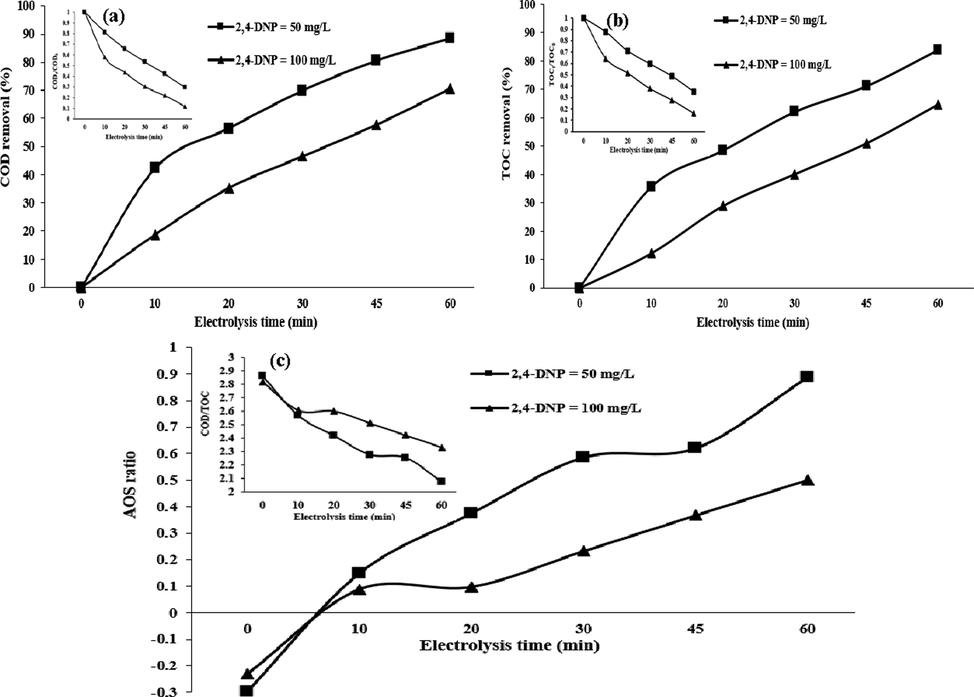
Performance of 3D/SEC process in the removal of (a) COD, (b) TOC, (c) AOS, and COD/TOC of 2,4-DNP (pH = 3; current density = 5 mA/cm2; nanocomposite dose = 5 g/L; Na2SO4 concentration = 0.3 g/250 mL, COD0 for 2,4-DNP concentration of 50 mg/L = 116.9 mg/L; TOC0 for 2,4-DNP concentration of 50 mg/L = 40.8 mg/L; COD0 for 2,4-DNP concentration of 100 mg/L = 231.06 mg/L; TOC0 for 2,4-DNP concentration of 100 mg/L = 81.9 mg/L).
According to the above-mentioned results, the mineralization and degradation of 2,4-DNP occur in the 3D/SEC-Fe/SBA15 process with G/β-PbO2 anode. As observed, the ratios of
and
do not reach zero at the end of 60 min; this is indicative of the formation of intermediates, except for water (H2O) and carbon dioxide (CO2), during 2,4-DNP degradation. Monitoring the electrolysis process was carried out using a Liquid chromatography-mass spectrometry (LC-MS) (Fig. 11). Mass spectrometry studies were considered for investigating and studying 2,4-DNP degradation according to the proposed method and, based on the species formed, the removal mechanism for this compound was suggested (Fig. 11).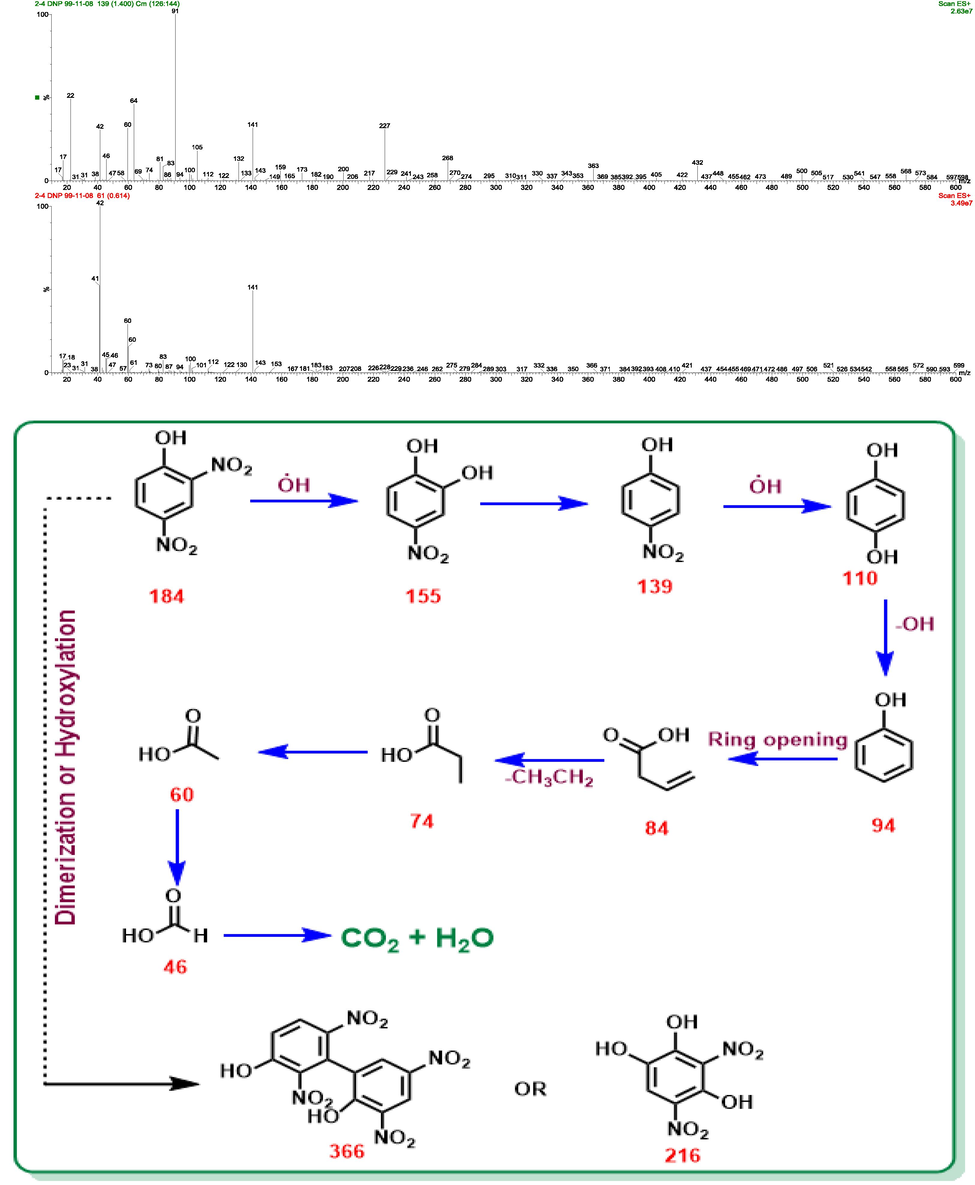
LC/MS chromatographs and proposed pathway for degradation of 2,4-DNP by 3D/SEC at the optimum condition.
According to the performed spectral studies and mass analyses, the mechanism for removing the 2,4-DNP compound is suggested as follows: initially, masses higher than 2,4-DNP are observed, which could be due to dimerization of the compound (m/z = 366) or hydroxylation of the 2,4-DNP compound (m/z = 216). The 2,4-DNP compound is converted to a new compound called 4-nitrobenzene-1,2-diol with m/z = 155 by losing a nitro functional group and replacing one of the nitro groups in the 2,4-DNP compound. 4-nitrobenzene-1,2-diol is converted to a new compound called 4-nitrophenol with the loss of a hydroxide group at m/z = 139. Loss of a nitro group and replacement of a hydroxide group produced 4-nitrophenol hydroquinone compound with m/z = 110. The compound of phenol with m/z = 94 is produced after the separation of the hydroxide group. Opening the aromatic ring is one of the main steps in the removal process and will be done by radical processes. Due to the opening of the ring, but-3-enoic acid is produced with m/z = 84, and with the loss of a CH3CH2 group, propionic acid with m/z = 74 is produced. Acetic acid with m/z = 60 and formic acid with m/z = 46 are the final compounds in the removal process (Table 5). Lastly, the final products were proposed to be carbon dioxide and water (Fig. 11). In Table 5, the intermediates formed during the 2,4-DNP degradation by the studied process, along with the IUPAC name and their attributed m/z have been reported. In this study, AOS parameter were investigated under optimum laboratory conditions (pH = 3; current density = 5 mA/cm2; nanocomposite dose = 5 g/L, Na2SO4 concentration = 0.3 g/250 mL, COD0 for 2,4-DNP concentration of 50 mg/L = 116.9 mg/L, TOC0 for 2,4-DNP concentration of 50 mg/L = 40.8 mg/L, COD0 for 2,4-DNP concentration of 100 mg/L = 231.06 mg/L, and TOC0 for 2,4-DNP concentration of 100 mg/L = 81.9 mg/L) for determining the biodegradability of 2,4-DNP in 3D/SEC-Fe/SBA15 process. Results obtained from studying mentioned parameter was indicative of an increase in values of AOS (for initial 2,4-DNP concentrations of 50 and 100 mg/L) in the effluent of the 3D/SEC-Fe/SBA15 process from −0.29 to + 0.88 and −0.23 to + 0.50, respectively (Fig. 10 (c)); the obtained result was observed to be consistent with the results of Mahmoudpoor et al. (Mahmoudpoor Moteshaker et al., 2020), Seid Mohammadi et al. (Seidmohammadi et al., 2021) and Dargahi et al. (Dargahi et al., 2021). Generally, the observed variations and intermediates confirmed the occurrence of the significant degradation and mineralization of 2,4-DNP under several oxidation-mineralization pathways and the production of highly mineralized products.
Molecular structure
Chemical name
m/z (Da)

2,4-dinitrophenol
183

4-nitrobenzene-1,2-diol
155

4-nitrophenol
139

hydroquinone
110

Phenol
94

but-3-enoic acid
84

propionic acid
74

acetic acid
60

formic acid
46
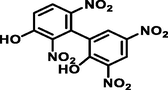
2′,3,5,6′-tetranitro-[1,1′-biphenyl]-2,3′-diol
366

3,5-dinitrobenzene-1,2,4-triol
216
3.9 Efficiency of 3D/SEC-Fe/SBA-15 and 2D/SEC processes on real wastewater
For this purpose, samples were collected from the effluent of Ardabil municipal wastewater treatment plant; certain amounts of 2,4-DNP were added to the wastewater samples and used as input wastewater in the reactor. The characteristics of the municipal wastewater used were presented in Table 6. It should be noted that due to the fact that total dissolved solids (TDS) and total suspended solids (TSS) are high in real wastewater and therefore have high electrical conductivity (EC), there is no need to add a supporting electrolyte such as sodium sulfate. Results of 3D/SEC-Fe/SBA-15 and 2D/SEC processes in removing 2,4-DNP from real wastewater samples under optimal test conditions (2,4-DNP concentration = 50 mg/L, pH = 7.4, electrolysis time = 60 min, current density = 5 mA/cm2, and nanocomposite dose = 5 g/L) were shown in Fig. 12. The results showed that 3D/SEC-Fe/SBA-15 and 2D/SEC processes under optimal test conditions, at inoculated 2,4-DNP concentrations of 50 mg/L to actual wastewater samples had the ability to provide 2, 4-DNP removal efficiencies of 91.6% and 67.5%, respectively. The reduction of 2,4-DNP removal efficiency in actual wastewater samples compared to synthetic samples may be due to the presence of organic compounds other than 2,4-DNP contaminants in the effluent.
Chemical compounds
Unite
Amount
Nitrate in terms of NO3
mg/L
14.5
Phosphate in terms of phosphorus
mg/L
4.8
Chloride
mg/L
120.5
Sulfate
mg/L
376.0
BOD5
mg/L
35.0
COD
mg/L
70.0
Dissolved oxygen (DO)
mg/L
5.1
Total suspended solids (TSS)
mg/L
58.0
Total dissolved solids (TDS)
mg/L
520.0
Electrical conductivity (EC)
µs/cm
1682.0
pH
–
7.4
Efficiency of 3D/SEC-Fe-SBA-15 and 2D/SEC processes in removing 2,4-DNP from real wastewater (municipal wastewater) (2,4-DNP concentration = 50 mg/L; pH = 7.4; electrolysis time = 60 min; current density = 5 mA/cm2; nanocomposite dose = 5 g/L).
4 Conclusion
The central objective of conducting this study was the evaluation and optimization of the degradation of 2,4-DNP in a 3D/SEC-Fe/SBA15 process using a G/β-PbO2 anode. The Fe/SBA15 was used as a fluidized bed in the reactor. The estimation of optimal conditions for the 3D/SEC-Fe/SBA15 process for the 2,4-DNP degradation was done using Taguchi statistical analysis. Based on this, pH of 5.0, electrolysis time of 60.0 min, initial 2,4-DNP concentration of 50.0 mg/L, and current density of 5.0 mA/cm2 were obtained as optimum laboratory conditions for the 3D/SEC-Fe/SBA15 process. Under the mentioned condition, the 2,4-DNP degradation efficiency using the studied process was 96.3%, and removal efficiencies of COD and TOC were 88.28% and 83.82%, respectively. Moreover, the pseudo-first-order kinetic model was obtained as the suitable method to describe the data related to degradation of 2,4-DNP in all four different processes (3D/SEC-Fe/SBA15, 2D/SEC, 3D/EC-Fe/SBA15, and 2D/EC). The kinetic coefficients of 2,4-DNP degradation in separate and hybrid systems were indicative of a large synergy in the degradation of pollutants. The degradation efficiency of 2,4-DNP was observed to be higher in the 3D electrochemical process than in 2D, which is due to the use of Fe/SBA15 electrode particles in the 3D system. The abundancy of intermediates identified by LC-MS analysis with m/z < 60, corroborated the strong degradation of 2,4-DNP in the 3D/SEC-Fe/SBA15 with G/β-PbO2 anode process.
Acknowledgements
This study was extracted from the research project with IR.ARUMS.REC.1399.316 at the Ardabil University of Medical Sciences. Thus, we acknowledge the research and technology deputy of the University for the financial support.
References
- Degradation kinetics and structure-reactivity relation of naphthenic acids during anodic oxidation on graphite electrodes. Chem. Eng. J.. 2019;370:997-1007.
- [Google Scholar]
- Application of Box-Behnken design for optimizing parameters of hexavalent chromium removal from aqueous solutions using Fe3O4 loaded on activated carbon prepared from alga: kinetics and equilibrium study. J. Water Process Eng.. 2021;42:102113
- [Google Scholar]
- Acridine yellow as solar photocatalyst for enhancing biodegradability and eliminating ferulic acid as model pollutant. Appl. Catal. B. 2007;73(3–4):220-226.
- [Google Scholar]
- A comprehensive study on the electrocatalytic degradation, electrochemical behavior and degradation mechanism of malachite green using electrodeposited nanostructured β-PbO2 electrodes. Water Res.. 2018;144:462-473.
- [Google Scholar]
- Convergent paired electrocatalytic degradation of p-dinitrobenzene by Ti/SnO2-Sb/β-PbO2 anode. A new insight into the electrochemical degradation mechanism, Applied Catalysis B: Environmental. 2020;261:118226
- [Google Scholar]
- Detoxification and/or increase of the biodegradability of aqueous solutions of dimethoate by means of solar photocatalysis. J. Hazard. Mater.. 2007;146(3):447-452.
- [Google Scholar]
- Diuron degradation using three-dimensional electro-peroxone (3D/E-peroxone) process in the presence of TiO2/GAC: Application for real wastewater and optimization using RSM-CCD and ANN-GA approaches. Chemosphere. 2021;266:129179
- [Google Scholar]
- The superior adsorption capacity of 2, 4-Dinitrophenol under ultrasound-assisted magnetic adsorption system: modeling and process optimization by Central Composite Design. J. Hazard. Mater.. 2021;418:126348
- [Google Scholar]
- Application of response surface methodology for optimization of trace amount of diazinon preconcentration in natural waters and biological samples by carbon mesoporous CMK-3. Biomed. Chromatogr.. 2017;31(5):e3874
- [Google Scholar]
- Electrochemical removal of amoxicillin using a Cu doped PbO2 electrode: Electrode characterization, operational parameters optimization and degradation mechanism. Chemosphere. 2019;233:762-770.
- [Google Scholar]
- Electrochemical degradation of ibuprofen using an activated-carbon-based continuous-flow three-dimensional electrode reactor (3DER) Chemosphere. 2020;127382
- [Google Scholar]
- Electrochemical oxidation metronidazole with Co modified PbO2 electrode: Degradation and mechanism. Sep. Purif. Technol.. 2016;166:109-116.
- [Google Scholar]
- Electrodegradation of 2, 4-dichlorophenoxyacetic acid herbicide from aqueous solution using three-dimensional electrode reactor with G/β-PbO 2 anode: Taguchi optimization and degradation mechanism determination. RSC Adv.. 2018;8(69):39256-39268.
- [Google Scholar]
- Highly effective degradation of 2, 4-Dichlorophenoxyacetic acid herbicide in a three-dimensional sono-electro-Fenton (3D/SEF) system using powder activated carbon (PAC)/Fe3O4 as magnetic particle electrode. J. Environ. Chem. Eng.. 2021;9(5)
- [Google Scholar]
- Electrochemical degradation of 2, 4-Dinitrotoluene (DNT) from aqueous solutions using three-dimensional electrocatalytic reactor (3DER): Degradation pathway, evaluation of toxicity and optimization using RSM-CCD. Arabian J. Chem.. 2021;15(3):103648
- [Google Scholar]
- Moving-bed biofilm reactor combined with three-dimensional electrochemical pretreatment (MBBR–3DE) for 2, 4-D herbicide treatment: application for real wastewater, improvement of biodegradability. RSC Adv.. 2021;11(16):9608-9620.
- [Google Scholar]
- Anodic oxidation of ketoprofen on boron-doped diamond (BDD) electrodes. Role of operative parameters, Chemical Engineering Journal. 2010;162(3):1012-1018.
- [Google Scholar]
- Study on catalytic and non-catalytic supercritical water oxidation of p-nitrophenol wastewater. Chem. Eng. J.. 2015;277:30-39.
- [Google Scholar]
- Electrochemical oxidation of ceftazidime with graphite/CNT-Ce/PbO2–Ce anode: Parameter optimization, toxicity analysis and degradation pathway. Environ. Pollut.. 2020;114436
- [Google Scholar]
- Hybrid electrochemical-granular activated carbon system for the treatment of greywater. Chem. Eng. J.. 2018;352:405-411.
- [Google Scholar]
- Degradation of trace aqueous 4-chloro-2-nitrophenol occurring in pharmaceutical industrial wastewater by ozone. International Journal of Environmental Science Technology. 2010;7(2):377-384.
- [Google Scholar]
- Electrochemical systems equipped with 2D and 3D microwave-made anodes for the highly efficient degradation of antibiotics in urine. Electrochim. Acta. 2021;392:139012
- [Google Scholar]
- Tailoring a new hyperbranched PEGylated dendrimer nano-polymer as a super-adsorbent for magnetic solid-phase extraction and determination of letrozole in biological and pharmaceutical samples. J. Mol. Liq.. 2021;338:116772
- [Google Scholar]
- Catalytic activity of Fe/SBA-15 for ozonation of dimethyl phthalate in aqueous solution. Appl. Catal. B. 2011;106(1–2):264-271.
- [Google Scholar]
- Design and properties of Sn–Mn–Ce supported activated carbon composite as particle electrode for three-dimensionally electrochemical degradation of phenol. Environmental Technology Innovation. 2021;23:101554
- [Google Scholar]
- Synthesis of resorcinol-functionalized multi-walled carbon nanotubes as a nanoadsorbent for the solid-phase extraction and determination of diclofenac in human plasma and aqueous samples. Colloid Interface Science Communications. 2022;46:100555
- [Google Scholar]
- Nanopowder synthesis of novel Sn (II)-imprinted poly (dimethyl vinylphosphonate) by ultrasound-assisted technique: Adsorption and pre-concentration of Sn (II) from aqueous media and real samples. Ultrason. Sonochem.. 2018;44:129-136.
- [Google Scholar]
- Performance of anaerobic baffled reactor (ABR) treating synthetic wastewater containing p-nitrophenol. Enzyme Microbial Technology. 2005;36(7):888-895.
- [Google Scholar]
- High selectivity of benzene electrochemical oxidation to p-benzoquinone on modified PbO2 electrode. Appl. Surf. Sci.. 2014;311:357-361.
- [Google Scholar]
- Improving the degradation of atrazine in the three-dimensional (3D) electrochemical process using CuFe2O4 as both particle electrode and catalyst for persulfate activation. Chem. Eng. J.. 2019;361:1317-1332.
- [Google Scholar]
- Corrosion mechanism of Ti/IrO2-RuO2-SiO2 anode for oxygen evolution in sulfuric acid solution. Corros. Sci.. 2020;170:108662
- [Google Scholar]
- Fabrication of slag particle three-dimensional electrode system for methylene blue degradation: characterization, performance and mechanism study. Chemosphere. 2018;213:377-383.
- [Google Scholar]
- Electrochemical removal of diazinon insecticide in aqueous solution by Pb/β-PbO2 anode. Effect of parameters and optimization using response surface methodology. Water Environ. Res.. 2020;92(7):975-986.
- [Google Scholar]
- Biodegradability and toxicity assessment of a real textile wastewater effluent treated by an optimized electrocoagulation process. Environ. Technol.. 2015;36(4):496-506.
- [Google Scholar]
- Synthesis of poly (acrylamide-co-itaconic acid)/MWCNTs superabsorbent hydrogel nanocomposite by ultrasound-assisted technique: swelling behavior and Pb (II) adsorption capacity. Ultrason. Sonochem.. 2018;49:1-12.
- [Google Scholar]
- Removal of azo and anthraquinone reactive dyes from industrial wastewaters using MgO nanoparticles. J. Hazard. Mater.. 2009;168(2–3):806-812.
- [Google Scholar]
- 2-Mercaptothiazoline modified mesoporous silica for mercury removal from aqueous media. J. Hazard. Mater.. 2006;134(1–3):245-256.
- [Google Scholar]
- Facile synthesis and supercapacitor performances of nitrogen doped CNTs grown over mesoporous Fe/SBA-15 catalyst. New J. Chem.. 2017;41(20):11591-11599.
- [Google Scholar]
- Efficient removal of 2, 4-dinitrophenol from synthetic wastewater and contaminated soil samples using free and immobilized laccases. J. Environ. Manage.. 2020;256:109740
- [Google Scholar]
- Improved degradation of diuron herbicide and pesticide wastewater treatment in a three-dimensional electrochemical reactor equipped with PbO2 anodes and granular activated carbon particle electrodes. J. Cleaner Prod.. 2021;322:129094
- [Google Scholar]
- Electrochemical process for 2, 4-D herbicide removal from aqueous solutions using stainless steel 316 and graphite Anodes: optimization using response surface methodology. Sep. Sci. Technol.. 2019;54(4):478-493.
- [Google Scholar]
- Electrochemical degradation of methylene blue dye using a graphite doped PbO2 anode: Optimization of operational parameters, degradation pathway and improving the biodegradability of textile wastewater. Arabian J. Chem.. 2020;13(8):6847-6864.
- [Google Scholar]
- Enhanced electrocatalytic degradation of bisphenol A by graphite/β-PbO2 anode in a three-dimensional electrochemical reactor. J. Environ. Chem. Eng.. 2021;9(5):106072
- [Google Scholar]
- Photocatalytic removal of cefazolin from aqueous solution by AC prepared from mango seed+ ZnO under uv irradiation. Global Nest Journal. 2018;20(2):399-407.
- [Google Scholar]
- Iron impregnated SBA-15, a mild and efficient catalyst for the catalytic hydride transfer reduction of aromatic nitro compounds. RSC Adv.. 2014;4(30):15381-15388.
- [Google Scholar]
- Degradation of cex antibiotic from aqueous environment by us/s2 o8 2–/nio process: Optimization using taguchi method and kinetic studies, Desalination. Water Treatment. 2019;171:444-455.
- [Google Scholar]
- Improved degradation of metronidazole in a heterogeneous photo-Fenton oxidation system with PAC/Fe3O4 magnetic catalyst: biodegradability, catalyst specifications, process optimization, and degradation pathway. Biomass Conversion Biorefinery 2021:1-17.
- [Google Scholar]
- Electrochemical degradation of azo dye CI Reactive Red 195 by anodic oxidation on Ti/SnO2–Sb/PbO2 electrodes. Electrochim. Acta. 2010;55(11):3606-3613.
- [Google Scholar]
- The effects of modifying reaction conditions in green sonochemical synthesis of a copper (II) coordination polymer as well as in achieving to different morphologies of copper (II) oxide micro crystals via solid-state process. Inorg. Chim. Acta. 2018;483:516-526.
- [Google Scholar]
- Removal of lead ions in drinking water by coffee grounds as vegetable biomass. Journal of Colloid interface Science. 2005;281(1):56-61.
- [Google Scholar]
- Biodegradability enhancement of a pesticide-containing bio-treated wastewater using a solar photo-Fenton treatment step followed by a biological oxidation process. Water Res.. 2012;46(15):4599-4613.
- [Google Scholar]
- Removal of nitrophenols and their derivatives by chemical redox: A review. Chem. Eng. J.. 2019;359:13-31.
- [Google Scholar]
- High efficient photocatalytic degradation of p-nitrophenol on a unique Cu2O/TiO2 pn heterojunction network catalyst. Environmental science technology. 2010;44(19):7641-7646.
- [Google Scholar]
- Electrochemical degradation of insecticide hexazinone with Bi-doped PbO2 electrode: influencing factors, intermediates and degradation mechanism. Chemosphere. 2019;216:812-822.
- [Google Scholar]
- Triblock copolymer syntheses of mesoporous silica with periodic 50 to 300 angstrom pores. Science. 1998;279(5350):548-552.
- [Google Scholar]
- Preparation of water-compatible molecularly imprinted thiol-functionalized activated titanium dioxide: selective adsorption and efficient photodegradation of 2, 4-dinitrophenol in aqueous solution. J. Hazard. Mater.. 2018;346:113-123.
- [Google Scholar]
- Enhanced Removal of Sulfonated Lignite from Oil Wastewater with Multidimensional MgAl-LDH Nanoparticles. Nanomaterials. 2021;11(4):861.
- [Google Scholar]
- A Review on Microbial Degradation of 2, 4-Dinitrophenol. Journal of Environmental Microbiology Toxicology. 2018;6(1):28-33.
- [Google Scholar]


