

Translate this page into:
Formulation and evaluation of quince seeds mucilage – sodium alginate microspheres for sustained delivery of cefixime and its toxicological studies
⁎Corresponding author. shazia.akram@uos.edu.pk (Shazia Akram Ghumman)
-
Received: ,
Accepted: ,
This article was originally published by Elsevier and was migrated to Scientific Scholar after the change of Publisher.
Peer review under responsibility of King Saud University.
Abstract
Abstract
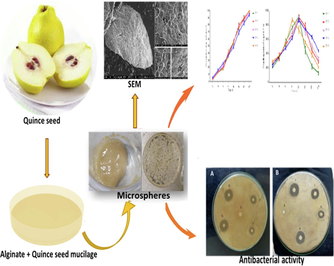
Quince seed mucilage was used in a combination of sodium alginate to develop sustained-release microspheres of cefixime. Physical characterizations such as FTIR, TGA, DSC, and SEM were performed on the prepared microspheres. The swelling of microspheres was maximum at pH 7.4 and reduced at acidic pH. The average particle size ranged from 679 µm ± 0.21 to 810 µm ± 0.31, while the drug encapsulation efficiency range was found as 73.76 ± 0.24–85.63 ± 0.46. In vitro release profile of QSM-alginate-cefixime microspheres followed Korsmeyer-Peppas model (R2 = 0.9732-–0.9946); and release was non-Fickian as we found value of n > 1. This study reveals the benefits of QSM-alginate microspheres for the sustained release of cefixime without any toxicity and it also improved antibacterial properties.
Keywords
Sodium alginate
Quince seed mucilage
Microspheres
Cefixime

1 Introduction
Quince (Cydonia oblonga) is a Central Asian native plant that grows abundantly in Pakistan and has therapeutic benefits. It is a member of the Rosaceae family. It is a deciduous tree with a yellow pome fruit. The Quince seed mucilage (QSM) encompasses glucuronic acid and xylose (glucuronoxylan); extracted from quince seeds by soaking them in water (Fattouch et al., 2007; Oliveira et al., 2007). The versatile biological and mechanical attributes of polysaccharide-rich QSM make it valuable and promising biomaterial for medical applications (Guzelgulgen et al., 2021). Various investigations on the physicochemical, structural, and mechanical properties of QSM have been conducted (Shahbazi & Moosavy, 2019). QSM primarily consists of a polysaccharide substance known as glucuronoxylan, responsible for its swelling and deswelling capabilities (Lindberg et al., 1990). The 1H and 13C nuclear magnetic resonance (NMR) spectroscopy supports the presence of significant amount of glucuronoxylan in QSM (Vignon & Gey, 1998). QSM has an average molecular weight (9.61 × 10⁶ g/mol) greater than the molecular weight of commercially available gums like gellan gum, guar gum and xanthan gum (Lindberg et al., 1990; Rezagholi et al., 2019).
QSM works well as an emulsifier and foaming agent. It is a suitable thickening agent with a higher viscosity due to its large molecular weight. Due to the shielding effect of ions on the polymer chain, QSM has an intrinsic viscosity of 16.96 dl/g at 25 °C, which decreases with increasing temperature and salt concentrations (Jouki et al., 2014). Being an economical biopolymer along with ideal water absorption power, the QSM can be utilized as a stabilizer, edible coating/ film material, and controlled drug delivery carrier in the field of pharmaceutical products (Beikzadeh et al., 2020a).
Sodium alginate has been used in a variety of investigations, as well as the blending of diverse biopolymers (Ghumman et al., 2017; Kulkarni et al., 2000). Given the great importance of water-swellable mucilage from natural sources, our goal was to combine QSM with sodium alginate to limit drug release (Kanimozhi et al., 2019). Sodium alginate network with calcium ions is unstable due to the occurrence of single-valence salts; hence stabilization is required (Shalumon et al., 2011). Combining sodium alginate with different polymers results in a variety of products with the required chemical and mechanical properties for controlling drug swelling and release rate (Ghumman et al., 2020; Kulkarni et al., 2002). When single-valence salts are present, the sodium alginate network containing calcium ions is unstable; hence, stabilization is required. Combining sodium alginate with different polymers enables the creation of a variety of blended copolymers; for controlling drug swelling and release rate (Chalitangkoon et al., 2020; Kulkarni et al., 2001).
The sustained release medication framework was created to gradually and consistently release the required concentration in the blood for a prolonged period (Liu et al., 2021). Microspheres, which are round spheres of polymeric particles with physicochemical and biological stability properties, are considered one of the best in sustained release drug frameworks (Uyen et al., 2020). Microspheres are also utilized to encapsulate other compounds, such as RNA/DNA, proteins, peptides, and medicines (Garbayo et al., 2008; Wischke & Schwendeman, 2008). For the preparation of the microspheres, various natural and synthetic polymers were employed, and they have been shown effective for long-term drug administration (Ghumman et al., 2019). The natural starch, chitosan, xanthan gum, guar gum, alginate acid, and agar have been accomplished incredibly in this respect. They're like extracellular matrices but with more chemical diversity and biocompatibility (Noreen et al., 2017; Noreen et al., 2020).
Cefixime trihydrate, an antibiotic, is used to cure urinary tracts and respiratory infections. It is soluble in acidic media but sparsely soluble in water (Vasam et al., 2016). Considered highly successful in treating local and systemic infections, such as UTI, otitis media, pharyngitis, tonsillitis (Ata et al., 2020). It binds to penicillin and delays mucopeptide synthesis in the bacterial cell walls (Adam, 1998). The ADRs are diarrhea, nausea, skin rash, pain in joints, headache, dizziness, etc. (Brogden & Campoli-Richards, 1989). The bioavailability of cefixime for 200 mg oral solution is 52 %; for 200 mg capsule 47 %; for 400 mg capsule 42 % and has a biological half-life of 3–4 h (Hamilton-Miller, 2000). The bioavailability can be enhanced by loading it in microspheres (polymeric formulation of sodium alginate and QSM) for an ideal sustained release. Therapeutic systems for controlled drug distribution are the name given to such compositions.
The aim of this investigation was the development of microspheres using a blend of sodium alginate with QSM to avoid easy breakage of the microspheres and regulate swelling behavior. The sugar composition profile of QSM was characterized by HPLC. The physicochemical attribute and surface topology of the formulations were checked via FTIR, TGA, drug entrapment efficiency, and SEM. The swelling studies were performed at pH 1.2 and pH 7.4. In vitro toxicity of natural polymer and antibacterial efficacy of the developed formulations were also studied. The drug release was tested in simulated intestinal fluid and gastrointestinal tract (SIF). Various models were used to investigate the in vitro drug release profile of cefixime. The developments presented in this study can be used in a variety of industrial fields.
2 Experimental
2.1 Materials
Cefixime trihydrate was sourced from Getz Pharmaceuticals Pvt. Ltd., Pakistan. Quince seeds were taken from local market, sodium alginate (Sigma-Aldrich), Calcium chloride (Merck), Potassium dihydrogen phosphate, Monobasic potassium phosphate, Hydrochloride, Sodium hydroxide were purchased from Merck. Using deionized water, all the solutions were made, and the mucilage was extracted.
2.2 Isolation of QSM
Clean quince seeds (100 g) were soaked for 2 h in 500 mL deionized water, then heated to 50 °C for 30 min until totally separated, and then allowed to cool for 1 h. Seeds release the mucilage separated through a muslin cloth via gentle rubbing. Add ethanol to the collected filtrate to precipitate mucilage, then dry the precipitates in a 40 °C oven. After drying, QSM was gathered, grounded with a dry blender and sieved (# 80 sieve), and kept in a sealed plastic container for further utilization (Hemmati & Mohammadian, 2000).
2.3 Characterization of sugar composition profile of QSM
HPLC was performed using the Agilent 1100 HPLC system (Shimadzu Model SPD20A). The analytical column was C18 (4.6 mm × 250, 5 µm). Mobile phase of 50 mM sodium phosphate (15%) of pH 6.9 and acetonitrile (40 %) with a gradient variation of 15–17.5–20% acetonitrile and increased linearity from 0–10–46 min; using wavelength of 250 nm (Hopur et al., 2011). Elution was performed at room temperature with a flow rate of 1 mL/min. The standards used were mannose, rhamnose, glucose, galactose, and D-xylose.
2.4 Experimental design and optimization
Response surface methodology (RSM), a well-established statistical and mathematical approach, is often used for the processing of variables to achieve the best response. In this work, a 32 central composite design (CCD) was applied. The two independent variables ALG concentration (X1) and QSM concentration (X2) were studied at three levels designated as −1, 0 and + 1. The drug encapsulation efficiency DEE (%); Y1 mean diameter (µm); Y2 and % yield; Y3 were considered to be dependent variables/responses. The design matrix was constructed by using Design-Expert (version 13.0.1; Stat-Ease, Inc, Minnesota, USA) Software. The models namely linear, 2-factor, quadratic and cubic models were applied followed by analysis of variance (ANOVA) so as to estimate the model’s significance with probability p values < 0.05 (Fares et al., 2018; Patel et al., 2021).
The formulations were optimized by the constraints, applied in Design-Expert Software, shown in Table 1a and 1b. The suggested formulations were prepared and evaluation was carried out in triplicate for validation of independent variables and predicted responses obtained by the software. The formulations showing the predictability value of 95% or more were selected to carry further research analysis. All data expressed as mean ± S.D.; n = 3. *DEE (%): Drug encapsulation efficiency (%). *All data expressed as mean ± S.D.; n = 3.
Independent variables (Factors)
Level of variables
Low (-1)
Medium (0)
High (-1)
X1: aALG (g)
1
2
3
X2: bQSM (g)
1
2
3
Responses
Model
r2
Adjusted r2
Adequate Precision
p-value
Y1: DEE (%)
DEE = 9.19 + 0.3270*X1 + 0.3430*X2Linear
0.9208
0.8944
13.4
0.0028
Significant
Y2: Mean diameter (μm)
Mean Diameter = 27.02 + 0.2346*X1 + 0.005*X2 − 0.8625*X1X22FI
0.8350
0.6527
7.54
0.04
Significant
Y3: Yield (%) Yield = 77.88 + 6.37*X1 + 6.06* X2
Linear
0.7397
0.6529
6.61
0.01
Significant
Runs
Levels with actual values
* DEE (%)
Mean diameter (µm)
%Yield (w/v %)
X1
X2
1
3.00
1.00
82.15 ± 0.39
810 ± 0.31
80 ± 0.41
2
1.50
2.50
85.23 ± 0.31
734 ± 0.28
75 ± 0.26
3
2.00
2.00
84.95 ± 0.23
758 ± 0.24
73 ± 0.15
4
2.50
1.50
85.63 ± 0.46
712 ± 0.15
81 ± 0.33
5
1.00
3.00
85.11 ± 0.31
765 ± 0.11
82 ± 0.17
6
1.00
1.50
74.53 ± 0.21
699 ± 0.19
68.54 ± 0.15
7
1.00
1.00
73.76 ± 0.24
679 ± 0.21
67 ± 0.21
8
2.00
1.00
79.61 ± 0.27
718 ± 0.31
70 ± 0.16
9
1.00
2.00
76.52 ± 0.32
706 ± 0.11
70.12 ± 0.13
2.5 Preparation of QSM - alginate microspheres
Sodium alginate dispersion was prepared in distilled water with stirring 300 rpm then QSM was added to this dispersion through continuous stirring. Later cefixime was added to the QSM - alginate dispersion; this dispersion was added dropwise to 100 mL of 7% CaCl2 solution using a needle (24-G). The microspheres were then separated, rinsed in purified water, and kept for 24 h of drying at ambient temperature for, after that stored in a sealed amber-colored bottle with a desiccator (Sindhumol et al., 2018). QSM-to-ALG ratio was varied in batches CF-1 to CF-9; the composition data is shown in Table 1b.
2.6 Physicochemical analysis of QSM-alginate microspheres
2.6.1 FTIR studies
Microsphere samples were crushed into fine powder. Next, potassium bromide (KBr) pellets were analyzed by FTIR spectroscopy. The enclosed sample in the KBr pellets was put in the sample holder. The wavelength region was about 4000–400 cm−1, and the scanning resolution was 2.00 cm−1 with a speed of 1.00 cm/s (Shivashankar & Mandal, 2013).
2.6.2 DSC and TGA
TGA/DSC was used on a Shimadzu thermal analyzer to determine the physicochemical changes. Weight the sample precisely on sealed aluminum pans heated at 10 °C with nitrogen flowing over the sample temperature range of 20–800 °C and maintaining an inert environment at a rate of 20 mL/min (Mishra et al., 2015).
2.7 Assessment of microspheres
2.7.1 Assessment of rheology of microspheres
Different parameters were evaluated to analyze microspheres flow characteristics, i.e. Bulk and Tapped density, Carr’s index, Hausner’s ratio and angle of repose (θ). For optimal flow, the angle of repose should be around 30°. Carr's index (5–15 %) indicates good flow, in case of Hausner's ratio, the value < 1.25 specifies good flow (Ambrogi et al., 2002; Petros & DeSimone, 2010).
2.7.1.1 Drug entrapment efficiency
QSM-alginate-based Cefixime microspheres weighing 100 mg were crushed to a fine powder. The powder was employed in a phosphate buffer (pH 7.4) of 250 mL flask and kept at 37 °C for 24 h. The microspheres were stirred for about 20 min using a magnetic stirrer at 600 rpm after 24 h. Whatman paper was used to filter microsphere trash (No.40). A UV–VIS spectrophotometer set at 288 nm was used to measure the drug infiltrate (Shimadzu, Japan) (Murtaza et al., 2012).
The DEE % of microspheres (n = 3) was estimated using the following formula.
2.7.1.2 Microsphere size measurement
QSM-alginate loaded cefixime microspheres size was measured by optical microscopy (SZ-6045, Olympus, and Tokyo, Japan) (Ghumman et al., 2019). Each experiment was performed in triplicate.
2.7.1.3 Shape and surface morphology
QSM-alginate microspheres surface morphology was measured through scanning electron microscopy by using SEM-JEOL, JSM-6100 SEM, JAPAN. Microspheres were mounted on an aluminum stub by dual sticky tape. The stub was then coated with a thick layer of excellent gold–palladium alloy (150-200A°) using the JFC1100 fine coater. The microspheres were then photographed after being examined. (Ghumman et al., 2020).
2.7.1.4 Evaluation of in vitro swelling behavior
Swelling characteristics of QSM-alginate microspheres were employed in 500 mL of particular media using dissolution apparatus USP at 37 ± 1 °C with 50 rpm. At specified time intervals, the swollen QSM-alginate microspheres were taken, dried with tissue paper, and weighed (Nayak et al., 2012). 500 mL of respective media were poured into a dissolving apparatus USP at 37 ± 1 °C and 50 rpm.
The swelling index of microspheres was determined by the given equation.
2.7.1.5 In vitro drug release profiles
QSM-alginate microspheres containing cefixime were investigated in vitro using the USP-II dissolution device (Pharma max test). 100 mg QSM-alginate microspheres were accurately weighed and inserted in 900 mL; 0.1 N HCl of pH 1.2. The release of drug was checked in this buffer for 2 hrs, then further testing was performed in phosphate buffer of pH 7.4; for next 22 hrs. The sample of 5 mL was taken as of the dissolution vessel at a predetermined time interval by replacing an equivalent volume of dissolution medium. After filtering the sample solution via a 0.45 µm membrane mesh, the filtered samples absorbance was measured using using λmax of 288 nm to observe the absorption (Nayak et al., 2013).
2.7.1.6 Drug release kinetic analysis
The release data of cefixime be fitted for few essential mathematical models; for the evaluation of release kinetics. Using the Korsmeyer-Peppas model, the values of n were obtained to identify the drug release pattern (Freitas & Marchetti, 2005; Mendyk et al., 2012). Different models applied on drug release profiles are:
If the ‘n’ value is 0.45 – 0.89, it is non-Fickian transport, while n > 0.89 describes super case II transport. The dissolution of polymer matrix normally follows case II transport (Kedar et al., 2010). With Kinet DS 3.0 (2010), the squared correlation coefficient (R2) values of the various kinetic models were compared.
2.8 Acute toxicity studies of QSM in Wistar rats
Quince seeds mucilage - sodium alginate - cefixime loaded microspheres were prepared and acute toxicity analysis was done by applying a maximal dose tolerance method. Swiss albino mice (20–25 g) were procured from animal housing of University of Sargodha (UOS) and oral route was used for administration of formulation in tested animals. OECD (Organization for Economic Co-operation and Development) guidelines were following to carry out chemical texting in all experiments that were additionally confirmed by ethical committee of UOS (Ref. No. 153–2020/PREC). Two groups, microspheres non-treated and treated, dividing in equal number (n = 6) of mice were kept in clean housed facility. Standard diet (SD) plus free water supply was maintained for each cage under 12 h light/dark cycle. Quince seeds mucilage - sodium alginate - cefixime loaded microspheres were given by oral syringe method to treated group only. The dose of quince seeds mucilage - sodium alginate - cefixime loaded microspheres used for testing, was according to testing criteria of excipient toxicity. Multiple factors linked to mice sickness, death or any type of adverse sign/activity were noticed twice daily for consecutive 10 days. Biochemical/histopathological analysis were performed after completion of treatment period. Treated group was compared with reference (non-treated) group for each parameter. For biochemical analysis, blood and for histological analysis, vital organs were collected from all mice. Difference between histological and pathological signs were done by analysis of biomarkers such as ALT, AST, cholesterol, triglycerides, creatinine, urea and uric acid. Relative organ weight was also noticed for each vital organ. Different vital organs were preserved separately in 10 % formalin buffered solution and slides holding cut tissue were stained by hematoxylin-eosin to observe any kind of pathological changes in each tissue histology.
2.9 In vitro cytotoxicity study of QSM via MTT assay
The MTT test was used to assess the cytotoxic impact of QSM on the MCF 7 breast cancer cell line (Ahmadian et al., 2009). In DMSO, various QSM concentrations (1.5, 3.12, 6.25, 25, 50, 100, and 200 g/mL) were produced and filtered using a 0.22 µm filter. The malignant cell lines were plated on a 96-well plate with 100 g/mL streptomycin, 100 U/mL penicillin, and foetal bovine serum in Dulbecco’s modified eagle medium (DMEM) (15%). In the presence of 5% carbon dioxide, the plate was nurtured for 24 hrs. at 37 °C. Afterward, cells were treated with 100 µL of various concentrations of QSM solution and incubated under the same conditions for another 48 hrs. The cells' morphology was assessed after they had been incubated. After that, each well was filled with MTT solution and left to incubate for 4 h. The culture medium was removed as soon as the incubation period was finished. The insoluble purple formazan was degraded in 100 µL of DMSO to generate a shaded arrangement (pink to purple) that was analyzed using UV light absorption. To calculate the rate of cell suitability, we utilized the following equation.
2.10 Antibacterial activity
Antibacterial activity of the formulations were investigated by disc diffusion technique using Salmonella typhi and Bacillus subtilis as test organisms (G. T. Bauer, 1966). UV sterilized petri plates has been used for the cultivation of test bacteria. (Noreen et al., 2020). The test bacteria were inoculated in 5 mL of LB broth (1% NaCl, 1% Trypton, and 0.5 % yeast extract, pH 7.4), and at 37 °C, the bacteria were grown for 24 h. 70 µL bacterial culture was placed into the midst of LB agar plates (LB broth and 1.5 % Agar) and spread uniformly with an ethanol-washed glass spreader. Inhibitory zones were found using a zone reader after all; samples were cultured in the bacterial lawn for 24 h at 37 °C.
2.11 Statistical analysis
GraphPad Prism ver. 5.00 has been used. The R2 and model selection criterion (MSC) values for the accuracy analysis and the predictability of different kinetic models was evaluated using DD Solver software.
3 Results and discussion
3.1 Sugar composition profile of QSM
Analysis of polysaccharide composition linked to QSM was performed by the above-described method. Fig. 1 (i) demonstrates that QSM was mainly composed of glucose and D-xylose when analysed with respect to standards; mannose, rhamnose, glucose, galactose, and D-xylose (Fig. 1, ii). The peak corresponding to D-Xylose was the farthest major peak with the retention time of 44.16 min, glucose peak was observed at the retention time of 38.95 min. The small peaks related to mannose, rhamnose, and D-galactose were also observed, indicating the presence of a small quantity in QSM. QSM has a high proportion of glucuronic acid and partially O-acetylated (4–O–methyl-D-glucurono)-D-xylose. QSM is generally named glucuronoxylan (Hopur et al., 2011; Lindberg et al., 1990).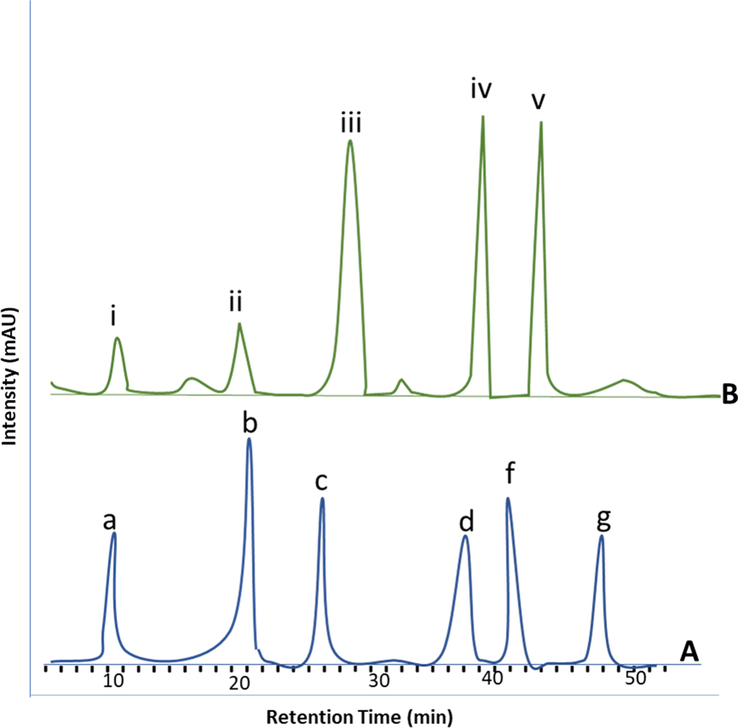
HPLC chromatograms of polysaccharides (A) QSM polysaccharides a: Mannose, b: Rhamnose, c: Glucose, d: Galactose, e: D-Xylose (B) Standard polysaccharides. i: Mannose, ii: Rhamnose, iii: Glucose, iv: Galactose, v: D-Xylose.
3.2 Formulation optimization
The essential parameter in drug designing is minimizing trial runs which ensures less time duration with better practical efficiency. To overcome the improper optimization routes, CCD has proven to be an effectual tool. In the present study, the drug matrix obtained from CCD and associated regression parameters, p-value and F-values are presented in Table 1a and 1b. The concentrations of both polymers i.e. ALG and QSM showed a statistically significant value for dependent responses (p ≤ 0.05). Moreover, the adequate precision higher than 4 in all cases revealed an acceptable fitting degree and sufficient signaling (Pourzamani et al., 2018). The coefficient of variance (C.V.) was measured to be 0.45%, 1.61 and 2.26% for DEE, mean diameter and % yield offering the substantial accuracy of tests. From the results, linear polynomial equation was used to determine the dependence of responses on factors, shown in Table 1a. The positive values (ALG and QSM) indicating an improvement in responses (DEE, mean diameter and % yield) whilst the negative values indicated that response efficiency doesn’t increase with factor improvement (Afzalinia & Mirzaee, 2020; Jaswir et al., 2019).
Additionally, there was a good agreement between predictable and actual values which advocated the adequacy of models, Fig. 2. The linear model was found to be adequate for DEE % and % yield whereas 2FI was approved for mean diameter, equations shown in Table 1a and 1b. The further correlation between independent factors with varying levels of responses was done by 2D contour and 3D surface graphs via RSM, shown in Fig. 2.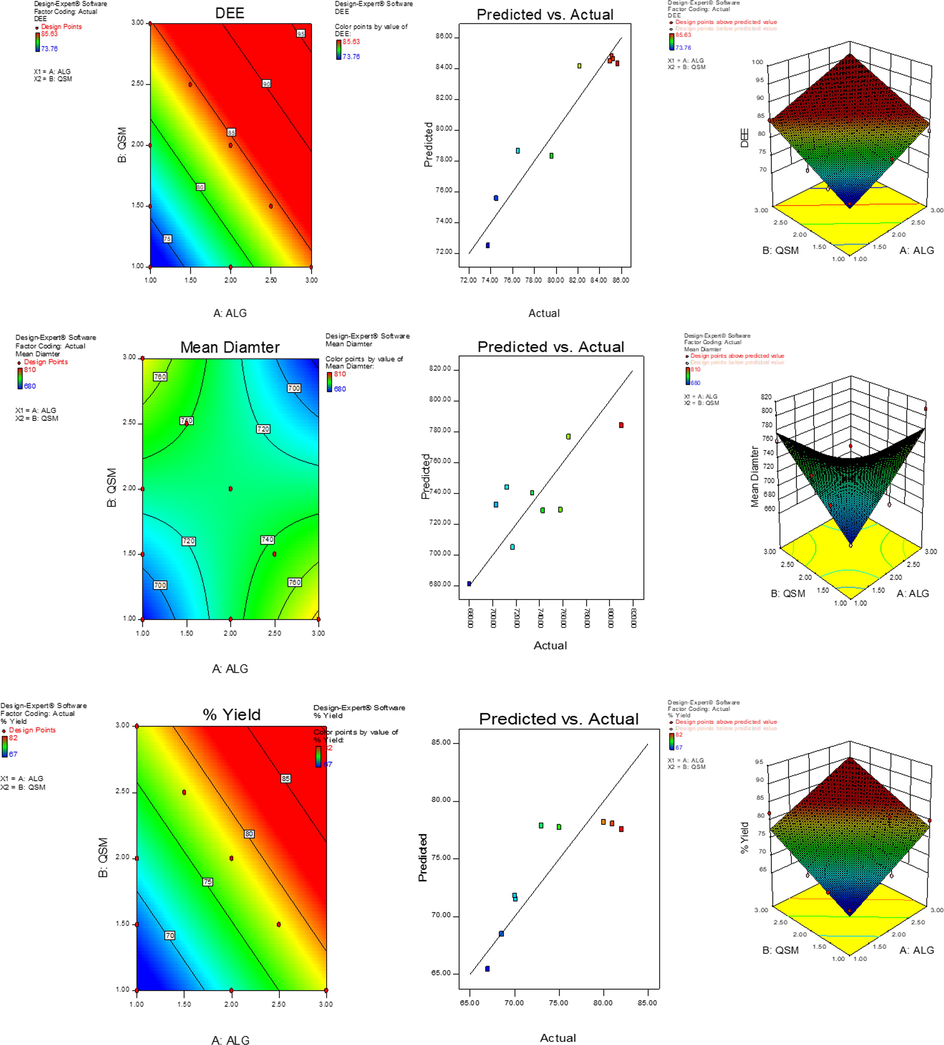
(a) 3D response surface, predicted vs actual value plots and 2D contour graphs showing the effect of ALG and QSM concentration on DEE (%) (b) mean diameter (µm) (c) % yield (w/v%).
3.3 Physicochemical analysis of (QSM-alginate) microspheres
3.3.1 Fourier transformed infrared (FTIR) spectroscopic studies
To observe any sort of drug-polymer interaction, FTIR spectroscopy analysis of (QSM-alginate) unloaded and (QSM-alginate-cefixime) loaded microspheres was done, as shown in Fig. 3. Cefixime exhibited an amino (–NH2) group absorption peak at 3280 cm−1 in spectroscopic analysis. A characteristic (C⚌O) stretching of a strong band linked to non-conjugated carboxylic acid linked to lactum was seen at 1765 cm−1. Further, peaks linked to amide carbonyl group were observed at 1669 cm−1. Multiple absorption peaks (3300, 2960, 1770, 1670, 1560, 1540, and 1310 cm−1) represent the pure cefixime. The presence of the carbonyl group (C⚌O) at characteristics peaks of 1620 and 1420 cm−1 indicates the presence of uronic acid residues in QSM. Peaks linked to 1200–1000 cm−1 represent the presence of glycosides association linked to the polysaccharide. Further, the peak at 1723 cm−1 is linked to the oxidation of glucose plus the formation of a C⚌O group. At 3262 and 2920 cm−1, stretching bands are linked to O–H and C–H groups (Amaniampong et al., 2017). Overall, these multiple peaks represent the whole polysaccharide makeup in QSM and are confirmed with the standard (Murtaza et al., 2012).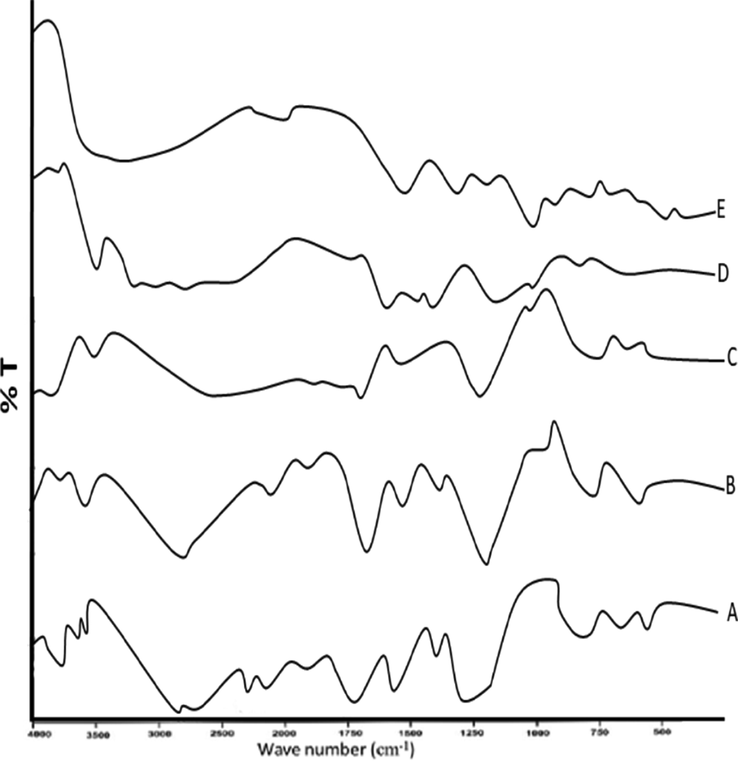
FTIR spectra of (A) loaded microspheres (B) QSM, (C) unloaded microspheres (D) cefixime (E) sodium alginate.
QSM-alginate-cefixime loaded microspheres linked FTIR analysis is shown in Fig. 3A. Stretching linked to amino (—NH2) group appeared at 3284 cm−1 and carboxylic acid (—C⚌O) group at 1771–1770 cm−1, stretching of amide, carbamate at 1670–1669 cm−1, aliphatic C—H stretching linked to the region 1541–1540 cm−1 and oxime C⚌N stretching can be seen at 1594–1592 cm−1 (Kanimozhi et al., 2019; Rezagholi et al., 2019). The pattern of Fig. 3B represents the QSM demonstrated by a peak at 1732 cm−1, and this peak is linked to carboxylic acid (—COOH) group stretching. Additionally, QSM-alginate unloaded microspheres show peaks at 1612 and 1423 cm−1 (Fig. 3C), absorption bands were seen suggesting asymmetrical and symmetrical stretching of carboxylate anion, respectively. O—H stretching groups were linked to the peaks that appeared between 3400 and 3700 cm−1 (Murtaza et al., 2012). Therefore, the FTIR spectrum of QSM-alginate-cefixime loaded microspheres represents multiple absorption peaks at different points (3284, 2900, 1770, 1670, 1592, 1539, and 1338 cm−1). Hence, the QSM-alginate polymer blend had various characteristic peaks of cefixime without any significant shift. Overall, no interaction linked to drug and polymer was seen as confirmed by the above analyses.
3.3.2 Thermogravimetric analysis (TGA) and differential scanning calorimetric (DSC)
The measurement of weight loss linked to temperature was confirmed by TGA analysis. All responses observed linked to TGA analysis are shown in Fig. 4. TGA analysis curve linked to pure cefixime showed endothermic peak around 100 °C due to water evaporation and then very small changes linked to weight till 250 °C as revealed in Fig. 4Ia. QSM showed three stages of decomposition, other writers ascribed the early modest weight loss in samples to the loss of conjugated and structured moisture of biomaterials, or to water adsorption as intermolecular hydrogen bonds water towards the saccharide framework. The degradation of polysaccharides was thought to be the cause of the second and third weight loss episodes, which were defined by a weight loss; as shown in Fig. 4Ib. TGA curve linked to QSM-alginate loaded microspheres (Fig. 4Id) showed initial weight loss linked to moisture loss from microspheres at 82 °C; overall, no significant changes were observed even at 350 °C (Mishra et al., 2015). Microspheres formulations made by a combination of QSM-alginate were found thermally stable by TGA analysis.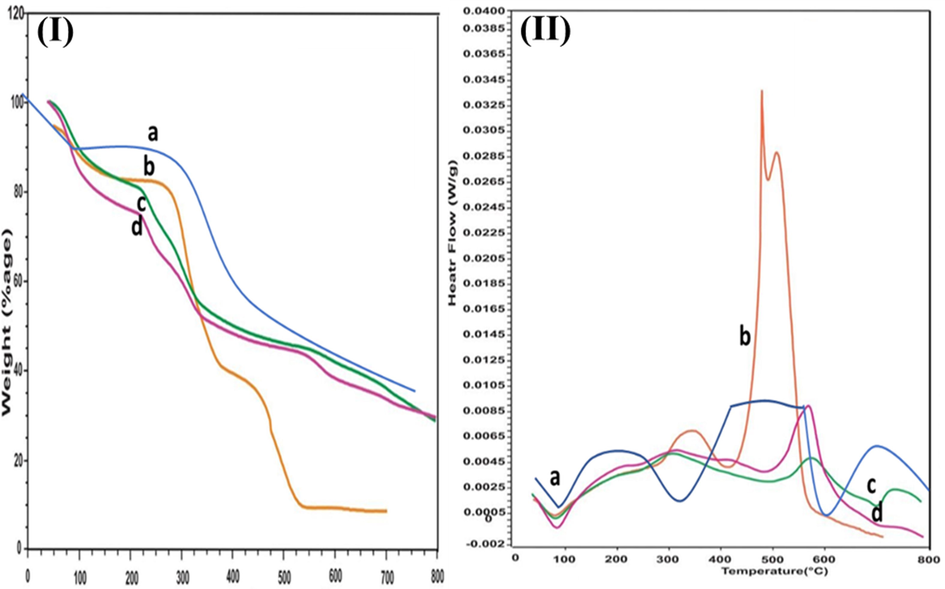
TGA & DSC curves overlay of samples. 3(I). TGA curves of (a) cefixime (b) QSM (c) unloaded microspheres of QSM/alginate (d) loaded microspheres of QSM/alginate containing cefixime. 3(II). DSC curves of (a) cefixime (b) QSM (c) unloaded microspheres of QSM/alginate (d) loaded microspheres of QSM/alginate containing cefixime.
DSC curve linked to cefixime (Fig. 4IIa) showed an endothermic peak at 126.36 °C that represents water loss during the heating process from the drug used and one exothermic peak 223 °C corresponding to its melting point (200–225 °C). The breakdown of glycosides linkages in the cellulosic structure caused the QSM (Fig. 4IIb) to decompose about 300 °C. Cefixime-loaded microsphere (Fig. 4IId) linked endothermic peaks showed similarity to the above-described peaks linked to the melting point of pure cefixime. Together, these analyses indicate the absence of any physicochemical interaction of cefixime with polymers (Nayak et al., 2013).
3.4 Evaluation of (QSM-alginate) microspheres
3.4.1 Measurement of rheological properties
Microspheres of QSM-alginate loaded with cefixime were evaluated by physical parameters; (percentage yield, bulk density, tapped density, angle of repose, Carr’s index, and Hausner’s ratio) as mentioned in Table 2. Carr’s index represented value below 10%, and Hausner’s ratio represented value < 1.2; Angle of repose was below 30° of all formulated batches of cefixime. The angle of repose of formulation CF-4 was 21.20°±0.72, and the compressibility index was 3.17 ± 0.14, respectively, representing the excellent flow and compressibility properties (Freitas & Marchetti, 2005). Data is expressed as mean ± S.D. of at least triplicate.
Formulation
Angle of repose
Bulk density
Tapped density
Carr’s index
Hausner’s Ratio
CF-1
22.44 ± 0.45
0.307 ± 0.005
0.328 ± 0.006
3.23 ± 0.06
1.034 ± 0.02
CF-2
25.33 ± 0.37
0.387 ± 0.008
0.424 ± 0.001
1.65 ± 0.18
1.016 ± 0.02
CF-3
29.42 ± 0.37
0.462 ± 0.007
0.446 ± 0.005
5.26 ± 0.11
1.055 ± 0.06
CF-4
21.20 ± 0.72
0.319 ± 0.008
0.310 ± 0.001
3.17 ± 0.14
1.022 ± 0.02
CF-5
26.42 ± 0.34
0.343 ± 0.008
0.456 ± 0.005
4.72 ± 0.13
1.055 ± 0.01
3.4.2 Drug encapsulation efficiency and % yield
Drug encapsulation efficacy (%) was within the range from 73.76 ± 0.24–85.63 ± 0.46% for all (QSM-alginate) microspheres formulations, as presented in Table 1a and 1b. As the ALG:QSM ratio increased produces big size droplets with a smaller surface area, resulting in slower drug diffusion from the microsphere, resulting in higher encapsulation efficiency. This could be also increased cross-linking by preventing medication leakage into the cross-linking solution CaCl2 (Ghumman et al., 2020). The percentage yield also improved as the ratio of polymers was enhanced (Table 1a and 1b), possibly due to increased active binding sites of calcium in the polymeric chains and, as a consequence, a higher level of copolymerization.
3.4.3 Microspheres size analysis
The microsphere size was between 679 ± 0.21 and 810 ± 0.31 µm, as presented in Table 1b. As the ALG:QSM ratio increased resulting in improved cross linking and also increased the viscosity of the polymeric solution , the available free sites will be reduced and as a resultant larger size of microspheres formed (Ghumman et al., 2019).
3.4.4 Scanning electron microscopy
Morphology of (QSM-alginate-cefixime) microspheres was analyzed by SEM, as presented in Fig. 5. The SEM of the drug-loaded microspheres revealed that most of the microspheres were spherical in shape with rough surface plus characteristics enormous wrinkles and cracks. However, because to the loss of solvent during drying, deepening was discovered. The sandy appearance of sodium alginate, which has a distinct and spherical shape has abrasive outer layer and numerous cracks, could be attributable to drug surface-associated crystals (Murtaza et al., 2012).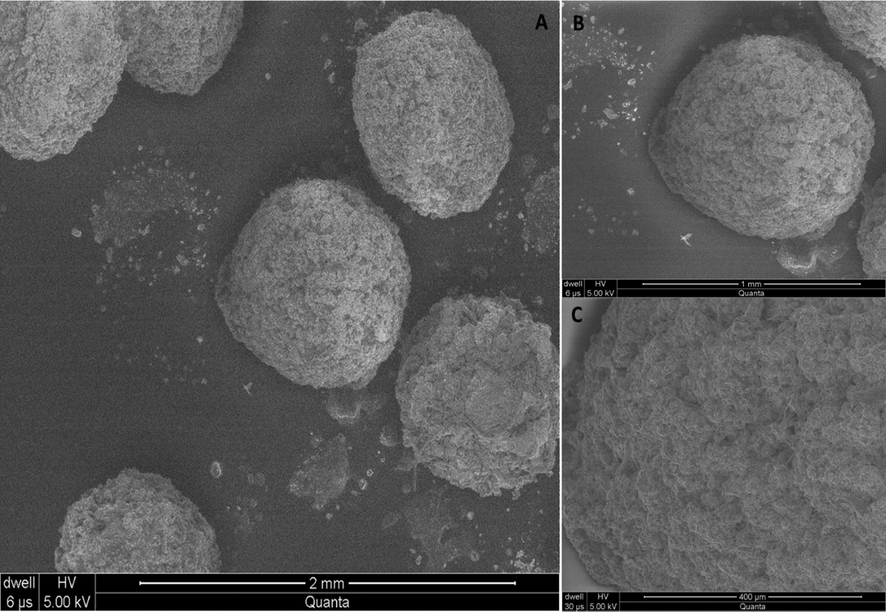
Scanning electron microphotograph of microspheres of QSM-alginate containing cefixime (A) at 2.00 mm (B) 1.00 µm and (C) 400 µm.
3.4.5 Swelling behavior of microspheres
QSM-alginate-cefixime microspheres linked swelling analysis was done at both 0.1 N HCl (acidic buffer - pH 1.2) and PB (basic buffer - pH 7.4), as shown in Fig. 6 (A and B). QSM-alginate-cefixime microspheres linked swelling index was found lower at acidic pH than in basic buffer. This behavior was linked to the shrinkage of microspheres at low pH due to the presence of sodium alginate. The swelling of microspheres revealed a strong pH dependence due to the effects of pH on the connection between Ca2+ and —COO— in the alginate component. At pH 1.2, none of the microspheres inflated significantly, but at pH 7.4, they swelled rapidly with increasing time until collapse. Crosslinking between Ca2+ and —COO— resulted in strong hydrogen-bond interactions and thus the stabilization of the framework. inhibited the swelling behavior of the microspheres at low pH (Lin, Huang, Chang, Feng, & Yu, 2011). At a basic pH, there was more swelling, followed degradation and breakdown. Ion exchange in the basic buffer could explain the swelling behavior of QSM-alginate-cefixime microspheres. This exchange is mediated by QSM-alginate-cefixime microspheres (Ca2+ ions) and phosphate buffer (Na+ ions), resulting in delayed degradation of the swelled microspheres (Nayak & Pal, 2014).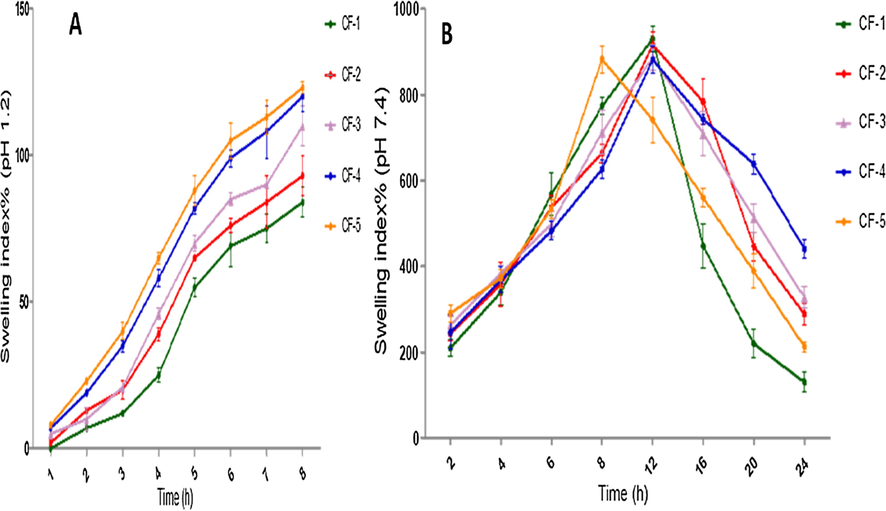
A. Swelling behaviour of different batches of microspheres containing cefixime in 0.1 N HCl, pH 1.2; B. Swelling behaviour of different batches of microspheres in phosphate buffer pH 7.4. Values are averaged (n = 1 × 3) and represented as mean ± S.D.
A higher portion of glucuronic acid was present in QSM, indicating the presence of carboxylic groups, making these microsphere formulations slightly acidic. That’s why less swelling was seen at acidic pH, because of protonation of carboxylic acid groups and strengthening of hydrogen bonding. This strong H-bonding is responsible for the shrinkage of hydrogels by close bringing of polymer chains. QSM swelling is linked to considerable water absorption at basic pH (6.8 and 7.4) (Beikzadeh, Khezerlou, Jafari, Pilevar, & Mortazavian, 2020b). Carboxylic groups ionize to anions (carboxylate) at basic pH, which causes repelling and relaxation of polymer chains to allow enhanced water penetration to increase swelling. In the basic environment, the cross-linked system of alginate-based microspheres deteriorated and disintegrated.
3.4.6 In vitro studies
In vitro drug release profiles for several formulations were performed, as shown in Fig. 7, and a graph was created against time vs. cumulative percent drug release. In the acidic media, cefixime release from these microspheres was <15 % after 2 hrs, which is in accordance with less swelling behavior that is also responsible for a decrease in drug release from prepared microspheres; whereas in phosphate buffer drug release was increased. When QSM-alginate microspheres were subjected to acidic conditions, the cross-linking Ca2+ ions may have been dislodged from the gel network, causing ionic connections to interfere with little electrostatic repulsion, causing the QSM-alginate matrix to shrink (Ghumman et al., 2019).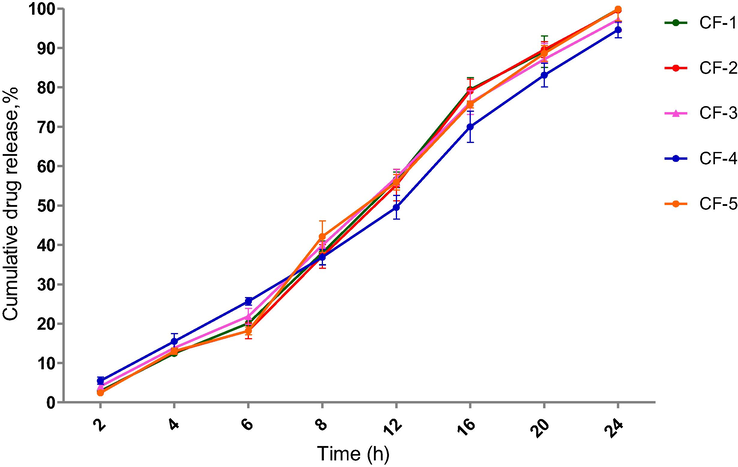
In vitro release profile of microspheres containing cefixime at 37 °C in pH 1.2 for 2 hr followed by pH 7.4 upto 24 hr. Means and standard deviations were of triplicate. Bars denote a significant difference between formulations (p < 0.05).
The enhanced drug release rate in alkaline pH compared to acidic pH could be explained by swelling and subsequent disintegration of QSM-alginate based microspheres. The gel structure may become loose and soluble when exposed to alkaline pH because Ca2+ ions participating in the cross-linked QSM-alginate network could only be shown by Na+ ions but may also be sequestered by phosphate included in phosphate buffer (pH, 7.4). The percentage of drug released from formulation CF-4 was shown to be sustained, as ALG-QSM matrix; using this ratio polymer content beads may have more hydrophilic polymers that bind better with water to form viscous gel structures, which could clog pores on the surface of beads and delay drug release (Ata et al., 2020).
3.4.6.1 Drug release kinetics
Various mathematical models based on curve fitting results were revealed the values of the correlation coefficient. Based on (R2 = 0.8635–0.9946) values; the prepared formulations followed the Korsmeyer-Peppas model when the respective R2 value of all microsphere formulations containing cefixime is compared in Table 3. The best fitting for following the Korsmeyer-Peppas model was confirmed via checking MSC values, i.e., (1.58–4.69). The diffusional exponent’s value was n > 1, as determined in the Korsmeyer-Peppas model. It was discovered that the release patterns associated with produced microspheres formulation follow the super case-II transport mechanism, which is linked to breakdown, relaxation, and polymeric chain enlargement (Soppimath et al., 2001).
Model Parameters
CF-1
CF-2
CF-3
CF-4
CF-5
Zero order
R2
RMSC0.9792
3.4980.9369
2.36210.9819
3.5940.9937
4.6210.9784
3.446
First order
R2
RMSC0.9053
1.9570.8994
1.9360.9268
2.1880.9423
2.4240.9071
1.977
Higuchi model
R2
RMSC0.8256
1.3440.8771
1.3030.8472
1.4620.8635
1.5880.8273
1.351
Korsmeyer-Peppas model
R2
RMSCN0.9794
3.2771.0070.9732
3.2441.0290.9827
3.422
0.9550.9946
4.694
0.9490.9781
3.218
1.001
Hixson- Crowell
R2
RMSC0.9426
2.4550.9365
2.3620.9587
2.7650.9762
3.1030.9458
2.454
3.5 Acute toxicity studies
3.5.1 Physical changes and observations
No sign of mortality or sickness were seen in both microspheres treated and non-treated group during the trial period. Insignificant changes were noticed regarding to weight in both groups as shown in Table 4. Vital organs were stayed unaffected in all mice and non-significant changes were seen in treated and reference group. Next, after oral intake of quince seeds mucilage - sodium alginate - cefixime loaded microspheres, parameters changes linked to food/water consumptions plus overall body weight changes were also noticed in microspheres treated group and compared with the reference group. Again, in-significant differences were noticed for each parameter and results were highlighted in Table 6. Values were little less regarding food/water intake in microspheres treated group than reference one, considered to be linked with stomach fullness by microsphere formulation). LD50 value ˃2000 mg/kg was applied to confirm excipient toxicity by checking the toxicity score and our quince seeds mucilage - sodium alginate - cefixime loaded microspheres, with zero toxicity score were found according to globally harmonized system.
Parameters to observe
Control group (n = 3)
Treated group (n = 3)
Mortality
No death
No death
Sickness
No sign of sickness
No sign of sickness
Food intake
Pre-treatment
1.8 ± 1.2
1.4 ± 1.0
D-1
1.9 ± 1.4
1.8 ± 1.2
D-3
2.2 ± 1.6
2.0 ± 1.6
D-5
2.8 ± 1.4
2.4 ± 1.4
D-7
3.0 ± 1.8
2.8 ± 1.8
D-10
3.4 ± 1.4
3.2 ± 1.4
Water intake
Pre-treatment
4.8 ± 1.6
4.4 ± 1.4
D-1
5.4 ± 1.4
5.2 ± 1.6
D-3
6.2 ± 1.8
5.8 ± 1.2
D-5
7.2 ± 1.2
6.4 ± 1.8
D-7
8.6 ± 2.0
7.9 ± 2.2
D-10
10.2 ± 1.2
9.6 ± 1.4
Body weight
Pre-treatment
20.5 ± 1.2
20.8 ± 1.4
D-1
21.4 ± 1.0
21.2 ± 1.2
D-3
22.6 ± 1.4
22.9 ± 1.0
D-5
23.5 ± 1.6
23.9 ± 1.4
D-7
24.8 ± 1.4
24.2 ± 1.6
D-10
27.5 ± 1.8
26.8 ± 1.6
3.5.2 Biochemical analysis
Biochemical analysis was carried out in quince seeds mucilage - sodium alginate - cefixime loaded microspheres treated and non-treated group to analyze difference between physiological conditions. Multiple chemical parameters were noticed in both microspheres treated and non-treated groups to confirm the normal functioning of liver, heart and kidney and obtained values were revealed in Table 5. All parameters were in the reference range with non-significant differences, clearly indicated no sign of toxicity was found in prepared microspheres.
Plasma analysis
Control group (n = 3)
Treated group (n = 3)
ALT (IU/L)
66 ± 1.9
68 ± 2.3
AST (IU/L)
126 ± 4.8
114 ± 5.3
Cholesterol (mg/dl)
117 ± 6.3
122 ± 5.2
Triglyceride (mg/dl)
118 ± 4.8
124 ± 4.4
Creatinine (mg/dl)
0.38 ± 1.1
0.40 ± 0.9
Urea (mg/dl)
64 ± 2.2
68 ± 2.4
Uric acid (mg/dl)
3.8 ± 1.8
4.2 ± 1.6
3.5.3 Histological analysis
Each organ was noted for absolute weight in quince seeds mucilage - sodium alginate - cefixime loaded microspheres treated and non-treated group and mean values were mentioned in Table 6. No pathological changes were seen in any vital organ indicated our quince seeds mucilage - sodium alginate - cefixime loaded microspheres formulations are safe (Fig. 8).
Group
Liver
Stomach
Heart
Kidney
Spleen
Control
4.96 ± 0.14
1.68 ± 0.24
0.48 ± 0.02
0.66 ± 0.06
0.52 ± 0.01
Treated
4.74 ± 0.20
1.66 ± 0.36
0.44 ± 0.04
0.69 ± 0.04
0.48 ± 0.02
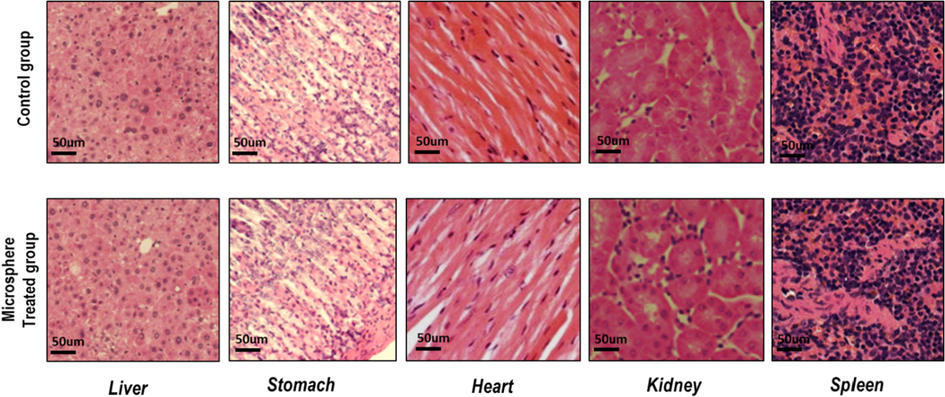
Histological analysis of in control and treated group (quince seeds mucilage - sodium alginate - cefixime loaded microspheres.
3.6 MTT assay based in vitro cytotoxicity study
MTT assays using MCF-7 cell lines were conducted for in vitro cytotoxicity testing of QSM; results were shown in Fig. 9. All results linked to the effect of QSM samples were in accordance with positive and negative controls. Different concentrations of QSM (1.5–200 µg/mL) showed a negligible cytotoxic effect on used cell lines indicating the safety of QSM as an oral vehicle (Ahmadian et al., 2009).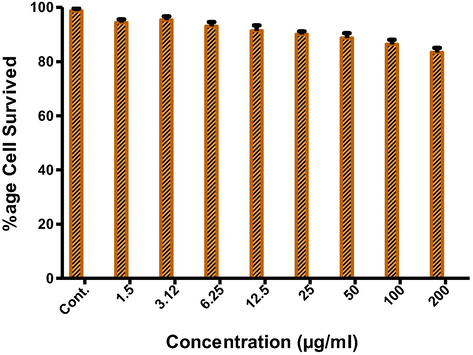
Graph between percentage viability and QSM concentration (µg) based on MIT assay (with MCF 7cancer cell line) Means and standard deviations were of triplicate. Bars denote a significant difference between formulations (p < 0.05).
3.7 Antimicrobial efficacy study
QSM-alginate based synthesized microspheres were investigated for anti-microbial efficacy against gram-positive and negative using disk diffusion method. Gram-negative (Salmonella typhi) and gram-positive (Bacillus subtitles) strains were used for this study. The anti-bacterial activity was found for prepared microspheres against both gram-positive and gram-negative bacteria (A. Bauer, 1966). The diameter of inhibition zones of each well is represented in the Table 7. Inhibition zones are shown in Fig. 10.
Sr.
Test samples
Zone of inhibition (mm)
Salmonella typhi
Bacillus subtitles
A
Pure drug i.e. cefixime (Positive control)
22
26
B
Microsphere of plant gel with alginate (drug unloaded)
8.00
10
C
Drug loaded microspheres of alginate only
19
22
D
Drug loaded QSM-alginate microspheres (CF-4)
25
29
E
Distilled water (Negative control)
00
00
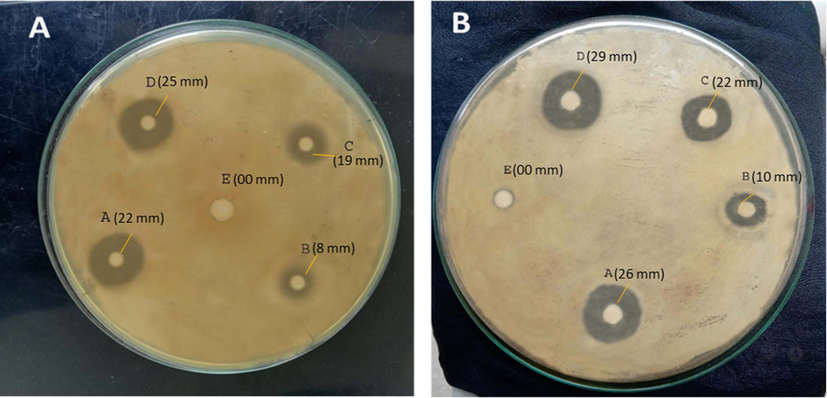
Antibacterial activities showing inhibition zone (a) Salmonella typhi, pure drug i.e. cefixime (A) (22 mm), (B) microsphere of plant gel with alginate (drug unloaded) (8 mm), (C) drug loaded microspheres of alginate only (19 mm), (D) drug loaded QSM-alginate microspheres (CF-4) (25 mm) (E) Distilled water (00 mm). (b) Bacillus subtitles, pure drug i.e. cefixime (A) (26 mm), (B)microsphere of plant gel with alginate (drug unloaded) (10 mm), (C) drug loaded microspheres of alginate only (22 mm), (D) drug loaded QSM-alginate microspheres (CF-4) (29 mm), (E) Distilled water (00 mm).
4 Conclusion
In the present study, we prepared sustained-release microspheres based on naturally occurring glucuronoxylan polysaccharides of QSM. Reduction in swelling behavior and drug release was linked to the ratio of QSM and sodium alginate used. Overall, the addition of polymer to alginate formulation reduced the fast disintegration of delivery systems, specifically at basic pH. QSM-alginate interaction also affects the drug's swelling behavior and release pattern in an acidic and basic medium. QSM-alginate microspheres were found compatible with the drug (cefixime). Natural polymers have a substantial impact on mechanical characteristics, porosity, and drug release control due to increased swelling qualities in drug-loaded microspheres at higher pH. As a result, QSM and sodium alginate are natural biopolymers that are used in pharmaceutical dosage forms to provide sustained release drug delivery systems while avoiding dose-related side effects throughout the physiological region. Acute toxicity and in vitro cytotoxicity studies proved the safety of QSM. Sustained and extended-release patterns were found in all the QSM-alginate-cefixime based microspheres formulations that follow the Korsmeyer-Peppas model and non-Fickian type.
Declaration of Competing Interest
The authors declare that they have no known competing financial interests or personal relationships that could have appeared to influence the work reported in this paper.
References
- Overview of the clinical features of cefixime. Chemotherapy. 1998;44(Suppl. 1):1-5.
- [Google Scholar]
- Ultrasensitive fluorescent miRNA biosensor based on a “sandwich” oligonucleotide hybridization and fluorescence resonance energy transfer process using an Ln (III)-MOF and Ag nanoparticles for early cancer diagnosis: application of central composite design. ACS Appl. Mater. Interfaces. 2020;12(14):16076-16087.
- [Google Scholar]
- Cellular toxicity of nanogenomedicine in MCF-7 cell line: MTT assay. JoVE (J. Visual. Exp. (26):e1191.
- [Google Scholar]
- Selective and catalyst-free oxidation of D-glucose to D-glucuronic acid induced by high-frequency ultrasound. Sci. Rep.. 2017;7(1):1-8.
- [Google Scholar]
- Intercalation compounds of hydrotalcite-like anionic clays with anti-inflammatory agents, II: uptake of diclofenac for a controlled release formulation. Aaps Pharmscitech. 2002;3(3):77-82.
- [Google Scholar]
- Loading of Cefixime to pH sensitive chitosan based hydrogel and investigation of controlled release kinetics. Int. J. Biol. Macromol.. 2020;155:1236-1244.
- [Google Scholar]
- Antibiotic susceptibility testing by a standardized single disc method. Am. J. Clin. Pathol.. 1966;45:149-158.
- [Google Scholar]
- The use of partially transparent plates to increase the contrast of images. Appl. Opt.. 1966;5(9):1361-1364.
- [Google Scholar]
- Seed mucilages as the functional ingredients for biodegradable films and edible coatings in the food industry. In: Advances in Colloid and Interface Science. 2020. p. :102164.
- [Google Scholar]
- Seed mucilages as the functional ingredients for biodegradable films and edible coatings in the food industry. Adv. Colloid Interface Sci.. 2020;280:102164.
- [Google Scholar]
- Silver loaded hydroxyethylacryl chitosan/sodium alginate hydrogel films for controlled drug release wound dressings. Int. J. Biol. Macromol.. 2020;159:194-203.
- [Google Scholar]
- Enhancement of dissolution and oral bioavailability of lacidipine via pluronic P123/F127 mixed polymeric micelles: formulation, optimization using central composite design and in vivo bioavailability study. Drug Delivery. 2018;25(1):132-142.
- [Google Scholar]
- Antimicrobial activity of Tunisian quince (Cydonia oblonga Miller) pulp and peel polyphenolic extracts. J. Agric. Food. Chem.. 2007;55(3):963-969.
- [Google Scholar]
- Nimesulide PLA microspheres as a potential sustained release system for the treatment of inflammatory diseases. Int. J. Pharm.. 2005;295(1–2):201-211.
- [Google Scholar]
- Sustained release of bioactive glycosylated glial cell-line derived neurotrophic factor from biodegradable polymeric microspheres. Eur. J. Pharmac. Biopharmac.. 2008;69(3):844-851.
- [Google Scholar]
- Colocasia esculenta corms mucilage-alginate microspheres of oxcarbazepine: design, optimization and evaluation. Acta poloniae pharmaceutica. 2017;74(2):505-517.
- [Google Scholar]
- Taro-corms mucilage-alginate microspheres for the sustained release of pregabalin: in vitro & in vivo evaluation. Int. J. Biol. Macromol.. 2019;139:1191-1202.
- [Google Scholar]
- Linum usitatissimum seed mucilage-alginate mucoadhesive microspheres of metformin HCl: fabrication, characterization and evaluation. Int. J. Biol. Macromol.. 2020;155:358-368.
- [Google Scholar]
- Glucuronoxylan-based quince seed hydrogel: a promising scaffold for tissue engineering applications. Int. J. Biol. Macromol.. 2021;180:729-738.
- [Google Scholar]
- Overview of cefixime use in community-acquired infections. Clin. Microbiol. Infect.. 2000;6:79-81.
- [Google Scholar]
- An investigation into the effects of mucilage of quince seeds on wound healing in rabbit. J. Herbs Spices Med. Plants. 2000;7(4):41-46.
- [Google Scholar]
- HPLC Analysis of polysaccharides in Quince (Cydonia Oblonga Mill. var. maliformis) fruit and PTP1B inhibitory activity. Natl. Prod. J.. 2011;1(2):146-150.
- [Google Scholar]
- Optimization and formulation of fucoxanthin-loaded microsphere (F-LM) using response surface methodology (RSM) and analysis of its fucoxanthin release profile. Molecules. 2019;24(5):947.
- [Google Scholar]
- Optimization of extraction, antioxidant activity and functional properties of quince seed mucilage by RSM. Int. J. Biol. Macromol.. 2014;66:113-124.
- [Google Scholar]
- Development and characterization of sodium alginate/poly (vinyl alcohol) blend scaffold with ciprofloxacin loaded in controlled drug delivery system. J. Nanosci. Nanotechnol.. 2019;19(5):2493-2500.
- [Google Scholar]
- Advances in polymeric micelles for drug delivery and tumor targeting. Nanomed.: Nanotechnol. Biol. Med.. 2010;6(6):714-729.
- [Google Scholar]
- Polymeric sodium alginate interpenetrating network beads for the controlled release of chlorpyrifos. J. Appl. Polym. Sci.. 2002;85(5):911-918.
- [Google Scholar]
- In-vitro release kinetics of cefadroxil-loaded sodium alginate interpenetrating network beads. Eur. J. Pharmac. Biopharmac.. 2001;51(2):127-133.
- [Google Scholar]
- Preparation of cross-linked sodium alginate microparticles using glutaraldehyde in methanol. Drug Dev. Ind. Pharm.. 2000;26(10):1121-1124.
- [Google Scholar]
- Effect of polysaccharide nanocrystals on structure, properties, and drug release kinetics of alginate-based microspheres. Colloids Surf. BBiointerf.. 2011;85(2):270-279.
- [Google Scholar]
- An unusual (4-O-methyl-D-glucurono)-D-xylan isolated from the mucilage of seeds of the quince tree (Cydonia oblonga) Carbohydr. Res.. 1990;207(2):307-310.
- [Google Scholar]
- Preparation and in vitro/in vivo evaluation of a clonidine hydrochloride drug–resin suspension as a sustained-release formulation. Drug Dev. Ind. Pharm.. 2021;47(3):394-402.
- [Google Scholar]
- KinetDS: an open source software for dissolution test data analysis. Dissolut. Technol.. 2012;19(1):6-11.
- [Google Scholar]
- Study of comparative aspects of gastroretentive delivery of cefixime trihydrate from microspheres and microsphere based tablets. J. Pharmac. Invest.. 2015;45(6):541-554.
- [Google Scholar]
- Evaluation of cefixime-loaded chitosan microspheres: analysis of dissolution data using DDSolver. Dissolut. Technol.. 2012;19(2):13-19.
- [Google Scholar]
- Calcium alginate/gum Arabic beads containing glibenclamide: development and in vitro characterization. Int. J. Biol. Macromol.. 2012;51(5):1070-1078.
- [Google Scholar]
- Trigonella foenum-graecum L. seed mucilage-gellan mucoadhesive beads for controlled release of metformin HCl. Carbohydr. Polym.. 2014;107:31-40.
- [Google Scholar]
- Fenugreek seed mucilage-alginate mucoadhesive beads of metformin HCl: Design, optimization and evaluation. Int. J. Biol. Macromol.. 2013;54:144-154.
- [Google Scholar]
- Smart gel system of Linum usitatissimum mucilage as a vehicle of an ophthalmic drug. Bioinspired Biomimetic Nanobiomater.. 2017;7(2):90-99.
- [Google Scholar]
- Terminalia arjuna gum/alginate in situ gel system with prolonged retention time for ophthalmic drug delivery. Int. J. Biol. Macromol.. 2020;152:1056-1067.
- [Google Scholar]
- Phenolic profile of Cydonia oblonga Miller leaves. J. Agric. Food. Chem.. 2007;55(19):7926-7930.
- [Google Scholar]
- Guar Gum-based floating microspheres of repaglinide using 32 factorial design: fabrication, optimization, characterization, and in vivo buoyancy behavior in albino rats. Assay Drug Dev. Technol.. 2021;19(2):63-74.
- [Google Scholar]
- Strategies in the design of nanoparticles for therapeutic applications. Nat. Rev. Drug Discov.. 2010;9(8):615-627.
- [Google Scholar]
- Application of three-dimensional electrofenton process using MWCNTs-Fe3O4 nanocomposite for removal of diclofenac. Process Saf. Environ. Prot.. 2018;119:271-284.
- [Google Scholar]
- Characterizations and rheological study of the purified polysaccharide extracted from quince seeds. J. Sci. Food Agric.. 2019;99(1):143-151.
- [Google Scholar]
- Physico-mechanical and antimicrobial properties of quince seed mucilage supplemented with titanium dioxide and silicon oxide nanoparticles. Nanomed. Res. J.. 2019;4(3):157-163.
- [Google Scholar]
- Sodium alginate/poly (vinyl alcohol)/nano ZnO composite nanofibers for antibacterial wound dressings. Int. J. Biol. Macromol.. 2011;49(3):247-254.
- [Google Scholar]
- Design and evaluation of chitosan-based novel pHSensitive drug carrier for sustained release of cefixime. Trop. J. Pharm. Res.. 2013;12(2):155-161.
- [Google Scholar]
- Formulation and evaluation of floating alginate: chitosan microspheres of cefixime. Pharm. Innov. J.. 2018;7(4):919-928.
- [Google Scholar]
- Development of hollow microspheres as floating controlled-release systems for cardiovascular drugs: preparation and release characteristics. Drug Dev. Ind. Pharm.. 2001;27(6):507-515.
- [Google Scholar]
- Fabrication of alginate microspheres for drug delivery: a review. Int. J. Biol. Macromol.. 2020;153:1035-1046.
- [Google Scholar]
- Composition, formulation and in-vitro evaluation studies of cefixime microspheres. In: Paper Presented at the 2016 International Conference on Electrical, Electronics, and Optimization Techniques (ICEEOT). 2016.
- [Google Scholar]
- Isolation, 1H and 13C NMR studies of (4-O-methyl-D-glucurono)-D-xylans from luffa fruit fibres, jute bast fibres and mucilage of quince tree seeds. Carbohydr. Res.. 1998;307(1–2):107-111.
- [Google Scholar]
- Principles of encapsulating hydrophobic drugs in PLA/PLGA microparticles. Int. J. Pharm.. 2008;364(2):298-327.
- [Google Scholar]


