

Translate this page into:
Enhancement of wound healing via topical application of natural products: In vitro and in vivo evaluations
⁎Corresponding author at: Center for Microbiology and Phage Therapy, Zewail City of Science and Technology, October Gardens, 6th of October City, Giza 12578, Egypt. aelshibiny@zewailcity.edu.eg (Ayman El-Shibiny)
-
Received: ,
Accepted: ,
This article was originally published by Elsevier and was migrated to Scientific Scholar after the change of Publisher.
Peer review under responsibility of King Saud University.
Abstract
Intact skin is the first physical barrier against all microbial infections. Thus, in the cases of wounds, burns, and skin damage, bacteria can infect and invade the deeper layers of skin to the bloodstream and other organs leading to severe illnesses. Thus, our study aims to investigate the potential activity of natural products, propolis and honeybee venom, to control wound infections with multi-drug resistant Staphylococcus aureus (MDRSA) and safely accelerate the wound healing. First, this study characterized the clinically isolated S. aureus using biochemical, molecular, and antibiotic sensitivity tests. Then, the hydrogel was prepared via mixing chitosan with honey, propolis, and venom at different ratios, followed by physicochemical characterization and biological examination. The in vivo experiment results after topical application of optimum concentrations revealed that both venom and propolis have significant antibacterial activity at different temperatures. The IC50 of both propolis antioxidant and cytotoxicity assays was found to be 40.07 ± 2.18 μg/mL and 18.3 μg/mL, respectively. The cocktail bacteria showed both minimum inhibitory concentration (MIC) and minimum bactericidal concentration (MBC) of 10 µg/mL and of 300 µg/mL with venom respectively & MIC and MBC of 100 µg/mL, 300 µg/mL with propolis respectively. The use of hydrogel was effective against wound infection and enhanced wound healing during 14 days. Before starting clinical trials, further studies can be done on large animal models.
Keywords
Bee venom
Antibacterial
Antimicrobial
Antibiotic-resistant bacteria
Wound infection
Propolis
Cytotoxicity
Synergetic effect
Honey
Chitosan

1 Introduction
Due to the misuse of antibiotics over the past six decades, almost all pathogenic bacteria express antibiotic resistance characteristics. Moreover, the annual death rate due to the infection with anti-microbial resistant bacteria exceeds the cancer death rate by 2050 (Zolfagharian et al., 2016). Thus, the world is looking for alternatives to antibiotics to control the increasing bacterial infections. Among the suggested alternatives are the active compounds of natural products, bacteriophage (bacterial viruses) therapy, a synthetic compound, and metal nanoparticles. Although all the suggestions are promising, natural products are more recommended due to the low toxicity level, high accessibility, and social acceptance by consumers. Natural products may include plant extracts, essential oils, herbs, and honey. Here, we focus on honey and other bee-related compounds (propolis and bee venom).
Bee venom is a transparent, odorless compound composed of various bioactive proteins. It has around 18 active elements with many pharmaceutical properties ranging from enzymes and peptides to biogenic amines (e.g., apamin, melittin, adolapin, degranulating peptides, and hyaluronidase enzymes), making it effective against various diseases (Al-Waili et al., 2015; Wehbe et al., 2019). In addition, the bee venom has a therapeutic efficiency in treating inflammatory diseases including arthritis, fibrosis, tendonitis, lupus, rheumatoid and multiple sclerosis when administered at a therapeutic dose. However, bee predators have reported toxicity when administrated at high doses (El-Seedi et al., 2020).
On the other hand, Propolis is a resinous compound with a dark color and is collected from nectars by honeybees from the flora and trees buds of the area surrounding the hives and used to maintain the hive structure (Hannan et al., 2015). Hence, its chemical composition varies from one place to another. Propolis is mainly composed of wax (30%), resin (50%), pollen (5%), essential oils (10%), and other substances (5%), including minerals, debris, and organic compounds (El-Guendouz et al., 2018). A broad spectrum of biological activities such as antioxidant, antifungal, anticancer, antibacterial, and anti-inflammatory responses has been linked to propolis active compounds (Hannan et al., 2015; Fernandes Júnior et al., 2005). In particular, the antimicrobial properties of propolis are due to the synergistic effect of phenolics and other compounds such as flavonoids, galangin, pinocembrin, and pinobanksin (Fernandes Júnior et al., 2005). Chitosan was used in several studies as an accelerator for wound healing in animal models (Ueno et al., 1999; Tang et al., 2016; Ueno et al., 2001), in addition to its antimicrobial activity that makes the possible risks at the lowest level in wound infections (Mi et al., 2002; Ong et al., 2008). Recently, the gelatin was used in the preparation of wound dressing due to its ability to absorb the water and stimulate the macrophages (Pawde and Deshmukh, 2008; Saarai et al., 2012).
Among the isolated bacteria from infected wounds, especially diabetic foot ulcers, Staphylococcus aureus (S. aureus) is considered one of the most pathogenic bacteria to treat due to the multiple virulence factors and its ability to resist various antibiotics (Serra et al., 2015; Halcón and Milkus, 2004). S. aureus is a cluster coccus bacterium, frequently associated with the human body parts, either the throat, nose, vagina, or skin, due to its capability of causing various infections and its competence to adapt to diverse environmental conditions (El-Guendouz et al., 2018). Accordingly, these characteristics gave S. aureus the privilege of antibiotic resistance development, making it one of the most difficult to treat pathogens. The Multi-Drug Resistant (MDR) S. aureus exploits a variety of virulence factors, including coagulase, collagenase, protein A, hemolysins, lipase, hyaluronidase, adhesive proteins, multiple toxins, and also proteins involved in biofilm formation (Szweda and Kot, 2017).
Biofilm has a vital role in bacterial infection as it acts as a physical barrier preventing antibiotics from penetrating the polysaccharide matrix and halting the antibiotics clearance mechanisms (Halcón and Milkus, 2004). Moreover, it is the most critical virulence factor playing an essential role in passing the virulent genes between different bacteria species, enhancing antibiotic resistance (Høiby et al., 2010; Stewart, 2002; Fadl, 2018). The rise in antimicrobial resistance opens the door for searching for new alternatives with varying modes of action. Moreover, various studies have been established to testify the ability of bee venom and propolis to control S. aureus and its biofilm formation (Szweda and Kot, 2017; Fadl, 2018; Han et al., 2016; Galdiero et al., 2019; Grecka et al., 2020). Many previous studies tried to evaluate the anti-biofilm activity of bee venom, melittin, and macropin peptides against S. aureus (Picoli et al., 2017; Alni et al., 2020; Ko et al., 2017). However, to date, this is the first trial to evaluate the ability of bee venom and propolis to control the biofilm formed by a cocktail of MDRSA bacteria isolated from patients.
The process of combining the potential compounds with natural products was used successfully to obtain the synergism against multidrug-resistant bacteria (Cheesman et al., 2017). In some cases, the combination between compounds generates synergism and tackles the efflux pump mechanism in S. aureus (Pereira et al., 2019). Therefore, the propolis extract became one of the antibacterial agents that was combined with antibiotics (Neto et al., 2017) or the plant extracts (da Silveira Regueira-Neto et al., 2019) against S. aureus. Furthermore, in several studies, propolis (Oryan et al., 2018), bee venom (Al-Waili et al., 2015), chitosan, glycerol (Zoghi et al., 2021), and honey (Molan, 1999) were used separately or in combinations to treat the wound infection and accelerate the healing process.
This study aims to provide an alternative to antibiotics to treat a cocktail of MDRSA isolated from clinical samples using hydrogels through both in vitro and in vivo treatment models. In addition, various concentrations of venom and propolis were tested to inhibit and disrupt MDRSA biofilm formation. Moreover, providing a chemical profile and analytical data that can be used in future studies.
2 Results and discussion
2.1 Bacterial characterization and antibiotic sensitivity
Using colony PCR, the isolated bacteria depicted amplicons of 279 bp for the nuc gene: catalase-positive and oxidase-negative. Moreover, the antibiotic sensitivity disk diffusion test showed that all isolates (n = 11) are resistant to Amoxicillin, whereas they are all sensitive to Vancomycin and Linezolid. Only two isolates were susceptible to Oxacillin. The rest of the antibiotic panel results are presented in (Table 1). R = Resistant I = Intermediate S = Susceptible.
Class
Antibiotics (μg)
Clinical Isolates
ZCSA/02
ZCSA/03
ZCSA/04
ZCSA/05
ZCSA/08
ZCS A/06
ZCS A/14
ZCS A/15
ZCS A/16
ZCS A/17
ZCSA/24
β-lactam
Amoxicillin(10)
R-10
R-10*
R-6
R-6
R-6
R-6
R-6
R-6
R-6
R-8
R-8
Penicillins
Oxacillin(1)
S-14
S-13++
R-0
R-8++
R-9*
R-9
I-12++
R-9
R-9
I-12
R-9
Aminoglycoside
Gentamicin (30)
R-12+
R-8*
R-9*
R-11
S-24
S-26
R-8
R-8*
S-21
S-26
S-24
Glycopeptide
Vancomycin(30)
R-14
R-13
S-19
R-13
R-12
R-13
R-14
R-14
R-13
R-14
R-14
Macrolide
Erythromycin(15)
S-24
I-22
S-25
S-24
R-12*
S-25
R-11
S-24
I-19
S-23
S-23
Quinolone
Ciprofloxacin(5)
S-26
I-19
S-24
S-22
S-22
S-24
I-20
S-24
S-23
S-25
S-22
Levofloxacin(5)
S-25
S-21
I-16
S-24
S-24
S-26
S-23
S-28
S-21
S-26
S-24
Tetracyclines
Tetracycline(10)
R-8*
R-9
R-8
R-7
R-8
R-6
R-8
R-8
S-18*
R-9
S-21++
Doxycycline(30)
S-20*
I-14
R-9
R-11
R-12
R-11
R-8
R-11
S-23*++
S-19++
S-25
Phenicols
Chloramphenicol (30)
R-9
S-20
S-24+
S-20
R-10*
R-10*
S-21
R-9
S-21
S-21
S-22
Oxazolidinones
Linezolid(30)
S-30
S-25
S-28
S-25
S-32
S-36
S-26
S-28
S-31
S-30
S-26
Lincomycin
Clindamycin(2)
S-21+
S-21+
S-23
I-20
R-6*
I-20
R-5
S-24
20+
I-19
I-20
Minobenzenesulfonamides
Sulfamethoxazole trimethoprim(25)
S-16
R-10
S-19
S-21
I-14
S-17
S-22
S-19
S-19
S-25
S-23
The clinical isolates were confirmed to be S. aureus using colony PCR, in which the nuc gene was detected. Furthermore, the antibiotic sensitivity profile showed that many isolates, including ZCSA/04, 05, 08, 09, 15, 16, and 24 are resistant to Penicillin (64%) and β-lactam (100%) drug classes. Moreover, many of the isolates showed resistance to Tetracycline (73%), Gentamicin (55%), Doxycycline (55%), Chloramphenicol (36%), Clindamycin (18%), and Sulfamethoxazole trimethoprim antibiotic (9%). The most effective antibiotics were Linezolid, Ciprofloxacin, and Levofloxacin, all of which did not display (0%) resistance. Yet, the last two antibiotics, Ciprofloxacin and Levofloxacin, presented intermediate effects on some strains. On the plates, Linezolid produced the widest inhibition zone. Some bacterial isolates expressed efflux pump in the plate as they showed an inhibition zone followed by an outer concentric bacterial growth followed by a second outer concentric inhibition zone. Among the antibiotics that showed an inconsistent efflux bump were Oxacillin, Gentamicin, Erythromycin, Tetracycline, Doxycycline, Chloramphenicol, and Clindamycin.
2.2 Disc diffusion test for venom and propolis
The extracted bee venom and propolis showed a significant antibacterial activity starting from 41.2 µg/mL (0.4 µg/disc) on strains ZCSA/02, 06, and 15. However, the most effective concentration for inhibiting the bacteria was ≥ 123 µg/mL (1.23 µg/disc). In addition, the diameters of inhibition zones were between 13 and 10 mm for the 10 mg/mL (100 µg/disc) and from 8 to 10 mm in the concentration of 123 µg/mL. At the same time, propolis showed diameters of inhibition zones between 30 and 20 mm for the (100 µg/disc), displaying the most significant results as in Table 2.
100 µg/disc
33.3 µg/disc
11 µg/disc
3.7 µg/disc
1.23 µg/disc
0.4 µg/disc
ZCSA/02
venom
13
10
10
10
9
0
propolis
24
15
14
12
8
0
ZCSA/03
venom
11
10
10
10
8
0
propolis
25
16
15
12
8
0
ZCSA/04
venom
12
11
11
9
10
0
propolis
20
11
10
8
0
0
ZCSA/05
venom
11
11
11
10
10
9
propolis
28
15
15
12
7
0
ZCSA/06
venom
11
11
11
11
10
7
propolis
23
15
16
12
7
0
ZCSA/08
venom
11
10
10
10
8
0
propolis
22
13
14
11
7
0
ZCSA/14
venom
11
11
10
9
9
0
propolis
24
14
13
11
8
0
ZCSA/15
venom
11
10
10
10
10
8
Propolis
30
14
15
13
9
0
ZCSA/16
Venom
11
11
11
11
10
0
Propolis
22
13
13
10
8
0
ZCSA/17
venom
11
9
11
10
8
0
propolis
25
14
14
11
8
0
ZCSA/24
venom
10
10
10
10
8
0
propolis
26
16
16
12
8
0
Bee venom has similar inhibition zones to the snake Echis carinatus venom when tested on MDRSA isolates with 100 µg/mL (8.2 ± 0.5 mm). However, it produced larger inhibition zones (11.09 ± 2.3 mm) with S. aureus, showing sensitivity toward the methicillin antibiotics (Jami et al., 2010). In addition, using bee venom on MDRSA had fewer effects than other bee venoms tested on S. aureus (ATCC 25923) and presented an inhibition zone of 15.51 ± 1.0 mm at a concentration of 45 μg/disc (Zolfagharian et al., 2016). Furthermore, bee venom in this study showed similar inhibition zones to venom alkaloid solenopsin A (diameter = 11 mm) and slightly higher than that of solenopsin B and C (diameter = 9 mm and 8 mm, respectively) (Jouvenaz et al., 1972), and significantly greater than that of Heterometrus laoticus scorpion venom (inhibition zone = 2.4 mm around the disc) when tested on S. aureus (Uawonggul et al., 2007).
2.3 MIC and MBC of venom and propolis
The bacterial isolates presented an inhibition in the growth when treated with bee venom with 10 µg/mL and showed a complete bactericidal effect at the concentration of 30 µg/mL. For instance, the two isolates ZCSA/06 and ZCSA/16 showed a higher sensitivity towards bee venom since the growth of S. aureus was inhibited at a concentration of 3 µg/mL, whereas their MBC was 10 µg/mL. In the case of bacterial cocktails, venom MIC was 10 µg/mL, and the MBC was 300 µg/mL, which means that the MIC is one thirty-folds of MBC when used against different strains of bacteria in one cocktail. However, the propolis had a MIC of 100 µg/mL and MBC of 300 µg/mL in case of the cocktail. Whereas, with some strains (ZCSA/05, 06, 15, and 17), both propolis MIC and MBC were the same (100 µg/mL) (Table 3). *The MIC value means it has a bacteriostatic effect on equal or higher concentrations than MIC. **The MBC value means it has a bactericidal effect on equal or higher concentrations than MBC.
MIC*
MBC**
Concentration
3 µg/mL
10 µg/mL
100 µg/mL
10 µg/mL
30 µg/mL
100 µg/mL
300 µg/mL
Venom
ZCSA/06
ZCSA/16ZCSA/02
ZCSA/03
ZCSA/04
ZCSA/05
ZCSA/08
ZCSA/14
ZCSA/15
ZCSA/17
ZCSA/24Cocktail
(11 strains)
ZCSA/06
ZCSA/16ZCSA/02
ZCSA/03
ZCSA/04
ZCSA/05
ZCSA/08
ZCSA/14
ZCSA/15
ZCSA/17
ZCSA/24
Cocktail (11 strains)
Propolis
ZCSA/02
ZCSA/03
ZCSA/04
ZCSA/05
ZCSA/06
ZCSA/08
ZCSA/14
ZCSA/15
ZCSA/16
ZCSA/17
ZCSA/24Cocktail
(11 strains)
ZCSA/05
ZCSA/06
ZCSA/15
ZCSA/17ZCSA/02
ZCSA/03
ZCSA/04
ZCSA/08
ZCSA/14
ZCSA/16
ZCSA/24Cocktail
(11 strains)
The MIC for bee venom against MDRSA was between 0.085 and 12.25 µg/mL, while the MBC was ≥ 12.25 µg/mL (Han et al., 2016; Shebeeb et al., 2020). The bee venom showed lower MIC and MBC than Snake venom (Boda et al., 2019) and lowered MBC than the spider Lasiodora sp. (Chen et al., 2018). Our results revealed a higher concentration of bee venom to kill the bacterial cocktail compared to the MBC of each isolate alone with the same MIC concentration for the bee venom in both cases. This finding suggested that the bacterial cocktail of the same species has a higher persistence ability. Thus, bee venom, in the case of the cocktail of cells, acts as a bacteriostatic agent instead of a bactericidal one because its MBC is more than four-folds of MIC (Salada et al., 2015). The results of the MIC and MBC of propolis were better as it was 100 µg/mL and 300 µg/mL for MIC and MBC respectively, compared to the previously reported results (El-Guendouz et al., 2018 (2018).) that were 360 µg/mL for MIC and 1220 µg/mL for MBC.
2.4 In vitro antioxidant activity of propolis
The preliminary screening of the propolis IC50 turned out to be lower than 100 μg/mL. Consequently, the following concentrations of propolis 10, 20, 40, 50, 60, and 80 μg/mL were used to build a curve to estimate the IC50 of the propolis. The IC50 of the sample was found to be 40.07 ± 2.18 μg/mL compared to the Trolox standard (24.42 ± 0.87 μg/mL).
DPPH is a stable radical with maximum absorption at 517 nm and can be easily scavenged by antioxidants (Boly et al., 2016). The IC50 was obtained by calculating the concentration of the propolis having the ability to reduce the initial concentration of DPPH by 50%. Consequently, higher antioxidant activity is implied by a lower IC50 (Sowndhararajan and Kang, 2013). Several studies determined a correlation between the antioxidant activity of ethanolic extracts of propolis and their phenolic contents, such as flavonoids (Cunha et al., 2004; Kortenska et al., 2002; Kumazawa et al., 2004). As presented in (Fig. 1), the scavenging capabilities of propolis were expressed as IC50 of 40.07 μg/mL, which would be sufficient for its antioxidant activity, which in turn scavenged half of the free radicals. The presence of flavonoids in the chemical composition of the propolis supports its antioxidant activity (Brito Pereira Bezerra Martins et al., 2018).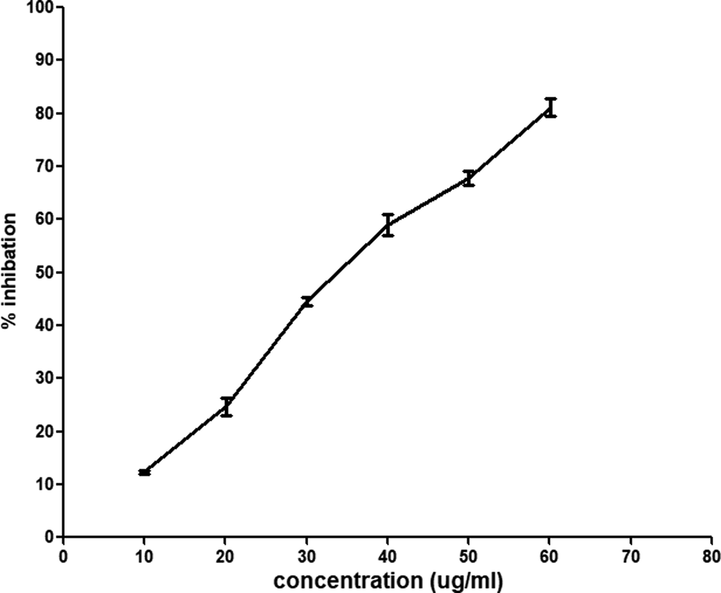
Shows the relationship among the different concentrations of propolis and radical scavenging using DPPH assay. The results of antioxidants were carried out in triplicate (n = 3).
2.5 Cytotoxicity assay
The sulforhodamine B (SRB) assay was conducted to examine the cytotoxic effect of bee venom using a noncancerous human skin fibroblast (HSF) cell line with different concentrations of bee venom (0.01, 0.1, 1, 10, 100 μg/mL). The results showed that the IC50 of bee venom is 18.3 μg/mL by measuring the cell viability after adding the bee venom with the culture media.
The cytotoxicity assay results indicated that any concentration below 18.3 μg/mL is safe for treatment. However, concentration above or equal to this value will be lethal to the cell (Fig. 2), which clearly explains the significant reduction in cells at a concentration of 100 μg/mL. Previous results (Sobral et al., 2016) that tested the cytotoxicity effect of bee venom on non-cancerous liver cells gave a growth inhibitory 50 of 15.03 ± 0.28, 13.86 ± 0.10, 10.11 ± 0.91, 12.94 ± 1.21, 14.66 ± 0.66 for various bee venom samples. Another study by Ku et al. (Ku et al., 2020) demonstrated that bee venom has no cytotoxic effect on the cellular model of Alzheimer’s Disease using a concentration below 10 μg/mL. These results indicate that the cytotoxic effect of our bee venom on non-cancerous cells fluctuates in the same range (see Fig. 3).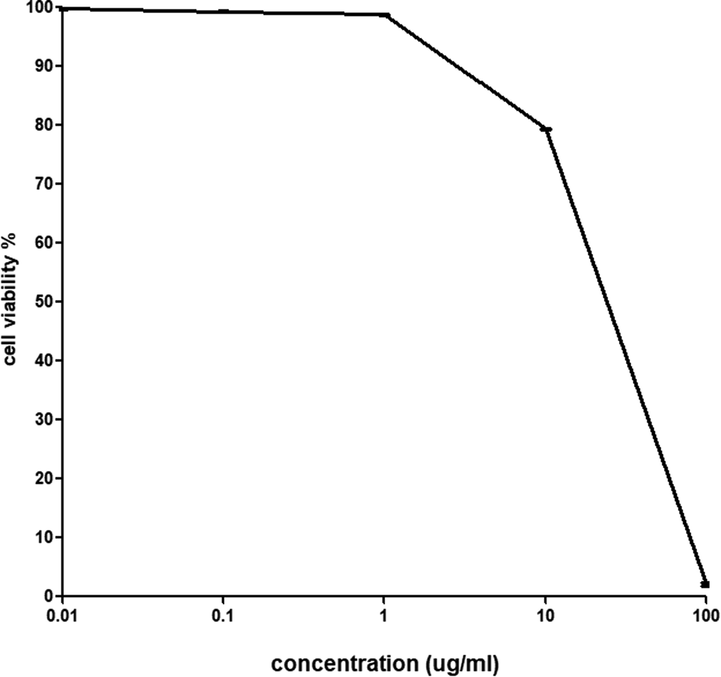
Shows the percentage of cell viability after adding different concentrations of bee venom (IC50 is 18.3 μg/mL). The cell viability results were carried out in triplicate (n = 3).
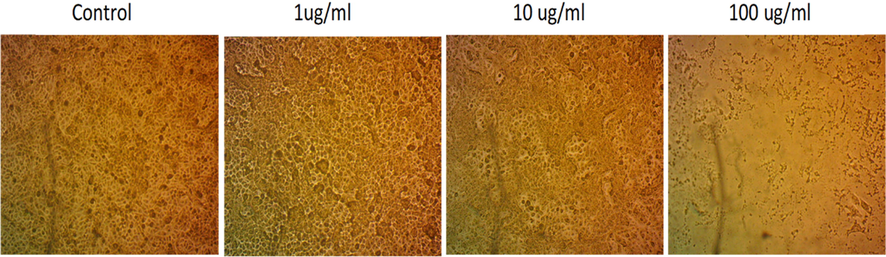
Microscopic images of Human Skin Fibroblast (HSF). Cells were treated with bee venom at different concentrations without adding a stain.
2.6 Gas chromatography/mass spectrometry (GC–MS)
Propolis samples were analyzed by gas chromatography and identified by the mass spectrum through an energy-rich ray of electrons ionized form of the separated molecules to study active propolis compounds. The results highlighted 45 compounds separated from propolis samples over a run time of 45 min. Clear peaks were obtained, as seen in the chromatogram (Fig. 4). The separated components could be categorized as follows: Acids, Esters, Alcohols, phenols, aldehydes, ketones, amides, amines, flavonoids, hydrocarbons, and sugars. Table 4 gives the details of the separated components and their area percentage under the chromatogram.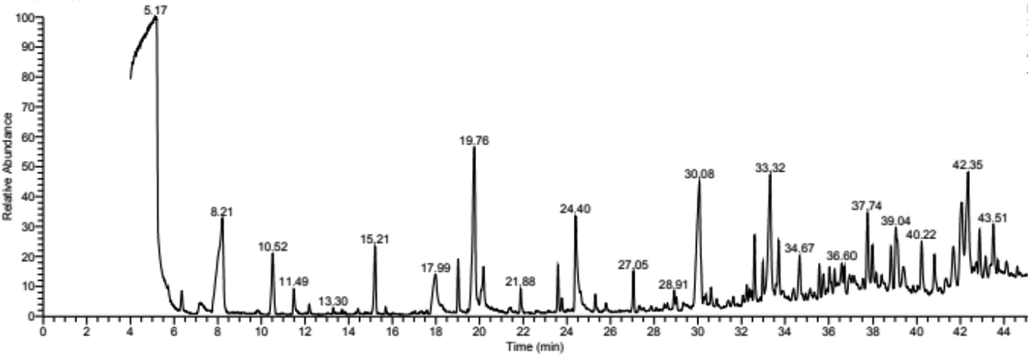
Represents the GC–MS for ethanolic extract of propolis.
No.
Component
Formula
Area %
Acids
1
n-Hexadecanoic acid (Palmitic acid)
C16H32O2
7.79
2
(Dimethyl-7-oxo-7-hexahydro-2-naphthalenyl) propionic acid
C15H20O3
1.56
3
Acetoxypregnan-ol-one-oic acid lactone
C23H32O5
1.58
4
Dihydroxy-oxo-prostatrienoic acid (Prostaglandin)
C20H30O5
1.61
5
9-octadecenoic acid
C18H34O2
4.38
6
Octadecanoic acid (stearic acid)
C18H36O2
1.92
7
(Carboxy-methyl-butenyl) decahydro-dimethyl-methylene-1-Naphthalenecarboxylic acid
C20H30O4
1.82
Total percentage area of acids
20.66
Esters
8
1,2-Benzene dicarboxylic acid, diethyl ester
C12H14O4
0.74
9
Hexadecanoic acid, 2,3-dihydroxy-propyl ester (glyceryl monopalmitate)
C19H38O4
0.96
10
Eicosatriynoic acid, methyl ester
C21H30O2
0.57
11
Dehydroergosterol tosylate
C35H48O3S
0.95
12
3TMS derivative of methyl glycocholate
C36H69NO6SI3
1.66
Total percentage area of esters
4.88
Alcohols, Phenols, Aldehydes, and Ketones
13
Ethanol, 2,2-dithiobis
C4H10O2S2
2.27
14
Dodecanol
C12H26O
1.63
15
Tetramethyl-tetrahydro-5H-chromen-8-ol
C13H20O2
0.69
16
Tetrahydro-hydroxy-methyl ethyl-methoxy,2-Naphthalenol
C14H20O3
2.17
17
3H-Phenoxazine phenol derivative
C20H16N2O2
1.69
18
Naphthalene-dimethyl-methylethyl
C15H18
0.51
19
Octanal-2-phenylmethylene
C15H20O
0.60
20
2-Phenanthrenecarboxaldehyde,9-dodecahydro-hydroxy-tetramethyl
C19H30O2
0.76
21
Methyl-4-[(trimethylsilyl)oxy]-2-pentanone
C9H20O2Si
8.17
22
Hydroxy pregnanone
C21H34O2
1.29
23
Androst-5,7-dien-3-ol-17-one
C19H26O2
0.87
Total percentage area of alcohols, phenols, aldehydes, and ketones
20.65
Amides and Amines
24
Trifluoro-N-methyl acetamide
C3H4F3NO
14.89
25
N-Methylbenzenesulfonamide
C7H9NO2S
0.77
26
N,N-dimethyl-1-dodecanamine
C14H31N
5.78
27
N,N-dimethyl-1-tetradecanamine
C16H35N
3.09
28
N-[(Fluorophenyl)methyl]- purin-amine
C12H10FN5
1.29
29
N-methyl-N-benzyldodecanamine
C20H35N
2.02
Total percentage area of amides and amine
27.84
Flavonoids
30
7,9-Di-tert-butyl-1-oxaspirodeca-diene-dione
C17H24O3
0.60
31
Spiro-tricyclodecane-oxirane
C15H24O3
3.54
Total percentage area of flavonoids
4.14
Hydrocarbons and Terpenes
32
Hexadecamethyl-cyclooctasioxane
C16H48O8Si8
1.40
33
Octamethyl-cyclotetrasiloxane,
C8H24O4Si4
0.69
34
Octadecamethyl-cyclononasiloxane
C18H54O9Si9
1.24
35
Docamethyl-cyclopentasiloxane
C10H30O5Si5
2.32
36
Dodecamethyl-cyclohexasiloxane
C12H36O6Si6
2.41
37
Tetramethyl-dioxa-dithia-disiladodecane
C10H26O2S2Si2
1.47
38
Dotriacontane
C32H66
1.33
39
Benz-indeno-phenanthrene
C25H16
4.10
40
Hexadecamethyl-octasiloxane
(separated in two peaks at 32.98 and 35.87 min)C16H50O7Si8
2.08
41
Tri-o-acetyl-ingol
C26H36O9
0.78
42
Isochiapin A
C19H26O6
0.81
Total percentage area of hydrocarbons and terpenes
18.63
Others
43
Dimethyl-hexenyl-tetrahydro-hydroxy-dimethyl-naphthalenyl arabinopyranoside
C25H38O6
2.82
44
Silicon oil
N/A
0.39
Total percentage area of other components
3.21
As seen from Table 4, Egyptian propolis from the North-Sinai area consists of 20.66% acids (aliphatic and aromatic); 4.88% esters; 20.65% alcohols, phenols, aldehydes, and ketones; 27.84% amides and amines; 4.14% flavonoid; 18.63% hydrocarbons and terpenes as well as 3.21% sugar derivatives and silicon oil.
Propolis is well known for its biological activities and can be used in wide applications in medicine, such as antibacterial, antifungal, antioxidant and anticancer, and food industries (Christov et al., 1998; Hegazi and Abd El Hady, 2001; Bakdash et al., 2018). The diversity of biological activities for the tested propolis sample could be due to different active components identified by GC analysis. For example, the antioxidant activity could be referred to as the presence of siloxans elements, 7,9-di-tert-butyl-1-oxaspirodeca-diene-dione, tetrahydro-hydroxy-methylethyl-methoxy,2-Naphthalenol, 3TMS derivative of methyl glycocholate, benz-indeno-phenanthrene, and Isochiapin A.
The predominant component in propolis is Trifluoro-N-methyl acetamide (14.89%), which is usually used to derive and prepare propolis extract for GC analysis. The relatively low content of esters and flavonoid compounds agrees with other researchers' results (Christov et al., 1998; Abd El Hady and Hegazi, 2002) in Egyptian propolis samples. In addition, palmitic and 9-octadecenoic acids were dominant acid components of the tested propolis sample (12.17%). On the other hand, ethanol, 2,2-dithiobis, tetrahydro-hydroxy-methyl ethyl-methoxy,2-Naphthalenol, and methyl-4-[(trimethylsilyl)oxy]-2-pentanone were the dominant alcohols and ketones in the North Sinai-propolis (12.61%). Amines compounds are present in a concentration of 8.87% (N,N-dimethyl-1-dodecanamine and N,N-dimethyl-1-tetradecanamine). Hydrocarbons and terpenes represented 18.63% of the area under the chromatographic curve, with siloxane components making more than 50% of this area. Sugar derivatives (Dimethyl-hexenyl-tetrahydro-hydroxy-dimethyl-naphthalenyl arabinopyranoside) are also present with a concentration of 2.82%.
The antimicrobial activity could be referred to as the presence of siloxans, methyl-4-[(trimethylsilyl)oxy]-2-pentanone, (dimethyl-7-oxo-7-hexahydro-2-naphthalenyl) propionic acid, N-[(fluorophenyl)methyl]- purin-amine, and phenoxazine phenol derivative components. In addition, two components with antiviral activity (N-methylbenzenesulfonamide and tri-o-acetyl-ingol) are present in the tested propolis sample. Also, methyl ester of eicosatriynoic acid, tetramethyl-tetrahydro-5H-chromen-8-ol, dimethyl-hexenyl-tetrahydro-hydroxy-dimethyl-naphthalenyl arabinopyranoside (dimethyl-7-oxo-7-hexahydro-2-naphthalenyl), and propionic acid have anti-inflammatory effects. In addition, tetramethyl-tetrahydro-5H-chromen-8-ol could be considered as provitamin E, while dehydroergosterol tosylate is a precursor for vitamin D2.
The GC-analysis of North Sinai propolis proved the existence of compounds with antiulcer, anticancer, and immunity enhancers such as diethyl ester of 1,2-benzene dicarboxylic acid, tetrahydro-hydroxy-methylethyl-methoxy,2-Naphthalenol, spiro-tricyclodecane-oxirane, and hydroxy pregnanone. The tested propolis samples also contain skincare, emollient, and wound healing components such as dodecanol, octanal-2-phenylmethylene, naphthalene-dimethyl-methylethyl, acetoxypregnan-ol-one-oic acid lactone, (Carboxy-methyl-butenyl) decahydro-dimethyl-methylene-1-Naphthalenecarboxylic acid, palmitic acid ester, dotriacontane, fatty acids, and silicon oil. It also contains steroidal compounds such as; Androst-5,7-dien-3-ol-17-one, dehydroergosterol tosylate, tri-o-acetyl-ingol, hydroxy pregnanone, and Dihydroxy-oxo-prostatrienoic acid, which works as male and female hormones. These compounds were not reported in propolis samples collected from upper Egypt (Hegazi and Abd El Hady, 2001) or the Nile delta (Said et al., 2006). Also, propolis samples collected in Saudi Arabia did not contain these components (Bakdash et al., 2018; Elnakady et al., 2017). These steroidal components in North Sinai propolis samples could be due to the remarkable flora of medicinal and ornamental plants in the Saini peninsula. Based on the results mentioned above, the tested propolis samples could be helpful in the treatments of wound infection.
The chemical composition of fresh bee venom that, was analysed using the high performance liquid chromatography (HLPC), is consist of 1–3.7% apamin, 9–12.9% phospholipase A2, and 63–75% melittin (Rybak-Chmielewska and Szczêsna, 2004), in addition to sugar content, including Fructose (3–7.9%), Glucose (0.1–5.6%), Sucrose (1.4–2%), Turanose (<0.7%), Maltose (<0.3%), isomaltose (<0.4%), Erlose (<0.65%), and Melezitose (<1.5%) (Samanci and Kekeçoğlu, 2019). Moreover, the chemical composition of honey is water (13.2–26.5%), Fructose (37–42.6%), Glucose (18.2–32.1%), Sucrose (0.3–16.5%), other sugars around 8.5%. in addition to enzymes includes esterases, Acid phosphatase, protease, catalase, glucose oxidase, amylase, and glucosidase (Santos-Buelga and González-Paramás, 2017).
2.7 Evaluation of antibacterial activity
The bactericidal activity of bee venom and propolis was measured after 24 h of incubation at two different temperatures (4 and 37 °C). The bacterial cell count at 4 °C decreased from 5.01 × 10⁸ CFU/mL to lower than the detection limit, 103 CFU/mL. In addition, a significant (p ≤ 0.0001) reduction in the bacterial count at 37 °C was observed when the titer was reduced from 1.28x 10⁹ CFU/mL to 5 × 10⁴ CFU/mL (Fig. 5). The cocktail of bacteria treated with propolis at 37 °C was found to be decreased lower than the limit of detection (103), while at 4 °C, propolis was not effective. Moreover, treatment with honey alone was not effective. However, the combination of venom, propolis, and honey with 1x MBC reduced until the limit of detection at 4 °C as well as at 37 °C.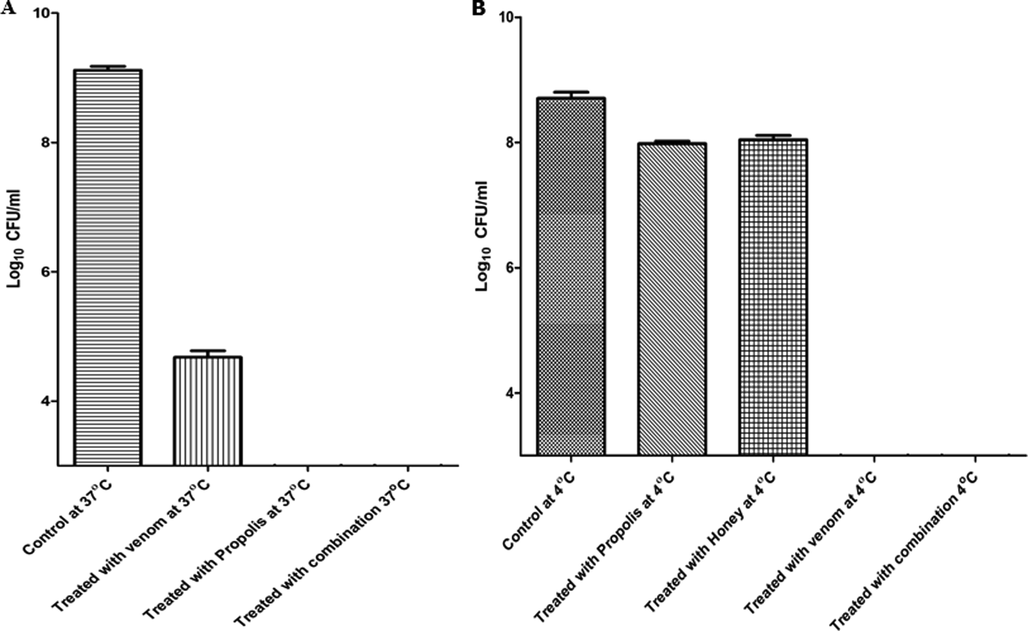
Shows the ability of bee venom and propolis to kill the bacteria after 24 h of incubation at 37 °C A) and 4 °C B) with a concentration of 1x MBC. The results of antibacterial activity at 4 °C and 37 °C were carried out in triplicate (n = 3).
The results of antibacterial activity after 24 h showed the ability of bacteria to persist (not to resist) the effect of bee venom. A population of bacteria with small size was below the limit of detection at 4 °C. However, at 37 °C, this population started to grow slowly. According to the antibacterial activity of propolis at 37 °C and 4 °C, the results showed that propolis is better to be used at 37 °C, not at 4 °C and gave better effect when it is combined with both honey and venom.
2.8 Time-kill kinetics
The analysis of results of the time-kill curve proclaims a rapid bactericidal activity of bee venom at different concentrations, with more than 99.99% killing rate within two hours for the treated cocktail of 11 MDRSA isolates with 10x MIC concentrations and more than 99.999% killing rate after 4 h (Fig. 6). The bacterial killing was faster and more potent with 100x MIC (MBC concentration) as it reached the limit of detection in <2 h and was stable for 6 h. However, the titer of bacteria began to increase after 6 h of incubation with 10x MIC and after 24 h of incubation with 100x MIC of venom. The result of the time-kill curve of bee venom and propolis at both 4 °C and 37 °C using a cocktail of the 11 bacteria showed that bacteria treated with bee venom at 37 °C was reduced to 103 CFU/mL after 70 min compared to 106 CFU/mL in control. In comparison, at 4 °C, it was reduced to 104 CFU/mL after 70 min. However, propolis at 37 °C reduced the bacterial titer to 103 CFU/mL, with no antibacterial effect at 4 °C.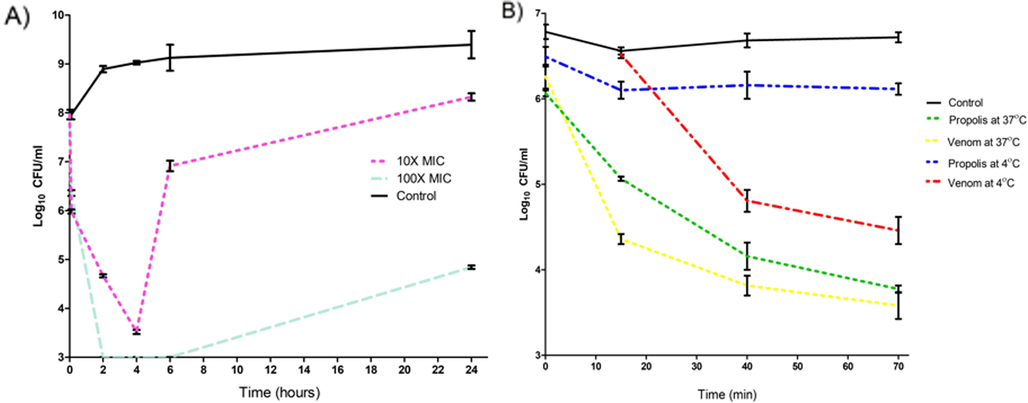
Displays the time-kill curve for the cocktail of MDRSA isolates with A) two different concentrations of the bee venom at 37 °C for 24 h. B) the kill curve for 70 min at different incubation temperatures for 100X MIC of venom and propolis. The results of the killing curve were carried out in triplicate (n = 3).
Although the MIC experiment is the gold standard for measuring the activities of antibacterial agents, it does not reveal important data about the bactericidal effect concerning time. The time-kill kinetics can overcome this limitation. In previous studies, Mastoparan, isolated from wasp venom, against A. baumannii (ATCC 19606), was used with 4x MIC significantly reduced the bacterial titer after 4 h, then the bacterial titer increased again (Daikh et al., 2020). Another study using Melittin, isolated from bee venom, tested on S. aureus ATCC 29213 with a concentration of 1x MIC displayed the same pattern of persistence (Kenawy et al., 2019). In the present study, 10x MIC of bee venom against the cocktail of MDRSA also revealed a decrease in bacterial count relative to the control. Yet, secondary growth was also observed after a while. This secondary growth can be eliminated by employing a higher concentration of the venom or by adding other antimicrobial agents to the venom to obtain a synergetic effect.
2.9 Biofilm inhibition and clearance
The ability of bee venom to inhibit biofilm formation was investigated. The results showed that the biofilm formation by the bacterial cocktail was decreased by 58.2%, 94.6%, and 98% when it was incubated with bee venom with concentrations of 1/10x MIC, 1x MIC, and 3x MIC, respectively, for 24 h at 37 °C (Fig. 7). However, the ability to eliminate the established S. aureus biofilm (biofilm clearance) was between 13.8% and 61.5% for bee venom with the concentration of 1x MIC and 3x MIC, respectively, for 24 h at 37 °C (Fig. 8). On the other hand, propolis decreased the ability of bacteria to form biofilm by 100%, 99.4%, and 57% at concentrations of 1/3x MIC, 1/10x MIC, and 1/30x MIC, respectively. However, it did not show any effect at 1/100x MIC. Nonetheless, propolis displayed a moderate biofilm clearance activity, as it revealed reduction by 45.5%, 38.96%, and 44.9% at concentrations of 1/3x MIC, 1/10x MIC, and 1/30x MIC respectively. The honey presents a high activity in inhibiting biofilm formation with 95.75% at 50% concentration. Yet, like propolis and venom, this activity was reduced in the case of biofilm clearance, and the result showed a 76.8% reduction with a 50% concentration.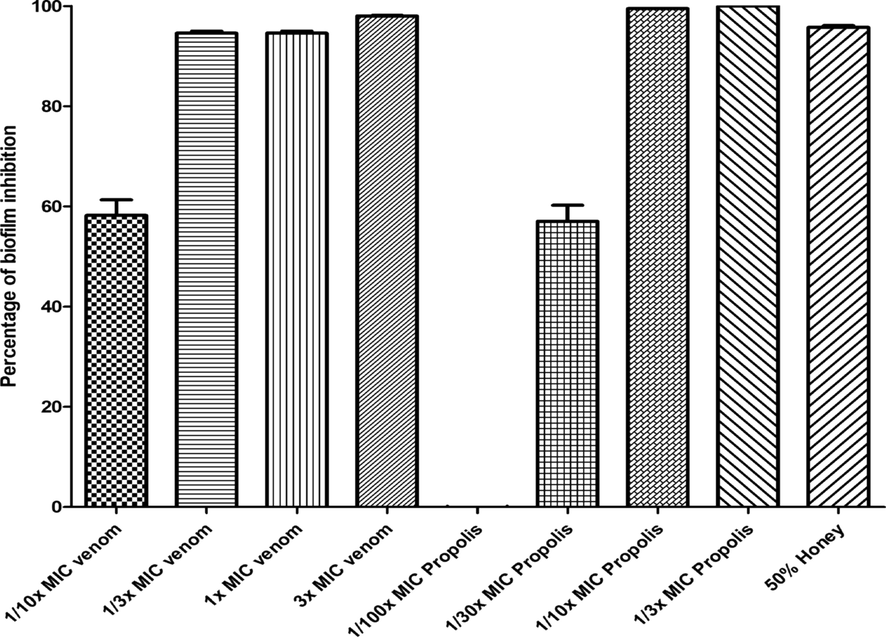
Represents the effect of venom, propolis, and honey with different concentrations to inhibit the biofilm formation of the bacterial cocktail of MDRSA. The results of biofilm inhibition were carried out in triplicate (n = 3).
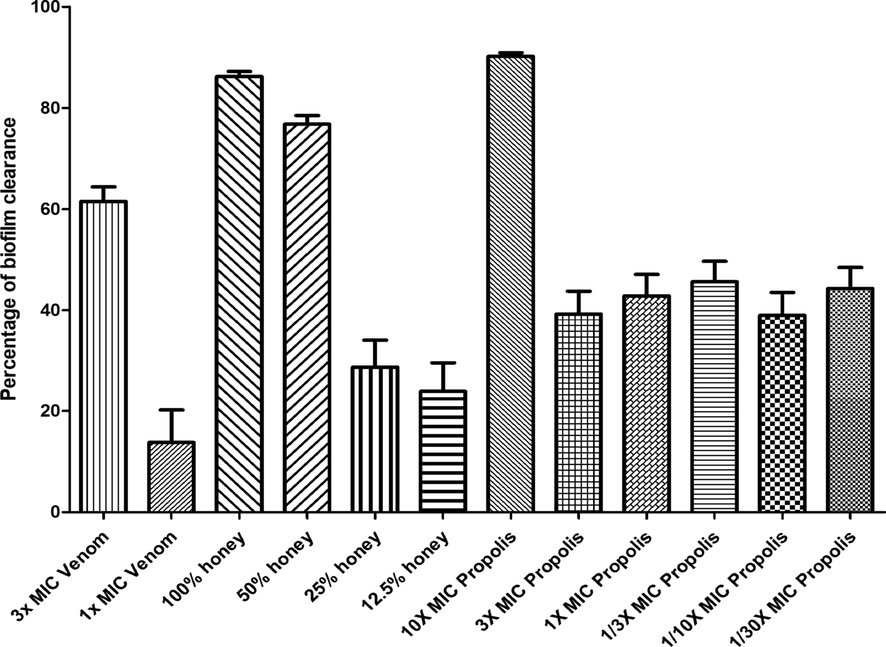
Represents the effect of venom, propolis, and honey with different concentrations to clear the biofilm formed by a bacterial cocktail of MDRSA. The results of biofilm clearance were carried out in triplicate (n = 3).
The biofilm clearance and inhibition results showed a great potential of propolis to disrupt biofilms with a 100% reduction at a concentration of 1/3x MIC. Also, it was demonstrated that honey was the best option for biofilm clearance. It showed a decrease of 76.8% at 50% concentration compared to propolis and venom, which showed lower activity in reducing an already formed biofilm. According to the results by Grecka et al. (Grecka et al., 2019), an MIC of 128 µg/mL was able to eradicate biofilm by S. aureus compared to 45.5%, 38.96%, and 44.9% at concentrations of 1/3x MIC, 1/10xMIC, and 1/30xMIC, respectively. The previous results (Daikh et al., 2020) reported that the petroleum ether of propolis, chloroform extract of propolis, ethyl acetate, and methanol extracts displayed a biofilm inhibition activity ranging from 6.83% ± 0.78% to 80.72% ± 2.34. However, our study showed more activity as it varies from 100% to 57% with different concentrations.
2.10 Photodocumentary analysis of wound healing
A typical photograph of the non-treated and non-infected wound (G1), non-treated infected wound (G2), and the infected wound treated with Bee venom/Propolis/ chitosan hydrogel (G3) on days 0, 4, 7, 10, 14, and 17 post-surgery are offered in (Fig. 9). Moreover, the diagram of % wound closure is also supplied in (Fig. 10). The % wound closure of all wounds for different groups demonstrated that the topical application of Bee venom/Propolis/ chitosan hydrogel to the rounded area of full-thickness excision wound significantly accelerated the rate of wound healing. For example, starting from day 7, the G3 demonstrated a decrease in the wound area represented by a rise in the % wound closure (42.3 ± 19.2%) compared to the % wound closure of G2 (1.1 ± 5.0%). At the end of the experiment (day 17), the G3 group acquired maximum % wound closure (95.16 ± 6.55%) followed by G1 (86.18 ± 9.56%). On the other hand, G2 showed a minimal % wound closure (80 ± 10.4 %).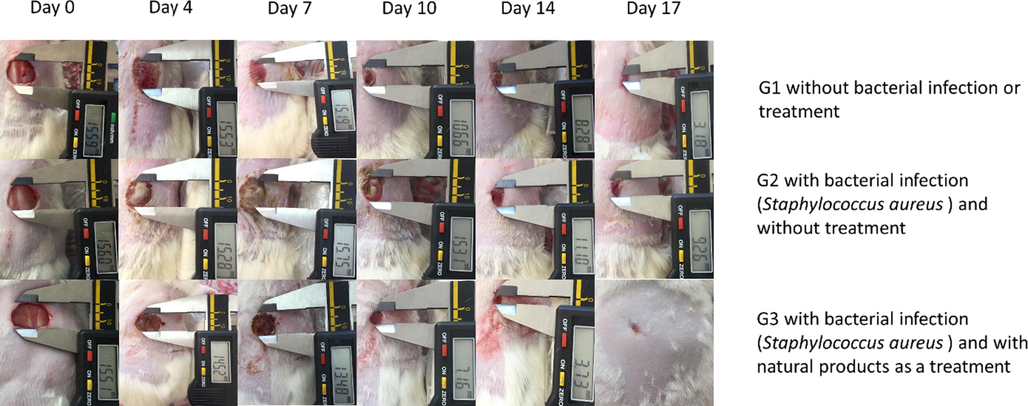
Photodocumentary analysis of full-thickness excision wounds in rats at a fixed focal distance using digital photographs.
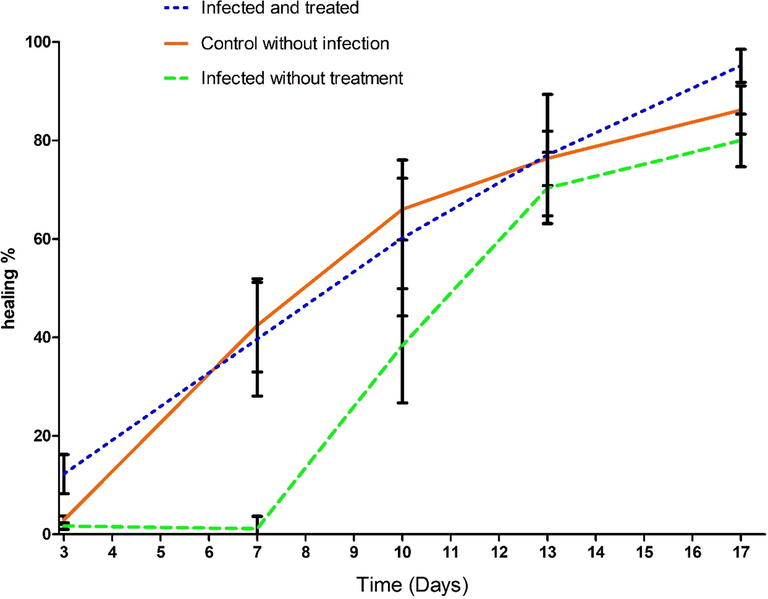
The % wound closure of all wounds. The significance of the time in days on the wound healing was highly significant, p < 0.0001. In addition, the differences among the groups were highly effective, p < 0.001. the number of rats is 5 in each group from day 3 to day 10, and n = 4 until the end of the experiment.
Wound infections are the leading cause of death in many patients, especially when they enter the bloodstream causing septicemia. Moreover, in many cases, wound infections lead to further inflammation and severe tissue damage, the leading cause of delayed healing (Kenawy et al., 2019). Furthermore, bacterial resistance to many antimicrobial agents represents intimidation to public health and is mounting at an alarming rate (El-Deeb et al., 2020). Therefore, there is an urgent demand to evolve new drugs, especially from a natural source, suppressing microbial invasion at the wound site and minimizing the threat of bacterial resistance. In this context, numerous studies specified the efficiency of some natural biomaterials, including bee venom, propolis, and chitosan hydrogel, to accelerate the healing of infected wounds (Badr et al., 2016; Takzaree et al., 2016; Liu et al., 2018).
In this study, the therapeutic efficiency of (honey/bee venom/ propolis/chitosan hydrogel) was examined on rats to treat full-thickness wounds infected with S. aureus clinical isolate, which is resistant to multiple antibiotics, including Tetracycline (10 μg) and Vancomycin (30 μg). The presence of terpenes in the propolis with high concentration is one factor in accelerating wound healing (Salas-Oropeza et al., 2021). In addition, the active ingredients such as bee venom and propolis have a tested antibacterial activity; as a result, there is no evidence of infection in the wounds, unlike the clear bacterial layer on infected wounds without treatment during the first 10 days as in Fig. 9.
From the former histopathological outcome, it is evident to us that among the S. aureus wound infected groups, superior healing was observed in the group treated with bee venom/ propolis/chitosan hydrogel, with the entire recovery process reaching the remodeling phase with complete restoration of the epidermal thickness and skin appendages regeneration, which was comparable to the sterile wound healing process with some superior features like the epidermal thickness, the collagen deposition and the minimal amount of the residual granulation tissue.
2.11 Histopathological analysis of wound healing
Histopathological photographs of wound tissues stained with both (H&E), Masson’s trichrome (MTs), and immunostaining on day 17 are illustrated in (Fig. 11). The skin section from the G1 stained with (H&E) showed epithelial re-epithelialization, with epidermal thickness, 47 ± 1.0 µm, with regenerated skin appendages >5/HPF (score 3). The dermis showed a remodeling phase of healing formed of collagen fibers mean 96 ± 0.8% of the wound area, evidenced by MTs, with scant residual granulation tissue formed of few dermal lymphocytes mean 7 ± 1.1/ HPF using CD45 IHC. In contrast, the mean blood vessels count was 4 ± 0.7/HPF, and the myofibroblasts were 3.1 ± 0.4/HPF using α-SMA IHC.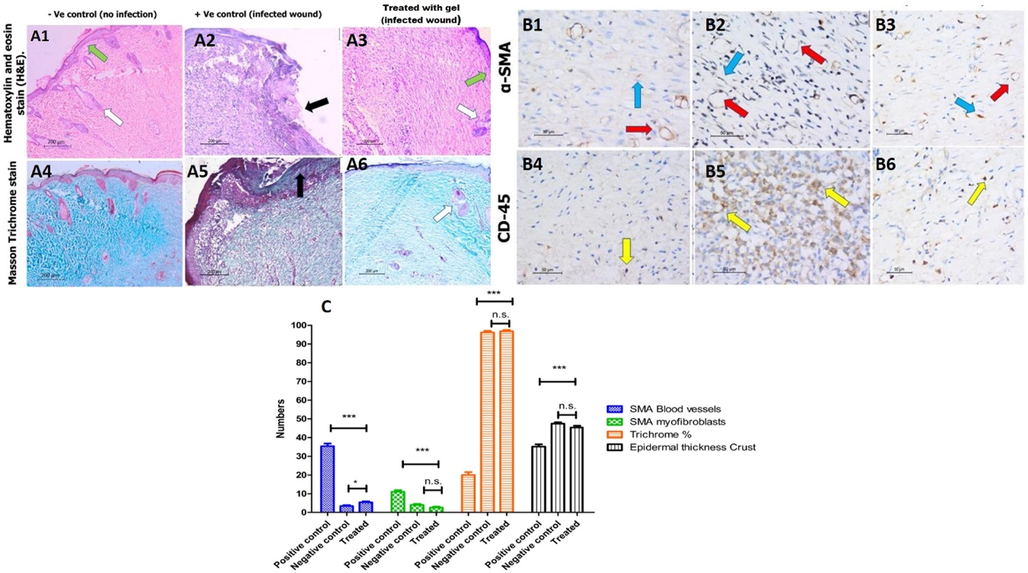
Histological analysis of wounded skin section from different rat groups at day 17 post wounding. A1-3) hematoxylin and eosin (H&E) staining, ×100 showing in A1) the non-infected, non-treated group epidermal re-epithelialization (green arrow) with the regeneration of the skin appendages (white arrow). A2) the non-treated group shows epidermal ulceration and crust formation (black arrow). A3) shows thick epidermal re-epithelialization (green arrow) with the regeneration of the skin appendages (white arrow). A4-6) Masson's trichrome staining × 100 shows (A6) the remodeling phase of healing in the third group treated with the gel, similar to the (A4) non-infected group. In contrast, the healing process in (A5) the second group is delayed representing the inflammatory phase in the form of extensive inflammation and granulation tissue with the least amount of fibrous tissue, B1-3) immunohistochemistry staining for α-SMA, x400 highlights the blood vessels (red arrow) and myofibroblasts (blue arrow) of the granulation tissue representing the complete maturation of the wound healing with few residual amount of granulation tissue in groups (B1) without infection and (B3) infected and treated. In contrast, in (B2), the infected untreated group shows the highest granulation tissue. B4-6) immunohistochemistry for CD-45, x400, reveals the least amount of lymphocytes (yellow arrow) in (B4) the first and (B6) third groups, representing the healing process's completion. C) The comparison of all histological analyses and the results of the histological analysis were carried out five times (n = 5).
The skin specimens from the G 2 stained with (H&E) showed epidermal ulceration, with a thick crust of 33.6 ± 1.2 µm, lacking skin appendages (score 0). The dermis showed few amounts of fibrous tissue evidenced by MTs. The dermis was predominantly in the inflammatory phase with early proliferation phase of wound healing consisting of abundant acute inflammatory infiltrate, granulation tissue formed of newly-formed blood vessels, mean 35.2 ± 1.3/HPF, the myofibroblasts count mean was 15.3 ± 2.4/HPF using α-SMA IHC. With few dermal fibrous tissue fibers, the mean was 22.3 ± 1.7% of the total area and an increased number of lymphocytes 60 ± 2.3/ HPF using CD45 IHC.
The skin specimens from G3 stained with (H&E) showed epidermal re-epithelialization with a mean thickness of 45.3 ± 0.9 µm with regenerated skin appendages more than 5/HPF (score 3). The healing process was in the remodeling healing phase; with the wound area formed mainly of collagen fibers, the mean area was 98.4 ± 1.3% (score 3), evidenced by MTs. The dermis revealed the scanty amount residual of the granulation tissue which was fully matured into collagen fibers, the mean count of the blood vessels was 6 ± 0.4/ HPF, and the mean number of myofibroblasts was 2.1 ± 0.4/HPF using α-SMA IHC with decreased number of the lymphocytes, mean value was 6.3 ± 1.0/HPF using CD45 IHC.
The augmented healing efficiency for this group might be attributed to the concomitant repression of cytokines associated with fibrosis by bee venom, minimizing the wound size and mounting the epithelial proliferation in a full-thickness excision wound model (Han et al., 2011). Also, the presence of propolis with its fundamental ingredient, flavonoids, accelerates wound healing due to their anti-inflammatory and antibacterial effects (Abu-Seida, 2015). It was previously reported that propolis contains caffeic acid phenethyl ester that possesses an immunosuppressive activity in T-cells responsible for the onset of various inflammatory diseases. Moreover, it also downregulates both interleukin- (IL-) 2 gene expression and IL-2 synthesis in stimulated T-cells (Lotfy, 2006). Hozzein et al. (Hozzein et al., 2015) reported that the topical application of propolis accelerates wound healing in diabetic mouse models via promoting TGF-Beta/Smad-mediated collagen synthesis. Several studies have reported the great value exerted by chitosan in boosting wound healing as its highly safe to mammalian cells, biocompatible, biodegradable, antimicrobial, and anti-inflammatory activity (Sabra et al., 2020; Tamer et al., 2018). The accelerated wound healing of chitosan is due to energizing the migration of mononuclear cells and polymorphonuclear (PMN), which boosts skin tissue regeneration and re-epithelization (Hassan et al., 2021).
3 Materials and methods
3.1 Bacterial isolation
The bacterial samples (n = 11) of MDRSA were isolated from patients and provided to us by one of our collaborators. They were all streaked on Mannitol Salt Agar (MSA; Oxoid, England) and left two days to grow at 37 °C. For the rest of the experiments, a day culture was prepared from the purified culture by incubating a single colony in Tryptone Soy Broth (TSB; Oxoid, England) at 37 °C.
3.2 Bacteria characterization
An oxidase test was conducted by adding N,N,N′,N′-tetramethyl-p-phenylenediamine (TMPD) to sterile distilled water, and then a single fresh colony was picked using sterile swap, where one drop of TMPD solution was added and observed for the color change to blue/purple. In addition, a single fresh colony was picked from each strain and smeared over a glass slide, then a drop of hydrogen peroxide was added and observed for the formation of bubbles. In addition, the fermentation of mannitol was confirmed by growing the bacterial isolates on MSA to observe the yellow colonies after incubation at 37 °C. Moreover, the confirmation of the bacterial isolates was confirmed via PCR-amplification using specific primers for S. aureus, nuc gene. The forward primer sequence used was (5′-GCGATTGATGGTGATACGGTT-3′), and the reverse sequence was (5′-AGCCAAGCCTTGACGAACTAAAGC-3′) with an expected product size of 267 base pairs (Brakstad et al., 1992). The colony PCR reaction has 26 cycles that were performed at denaturation temperature of 95 °C for 3 min; then 94 °C for 30 s; annealing at 55 °C for 30 s and final extension at 72 °C for 2 min. The ladder used was 100 bp length using an Applied Biosystems thermal cycler. The PCR product was run on a 1% (w/v) agarose gel to identify its size.
3.3 Antibiotic sensitivity test
A panel of antibiotics that are usually used to treat MDRSA was tested against the bacterial isolates to identify the sensitivity of isolates to selected antibiotics. The panel included a wide range of antibiotic classes including; β-lactam (Amoxicillin, 10 μL); Penicillins (Oxacillin, 1 μL); Aminoglycoside (Gentamicin, 30 μL); Glycopeptide (Vancomycin, 30 μL), Macrolide (Erythromycin, 15 μL); Tetracyclines (Tetracycline (10 μL), Doxycycline, 30 μL); Phenicols (Chloramphenicol, 30 μL); Oxazolidinones (Linezolid, 30 μL); Lincomycin (Clindamycin, 2 μL); Minobenzenesulfonamides (Sulfamethoxazole, 25 μL). The antibiotic disk diffusion results were compared to the National Committee for Clinical Standards guidelines (N.C. for C.L. Standards, 1999). Antibiotics used in this study were purchased from (Oxoid, England).
3.4 Honeybee venom collection and preparation
The venom used in this study was gifted to the center as a lyophilized powder from the faculty of Environmental Agricultural Sciences, Arish University, North Sinai, Arish, Egypt. The specific details on the venom extraction method were mentioned elsewhere (El-Bahnasy et al., 2017). The bee venom sample was saved at – 20 °C until needed.
3.5 Propolis collection and preparation
The propolis in this work was gifted to the center in its raw condition from the faculty of Environmental Agricultural Sciences, Arish University, North Sinai, Arish, Egypt. For the preparation, the heated ethanol extraction method was followed with minor modifications. Briefly, 0.4 g from the row propolis was added to 10 mL of 80% Ethanol (HPLC grade) for 2 h in 60 °C, followed by incubation for another 2 h at 80 °C before centrifugation at 4000x g for 15 min undercooling (4 °C). The supernatant solution was withdrawn and filtered using the syringe filter with 0.45 μm pore size to ensure sterilization. Following the preparation, the yield was measured by the complete evaporation and weighing 1 mL extracted propolis. The tubes were covered with aluminum foil to prevent the sun rays during all extraction steps.
3.6 Honey hydrogel preparation
The commercial honey was prepared in a concentration of 70% via mixing it with 1% acetic acid solution followed by adding 1 mg of bee venom and 1.5% of ethanolic extract propolis in a sterile beaker under a magnet stirrer at 800 rpm for 1 h. The freshly prepared 2% chitosan and dissolved gelatin in sterile water were added to the previous mixture with glycerol, then continued stirring until the gel formed. After the physical gelatination was created due to the presence of chitosan and gelatin, the final concentrations in every mL of the gel are 7 mg gelatin, 300 mg honey, 70 μg bee venom, 140 mg glycerol, and 15 μL of extracted propolis. The glycerol was added to create a bacteriostatic environment (Stout and McKessor, 2012). The gel was stored undercooling (4 °C) for wound healing experiment.
3.7 In vitro antioxidant activity of propolis
Five different concentrations (10, 20, 40, 50, 60, and 80 µg/mL) of propolis extraction were prepared in methanol to evaluate the effect of 2,2-diphenyl-1-picryl-hydrazyl-hydrate (DPPH) radical scavenging. Besides, five different concentrations (50, 40, 30, 20, 15, 10, and 5 µM) of Trolox standard were used as a reference. DPPH free radical assay was conducted according to Brand-Williams et al. (Brand-Williams et al., 1995) with modifications. Briefly, Aliquots of 100 μL from a methanolic solution of DPPH reagent (0.1%) were transferred to 100 μL of the propolis in 96 wells plate (n = 6). After 30 min of incubation at room temperature in the dark, the results were obtained from measuring the absorbance at 540 nm using microplate reader FluoStar Omega.
3.8 The silylation and gas chromatography/mass spectrometry (GC–MS) of the propolis extracts of propolis
For the silylation of the extracts, about 10 mg of the extract was added to both dry pyridine and bis (trimethylsilyl) trifluoracetamide, then heated at 80 ◦C for 20 min, and investigated by GC–MS. The GC–MS analysis was done using TRACE GC Ultra Gas Chromatographs (THERMO Scientific Corp., USA), linked to a Thermo mass spectrometer detector (ISQ Single Quadrupole Mass Spectrometer), equipped with a TR-5 MS column (30 m × 0.32 mm i.d., 0.25 μm film thickness). The temperature was programmed from 60 to 240 °C at a rate of 4 °C/min. Helium worked as a carrier gas, with a 1 mL/min flow rate. The split ratio of 1: 10 was used, and the injector temperature was set at 210 °C to dilute the samples (1:10 hexane, v/v) of 1 μL of the propolis extraction. Ionization voltage was set at 70 eV by a spectral detection range of m/z 40–450. The identification was accomplished by AMDIS software, its retention indices (relative to n-alkanes C8-C22), and mass spectrum matching to Wiley spectral library collection and NSIT library database.
3.9 Protein analysis of the components of the natural products
Sodium dodecyl sulfate–polyacrylamide gel electrophoresis (SDS-PAGE) was conducted according to Laemmli (Laemmli, 1970) with modifications. Briefly, bee venom, propolis, and honey were diluted in distilled water and then heated for 10 min at 90 °C after adding SDS sample loading buffer. The molecular weight marker 200 kDa was used to mark the bands. All samples were loaded in the SDS-PAGE gel (12%) and run parallel. The gel was obtained and stained with Coomassie blue solution dye. After that, the gel was washed to remove excess dye until the visualization of bands. (The results and discussion for this experiment are provided in supplementary data).
3.10 Cytotoxicity in human skin fibroblast for bee venom
The human skin fibroblast cell line, which was used in this experiment, its primary cells were obtained from foreskin circumcision operations at KAU hospital. Cells were cultured in DMEM media supplemented with streptomycin, penicillin, and fetal bovine serum (FBS). Cells were incubated in humidified, 5% (v/v) CO2 atmosphere at 37 °C. Then, Sulforhodamine B (SRB) assay was done to determine the cytotoxic effect of the bee venom using the method described by Vichai et al. (Vichai and Kirtikara, 2006) with modifications. Briefly, aliquots of 100 μL cell suspension (5000 cells) were seeded in 96-well plates with complete media without venoms. After 24 h, cells were treated with another volume of media containing bee venom at different concentrations ranging from (0.01, 0.1, 1, 10, 100 μg/mL) and positive control incubated without venom. After 72 h of bee venom exposure, cells were fixed by discarding media and adding 150 μL of 10% Trichloroacetic acid (TCA) and was kept at 4 °C for 1 h to precipitate the proteins. The wells were washed 5 times with distilled water. 70 μL of SRB solution (0.4% w/v) were incubated in each well in a dark place at room temperature for 10 min to stain the proteins. The plate was rinsed 3 times with 1% acetic acid to omit unbounded dye and allowed to air-dry overnight. Then, 150 μL of 10 mM Tris-base solution was added to solubilize protein-bound SRB stain; the absorbance was determined at 540 nm using a BMG LABTECH®- FLUOstar Omega microplate reader (Ortenberg, Germany). The experiment was conducted in triplicates, and each well was visualized using converted microscopy with and without staining at 200x magnification.
3.11 Disc diffusion and well diffusion method
The disc diffusion method was conducted to predict the antibacterial activity of bee venom against 11 MDRSA isolates as described in (Surendra et al., 2011) with some modifications. The sterile TSB was used to prepare the overnight culture suspension followed by 1:10 dilution. Further, 200 µL was spread on a plate containing Tryptone Soy Agar (TSA) via a sterile cotton swab. The surface of the medium was left to dry in a sterile area for 5 min, and sterile paper discs (6 mm in diameter) were added to them. Exactly, 10 µL of various concentrations of bee venom and propolis (10 mg/mL, 3.3 mg/mL, 1.1 mg/mL, 0.37 mg/mL, 123 µg/mL, 41.2 µg/mL, and 13 µg/mL) was used for each isolate and loaded on discs. The plates were incubated for 24 h at 37 °C. After that, the diameters of inhibition zones were measured.
Wells with 6-mm diameters were produced in TSA plates had streaked with cocktail MDRSA (ZCSA/02; 03; 04; 05; 06; 08; 14; 15; 16; 17; and 24) and filled with 75 μL of 2% Chitosan gel, another well with 75 μL of 70% honey was combined with 1 mg of propolis and venom, the last well with 75 μL of 2% Chitosan gel with 70% honey and 1 mg propolis and venom then incubated at 37 °C for 24 h and the inhibition zone was measured.
3.12 MIC and MBC
The MIC values of the bee venom against each bacterial isolates and cocktail of bacteria were measured using a 96‐well sterile microtiter plate F-bottom, according to the micro‐well dilution method with modifications (Zgoda and Porter, 2001). Briefly, the bee venom and propolis were diluted in TSB at different concentrations 1:10 dilutions (0.3‐1000 μg/mL), and 20 μL of bacterial suspension with 106 CFU/mL was added to reach a final volume of 200 μL in each well. MIC was detected at the lowest concentration that inhibited the bacterial growth (clear well) after 24 h at 37 °C. Then, the MBC was determined by adding 10 μL of clear‐well samples into a fresh TSB for another 24 h. Then recording the lowest concentration of bee venom and propolis without detecting turbidity means the bee venom killed all bacteria in that concentration.
3.13 Antibacterial activity at 37 °C and 4 °C
The activity of bee venom and propolis against the cocktail of bacteria was evaluated with the concentration of 1x MBC. Four eppendorfs containing a fresh cocktail of bacteria in TSB with a concentration of 108 were used; the first two were incubated for 24 h at 37 °C and 4 °C without adding the bee venom. In the second two, the bee venom was added with the concentration of 1x MBC and incubated for 24 h at 37 °C and 4 °C. The bacterial count was observed using the serial dilution spotting technique.
3.14 Determination of time-kill curve
To measure the dynamic process of the bactericidal activity of bee venom, the time-kill curve method was conducted, as described previously (N.C. for C.L. Standards, 1999), with some modifications. Briefly, bee venom with 10x and 100x of MIC were tested against a cocktail of 11 MDRSA isolates. Cocktail of bacteria (control) and bacteria with 10x MIC (treatment 1) and 100x MIC of bee venom (treatment 2) were incubated at 37 °C, where 100 μL aliquot of each was collected at different time points (2 h, 4 h, 6 h, and 24 h), serially diluted and spotted on TSA. The results were obtained in triplicate, and time-killing curves were plotted as colony counts (log10 CFU/mL) versus time. The limit of detection for this experiment was 103 CFU/mL.
To compare the dynamic process of the bactericidal activity of bee venom and propolis, the time-kill curve method was conducted at 4 and 37 °C, as described previously. In addition, 1 mg of each propolis and venom was used at the time point of (0, 15, 45, 70 min).
3.15 Biofilm inhibition test
The ability of natural compounds to prevent the formation of biofilm was tested. First, 180 µL of bacterial cocktail at log phase (≤105 CFU) were loaded in the 96-well microplate Flat-bottom, in which the bee venom and propolis were added with concentrations of 3x MIC, 1x MIC, 1/3x MIC, and 1/10x MIC for bee venom and 1x MIC, 1/3x MIC, and 1/10x MIC, 1/30x MIC for propolis in the presence of 50% honey. All treatments were added to the plat at which the final volume in each well reached 200 µL. After 48 h incubation at 37° C, the planktonic bacteria were washed with sterile water, and then the plate was flipped down with shaking to remove the remaining unattached bacteria three times. To stain the biofilm mass, 200 uL of 0.1% crystal violet solution was added to each well and incubated for 15 min; then, the plate was washed three times and left for 30 min to dry. To observe the results, 200 μL of 30% acidic acid was added to each well and applied to a vis-spectrophotometer (Jenway 7200 visible) to report the absorbance change at 540 nm. In this experiment, both the bacterial cocktail has grown on a microplate without treatment. The treatments and media without the bacteria were utilized as positive and negative control (blank), respectively. 1x MIC of propolis is 100 μg/mL and for the bee venom 10 μg/mL, as a final concentration.
3.16 Biofilm clearance test
The cocktail of bacterial strains was incubated in the 96-well microplate F-bottom for 24 h at 37 °C. After incubation, the planktonic cells were withdrawn with sterile tips then the bee venom, propolis, and honey were added with concentrations of 3x MIC, 1x MIC, 1/3x MIC, and 1/10x MIC for bee venom, 10x MIC, 3x MIC, 1x MIC, 1/3x MIC, and 1/10x MIC, and 1/30x MIC for propolis, and 100%, 50%, 25%, and 12.5% for honey followed by further incubation for another 24 h. As previously described in the biofilm destruction test section, the biofilm results were observed.
3.17 Preparation of chitosan gel embedded natural product
The gel was prepared by dissolving 0.2 g of gelatin in 20 mL hot sterile deionized water. Then, 10 g of honey, 2 mg of bee venom, 4.2 g of glycerol, and 400 μL of ethanolic propolis extract were added to the dissolved gelatin under magnetic stirring until the complete dissolving followed by UV sterilization for 15 min. Finally, 400 mg chitosan was mixed after adding 300 μL of anhydrous acetic acid to provide an environment suitable for chitosan.
3.18 In vivo wound healing
The chitosan/ propolis/bee venom/honey mixture can be applied locally to the wounded skin area using antimicrobial gel to examine its healing potential on the full-thickness skin infected wound rat model. Fifteen Wistar male rats (8 weeks old), weighing approximately 180–200 g, were utilized in the in vivo animal study. The Animal Care Committee of the Alexandria University (ALEXU-IACUC) approved all experimental procedures, with an official approval for the surgical protocol (AU-IACUC-14/210601-3-4). Every rat was housed in an individual crate and given access to a standard laboratory diet and mineral water ad libitum under striped ecological conditions. According to our previously published research, the surgery was performed (Mohamed et al., 2021; Shalaby et al., 2020; El-Aassar et al., 2020). The animals were randomly divided into three groups comprising five animals in each group at which group one applied sterile gauze (no wound infection), group 2 applied sterile gauze to S. aureus infected wound, and group 3 applied 100 μL of hydrogel mixture (0.7 mg gelatin, 30 mg honey, 7 μg bee venom, 14 mg glycerol, and 1.5 μL of extracted propolis) to S. aureus infected wound.
The animals were anesthetized by an intramuscular injection of xylazine (10 mg/kg) and ketamine (60 mg/kg) then the back hair at the dorsal areas was removed using an electric shaver. The shaved skin was cleaned via 70% ethanol before induction of a full-thickness wound of about 15 mm in diameter with the help of dissecting scissors and sterile forceps (one wound /rat). Wound infection was completed by inoculating the wound with S. aureus (108 CFU/mL) for two hours before applying the treatment. Both sterile gauze and hydrogel containing (gelatine/chitosan/propolis/bee venom/ honey) were applied to cover the wound area and replaced with a new one on the observation day. On days 3, 7, 10, 14, and 17 after surgery, the changes in the wound areas were examined by taking the digital images, and the % contraction of each wound was calculated using the following equation.
Wound area reduction (%) = [(Wound area at the day 0 – Wound area at the given day) / Wound area at the day 0] × 100 (Werner et al., 1994).
At the end of the experiment (day 17), the full thickness of the skin was eradicated and fixed in 10 % formaldehyde for histopathological investigations.
3.19 Histological Examination:
On day 17, the rats were sacrificed, followed by removing the tissue from the wound bed and its surrounding healthy skin to assess the wound healing; all specimens were fixed in 10 % formaldehyde and embedded in paraffin blocks for histopathological examination. The skin sections were stained with hematoxylin and eosin (H&E) and examined under a light microscope (Leica, Germany). Histological examination of the whole wound area was done, and the mean value of the percentage of the fibrous tissue and epidermal thickness was quantified using Imagej, v1.53 (Maryland, USA). The skin appendages were scored (no skin appendages 1, few < 5/wound are 2 and greater than 5/ wound area 3). The skin sections were also stained with Masson Trichrome staining (MTs). Imagej, color deconvolution v1.53 (Maryland, USA) was used to quantify the percentage area of fibrosis in each specimen (Park et al., 2015; Abramov et al., 2007).
3.20 Immunohistochemical (IHC) staining and interpretation:
IHC of all sections was done using the Avidin-Biotin-Peroxidase method (Hsu et al., 1981). CD45 (Ready to use primary antibody, mouse anti-human, monoclonal antibody, P0042; Leica Biosystems, USA) and α-SMA (Ready to use primary antibody, mouse anti-human, monoclonal antibody, P0943; Leica Biosystems, USA) were used to stain the lymphocytes, blood vessels, and myofibroblasts respectively. The antibodies were added to each section using the Bond-Max fully automated immunostainer (Leica Biosystems, USA). In each IHC run, rat tonsil was used as the positive control for CD45 antibody and leiomyoma was used as the positive control for α-SMA antibody. Negative controls were also included in each run. The quantification of the IHC of CD45 and α-SMA was done, in each slide, using the quantitative-image analysis (Leica microsystems, Switzerland).
3.21 Statistical analysis
All experiments were repeated triplicates, and the data were presented in the form of mean ± standard deviation (SD). All statistical analyses and graphs were generated using GraphPad Prism v5 software. Both T-test and ANOVA tests were conducted during the study to evaluate the significance p < 0.05.
4 Conclusion
In conclusion, our results demonstrate that propolis and bee venom are effective against MDRSA isolated from clinical wounds and can work as a potential alternative to antibiotics. In addition, propolis is found to have antioxidant activity (40.07 ± 2.18 μg/mL), which can protect the cells against the damage of oxidation. On the other hand, Bee venom has a cytotoxic effect with IC50 18.3 μg/mL. Thus, at a low concentration (not exceeding 10 μg/mL), the venom will be safe to be used on the cells. In addition, propolis and bee venom are efficient for inhibiting and clearing the biofilm of the bacterial cocktail. Based on the presented results, combining those natural products in a gel can be a promising agent against wound infection in the future.
Data availability
The data used to support the findings of this study are included within the supplementary information file.
Funding
This research was funded by the Egyptian Sciences and Technology Development Fund (STDF), grant #41909.
CRediT authorship contribution statement
Abdallah S. Abdelsattar: Conceptualization, Methodology, Writing – review & editing, Writing – original draft. Salsabil Makky: Methodology, Writing – review & editing. Rana Nofal: Methodology, Writing – original draft. Mariam Hebishy: Methodology. Mona M. Agwa: Methodology, Writing – review & editing. Rania G. Aly: Methodology, Writing – review & editing. Mohamed Y. Abo El-Naga: Writing – review & editing. Yehia A. Heikal: Writing – review & editing. Mohamed S. Fayez: Methodology, Writing – review & editing. Nouran Rezk: Methodology, Writing – review & editing. Ayman El-Shibiny: Conceptualization, Supervision, Methodology, Validation, Writing – original draft, Writing – review & editing, Funding acquisition.
Acknowledgement
The authors would like to thank Sara Aziz, Heba Sami, Amera Elsayed, Anan Safwat, and Kareem Essam for their help in this work.
Institutional Review Board Statement
The study was conducted according to the guidelines of the Declaration of Helsinki and approved by the Institutional Review Board of Animal Care Committee of the Alexandria University (ALEXU-IACUC) (AU-IACUC-14/210601-3-4 and 01 June 2021).
Declaration of Competing Interest
The authors declare that they have no known competing financial interests or personal relationships that could have appeared to influence the work reported in this paper.
References
- Egyptian propolis: 2. Chemical composition, antiviral and antimicrobial activities of East Nile Delta propolis. Zeitschrift Für Naturforsch. C.. 2002;57:386-394.
- [Google Scholar]
- Histologic characterization of vaginal vs. abdominal surgical wound healing in a rabbit model. Wound Repair Regen.. 2007;15:80-86.
- [Google Scholar]
- Effect of propolis on experimental cutaneous wound healing in dogs. Vet. Med. Int.. 2015;2015
- [Google Scholar]
- Synergistic activity of melittin with mupirocin: A study against methicillin-resistant S. Aureus (MRSA) and methicillin-susceptible S. Aureus (MSSA) isolates, Saudi. J. Biol. Sci.. 2020;27:2580-2585.
- [Google Scholar]
- Propolis and bee venom in diabetic wounds; a potential approach that warrants clinical investigation. African J. Tradit. Complement. Altern. Med.. 2015;12:1-11.
- [Google Scholar]
- Bee venom accelerates wound healing in diabetic mice by suppressing activating transcription factor 3 (ATF 3) and inducible nitric oxide synthase (iNOS) mediated oxidative stress and recruiting bone marrow derived endothelial progenitor cells. J. Cell. Physiol.. 2016;231:2159-2171.
- [Google Scholar]
- Chemical composition of propolis from the Baha region in Saudi Arabia. Czech J. Food Sci.. 2018;36
- [Google Scholar]
- Antibacterial activity of selected snake venoms on pathogenic bacterial strains. Rev. Rom. Med. Lab.. 2019;27:305-317.
- [Google Scholar]
- DPPH free radical scavenging activity of two extracts from Agelanthus dodoneifolius (Loranthaceae) leaves. Int. J. Toxicol. Pharmacol. Res.. 2016;8:29-34.
- [Google Scholar]
- Detection of Staphylococcus aureus by polymerase chain reaction amplification of the nuc gene. J. Clin. Microbiol.. 1992;30:1654-1660.
- [Google Scholar]
- Use of a free radical method to evaluate antioxidant activity, LWT-Food. Sci. Technol.. 1995;28:25-30.
- [Google Scholar]
- Antimicrobial, gastroprotective and healing effect of the hydroalcoholic extract of Astronium fraxinifolium. Lett. Drug Des. Discov.. 2018;15:325-334.
- [Google Scholar]
- Developing new antimicrobial therapies: are synergistic combinations of plant extracts/compounds with conventional antibiotics the solution? Pharmacogn. Rev.. 2017;11:57.
- [Google Scholar]
- Evaluation of the bioactivity of a mastoparan peptide from wasp venom and of its analogues designed through targeted engineering. Int. J. Biol. Sci.. 2018;14:599.
- [Google Scholar]
- Chemical composition of Egyptian propolis. Zeitschrift Für Naturforsch. C.. 1998;53:197-200.
- [Google Scholar]
- Factors that influence the yield and composition of Brazilian propolis extracts. J. Braz. Chem. Soc.. 2004;15:964-970.
- [Google Scholar]
- Comparative analysis of the antibacterial activity and HPLC phytochemical screening of the Brazilian red Propolis and the resin of Dalbergia ecastaphyllum. Chem. Biodivers.. 2019;16
- [Google Scholar]
- Comparative study of antibiofilm, cytotoxic activity and chemical composition of Algerian propolis. J. Apic. Res.. 2020;59:160-169.
- [Google Scholar]
- Wound healing of nanofiber comprising Polygalacturonic/Hyaluronic acid embedded silver nanoparticles: In-vitro and in-vivo studies. Carbohydr. Polym.. 2020;238:116175.
- [Google Scholar]
- Effect of some factors on honey bee venom production from different Strains, Sinai. J. Appl. Sci.. 2017;6:59-66.
- [Google Scholar]
- Biogenically Synthesized Polysaccharides-Capped Silver Nanoparticles: Immunomodulatory and Antibacterial Potentialities Against Resistant Pseudomonas aeruginosa. Front. Bioeng. Biotechnol.. 2020;8:643.
- [Google Scholar]
- Moroccan propolis: A natural antioxidant, antibacterial, and antibiofilm against Staphylococcus aureus with no induction of resistance after continuous exposure. Evidence-Based Complement. Altern. Med.. 2018;2018
- [Google Scholar]
- Characteristics, chemical compositions and biological activities of propolis from Al-Bahah, Saudi Arabia. Sci. Rep.. 2017;7:1-13.
- [Google Scholar]
- Antimicrobial Properties of Apis mellifera’s Bee Venom. Toxins (Basel).. 2020;12:451.
- [Google Scholar]
- Antibacterial and antibiofilm effects of bee venom from (apis mellifera) on multidrug-resistant bacteria (MDRB), Al-Azhar. J. Pharm. Sci.. 2018;58:60-80.
- [Google Scholar]
- Propolis: anti-Staphylococcus aureus activity and synergism with antimicrobial drugs. Mem. Inst. Oswaldo Cruz.. 2005;100:563-566.
- [Google Scholar]
- Melittin inhibition and eradication activity for resistant polymicrobial biofilm isolated from a dairy industry after disinfection. Int. J. Microbiol.. 2019;2019
- [Google Scholar]
- The anti-staphylococcal potential of ethanolic polish propolis extracts. Molecules. 2019;24:1732.
- [Google Scholar]
- Effect of Ethanol Extracts of Propolis (EEPs) against Staphylococcal Biofilm—Microscopic Studies. Pathogens.. 2020;9:646.
- [Google Scholar]
- Staphylococcus aureus and wounds: a review of tea tree oil as a promising antimicrobial. Am. J. Infect. Control.. 2004;32:402-408.
- [Google Scholar]
- Antibacterial activity and antibiotic-enhancing effects of honeybee venom against methicillin-resistant staphylococcus aureus. Molecules. 2016;21:79.
- [Google Scholar]
- Biological effects of treatment of an animal skin wound with honeybee (Apis melifera. L) venom. J. Plast. Reconstr. Aesthetic Surg.. 2011;64:e67-e72.
- [Google Scholar]
- Propolis as an antibacterial agent against clinical isolates of mdr-acinetobacter baumannii. J. Ayub Med. Coll. Abbottabad.. 2015;27:216-219.
- [Google Scholar]
- Development of biodegradable poly (vinyl alcohol)/chitosan cross linked membranes for antibacterial wound dressing applications., Jordan. J. Biol. Sci.. 2021;14
- [Google Scholar]
- Egyptian propolis: 1-antimicrobial activity and chemical composition of Upper Egypt propolis. Zeitschrift Für Naturforsch. C.. 2001;56:82-88.
- [Google Scholar]
- Antibiotic resistance of bacterial biofilms. Int. J. Antimicrob. Agents.. 2010;35:322-332.
- [Google Scholar]
- Topical application of propolis enhances cutaneous wound healing by promoting TGF-beta/Smad-mediated collagen production in a streptozotocin-induced type I diabetic mouse model. Cell. Physiol. Biochem.. 2015;37:940-954.
- [Google Scholar]
- Use of avidin-biotin-peroxidase complex (ABC) in immunoperoxidase techniques: a comparison between ABC and unlabeled antibody (PAP) procedures. J. Histochem. Cytochem.. 1981;29:577-580.
- [Google Scholar]
- Jami, A.L.A.A., Fathi, B., Jamshidi, A., Zolfagharian, H., Zare, M.A., 2010. Investigation of the antibacterial effect of venom of the Iranian snake Echis carinatus.
- Antibacterial Activity of Venom Alkaloids from the Imported Fire Ant, Solenopsis invicta Buren1. Antimicrob. Agents Chemother.. 1972;2:291-293.
- [Google Scholar]
- Fabrication of biodegradable gelatin/chitosan/cinnamaldehyde crosslinked membranes for antibacterial wound dressing applications. Int. J. Biol. Macromol.. 2019;139:440-448.
- [Google Scholar]
- Macropis fulvipes venom component Macropin exerts its antibacterial and anti-biofilm properties by damaging the plasma membranes of drug resistant bacteria. Sci. Rep.. 2017;7:1-14.
- [Google Scholar]
- Kinetics of lipid oxidation in the presence of cinnamic acid derivatives. Eur. J. Lipid Sci. Technol.. 2002;104:19-28.
- [Google Scholar]
- Effect of Bee Venom on an Experimental Cellular Model of Alzheimer’s Disease. Am. J. Chin. Med.. 2020;1–17
- [Google Scholar]
- Antioxidant activity of propolis of various geographic origins. Food Chem.. 2004;84:329-339.
- [Google Scholar]
- Cleavage of structural proteins during the assembly of the head of bacteriophage T4. Nature. 1970;227:680-685.
- [Google Scholar]
- A functional chitosan-based hydrogel as a wound dressing and drug delivery system in the treatment of wound healing. RSC Adv.. 2018;8:7533-7549.
- [Google Scholar]
- Biological activity of bee propolis in health and disease. Asian Pac J Cancer Prev.. 2006;7:22-31.
- [Google Scholar]
- Control of wound infections using a bilayer chitosan wound dressing with sustainable antibiotic delivery. J. Biomed. Mater. Res. An Off. J. Soc. Biomater. Japanese Soc. Biomater. Aust. Soc. Biomater. Korean Soc. Biomater.. 2002;59:438-449.
- [Google Scholar]
- Antibiotic-free combinational hyaluronic acid blend nanofibers for wound healing enhancement. Int. J. Biol. Macromol.. 2021;167:1552-1563.
- [Google Scholar]
- N.C. for C.L. Standards, A.L. Barry, 1999. Methods for determining bactericidal activity of antimicrobial agents: approved guideline, National Committee for Clinical Laboratory Standards Wayne, PA.
- Seasonal variation of Brazilian red propolis: Antibacterial activity, synergistic effect and phytochemical screening. Food Chem. Toxicol.. 2017;107:572-580.
- [Google Scholar]
- Development of a chitosan-based wound dressing with improved hemostatic and antimicrobial properties. Biomaterials. 2008;29:4323-4332.
- [Google Scholar]
- Potential role of propolis in wound healing: Biological properties and therapeutic activities. Biomed. Pharmacother.. 2018;98:469-483.
- [Google Scholar]
- Enhancement of ischemic wound healing by spheroid grafting of human adipose-derived stem cells treated with low-level light irradiation. PLoS ONE. 2015;10:e0122776.
- [Google Scholar]
- Characterization of polyvinyl alcohol/gelatin blend hydrogel films for biomedical applications. J. Appl. Polym. Sci.. 2008;109:3431-3437.
- [Google Scholar]
- Thiazolidinedione and thiazole derivatives potentiate norfloxacin activity against NorA efflux pump over expression in Staphylococcus aureus 1199B strains. Bioorg. Med. Chem.. 2019;27:3797-3804.
- [Google Scholar]
- Melittin and its potential in the destruction and inhibition of the biofilm formation by Staphylococcus aureus, Escherichia coli and Pseudomonas aeruginosa isolated from bovine milk. Microb. Pathog.. 2017;112:57-62.
- [Google Scholar]
- HPLC study of chemical composition of honeybee (Apis mellifera L.) venom. J. Apic. Sci.. 2004;48:103-109.
- [Google Scholar]
- On the characterization of sodium alginate/gelatine based hydrogels for wound dressing. J. Appl. Polym. Sci.. 2012;126:E79-E88.
- [Google Scholar]
- Recent advances in electrospun nanofibers for some biomedical applications. Eur. J. Pharm. Sci.. 2020;144:105224.
- [Google Scholar]
- Chemical composition of Egyptian and UAE propolis. Pak. J. Pharm. Sci.. 2006;19:58-61.
- [Google Scholar]
- Phytochemical and antibacterial studies of Lantana camara L. leaf fraction and essential oil. Int. J. Sci. Res. Publ.. 2015;5:1-5.
- [Google Scholar]
- Comparison of commercial and Anatolian bee venom in terms of chemical composition. Uludağ Arıcılık Derg.. 2019;19:61-68.
- [Google Scholar]
- Chemical composition of honey. In: Bee Prod. Biol. Prop.. Springer; 2017. p. :43-82.
- [Google Scholar]
- Chronic wound infections: the role of Pseudomonas aeruginosa and Staphylococcus aureus. Expert Rev. Anti. Infect. Ther.. 2015;13:605-613.
- [Google Scholar]
- Fish scale collagen preparation, characterization and its application in wound healing. J. Polym. Environ.. 2020;28:166-178.
- [Google Scholar]
- Antibacterial Activity Of Bee Venom Against Multidrug Resistance Staphylococcus Aureus From Milk Of Cow And Buffaloes. Int. J. Res. Pharm. Sci.. 2020;11:2177-2182.
- [Google Scholar]
- Chemical characterization, antioxidant, anti-inflammatory and cytotoxic properties of bee venom collected in Northeast Portugal. Food Chem. Toxicol.. 2016;94:172-177.
- [Google Scholar]
- Free radical scavenging activity from different extracts of leaves of Bauhinia vahlii Wight & Arn., Saudi. J. Biol. Sci.. 2013;20:319-325.
- [Google Scholar]
- Mechanisms of antibiotic resistance in bacterial biofilms. Int. J. Med. Microbiol.. 2002;292:107-113.
- [Google Scholar]
- Antimicrobial activity of crude venom extracts in honeybees (Apis cerana, Apis dorsata, Apis florea) tested against selected pathogens, African. J. Microbiol. Res.. 2011;5:2765-2772.
- [Google Scholar]
- Szweda, P., Kot, B., 2017. Bee products and essential oils as alternative agents for treatment of infections caused by S. aureus. In: Front. Staphylococcus Aureus, IntechOpen.
- Takzaree, N., Hadjiakhondi, A., Hassanzadeh, G., Rouini, M.R., Manayi, A., 2016. Synergistic effect of honey and propolis on cutaneous wound healing in rats.
- Chitosan/hyaluronan/edaravone membranes for anti-inflammatory wound dressing: In vitro and in vivo evaluation studies. Mater. Sci. Eng. C.. 2018;90:227-235.
- [Google Scholar]
- Preparation and characterization of N-chitosan as a wound healing accelerator. Int. J. Biol. Macromol.. 2016;93:1295-1303.
- [Google Scholar]
- Purification and characterization of Heteroscorpine-1 (HS-1) toxin from Heterometrus laoticus scorpion venom. Toxicon. 2007;49:19-29.
- [Google Scholar]
- Accelerating effects of chitosan for healing at early phase of experimental open wound in dogs. Biomaterials. 1999;20:1407-1414.
- [Google Scholar]
- Topical formulations and wound healing applications of chitosan. Adv. Drug Deliv. Rev.. 2001;52:105-115.
- [Google Scholar]
- Sulforhodamine B colorimetric assay for cytotoxicity screening. Nat. Protoc.. 2006;1:1112-1116.
- [Google Scholar]
- Bee venom: Overview of main compounds and bioactivities for therapeutic interests. Molecules. 2019;24
- [CrossRef] [Google Scholar]
- Induction of keratinocyte growth factor expression is reduced and delayed during wound healing in the genetically diabetic mouse. J. Invest. Dermatol.. 1994;103:469-473.
- [Google Scholar]
- A convenient microdilution method for screening natural products against bacteria and fungi. Pharm. Biol.. 2001;39:221-225.
- [Google Scholar]
- Characterization of minocycline loaded chitosan/polyethylene glycol/glycerol blend films as antibacterial wound dressings. J. Appl. Polym. Sci.. 2021;138:50781.
- [Google Scholar]
- Bee venom (Apis Mellifera) an effective potential alternative to gentamicin for specific bacteria strains: Bee venom an effective potential for bacteria. J. Pharmacopuncture.. 2016;19:225.
- [Google Scholar]


