

Translate this page into:
Establishment and validation of a UPLC-MS/MS bioassay for the quantification of infigratinib in rat plasma
⁎Corresponding authors at: The First Affiliated Hospital of Wenzhou Medical University, 325000 Wenzhou, Zhejiang, China (R.-a. Xu, J.-p. Cai). caijp61@vip.sina.com (Jian-ping Cai), xra@wmu.edu.cn (Ren-ai Xu)
-
Received: ,
Accepted: ,
This article was originally published by Elsevier and was migrated to Scientific Scholar after the change of Publisher.
Abstract
Infigratinib (INF) is a fibroblast growth factor receptor (FGFR)-specific tyrosine kinase inhibitor for the therapy of advanced cholangiocarcinoma. However, CYP3A4 polymorphisms and CYP3A4 inducers or inhibitors might affect the pharmacokinetics of INF. Clinical evaluation of drug-drug interactions and adverse effects in these patients was necessary with reference to INF levels in vivo. The presently conducted study optimized a reproducible and rapid ultra-performance liquid chromatography tandem mass spectrometry (UPLC-MS/MS) analytic technique, which was validated and applied to determine INF concentrations in Sprague-Dawley (SD) rat plasma and pharmacokinetic studies. Protein was precipitated by adding acetonitrile to plasma samples, followed by gradient elution on a Waters Acquity UPLC BEH C18 column (2.1 mm × 50 mm, 1.7 μm) for complete chromatographic separation of the analyte and derazantinib (used as internal standard, IS). A gradient elution of 0.1% formic acid aqueous solution and acetonitrile at a flow rate of 0.30 mL/min was applied as the mobile phase for this analysis. The ion transitions of INF and IS were m/z 599.88 → 313.10 and m/z 468.96 → 382.00 during UPLC-MS/MS detection, respectively, by multiple reaction monitoring (MRM). The methodological validation demonstrated that INF presented high linearity over the concentration of 2–600 ng/mL. The lower limit of quantification (LLOQ) for this experiment was 2 ng/mL, of which the precisions and accuracies were within the permissible levels. Inter-day and intra-day precisions were demonstrated to be within reasonable limits, which were within 15%, and the accuracies were determined to be between 2.2% and 11.4%. Moreover, the values of recovery, stability and matrix effect of INF were within the limits of acceptability. The pharmacokinetics of INF in SD rats was investigated by gavage administration of 10 mg/kg INF, followed by the application of the developed UPLC-MS/MS analytical method to detect the content in plasma and derive the main pharmacokinetic parameters.
Keywords
Infigratinib
SD rat
UPLC-MS/MS
Pharmacokinetics

1 Introduction
The fibroblast growth factor receptor (FGFR) has an essential role in differentiation, cell proliferation and angiogenesis (Lassman et al., 2022). Alterations in FGFR have been demonstrated to cause unregulated growth and spread in cancers such as intrahepatic cholangiocarcinoma (IHCA) (Javle et al., 2018). Infigratinib (INF, Fig. 1A) is a FGFR-specific tyrosine kinase inhibitor. On May 8, 2021, the FDA has granted the first approval of INF for poorly pre-treated, irresectable, loco-advanced or metastatic intrahepatic cholangiocarcinoma in combination with FGFR2 fusion or other rearrangements (Kang, 2021). In addition, clinical trials currently underway are further investigating the role of INF in urothelial carcinoma (included in a phase III trial) and achondroplasia (phase II, at much smaller amount) (Therapeutics, 2021a). Like other medications, INF may cause some adverse drug reactions, such as hyperphosphatemia, retinal pigment epithelial detachment (RPED), embryo-fetal toxicity and soft tissue mineralization (Therapeutics, 2021b).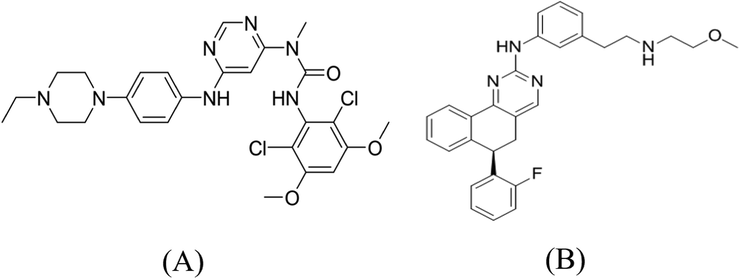
Structures of infigratinib (A) and derazantinib (IS, B) in this study.
There are several observations suggesting that CYP3A4 plays an important role in the metabolism of INF (Al-Shakliah et al., 2020; Reyes et al., 2020). Tang et al. demonstrated that INF was a potent noncompetitive reversible inhibitor and mechanism of inactivation (MOI) of CYP3A4 that may contribute to loss of enzyme activity (Tang et al., 2021). Drug-drug interactions (DDI) are often more profound since the loss of enzyme activity remains in vivo even when the inactivating agent has been systemically cleared from the body (Bjornsson et al., 2003). These effects on CYP3A4 may result in time-dependent, non-linear pharmacokinetics, auto-inhibition of hepatic clearance and eventual immune-mediated toxicity (Masubuchi and Horie, 2007).
In addition, polymorphisms of CYP3A4, CYP3A4 inducers or inhibitors might affect the pharmacokinetics of INF in vivo. Moreover, the dosage of INF is recommended to be decreased in patients with renal or hepatic insufficiency because these patients have an increased steady-state AUC of INF when taking normal doses of INF (Therapeutics, 2021b). Hence, for patients receiving multiple drug treatments or with inadequate liver or kidney function, it is worth establishing a method of analysis to monitor their plasma drug concentrations in order to achieve individualized treatment.
The process of drug metabolism in vivo includes absorption, distribution, metabolism and excretion. These procedures determine whether the drug could reach the target location at the appropriate concentration and stay there for a period of time, enabling the drug's efficacy to be achieved. Liquid chromatography-tandem mass spectrometry (LC-MS/MS) combines the high-separation performance of LC with the high-resolution characteristics of MS, significantly expending the applications in drug metabolism and pharmacokinetics. With LC-MS/MS, not only the metabolism of drugs in different matrices can be studied in vivo and in vitro (Attwa et al., 2018a; Attwa et al., 2020b; Kadi et al., 2013), but also details of molecular weight and structural fragmentations could be obtained to determine the structure of analytes (Attwa et al., 2020a; Attwa et al., 2018b).
Currently, there is only one literature reported on the characterization of the stability of INF in liver microsomes using LC-MS/MS technique (Mostafa et al., 2021). Determination of INF concentration in blank plasma by ultra-performance liquid chromatography-tandem mass spectrometry (UPLC-MS/MS) analysis and in vivo pharmacokinetic studies have not been investigated. In the conducted study, the objective was to develop and validate the reliability and rapidity of an ultra-high performance liquid chromatography-tandem mass spectrometry (UPLC-MS/MS) method to quantify the content of INF in the plasma of SD rats and to research the pharmacokinetics.
2 Experimental
2.1 Chemicals and materials
Infigratinib, derazantinib (IS, Fig. 1B) with purity > 98% as well as analytical pure formic acid were obtained from Beijing sunflower Technology Development Co., Ltd. (Beijing, China). The chromatographic grade methanol and acetonitrile used in this experiment were purchased from Merck (Darmstadt, Germany). Ultrapure water for preparation of the solutions and mobile phase was generated by Millipore (Millipore, Bedford, USA) Milli-Q purification. Sodium carboxymethyl cellulose (CMC-Na) was from Canspec Scientific Instruments Co., Ltd. (Shanghai, China).
2.2 UPLC-MS/MS analytical conditions
This experiment's UPLC-MS/MS instrument was consisted of a Waters Xevo TQ-S triple quadrupole tandem mass spectrometer connected to an electrospray ionization (ESI) source (Milford, MA, USA) operating in positive ion mode and a Waters ACQUITY UPLC I-Class system (Milford, MA, USA). By use of Masslynx 4.1 software and Quanlynx programme (Milford, Massachusetts, USA), experimental data were collected and processed.
Before running of the sequences, the column temperature was adjusted to 40 °C and the autosampler was 10 °C. Subsequently, a gradient elution of INF and IS was performed using a column of ACQUITY UPLC BEH C18 (2.1 mm × 50 mm, 1.7 μm) and mobile phase containing 0.1% formic acid aqueous solution and acetonitrile with a rate of 0.30 mL/min. The process of linear gradient elution was conducted as follows: 0–0.5 min (acetonitrile, 10%), 0.5–1.0 min (acetonitrile increase to 90%), 1.0–1.4 min (acetonitrile, 90%), and 1.4–1.5 min (acetonitrile decrease to 10%). Then, an equilibration was performed between 1.5 and 2.0 min using 10% acetonitrile. The injection volume and running time of each sample was 3.0 µL and 2.0 min, respectively.
As indicated in Table 1, identification was achieved in multiple reaction monitoring (MRM) mode with m/z 559.88 → 313.10 for INF and m/z 468.96 → 382.00 for IS. For INF and IS, the collision energy was 20 eV and 25 eV, respectively. The cone voltage of the analyte was 20 V. The optimized parameters of MS were: 2.0 kV capillary voltage, 1000 °C desolventizing temperature, 200 L/h cone gas, 0.15 mL/min collision gas and 1000 L/h desolvent gas.
Analytes
Precursor ion
Product ion
CV (V)
CE (eV)
RT (min)
Infigratinib
559.88
313.10
20
20
1.43
IS
468.96
382.00
20
25
1.55
2.3 Solution preparation
INF and IS were respectively dissolved in methanol and prepared as stock solutions of 1.00 mg/mL. The stock solutions were diluted using methanol to gain a range of concentrations for working solutions, calibration curve and quality control (QC) samples. The INF’s calibration curve contained 8 concentration points from 2 to 600 ng/mL, while the IS concentration in all these samples was 200 ng/mL. There were four levels of quality control samples (QCs) prepared, including high (HQC, 500 ng/mL), medium (MQC, 100 ng/mL), low (LQC, 6 ng/mL) and lower limit of quantitation (LLOQ, 2 ng/mL) concentrations.
2.4 Sample treatment
After preparing new centrifuge tubes, 100 µL plasma sample, 20 µL IS solution and 300 µL acetonitrile were added successively and mixed thoroughly on the vortexer for 1 min. The parameters of the centrifuge were set to 13,000g at 4 °C. After 10 mins of centrifugation, 100 µL supernatant was pipetted into a new autosampler vial with the sample volume of 3.0 µL injected into the UPLC-MS/MS system.
2.5 Methodological validation
The validation process was conducted in accordance with FDA Bioanalytical Method Validation Guidance (U.S. Department of Health and Human Services, Food and Drug Administration, Bioanalytical Method Validation Guidance for Industry, 2018 (Accessed 19 June 2020) https://www.fda.gov/media/70858/download.). Selectivity, linearity, sensitivity, accuracy, precision, matrix effect, recovery and stability were evaluated.
2.5.1 Selectivity
The selectivity of the quantification was researched by detecting three sets of chromatograms of blank plasma (without analyte), standard solution and actual rat plasma after administration, and analyzing the peak shapes and their respective retention times.
2.5.2 Sensitivity and linearity
The calibration curve was performed by using a weighted (1/x2) least squares regression model with the peak area ratios of INF to IS as the Y-axis and the nominal concentration ratios as the X-axis. Signal-to-noise ratio (S/N, 10) of the chromatograms was used for reference to derive LLOQ with reasonable accuracy (RE) within 80–120% and precision (RSD) under 20%.
2.5.3 Accuracy and precision
Methodological repeatability and reproducibility were determined by evaluating accuracies and precisions of two occasions (inter-day and intra-day), which required 3 consecutive days of measurement.
2.5.4 Matrix effect and recovery
Matrix effects (ME) were measured in two sample groups (analytes in the extracted plasma matrix and the neat solutions). Both groups were spiked at three levels (LQC, MQC and HQC) and the detections were completed in 6 repetitions at each level. The results of ME were the ratios of the response values of the two groups. The recovery of the current method was examined with comparison of the INF peak area before and after sample processing.
2.5.5 Stability
To assess the stability of plasma samples in the short and long term, QC samples were examined under different storage environments (n = 5). The conditions set for the stability studies were as follows: at −80 °C for 4 weeks, in a 10 °C autosampler for 6 h, at room temperature for 3 h and after 3 complete freeze–thaw (from −80 °C to room temperature).
2.6 Pharmacokinetic study
The validated UPLC-MS/MS method was further applied to investigate the drug concentrations in six male SD rats (weight 190 ± 10 g), housed in an environment with sufficient light, food and water for a week and dosed with INF 10 mg/kg by gavage. The entire experimental procedures for the animals strictly followed the rules and regulations for the care and use of laboratory animals reviewed and allowed by the Ethics Committee of Wenzhou Medical University (Wenzhou, China).
After fasting for 12 h prior to the experiment, all rats received orally 10 mg/kg INF formulated in a 0.5% CMC-Na aqueous solution. The time points for blood sample collection were 0, 0.33, 0.67, 1, 1.5, 2, 3, 4, 6, 8, 12, 24, and 48 h after administration, respectively, and the approximately 0.3 mL of blood sample obtained from the tail vein was stored in a heparin-containing polyethylene tube. Immediately thereafter, all plasma samples were centrifuged at 8000g for 5 min at 4 °C, and upper plasma of the centrifuge tubes was gathered into new tubes and stored at −80 °C for the next steps of the assay. INF levels in rat plasma were measured by the analytical method based on UPLC-MS/MS in this present study. Calculation and examination of accurate pharmacokinetic parameters of INF were accomplished by Drug and Statistics (DAS) 3.0 software (Professional Committee of Mathematics and Pharmacology, Shanghai, China) using non-compartmental analysis.
3 Results and discussion
3.1 UPLC–MS/MS method improvement
In this experiment, the ESI negative and positive ionization modes were evaluated with mass response of INF, and the results indicated that the positive ionization mode exhibited a higher sensitivity. INF and IS positive molecular ions [M + H]+ were m/z 559.88 and m/z 468.96 (as represented in Fig. 2) with the product ions of the greatest abundance being m/z 313.10 and 382.00, respectively. Consequently, the mother-to-daughter of quantifier conversions were m/z 559.88 → 313.10 for INF, and m/z 468.96 → 382.00 for IS, respectively.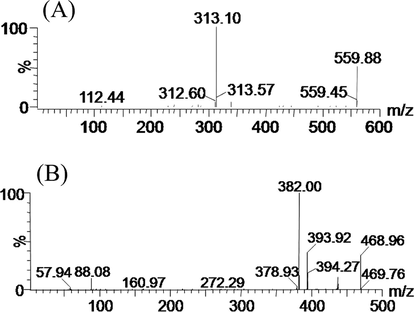
Mass spectras of infigratinib (A) and derazantinib (IS, B) in this study.
Because the presence of formic acid in the mobile phase contributed to the positive ionization of the analyte and maintained the ionized state of the analyte in the mobile phase, the final choice of mobile phase was 0.1% formic acid aqueous solution and acetonitrile after analyzing various organic phases (e.g., acetonitrile and methanol). Moreover, different ratios of 0.1% formic acid aqueous solution and acetonitrile (80:20, 75:25, 70:30, v/v) were experimented, and finally 10% acetonitrile was used as the initial ratio for gradient elution. In addition, the BEH C18 (2.1 mm × 50 mm, 1.7 μm) column was chosen as the LC column since complete and efficient separations of compounds could be obtained with good peak symmetry in short retention time.
With protein precipitation (PPT) using organic solvents, a large amount of plasma proteins that interfere with the assay could be removed in a relatively short period of time with ease of operation. With reference to previous experiences, the use of acetonitrile for protein precipitation resulted in shorter sample processing time and better recoveries compared to the other organic solvents employed (Tang et al., 2020; Xu et al., 2019). So, acetonitrile was also used to precipitate plasma proteins for the present sample processing.
3.2 Methodological validation
3.2.1 Selectivity
In Fig. 3, the INF retention time showed 1.43 min, while the IS stood at 1.55 min. The results of comparing the representative chromatograms of blank plasma from current experimental animals, blank plasma containing INF and IS working solutions as well as plasma samples from SD rats after administration showed that there weren’t any significant endogenous interferences, indicating that the analytical method exhibited favorable selectivity of INF and IS for quantification in SD rat plasma.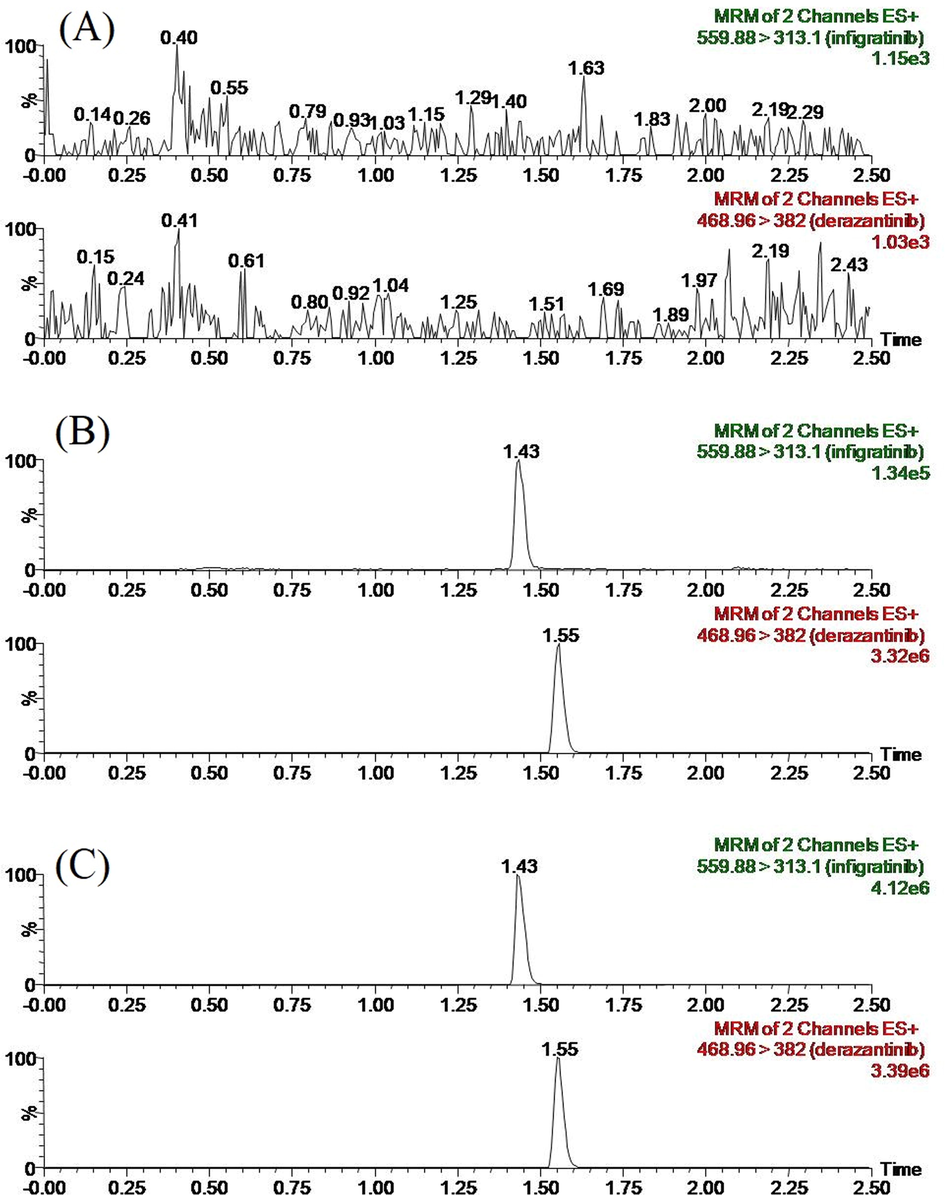
Representative chromatograms of infigratinib and IS in SD rat plasma: (A) blank plasma; (B) blank plasma spiked with standard solutions; (C) sample obtained from a rat at 1.0 h after oral administration of 10 mg/kg infigratinib.
3.2.2 Linearity and sensitivity
INF performed outstanding linearity from 2 to 600 ng/mL. With a 1/x2 weighting factor, the regression equation obtained was Y = 0.520352 × X + 0.792791 (r2 = 0.998). In this study, LLOQ was 2 ng/mL, and the accuracy at 2 ng/mL was less than 10.2%, with precision of less than 11.8%, in compliance with FDA analytical standards (as shown in Table 1).
3.2.3 Inter- and intra-day precisions and accuracies
The results were analyzed at four QC concentration levels (HQC, MQC, LQC and LLOQ) over three consecutive days to evaluate accuracies and precisions. The inter- and intra-day accuracies of INF were between 2.2% and 11.4%, with precisions of less than 11.8% (Table 2). The values suggested that the above UPLC-MS/MS method demonstrated good reproducibility in quantitating INF.
Analyte
Concentration
(ng/mL)Intra-day
Inter-day
RSD%
RE%
RSD%
RE%
2
9.7
10.2
11.8
2.2
6
7.4
8.2
8.8
9.3
infigratinib
100
6.6
10.6
8.5
11.4
500
3.0
8.4
4.0
7.4
3.2.4 Matrix effect and recoveries
In Table 3, the findings showed that the mean recoveries of INF at three QCs (LQC, MQC and HQC) ranged from 86.7 to 97.4% with matrix effect values of 106.4–112.0%, indicating no remarkable matrix effects during detection.
Analyte
Concentration
added (ng/mL)Recovery (%)
Matrix effect (%)
Mean ± SD
RSD (%)
Mean ± SD
RSD (%)
6
86.7 ± 5.7
6.6
112.0 ± 9.0
8.1
infigratinib
100
94.8 ± 4.0
4.2
111.5 ± 13.6
12.2
500
97.4 ± 4.5
4.6
106.4 ± 4.7
4.4
3.2.5 Stability
In Table 4, the results of stability were summarized. It was found that INF plasma samples were stable when placed in the autosampler at 10 °C for 6 h, at room temperature for 3 h, at −80 °C for 4 weeks and after 3 complete freezing (−80 °C)/thawing (RT) cycle tests (Table 4).
Analyte
Added (ng/mL)
Room temperature, 3 h
Autosampler 10 °C, 6 h
Three freeze–thaw
−80 °C, 4 weeks
RSD (%)
RE (%)
RSD (%)
RE (%)
RSD(%)
RE(%)
RSD(%)
RE(%)
infigratinib
6
9.8
−1.1
13.0
−2.6
9.6
5.7
6.2
14.8
100
4.6
−5.5
8.6
1.1
5.7
12.9
4.1
12.6
500
4.1
3.5
4.3
2.4
4.0
9.3
4.4
12.2
3.3 Application in a pharmacokinetic study
The validated UPLC-MS/MS analytical approach described above could be employed to effectively measure plasma concentrations in SD rats with a single orally administered dose of 10 mg/kg INF. Fig. 4 illustrated the average drug concentration–time profile of INF in SD rats. The main parameters of pharmacokinetics were calculated using DAS 3.0, as summarized in Table 5, where AUC was the area under curve, Tmax was the time to reach maximum concentration, MRT was the mean residence time, Cmax was the maximum plasma concentration, t1/2 was the elimination half-life and CL was the rate of drug clearance.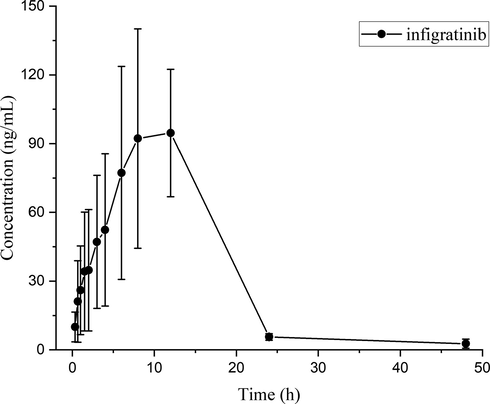
Mean plasma concentration–time curve of infigratinib in SD rats after oral administration of infigratinib at a single dose of 10 mg/kg. (n = 6).
Parameters
infigratinib
AUC0→t (ng/mL⋅h)
1511.84 ± 350.42
AUC0→∞ (ng/mL⋅h)
1542.73 ± 342.89
MRT0→t (h)
11.17 ± 1.18
MRT0→∞ (h)
12.47 ± 2.95
t1/2 (h)
7.95 ± 4.86
Tmax (h)
9.00 ± 2.45
CLz/F (L/h/kg)
6.72 ± 1.28
Cmax (ng/mL)
123.66 ± 26.01
It was observed to be rapidly absorbed by gastrointestinal administration of 10 mg/kg INF, where the Cmax was 123.66 ± 26.01 ng/mL. Moreover, Tmax and t1/2 was approximately 9.00 ± 2.45 h and 7.95 ± 4.86 h in vivo, respectively. In consideration of the limited number of animals in the current experiment (n = 6), it is promising to conduct further studies to accurately characterize the pharmacokinetic profile of INF. Although it has been reported that LC-MS/MS method was employed to detect the metabolic stability in human liver microsomes in vitro, more reagent and sample processing time were needed than current approach, and the pharmacokinetic studies weren’t performed (Mostafa et al., 2021).
4 Conclusions
In a summary, the optimized and validated UPLC-MS/MS approach was proved to be reliable with rapidity, and was firstly available to examine INF levels in plasma of SD rats. When using the optimized method, outstanding advantages could be availed, including shorter running time of individual sequence (only 2.0 min) and lower costs for sample preparation by PPT using acetonitrile (300 µL) compared with the reported method (Mostafa et al., 2021). By investigating the pharmacokinetics of 10 mg/kg INF in SD rats, the applicability of the improved UPLC-MS/MS analytical technique has been established in the current experiment. Therapeutic drug monitoring (TDM) might be necessary to achieve individualized dosing of INF for patients taking multiple drugs orally (e.g., CYP3A inducers or inhibitors) or for those with hepatic or renal insufficiency. These findings could provide a basis for further clinical studies in subsequent studies.
Acknowledgements
This work was supported by National Key Research and Development Program of China (2020YFC2008301). The authors thank Zhongqiu Lu for his advice and assistance.
Declaration of Competing Interest
The authors declare that they have no known competing financial interests or personal relationships that could have appeared to influence the work reported in this paper.
References
- U.S. Department of Health and Human Services, Food and Drug Administration, Bioanalytical Method Validation Guidance for Industry, 2018 (accessed 19 June 2020) https://www.fda.gov/media/70858/download.).
- Identification and characterization ofin silico, in vivo, in vitro, and reactive metabolites of infigratinib using LC-ITMS: bioactivation pathway elucidation andin silicotoxicity studies of its metabolites. RSC Adv.. 2020;10(28):16231-16244.
- [CrossRef] [Google Scholar]
- Investigation of metabolic degradation of new ALK inhibitor: Entrectinib by LC-MS/MS. Clin. Chim. Acta. 2018;485:298-304.
- [CrossRef] [Google Scholar]
- Detection and characterization of olmutinib reactive metabolites by LC-MS/MS: Elucidation of bioactivation pathways. J. Sep. Sci.. 2020;43(4):708-718.
- [CrossRef] [Google Scholar]
- Metabolic stability assessment of new PARP inhibitor talazoparib using validated LC-MS/MS methodology: in silico metabolic vulnerability and toxicity studies. Drug. Des. Devel. Ther.. 2020;14:783-793.
- [CrossRef] [Google Scholar]
- LC-MS/MS reveals the formation of reactive ortho-quinone and iminium intermediates in saracatinib metabolism: Phase I metabolic profiling. Clin. Chim. Acta. 2018;482:84-94.
- [CrossRef] [Google Scholar]
- The conduct of in vitro and in vivo drug-drug interaction studies: a Pharmaceutical Research and Manufacturers of America (PhRMA) perspective. Drug Metabol. Dispos.. 2003;31(7):815-832.
- [CrossRef] [Google Scholar]
- Phase II study of BGJ398 in patients with FGFR-altered advanced cholangiocarcinoma. J. Clin. Oncol.. 2018;36(3):276-282.
- [CrossRef] [Google Scholar]
- Kadi, A.A., Angawi, R.F., Attwa, M.W., Darwish, H. W., Abdelhameed, A. S. (2013). High throughput quantitative bioanalytical LC/MS/MS determination of Gemifloxacin in human urine. J. Chem., 2013, 9 pages.
- Infigratinib in patients with recurrent gliomas and FGFR alterations: a multicenter phase II study. Clin. Cancer. Res. 2022
- [CrossRef] [Google Scholar]
- Toxicological significance of mechanism-based inactivation of cytochrome p450 enzymes by drugs. Crit. Rev. Toxicol.. 2007;37(5):389-412.
- [CrossRef] [Google Scholar]
- LC-MS/MS method for the quantification of the anti-cancer agent infigratinib: Application for estimation of metabolic stability in human liver microsomes. J. Chromatogr. B Analyt. Technol. Biomed. Life Sci.. 2021;1179:122806
- [CrossRef] [Google Scholar]
- Drug interaction potential of infigratinib (Bgj398), a potent and selective Fgfr1-3 inhibitor, in healthy volunteers (Hv): pharmacokinetics (Pk) and safety. Clin. Pharm. Therap.. 2020;107:S49-S50.
- [Google Scholar]
- In vivo pharmacokinetic drug-drug interaction studies between Fedratinib and antifungal agents based on a newly developed and validated UPLC/MS-MS method. Front. Pharmacol.. 2020;11:626897
- [CrossRef] [Google Scholar]
- Infigratinib is a reversible inhibitor and mechanism-based inactivator of cytochrome P450 3A4. Drug. Metab. Dispos.. 2021;49(9):856-868.
- [CrossRef] [Google Scholar]
- Therapeutics, Q. (2021a). QED Pipeline. https://www.qedtx.com/our-product/#pipeline. Retrieved from https://www.qedtx.com/our-product/#pipeline.
- Therapeutics, Q. (2021b). TRUSELTIQ (infigratinib) capsules, for oral use: US prescribing information. Retrieved from https://www.accessdata.fda.gov.
- UPLC-MS/MS method for the simultaneous determination of imatinib, voriconazole and their metabolites concentrations in rat plasma. J. Pharm. Biomed. Anal.. 2019;166:6-12.
- [CrossRef] [Google Scholar]


