

Translate this page into:
Design and optimization of lipids extraction process based on supercritical using Dunaliella Tertiolecta microalga for biodiesel production
-
Received: ,
Accepted: ,
This article was originally published by Elsevier and was migrated to Scientific Scholar after the change of Publisher.
Peer review under responsibility of King Saud University.
Abstract
Extraction of oil with supercritical solution to produce biofuels from Dunaliella tertiolecta microalga was investigated. 8 treatments during two light periods of light and dark with different shocks of acidity, salinity and nutrients were studied individually and in pairs. As the amount of Dunaliella Tertiolecta microalga produced biomass increased (more than 2.5 after 12 day), consumption rate increased (629.97 ± 34.62 ). A more diverse fatty acid content was observed in the present study in Dunaliella Tertiolecta microalga, include: palmitic acid (C16:0), stearic acid (C18:0), erucic acid (C22:1n9), nervonic acid (C24:1n9), docosahexaenoic acid (C22:6n3) and eicosadienoic acid (C20:3n3). The measured iodine value (IV) and saponification value (SV) showed no significant differences between the experimental samples (P < 0.05). The cetane number and degree of saturation in the biofuel produced by microalga were high, therefore, the biofuel was of high quality. The amount of oil extracted in the control and optimal treatments showed that increasing the pressure has a positive effect on the extraction and the best temperature was 40 °C with a pressure of 370 .
Keywords
Supercritical
Carbon dioxide
Microalga
Biodiesel
Dunaliella Tertiolecta

1 Introduction
Scientists predict that the world will face a crisis of shortage of oil, gas and coal resources in the not-too-distant future (Andreo-Martínez et al., 2020; Tan et al., 2020). Extensive studies have been conducted today on sustainable and renewable fuels such as microalga-derived oils (Halim et al., 2012). Biodiesel is the product of a transesterification reaction between lipids and alcohol, and its required fatty acids can be obtained from a wide range of sources such as food waste, animal fats, vegetable oils, cooking oil wastes, algae and other sources (Qadeer et al., 2021).
Based on stoichiometric ratios, one mole of triglyceride or three moles of alcohol reacts, producing three moles of ester and one mole of glycerol (Koyande et al., 2019). Methanol is the most widely used alcohol because of its low cost, but other alcohols can also be used. for example ethanol, isopropanol and, ethanol. Although the use of these alcohols can improve fuel properties, they will be costly on an industrial scale and not feasible. Biodiesel can be produced from a variety of raw materials, including edible oils (soy, palm, sunflower, coconut) (Nguyen et al., 2020). But, the non-edible oils (Jatropha, Camellia, rice bran, Pongamia, Telotia) are preferred. Therefore, the supply of raw materials is one of the most important challenges in biodiesel production, which accounts for 85% of the cost of biodiesel production (Kadir et al., 2021).
Among the various sources for biodiesel production; microalga is the best option because, unlike agricultural and animal resources, they are more efficient, have a less direct effect on the human food cycle, and can be produced in large quantities in a small space (Tan et al., 2018). By providing light, nutrients,
and water, microalga can be doubly grown (Islam et al., 2017). The photosynthetic cycle of microalga is shown in Fig. 1.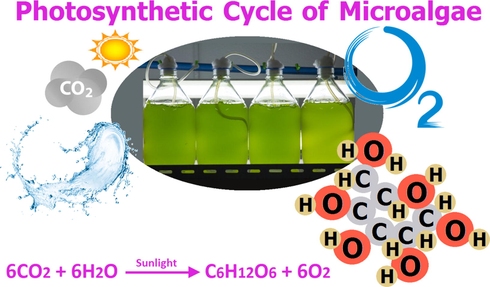
Schematic of the photosynthesis cycle of microalga.
Dunaliella Tertiolecta is a green and marine microalga. This microalga has two protozoan parts and has been widely used in ecological, industrial and agricultural studies (Iyer, 2016). In the first stage of its reproduction, this microalga requires super-saline and marine habitats, but the results of studies showed that this microalga is able to grow in a wide range of salinity (Faried et al., 2017). capture is a metabolic capability of this microalga, thus receiving and stabilizing insoluble and inorganic carbon from the environment (González-González et al., 2018). Production of glycerol, beta-carotene carotenoids, single-cell proteins and minerals in the aquatic diet are among the industrial and agricultural applications of Dunaliella Tertiolecta microalga (Santana et al., 2012). These microalga are also used in the biological recycling of heavy metals from the environment because it is able to bind heavy metals to peptides and phytochelatins, which plays an important role in detoxification from the environment and the accumulation of heavy metals (Beni and Esmaeili, 2020). Extraction of biodiesel from algae faces many problems such as high energy consumption, environmental pollution and low extraction capacity, which are the main obstacles to the production of this type of fuel on a large scale (Fazal et al., 2018). In traditional extraction methods such as pyrolysis, flammable and soluble solvents are used (Mathimani and Mallick, 2018).
Today, the production of biodiesel using alkaline homogenized catalysts is more commercializable than other methods. This reaction takes place by the addition of a nucleus of the oxide anion to the carbonyl (Leone et al., 2019). The catalysts used are sodium, potassium methoxide and hydroxide. In the alkaline catalyst process, the raw materials must be water-free to prevent hydrolysis of volatile fatty acids (Keddar et al., 2020). Volatile fatty acids are not converted to esters but to soap (Saleem et al., 2018).
In the transesterification method and acidic esterification, the transesterification can be performed in the presence of strong acid catalysts such as sulfuric acid (Liu et al., 2017; Rangabhashiyam and Selvaraju, 2015). The use of this method to produce biodiesel from frying oils and palm oil waste has been reported. Acid catalysts are slower than alkaline catalysts during the acid transesterification process. Due to the low reaction speed, it requires high temperatures and high pressure (Di Caprio et al., 2020). During acidic esterification, water is formed which causes the hydrolysis of triglycerides in small amounts (Tabernero et al., 2012). Most acidic catalysts are highly corrosive and cause contamination and turbidity of biodiesel (Vasistha et al., 2021).
One method of extracting biodiesel from microalgae is the microwave method. Reports have shown that this method is effective but requires a lot of energy (Chang et al., 2020). The biological cell breakdown method is another method of extracting biodiesel from algae that is able to increase biodiesel production (Goh et al., 2019). Nowadays, the extraction method by supercritical solution is one of the best methods for producing biofuels, because it has significant yields and by optimizing parameters such as temperature and pressure, production can be increased (Muhammad et al., 2021). This extraction method has many advantages: no toxicity, stable extraction rate, simple process and more biodiesel extraction compared to other methods (Ortiz-Martínez et al., 2019).
Various shocks can affect the production of biomass and dry microalga and change the amount of oil extracted from the algae. Also, different shock conditions can affect the composition and amount of fatty acids in algae, and as a result, this quality of biofuels is effective. In this study, the effect of changes in culture conditions (different shocks in the microalga breeding stage) was studied quantitatively and qualitatively in biofuel extraction by supercritical fluid method.
2 Experiment
2.1 Material
A sample of Dunaliella Tertiolecta was purchased from the microalga pilot plant facility of arian gostar research company (TAG BIOTEK CO), Tehran, Iran. BBM Medium 50X (Bold's Basal Medium + soil extract + vitamins) (50X), NaCl, Hcl, and NaOH was purchased from the Sigma-Aldrich. Double distillation water was used in all experiments.
2.2 Cultivation of microalga
Microalga were cultured in clear polyethylene terephthalate flasks with a volume of
. The initial density of culture cells was diluted to
at pH 8 and 21 °C in the BBM Medium (Bold's Basal Medium + soil extract + vitamins). The microalga were cultured under cold light at 3000–3500
and continuous aeration at
l for 12 days. After stabilizing the cell density, the solution containing the microalga was centrifuged at
for
. The obtained biomass (
) was suspended in
of deionized water. The solution was evenly distributed and inoculated into 32 flasks according to the instructions in Table 1, including 8 treatments.
Treatments
Instructions for creating shock
1
Creating severe alkaline conditions (pH 11)
2
Creating severe salinity conditions by increasing salt (1 M NaCl)
3
Creating nutrient deficiency conditions (Substrate reduction)
4
pH 11 + 1 M NaCl
5
pH 11 + Substrate reduction
6
1 M NaCl + Substrate reduction
7
1 M NaCl + Substrate reduction + pH 11
8
No shock (control sample)
2.3 Extraction with supercritical carbon dioxide
In this method, extraction was performed with the help of liquid carbon dioxide on dry algae, which extracts all the fat of the microalga cell (McKennedy et al., 2016). In this method, 30 g of microalga under temperature conditions of 40-80 °C, pressure of 200–370 bar, mixture of hexane: ethanol solvents (1:1), duration 60 min, carbon dioxide flow rate of 200–100
was underwent of oil extraction. According to Fig. 2 three outlet pipes was considered for oil: one for high pressure (CS1) and one for low pressure (CS2) and the third outlet for standard conditions from which other remaining fats was removed. The oil was then centrifuged and the pure oil was mixed with hexane to remove pigments and polar fats, and after passing through sodium sulfate, neutral fats were extracted, which had to be chromatographed to determine the fatty acid profile (Saranya and Ramachandra, 2020).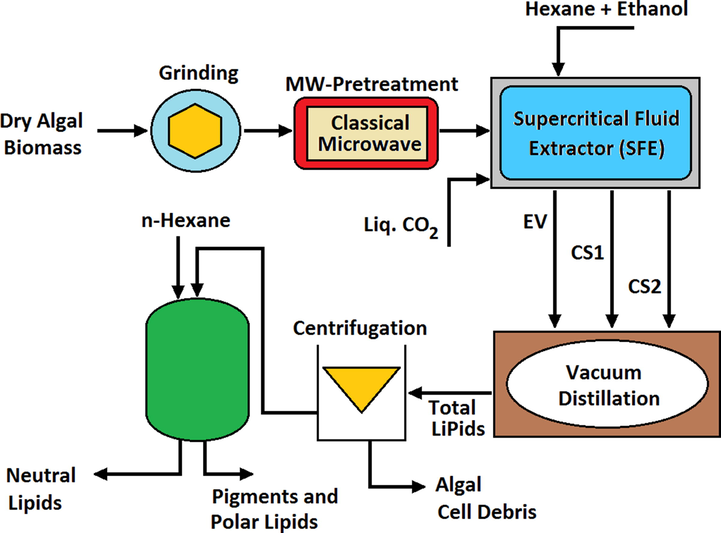
The process of extracting biodiesel fuel from microalga using supercritical
.
According to Paolo Leone et al. (Leone et al., 2019) reports, in terms of purity, the lower the pressure, the higher the purity, because the highest lipid purity was found at 75 °C and 100 bar with a flow rate of 14.48 . The literature reports that fat recovery increases with increasing temperature and pressure. But, higher temperatures can increase extraction performance, leading to higher impurity content.
2.4 Measurement of cell growth
Cell density was determined by measuring the optimal density at a wavelength of 750 nm. The optimal density was checked daily and the number of cells was counted daily. The biomass productivity (
) was calculated based on the change in biomass concentration (
) in the desired time period (
) and using Eq. (1) (Iyer, 2016):
The specific growth rate (
) was calculated based on the following equation:
and are biomass concentrations ( ) on days and , respectively.
Division time (
) and production time (
) were obtained using the following equation:
stabilization efficiency (
) was obtained by measuring the carbon dioxide index in microalga:
2.5 Chlorophyll a, b and total carotene measurements
96% methanol solvent will be used for extraction. For this purpose, a certain amount of culture medium was taken and after separating the algae from the water, 50 of solvent was added to each gram of algal sample. The solution is homogenized by mixing 1000 for one minute. The homogenized solution was filtered using Whatman paper and then centrifuged using a centrifuge at 2500 for 10 min.
The adsorption of chlorophyll a (
) will be read at 662 nm, chlorophyll b (
) at 646 nm and total carotene (
) at 470 nm. The relationships used to calculate the amount of chlorophyll a, chlorophyll b and total carotene are given below (Naito et al., 2007):
2.6 Approximate composition
2.6.1 Lipid and ash content analysis
Soxhlet method was used to measure the amount of total fat and burning the weighed samples in an electric oven at 550 °C for 6 was used for the amount of ash (Faried et al., 2017).
2.6.2 Protein content measurement
To measure the protein content, 5 of the dry sample was mixed with 2 of 24% (w/v) trichloroacetic acid, then the mixture was incubated at 95 °C for 15 min. The homogenized samples were centrifuged for 4 at 4 °C and the supernatant was separated. The resulting mass was suspended again in 0.5 of Lowry reagent and incubated for 20 , then the supernatant was placed in Lowry reagent for 30 . Finally, the wavelength was read at 600 .
2.6.3 Total carbohydrate content measurement
The prepared samples were centrifuged at 5000 at 4 °C for 30 . The supernatant was collected and 1 of each sample/standard glucose was poured into a test tube and then 1 ml of 5% phenol and 5 ml of 96% sulfuric acid were added to each tube. After 10 , the mixture was vertexed in tubes and kept at 25 °C for 20 . The absorbance was assessed at 400 nm (Leone et al., 2019; Tan et al., 2020).
2.6.4 Fatty acid profiles
200 of Dunaliella Tertiolecta was added to 1 of (2.5%) and 98% methanol mixture solution 1:40 (v/v) was poured into each sample and incubated for 1 h at 80 °C. 500 μl of hexane was mixed with 1.5 of 90% (w/v) NaCl and added to mixtures to extract fatty acid methyl ester (FAME). The prepared samples were centrifuged at 10,000 for 10 and the supernatant was collected in three replications. Samples were injected into the GC-FID apparatus to evaluate the fatty acid profile (Tobar and Núñez, 2018). FAME was analyzed using GC-FID (Shimadzu GC-2010). GC-FID was equipped with a BPXBD20 column and helium was used as the carrier gas. The initial column temperature was set at 150 °C and gradually increased to 240 °C at 15 °C rate, while the injector and FID were set at 250 °C. The injection volume was 1 with a split ratio of 10:1. Methyl heptadecanoate was used as the internal standard for quantitative analysis (Nguyen et al., 2020).
2.7 Measuring of biodiesel quality
The quality of biodiesel extracted from Dunaliella Tertiolecta oil was determined by evaluating the degree of unsaturation (DU) (Tobar and Núñez, 2018), saponification value (SV) (Keddar et al., 2020), cetane number (CN) (Islam et al., 2017) and, iodine value (IV) (Islam et al., 2017). These values were calculated by following equations:
2.8 Statistical analysis
All measurements were repeated three times and the error of values was considered in the report. All statistical analysis was performed using SPSSSPSS Statistics V.17.01 (SPSS Inc., Chicago, USA). The P-value less than 0.05 was considered as significant.
3 Results and discussion
3.1 Growth factors in Dunaliella Tertiolecta microalga
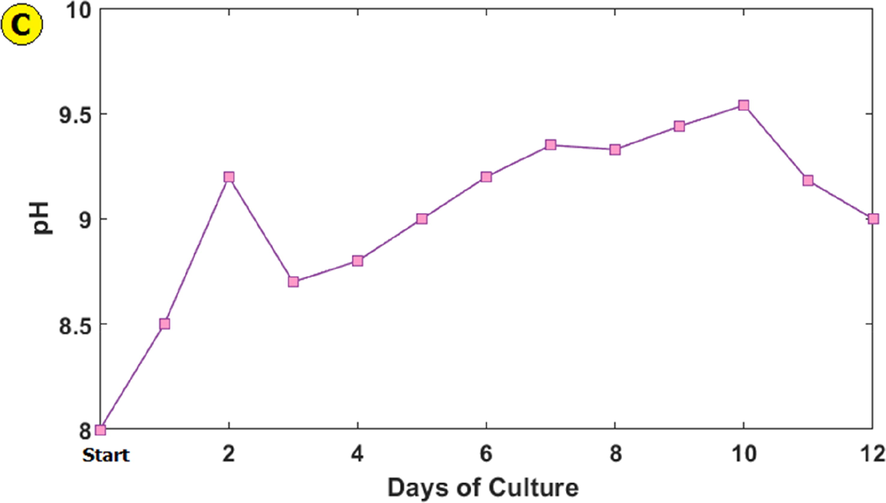
The Dunaliella Tertiolecta microalga biomass production and cell number during 12 days was shown in Fig. 3 a and b. The properties of Dunaliella Tertiolecta microalga growth were as follows: SGR = 0.17
, Biomass productivity = 0.34 ± 0.05
and,
consumption rate = 629.97 ± 34.62
. As shown in Fig. 3 c, pH changes were recorded at 12 days of growth. From the first day of microalga growth, the pH increased and at the end of day 12, the growth medium was alkaline. Also, the highest pH value was recorded on the tenth day (see Fig. 4).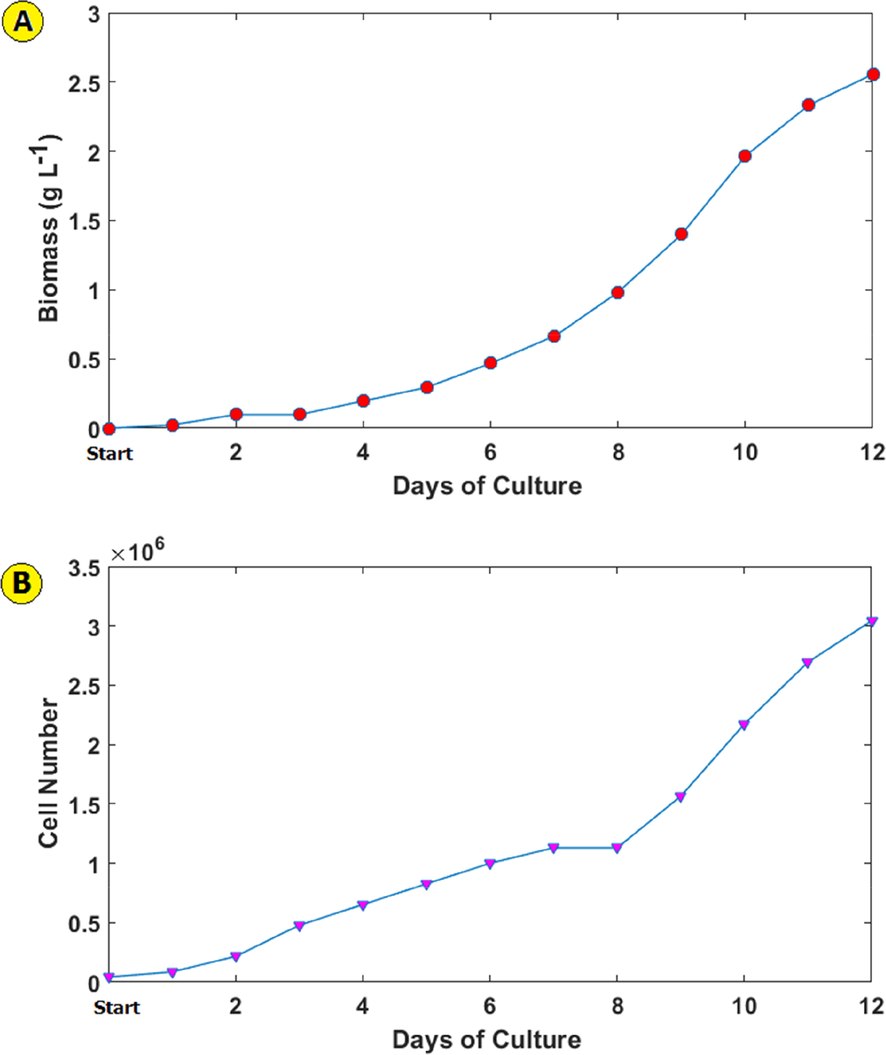
Dunaliella Tertiolecta microalga biomass produced (a), cell number (b) and, pH change (c) during 12 days of culture.
Dunaliella Tertiolecta microalga biomass produced (a), cell number (b) and, pH change (c) during 12 days of culture.
Overview of fatty acids of Dunaliella Tertiolecta microalga.
3.2 Approximate composition of Dunaliella Tertiolecta microalga
The results obtained for the microalga Dunaliella teriolecta are given in Table 2. According to the results, the amount of lipid in the dark period 7 treatment was the highest (54.83
1.02) and the lowest value was related to the light period of treatment 4 (10.93
0.97). On the other hand, lipid levels in treatments 5, 6 and 8 did not differ significantly between dark and light periods (P < 0.05). The results obtained for ash also showed the highest value in the light and dark period of treatment 4, the light period was slightly higher (9.60
0.44) and the lowest value was related to the light period of treatment 4 (16.4
0.85). Non-identical letters in each column indicate significance between treatments (P < 0.05).
Treatments
Lipid (%)
Ash (%)
Protein (%)
Carbohydrate (%)
1
Dark Time
23.18 ± 0.44d
9.00 ± 0.10b
17.02 ± 0.18ab
50.24 ± 0.47bc
Light Time
13.73 ± 0.44ab
8.08 ± 0.49b
17.07 ± 0.22ab
60.41 ± 0.38 cd
2
Dark Time
18.05 ± 0.61c
4.78 ± 0.71a
16.21 ± 0.209ab
60.0 ± 2.21 cd
Light Time
17.95 ± 0.56c
5.23 ± 1.19a
16.71 ± 0.23ab
59.64 ± 1.72c
3
Dark Time
20.08 ± 0.72d
9.24 ± 0.68b
14.07 ± 2.50a
56.5 ± 1.30c
Light Time
12.84 ± 0.41ab
9.60 ± 0.44b
20.08 ± 0.86b
57.19 ± 0.72c
4
Dark Time
22.50 ± 0.94d
7.68 ± 0.96b
12.02 ± 1.63a
57.03 ± 1.43c
Light Time
33.89 ± 0.84f
6.88 ± 0.25ab
17.39 ± 1.54ab
41.38 ± 0.02b
5
Dark Time
27.40 ± 1.18e
5.54 ± 0.20a
17.66 ± 0.45ab
49.16 ± 1.57b
Light Time
10.93 ± 0.97a
4.16 ± 0.85a
19.16 ± 1.95b
65.32 ± 3.52e
6
Dark Time
27.53 ± 1.52e
7.62 ± 0.79b
14.30 ± 0.09a
50.27 ± 0.85bc
Light Time
11.63 ± 0.44a
7.68 ± 0.94b
21.75 ± 1.90bc
58.72 ± 2.88c
7
Dark Time
54.83 ± 1.02 g
5.04 ± 0.96a
13.16 ± 1.40a
26.01 ± 1.30a
Light Time
10.21 ± 0.09a
5.14 ± 0.63a
19.11 ± 0.54b
65.45 ± 1.04e
8
Dark Time
28.88 ± 0.16e
6.75 ± 0.91ab
13.70 ± 0.77a
50.27 ± 0.14bc
Light Time
11.20 ± 0.25a
7.81 ± 0.66b
17.25 ± 0.68ab
63.38 ± 1.15d
The amount of protein in the results obtained in the light period of treatment 6 (21.75 1.90) was the highest and the lowest value in the dark period of treatment 4 (12.02 1.63) and also between the dark and light periods of the treatments. No significant differences were observed in 1, 2, 4, 5 and 8 (P < 0.05). The highest and lowest carbohydrates were observed in light (65.45 1.04) and dark (26.01 1.30) treatments, respectively, and treatments 1, 2, 3 and 6 in dark and their brightness was not significantly different from each other (P < 0.05).
3.3 Measurement of chlorophyll a, b and total carotene
The results for chlorophyll a, b and total carotene of Dunaliella teriolecta are shown in Table 3. Based on the results, it was determined that the amount of chlorophyll a had the highest value during the light period of treatments 1 (28.18
0.22), 2 (28.78
0.36) and 3 (29.74
0.19) and between there was no significant difference between the dark and light periods of treatments 4 and 5 (P < 0.05). The lowest amount of chlorophyll a was observed in the dark period of treatment 3 (2.14
0.16). The highest amount of chlorophyll b in the light period of treatments 1 (16.71
0.07), 2 (16.40
0.12) and 3 (16.87
0.21) The highest amount and dark periods of treatments 3 (143.44
0.02), 6 (2.53
0.17), 7 (2.31
0.21) and 8 (2.52
0.04) showed the lowest values. However, there was no significant difference between the dark and light periods of treatments 3, 2 and 6 (P < 0.05). Treatments 4, 5, 6, 7 and 8 did not show a significant difference in the amount of chlorophyll b (P < 0.05). Non-identical letters in each column indicate significance between treatments (P < 0.05).
Treatments
Chlorophyll a
Chlorophyll b
Total Carotene
1
Dark Time
4.68 ± 0.28b
3.76 ± 0.1.52a
322.44 ± 31.10a
Light Time
28.18 ± 0.22e
16.71 ± 0.07c
797.27 ± 30.81c
2
Dark Time
7.05 ± 0.02b
3.93 ± 0.00a
1238.59 ± 70.00f
Light Time
28.78 ± 0.36e
16.40 ± 0.12c
833.23 ± 21.88d
3
Dark Time
2.14 ± 0.16a
2.47 ± 0.143a
852.95 ± 13.00d
Light Time
29.74 ± 0.19e
16.87 ± 0.21c
906.22 ± 16.30d
4
Dark Time
4.01 ± 1.46b
3.21 ± 0.07a
1892.19 ± 31.27 g
Light Time
22.87 ± 0.21c
14.22 ± 0.02b
498.87 ± 16.72b
5
Dark Time
5.57 ± 0.01b
3.36 ± 0.01a
1111.62 ± 14.61e
Light Time
23.11 ± 0.84c
13.68 ± 0.45b
439.48 ± 106.83b
6
Dark Time
2.45 ± 0.29a
2.53 ± 0.17a
879.52 ± 21.04d
Light Time
24.19 ± 0.26 cd
14.67 ± 0.47b
482.83 ± 32.04b
7
Dark Time
2.32 ± 0.15a
2.31 ± 0.21a
872.45 ± 5.17d
Light Time
22.40 ± 0.38c
13.32 ± 0.47b
441.24 ± 28.61b
8
Dark Time
2.54 ± 0.01a
2.52 ± 0.04a
900.79 ± 44.35d
Light Time
24.87 ± 1.99 cd
14.11 ± 0.62b
439.20 ± 84.25b
Based on the results obtained for total carotene, it was found that the highest amount of carotene is present in the dark period of treatment 4 (1892.19 31.27) and the lowest amount is in the light period of treatment 1 (322.44 31.10) and between No significant differences were observed in treatments 6, 7 and 8 (P < 0.05).
3.4 Profiles of fatty acids
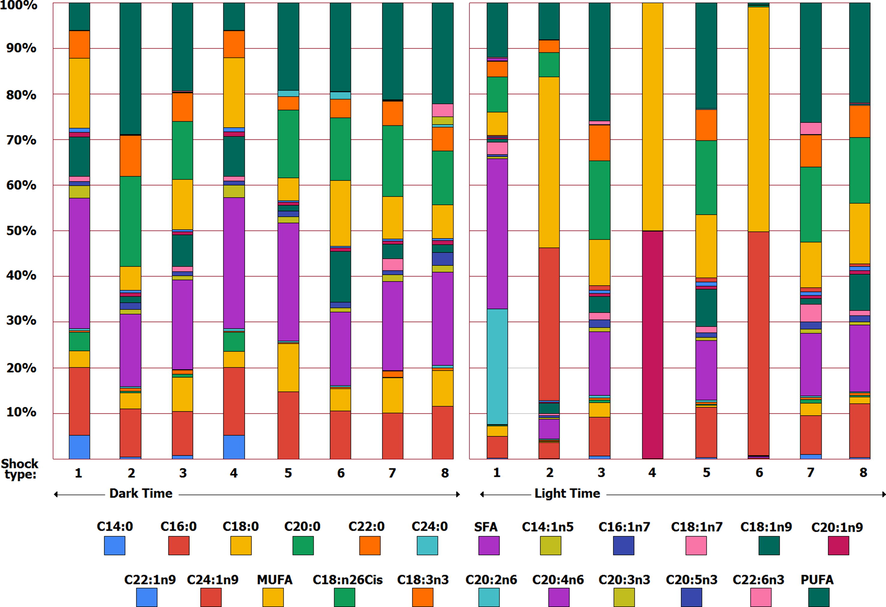
The profile results of Dunaliella teriolecta microalga fatty acids are given in Table 4. Based on the results, it was found that the amount of myristic acid (C14) in the dark period was higher than the light period and the highest and lowest values in the dark period (15.57
0.12) in the dark period of treatment 7 (0.01
0.00) was observed. The amount of palmitic acid (C16:0) had the highest value between dark and light periods in treatment 5 (25.95
0.14) and 8 (24.58
0.12) in the dark period and the lowest value in the light period. Treatment 2 (10.31
2.12) was observed. Non-identical letters in each column indicate significance between treatments (P < 0.05).
Fatty acid profiles
Time
Treatments
1
2
3
4
5
6
7
8
C14
Dark Time
9.74 ± 0.52c
8.72 ± 0.52c
ND
15.57 ± 0.12d
ND
ND
0.01 ± 0.00a
1.09 ± 0.02b
Light Time
0.50 ± 0.12a
3.59 ± 1.05c
3.53 ± 0.01c
0.51 ± 0.12a
0.39 ± 0.11a
0.79 ± 0.07a
1.46 ± 0.13b
0.87 ± 0.04a
C16:0
Dark Time
20.94 ± 1.06b
17.89 ± 1.05a
17.36 ± 0.82a
21.70 ± 0.69b
25.95 ± 0.14c
20.53 ± 0.09b
21.17 ± 0.69b
24.58 ± 0.12c
Light Time
24.19 ± 0.74c
10.31 ± 2.12a
17.28 ± 0.72b
23.96 ± 0.73c
15.88 ± 0.83b
23.82 ± 0.38c
17.54 ± 0.53b
21.29 ± 0.20c
C18:0
Dark Time
12.91 ± 0.53bc
6.70 ± 0.53a
11.91 ± 0.51bc
4.40 ± 0.28a
18.58 ± 0.10c
8.06 ± 0.04b
16.76 ± 0.55c
11.12 ± 0.09bc
Light Time
7.09 ± 0.41a
8.65 ± 0.29a
22.12 ± 0.14d
24.28 ± 0.12d
10.67 ± 0.01ab
14.12 ± 0.53bc
13.98 ± 0.21b
29.28 ± 0.09f
C20:0
Dark Time
7.73 ± 0.41c
7.71 ± 0.41c
ND
0.45 ± 0.09ab
ND
ND
0.01 ± 0.00c
0.87 ± 0.19b
Light Time
0.40 ± 0.09a
ND
0.42 ± 0.07a
0.40 ± 0.09a
0.31 ± 0.09a
0.63 ± 0.05ab
1.16 ± 0.10a
0.99 ± 0.03ab
C22:0
Dark Time
0.61 ± 0.20a
0.55 ± 0.25a
0.78 ± 0.07a
0.88 ± 0.03a
3.56 ± 0.24b
2.43 ± 0.05b
0.73 ± 0.02b
0.62 ± 0.00a
Light Time
0.40 ± 0.11a
0.26 ± 0.00a
0.91 ± 0.02a
1.09 ± 0.04b
3.76 ± 0.25c
2.12 ± 0.08c
1.33 ± 0.00b
0.90 ± 0.14a
C24:0
Dark Time
0.80 ± 0.03a
1.11 ± 0.00ab
0.81 ± 0.00a
0.37 ± 0.05a
1.17 ± 0.05b
0.67 ± 0.14a
0.24 ± 0.00a
0.27 ± 0.000a
Light Time
7.65 ± 0.05c
0.19 ± 0.00a
0.24 ± 0.00a
0.54 ± 0.16a
0.71 ± 0.04a
0.22 ± 0.00a
0.45 ± 0.02a
2.93 ± 0.05b
Stearic acid (C18:0) showed the highest value during the light period in treatment 8 (29.28 0.09) and the lowest value during the dark period in treatment 4 (4.40 0.28). In the dark period, no significant differences were observed between treatments 1, 3, 8 and also during the light period between treatments 1, 2 and 5 (P < 0.05). The amount of arachidic acid (C20: 0) was also highest in treatments 1 (7.73 0.41) and 2 (7.71 0.41) during the dark period and in treatment 7 (0.01 0.00) darkness. Showed the lowest value. During the dark period, treatments 3, 5 and 6 did not contain arachidonic acid and during the light period, treatment 2 did not contain this fatty acid. Based on the results, the amount of benic acid (C22:0) during the light period in treatment 5 (3.76 0.25) showed the highest value and in treatment 2 (0.26 0.00) showed the lowest value and between treatments 1 no significant differences were observed in 2, 3, 4 and 8 dark periods (P < 0.05). Finally, the amount of lignosic acid (C24:0) in the first treatment of light period (7.65 0.05) was the highest and the lowest value in treatment 2 (0.19 0.00) of the light period. In the dark period, except for treatment 5, no significant difference was observed between any of the treatments (P < 0.05). In general, according to these results, the amount of saturated fatty acids in Dunaliella teriolecta was higher during the dark period than during the light period.
The profile of monounsaturated fatty acids of Dunaliella teriolecta is given in Table 5. Based on the results, Myristoleic acid (C14:1n5) in the dark period had the highest value in treatments 1 (5.13
0.40) and 2 (5.14
0.41) and the lowest value in treatments 6. (1.44
0.00) and 8 (1.18
0.00) were in Drara. There was no significant difference between treatments 3, 4, 5, 6, 7 and 8 (P < 0.05). During the light period, the highest and lowest values were observed in treatments 1 (11.18
0.02) and 5 (1.01
0.02), respectively, and treatments 4 to 8 showed no significant differences (P < 0.05). Non-identical letters in each column indicate significance between treatments (P < 0.05).
Fatty acid profiles
Time
Treatments
1
2
3
4
5
6
7
8
C14:1n5
Dark Time
5.13 ± 0.40c
5.14 ± 0.41c
2.17 ± 0.07ab
1.27 ± 0.34a
2.51 ± 0.01ab
1.44 ± 0.00a
2.36 ± 0.07ab
1.18 ± 0.00a
Light Time
11.18 ± 0.02c
5.61 ± 0.00b
5.99 ± 0.01b
1.41 ± 0.04a
1.01 ± 0.02a
1.02 ± 0.01a
1.26 ± 0.0.02a
1.29 ± 0.11a
C16:1n7
Dark Time
1.81 ± 0.10a
1.81 ± 0.10a
4.40 ± 0.17c
1.95 ± 0.06a
2.17 ± 0.00ab
2.04 ± 0.00ab
1.66 ± 0.02a
1.42 ± 0.00a
Light Time
1.48 ± 0.04a
5.62 ± 0.00c
1.86 ± 0.05a
1.86 ± 0.07a
1.49 ± 0.04a
1.66 ± 0.02a
1.39 ± 0.03a
2.28 ± 0.02b
C18:1n9
Dark Time
8.07 ± 0.54d
1.97 ± 0.11a
1.67 ± 0.04a
1.92 ± 0.06a
1.67 ± 0.02a
5.70 ± 0.19c
1.68 ± 0.00a
2.02 ± 0.02ab
Light Time
ND
ND
ND
ND
ND
3.89 ± 0.13b
ND
1.66 ± 0.00a
C18:1n7
Dark Time
16.30 ± 0.33c
16.28 ± 0.33c
12.54 ± 0.90b
11.56 ± 0.42ab
9.11 ± 0.40a
11.81 ± 0.53ab
8.31 ± 0.19a
15.20 ± 0.07c
Light Time
11.94 ± 0.06b
5.64 ± 0.00a
12.54 ± 0.09b
11.66 ± 0.05b
22.22 ± 0.00d
18.64 ± 0.08c
24.79 ± 0.17d
4.72 ± 0.06a
C20:1n9
Dark Time
1.84 ± 0.40b
1.85 ± 0.41b
1.34 ± 0.15b
0.91 ± 0.15a
1.21 ± 0.01ab
1.20 ± 0.02ab
1.04 ± 0.03ab
1.14 ± 0.13ab
Light Time
1.19 ± 0.00ab
4.48 ± 0.04c
1.15 ± 0.04ab
ND
ND
0.85 ± 0.00a
ND
ND
C22:1n9
Dark Time
1.72 ± 0.02b
1.75 ± 0.00b
1.44 ± 0.05b
1.15 ± 0.28b
1.35 ± 0.06b
1.44 ± 0.05b
1.19 ± 0.19b
0.80 ± 0.00a
Light Time
ND
ND
ND
ND
ND
ND
ND
ND
C24:1n9
Dark Time
0.69 ± 0.00a
1.16 ± 0.033ab
0.76 ± 0.00a
1.35 ± 0.01b
1.29 ± 0.09ab
3.47 ± 0.05b
1.40 ± 0.01b
1.36 ± 0.16b
Light Time
ND
ND
ND
ND
ND
ND
ND
ND
Palmitoleic acid (C16: 1n7) showed the highest value in treatment 3 (4.40 0.17) and the lowest in treatment 8 (1.42 0.00) during the dark period, except for treatment 3. There were no significant differences between the treatments (P < 0.05). During the lighting period, it had the highest value in treatment 2 (5.62 0.00) and the lowest value in treatment 7 (1.39 0.03). There was no significant difference between treatments 1, 3, 4, 5, 6 and 8 (P < 0.05).
Oleic acid had the highest value during the dark period in treatment 1 (8.07 0.54) and the lowest values in treatments 3 (1.67 0.04) and 5 (1.67 02 0.02). Oleic acid levels in treatments 2, 3, 4, 5, 7 and 8 were not significantly different during the dark period (P < 0.05). During the light period, the highest value was observed in treatment 6 (3.89 0.13) and the lowest value in treatment 8 (1.66 0.00) and the rest of the treatments lacked this fatty acid. Cis-Vaccenic acid monounsaturated fatty acid (C18:1n7) had the highest value during the dark period in treatments 1 (16.30 0.33) and 2 (16.28 0.33) and in treatment 7 (8.31 0.19) had the lowest value and no significant difference was observed between treatments 3, 4, 5, 6 and 7 (P < 0.05). During the lighting period, the highest value was observed in treatment 7 (24.79 0.17) and the lowest value was observed in treatment 8 (4.72 0.06) and no significant difference was observed between treatments 1, 3 and 4 (P < 0.05).
Paullinic acid (C20:1n9) had the highest value during the dark period in treatments 1 (1.84 0.04) and 2 (1.85 0.41) and in treatment 4 (0.91 0.15) It had the lowest value. There was no significant difference between treatments 1, 2, 3, 5, 6, 7 and 8 (P < 0.05). During the light period, the highest value was observed in treatment 4 (4.48 0.04) and the lowest value was observed in treatment 6 (0.85 0.00) that the other treatments lacked this fatty acid. Erucic acid (C22:1n9) had the highest value during the dark period in treatments 1 (1.72 0.02) and 2 (1.75 0.00) and in treatment 8 (0.80 0.00) Had the lowest value. Also, no significant difference was observed between other treatments (P < 0.05). This fatty acid was not observed at all during the light period. Finally, Nervonic acid (C24:1n9) had the highest value during the dark period in treatment 6 (3.47 0.05) and in treatments 1 (0.69 0.00) and 3 (0.76 0.00) showed the lowest value and no significant difference was observed between treatments 1, 2, 3 and 5 (P < 0.05). This fatty acid was not observed at all during light shock. Finally, it can be concluded that the amount of monounsaturated fatty acids in Dunaliella tertiolecta was higher during light shock.
The profile results of Dunaliella tertiolecta polyunsaturated fatty acids are given in Table 6. According to the results, the amount of linoleic acid (C18: 2n6) during the dark period had the highest value in treatment 2 (3.60
2.23) and the lowest value in treatment 6 (1.15
1.14). Also, treatments 1, 4, 5 and 8 did not contain this fatty acid. During the light period, the highest value was observed in treatment 8 (2.86
2.15) and the lowest value was observed in treatment 1 (0.66
0.66). Also, treatments 5, 6 and 7 did not contain this fatty acid. Non-identical letters in each column indicate significance between treatments (P < 0.05).
Fatty acid profiles
Time
Treatments
1
2
3
4
5
6
7
8
C18:2n6
Dark Time
ND
3.60 ± 2.23c
0.21 ± 0.03a
ND
ND
1.15 ± 1.14b
2.39 ± 5.27bc
ND
Light Time
0.66 ± 0.66a
0.69 ± 0.68a
2.47 ± 1.12c
1.60 ± 1.59b
ND
ND
ND
2.86 ± 2.15c
C18:3n3
Dark Time
ND
ND
27.27 ± 0.80b
24.78 ± 1.16b
26.26 ± 0.13b
22.90 ± 0.10b
13.42 ± 0.97a
23.70 ± 0.14b
Light Time
22.92 ± 1.07a
21.85 ± 0.08a
20.86 ± 0.79a
21.34 ± 1.00a
27.30 ± 1.11b
22.37 ± 0.55a
25.16 ± 0.91b
20.94 ± 0.36a
C20:2n6
Dark Time
11.09 ± 0.93c
11.07 ± 0.93c
14.51 ± 0.36 cd
11.20 ± 0.52c
5.12 ±.02b
16.95 ± 0.03d
1.29 ± 0.33a
14.13 ± 0.07 cd
Light Time
10.28 ± 0.48b
0.85 ± 0.04a
10.35 ± 0.39b
10.93 ± 0.51b
15.89 ± 0.47d
9.35 ± 0.23b
10.67 ± 0.39bc
8.50 ± 0.16b
C20:3n3
Dark Time
ND
0.14 ± 0.03b
ND
0.06 ± 0.00a
ND
ND
ND
ND
Light Time
ND
1.73 ± 0.08c
ND
0.09 ± 0.00a
ND
0.18 ± 0.00ab
ND
ND
C20:3n5
Dark Time
ND
ND
2.55 ± 0.11c
ND
ND
ND
0.18 ± 0.00b
0.08 ± 0.03a
Light Time
ND
ND
0.04 ± 0.00a
ND
ND
ND
0.08 ± 0.00a
ND
Linolenic acid (C18: 3n3) had the highest value during the dark period in treatments 3 (27.27 0.80) and 5 (26.26 0.13) and in treatment 7 (13.42 0.97) Had the lowest value and no significant difference was observed between any of the treatments except treatment 7 (p < 0.05). Treatments 1 and 2 were completely free of these fatty acids. During the lighting period, the highest value was observed in treatment 5 (20.86 0.79) and the lowest value was observed in treatment 3 (27.30 1.11). Also, differences between treatments 1, 2, 3, 4, 6 and 8 were observed, no significance was observed (P < 0.05).
Eicosadienoic acid (C20: 2n6) had the highest and lowest values in treatment 6 (16.95 0.03) and treatment 7 (1.29 0.33), respectively, during the dark period. No significant differences were observed in 1, 2, 3, 4 and 8 (P < 0.05). During the lighting period, the highest value was observed in treatment 5 (15.89 0.47) and the lowest value in treatment 2 (0.85 0.04), also between treatments 1, 3, 4, 6, 7 and 8. No significant difference was observed (P < 0.05).
Eicosatrienoic acid (C20: 3n3) had the highest amount in treatment 2 (0.14 0.03) and the lowest in treatment 4 (0.06 0.00) during the dark period and between treatments 1, 3, 5, 6, 7 and 8 no significant differences were observed (P < 0.05). During the light period in treatments 2 (1.73 0.08) and 4 (0.09 0.00) had the highest and lowest values, respectively, and treatments 1, 3, 5, 7 and 8 lacked this acid. Fats were polyunsaturated.
Finally, Eicosapentanoic acid (EPA) (C20: 3n5) was not observed in treatments 1, 2, 4, 5 and 6 of the dark shock period. The highest EPA was observed in treatment 3 (2.55 0.11) and the lowest in treatment 8 (0.08 0.03) during dark shock. On the other hand, during light shock, the highest value of EPA was the highest in treatment 3 (0.04 0.00) and the lowest in treatment 7 (0.08 0.00), also in treatments 1, 2, 4, 5, 6 and 8 of this fatty acid were not observed. According to the results observed in Dunaliella tertiolecta, the amount of fatty acids in the dark shock was higher than the light shock.
3.5 Quality of fat and biofuels produced
The results obtained on the quality characteristics of fats and biofuels extracted from the microalga Dunaliella tertiolecta are given in Table 7. According to the results regarding the number of sapnification value, no significant difference was observed between different treatments during dark shock (P < 0.05), but slightly treatment 5 (31.25
1.06) was the highest and treatment 1 (62.00
30.95) had the lowest value. The number of saponification during light shock did not show a significant difference between different treatments (P < 0.05), but slightly the highest value in treatment 3 (31.95
0.85) and the lowest value in treatment 8 (95.30
1.06) was observed. The results obtained for iodine value during dark shock showed the highest value in treatment 5 (125.00
14.35) and the lowest value in treatment 2 (124.18
12.32), Also, no significant differences were observed between treatments 2, 3, 4, 6, 7 and 8 (P < 0.05). Iodine number during light shock did not show a significant difference between different treatments (P < 0.05), but slightly 1 (124.90
2.15) and 8 (123.82
11.24) treatments were the most and They had the lowest values. Non-identical letters in each column indicate significance between treatments (P < 0.05).
Time
Treatments
1
2
3
4
5
6
7
8
Saponification value
Dark Time
30.95 ± 0.62a
31.04 ± 0.35b
31.18 ± 2.01b
31.11 ± 1.02b
31.25 ± 1.06b
31.20 ± 0.35b
31.23 ± 0.14b
31.13 ± 1.02b
Light Time
31.28 ± 0.28b
31.09 ± 1.02b
31.95 ± 0.85b
31.16 ± 2.30b
31.15 ± 0.61b
31.15 ± 0.04b
31.03 ± 0.25b
30.95 ± 1.06a
Iodine value
Dark Time
123.83 ± 1.20a
124.18 ± 12.32b
124.71 ± 11.05b
124.46 ± 11.08b
125.00 ± 14.35c
124.79 ± 9.58b
124.94 ± 10.35b
124.54 ± 9.62b
Light Time
124.90 ± 2.15b
124.39 ± 21.32b
124.65 ± 10.14b
124.65 ± 13.00b
124.59 ± 9.68b
124.63 ± 10.25b
124.14 ± 10.20b
123.82 ± 11.24a
Cetane number
Dark Time
2509.40 ± 36.54d
1701.52 ± 23.65a
1786.26 ± 34.05a
1865.86 ± 26.51b
1925.50 ± 30.14c
1731.63 ± 22.02a
1969.03 ± 24.15c
1779.26 ± 24.65a
Light Time
1701.52 ± 26.51a
1952.88 ± 26.34c
1831.26 ± 12.65b
2137.92 ± 24.68 cd
1771.58 ± 16.85a
1746.60 ± 30.01a
1719.28 ± 36.52a
2713.52 ± 46.25d
Degree of unsaturation
Dark Time
57.74 ± 1.62a
97.28 ± 6.21d
113.40 ± 2.63e
92.19 ± 3.14c
82.07 ± 2.65c
109.10 ± 2.65e
78.26 ± 3.17b
99.94 ± 3.52d
Light Time
93.51 ± 2.62d
71.59 ± 2.15a
88.98 ± 1.65bc
82.85 ± 3.12b
111.10 ± 3.14f
89.86 ± 3.51bc
99.26 ± 2.58e
74.55 ± 3.51a
Cetane number had the highest value during dark shock in treatment 5 (2509.40 36.54) and the lowest value in treatment 2 (1701.52 65.23) and between treatments 2, 3, 6 And 8 no significant differences were observed (P < 0.05). During light shock, the value of cetane number in treatment 8 (2713.52 00) had the highest value and in treatment 1 (1701.52 52.26) had the lowest value and a significant difference was observed between treatments 1, 5, 6 and 8.
Degree of unsaturation was highest during dark shock in treatment 3 (113.40 2.63) and lowest in treatment 1 (57.74 1.62) and between treatments 2 and 8. No significant difference was observed (P < 0.05). During light shock, the degree of unsaturation was the highest in treatment 5 (111.10 3.14) and the lowest in treatment 2 (71.59 2.15). Also, no significant difference was observed between treatments 3, 4 and 6 (P < 0.05).
3.6 Effect of pressure and temperature on extracted oil by supercritical fluid method
According to Table 8, the amount of fatty acids extracted from Dunaliella tertiolecta microalga using supercritical
solution under different temperatures and pressures showed the best results in the optimal treatment at 370
and 40 °C, as well as the weakest and lowest amount of fat and fuel under A pressure of 200
and a temperature of 80 °C were obtained. Andrich et al. (Andrich et al., 2005) use of Nannochloropsis sp. with extraction pressure of 400 bar, 40 °C and,
flow rate 0.17
, their results showed: at constant temperature, lipid extraction rate increased with pressure; at constant pressure, lipid extraction rate slightly increased with temperature, final total lipid yield was the same at any temperature and pressure (25
of dried microalgal biomass). A comparison of the results of using different microalga is presented in Table 9.
Fatty Acid (w/w %)
Control
Optimal treatment
200 bar
40 °C285 bar
40 °C370 bar
40 °C200 bar
80 °C285 bar
80 °C370 bar
80 °C200 bar
40 °C285 bar
40 °C370 bar
40 °C200 bar
80 °C285 bar
80 °C370 bar
80 °C
C12:0
Lauric acid1.56
1.70
2.17
0.93
1.21
1.38
3.15
3.29
3.76
2.52
2.81
2.98
C14:0
Myristic acid3.32
3.42
3.59
2.23
2.27
2.60
4.92
5.01
5.18
3.82
3.86
4.20
C16:0
Palmitic acid26.99
27.39
28.51
25.12
26.01
26.51
28.59
28.99
30.10
26.71
27.60
28.11
C18:0
Stearic acid28.11
29.24
30.73
24.83
25.37
27.32
29.70
30.84
32.32
26.42
26.97
28.91
C20:0
Arachidic acid1.00
1.27
1.60
0.14
0.37
0.45
2.59
2.86
3.19
1.74
1.97
2.04
C16:1n7
Palmitoleic acid0.88
1.20
1.49
0.37
0.63
1.18
2.47
2.79
3.09
1.97
2.22
2.77
C18:1n9Oleic acid
(Trance)1.30
1.61
2.02
0.68
0.75
1.13
2.90
3.21
3.61
2.28
2.35
2.72
C18:2n6Linoleic acid
(LA)0.22
0.45
0.61
0.10
0.15
0.17
1.82
2.04
2.20
1.69
1.74
1.77
C20:5n3
Eicosapentaenoic acid (EPA)2.28
2.44
2.66
1.70
1.81
1.90
3.87
4.04
4.25
3.30
3.40
3.50
C22:6n3Docosahexaenoic acid
(DHA)0.46
0.55
0.85
0.12
0.19
0.26
2.05
2.15
2.44
1.72
1.79
1.85
Microalgal species
P (bar)
T (°C)
flow rate; extraction duration (
)
Polar modifier; quantity of polar modifier
Results
Final total lipid yield (
)
Spirulina platensis
316
40
0.71
; 60
Ethanol; 9.64, 11, 13, 15, 16.36 ml
Total lipid yield increased with P. Optimum condition was found at 400 bar, 60 min, and 13.7 ml ethanol.
8.6
Spirulina maxima
250
50
–
Ethanol; 10 mol% of
At constant T, total lipid yield increased with P.At constant P, total lipid yield decreased with
T.At
constant T and P, polar modifier addition significantly increased total lipid yield.
Optimum condition was found at 350 bar, 60 °C with ethanol addition (10 mol%).3.1
Hypnea charoides
310
50
1
; 120
–
At constant T, total lipid yield increased with P.At low P
(241 bar), total lipid yield decreased with T.At medium to high P
(310 and 379 bar), total lipid yield increased with T.
Optimum condition was found at 379 bar and 50 °C.6.7
Chlorella vulgaris
350
55
0.4
; 500
–
At constant T, total lipid yield increased with P.At low P
(200 bar), total lipid yield decreased with T.At high P
(350 bar), total lipid yield increased with T.
Optimum condition was found at 350 bar and 55 °C.13
4 Conclusion
Based on the results obtained on growth indices, it was found that with increasing the amount of SGR and consumption rate, the amount of biomass production in Dunaliella Tertiolecta microalga increased so that the number of production cells also increased. The pH value also increased during the breeding period and decreased in the last days of breeding. According to the results obtained for approximate compounds, the lipid content was higher in nutrient-free treatments and the results were the opposite for protein. Based on the results obtained for chlorophyll a, b and carotenoids, it was also found that the higher the growth of algae, the higher their amount. The results related to fatty acids also showed that the amount of saturated and monounsaturated fatty acids in microalga was higher and more diverse than PUFAs. According to the results obtained in terms of quality characteristics, the produced fuel has high cetane number and low saturation degree, also provided good combustion quality and oxidative stability.
Declaration of Competing Interest
The authors declare that they have no known competing financial interests or personal relationships that could have appeared to influence the work reported in this paper.
References
- Andreo-Martínez, P., Ortiz-Martínez, V.M., García-Martínez, N., de los Ríos, A.P., Hernández-Fernández, F.J., Quesada-Medina, J., 2020. Production of biodiesel under supercritical conditions: State of the art and bibliometric analysis. Appl. Energy 264, 114753. https://doi.org/10.1016/j.apenergy.2020.114753.
- Supercritical fluid extraction of bioactive lipids from the microalga Nannochloropsis sp. Eur. J. Lipid Sci. Technol.. 2005;107:381-386.
- [CrossRef] [Google Scholar]
- Environmental Technology & Innovation Biosorption, an efficient method for removing heavy metals from industrial effluents : A Review. Environ. Technol. Innov.. 2020;17:100503
- [CrossRef] [Google Scholar]
- In situ catalyst-free biodiesel production from partially wet microalgae treated with mixed methanol and castor oil containing pressurized CO2. J. Supercrit. Fluids. 2020;157:104702
- [CrossRef] [Google Scholar]
- Sequential extraction of lutein and β-carotene from wet microalgal biomass. J. Chem. Technol. Biotechnol.. 2020;95:3024-3033.
- [CrossRef] [Google Scholar]
- Biodiesel production from microalgae: Processes, technologies and recent advancements. Renew. Sustain. Energy Rev.. 2017;79:893-913.
- [CrossRef] [Google Scholar]
- Bioremediation of textile wastewater and successive biodiesel production using microalgae. Renew. Sustain. Energy Rev.. 2018;82:3107-3126.
- [CrossRef] [Google Scholar]
- Sustainability of direct biodiesel synthesis from microalgae biomass: A critical review. Renew. Sustain. Energy Rev.. 2019;107:59-74.
- [CrossRef] [Google Scholar]
- Integrated biodiesel and biogas production from microalgae: Towards a sustainable closed loop through nutrient recycling. Renew. Sustain. Energy Rev.. 2018;82:1137-1148.
- [CrossRef] [Google Scholar]
- Extraction of oil from microalgae for biodiesel production: A review. Biotechnol. Adv.. 2012;30:709-732.
- [CrossRef] [Google Scholar]
- Microalgae biodiesel: Current status and future needs for engine performance and emissions. Renew. Sustain. Energy Rev.. 2017;79:1160-1170.
- [CrossRef] [Google Scholar]
- The issue of reducing or removing phospholipids from total lipids of a microalgae and an oleaginous fungus for preparing biodiesel. Biofuels. 2016;7:55-72.
- [CrossRef] [Google Scholar]
- Simultaneous harvesting and cell disruption of microalgae using ozone bubbles: optimization and characterization study for biodiesel production. Front. Chem. Sci. Eng.. 2021;15:1257-1268.
- [CrossRef] [Google Scholar]
- Efficient extraction of hydrophilic and lipophilic antioxidants from microalgae with supramolecular solvents. Sep. Purif. Technol.. 2020;251:117327
- [CrossRef] [Google Scholar]
- Optimization of protein extraction from Chlorella Vulgaris via novel sugaring-out assisted liquid biphasic electric flotation system. Eng. Life Sci.. 2019;19:968-977.
- [CrossRef] [Google Scholar]
- Leone, G.P., Balducchi, R., Mehariya, S., Martino, M., Larocca, V., Sanzo, G. Di, Iovine, A., Casella, P., Marino, T., Karatza, D., Chianese, S., Musmarra, D., Molino, A., 2019. Selective extraction of ω-3 fatty acids from nannochloropsis sp. using supercritical CO2 Extraction. Molecules 24. https://doi.org/10.3390/molecules24132406.
- Liu, W. ping, Yin, X. fei, 2017. Recovery of copper from copper slag using a microbial fuel cell and characterization of its electrogenesis. Int. J. Miner. Metall. Mater. 24, 621–626. https://doi.org/10.1007/s12613-017-1444-z.
- A comprehensive review on harvesting of microalgae for biodiesel - Key challenges and future directions. Renew. Sustain. Energy Rev.. 2018;91:1103-1120.
- [CrossRef] [Google Scholar]
- Supercritical carbon dioxide treatment of the microalgae Nannochloropsis oculata for the production of fatty acid methyl esters. J. Supercrit. Fluids. 2016;116:264-270.
- [CrossRef] [Google Scholar]
- Modern developmental aspects in the field of economical harvesting and biodiesel production from microalgae biomass. Renew. Sustain. Energy Rev.. 2021;135:110209
- [CrossRef] [Google Scholar]
- Spectrophotometric determination of insuline by ternary complex formation with o-carboxyphenylfluorone-copper(II) complex. Bunseki Kagaku. 2007;56:781-784.
- [CrossRef] [Google Scholar]
- High biodiesel yield from wet microalgae paste via in-situ transesterification: Effect of reaction parameters towards the selectivity of fatty acid esters. Fuel. 2020;272:117718
- [CrossRef] [Google Scholar]
- Ortiz-Martínez, V.M., Andreo-Martínez, P., García-Martínez, N., Pérez de los Ríos, A., Hernández-Fernández, F.J., Quesada-Medina, J., 2019. Approach to biodiesel production from microalgae under supercritical conditions by the PRISMA method. Fuel Process. Technol. 191, 211–222. https://doi.org/10.1016/j.fuproc.2019.03.031.
- Review of biodiesel synthesis technologies, current trends, yield influencing factors and economical analysis of supercritical process. J. Clean. Prod.. 2021;309:127388
- [CrossRef] [Google Scholar]
- Efficacy of unmodified and chemically modified Swietenia mahagoni shells for the removal of hexavalent chromium from simulated wastewater. J. Mol. Liq.. 2015;209:487-497.
- [CrossRef] [Google Scholar]
- Biological hydrogen production via dark fermentation by using a side-stream dynamic membrane bioreactor: Effect of substrate concentration. Chem. Eng. J.. 2018;349:719-727.
- [CrossRef] [Google Scholar]
- Supercritical carbon dioxide extraction of algal lipids for the biodiesel production. Procedia Eng.. 2012;42:1755-1761.
- [CrossRef] [Google Scholar]
- Life cycle assessment of biodiesel from estuarine microalgae. Energy Convers. Manage.. 2020;X 8:100065
- [CrossRef] [Google Scholar]
- Evaluating the industrial potential of biodiesel from a microalgae heterotrophic culture: Scale-up and economics. Biochem. Eng. J.. 2012;63:104-115.
- [CrossRef] [Google Scholar]
- A review on microalgae cultivation and harvesting, and their biomass extraction processing using ionic liquids. Bioengineered. 2020;11:116-129.
- [CrossRef] [Google Scholar]
- Cultivation of microalgae for biodiesel production: A review on upstream and downstream processing. Chinese J. Chem. Eng.. 2018;26:17-30.
- [CrossRef] [Google Scholar]
- Supercritical transesterification of microalgae triglycerides for biodiesel production: Effect of alcohol type and co-solvent. J. Supercrit. Fluids. 2018;137:50-56.
- [CrossRef] [Google Scholar]
- Current advances in microalgae harvesting and lipid extraction processes for improved biodiesel production: A review. Renew. Sustain. Energy Rev.. 2021;137:110498
- [CrossRef] [Google Scholar]


