

Translate this page into:
Theoretical investigation of anthanthrene-based dyes in dye‐sensitized solar cell applications: Effect of nature of alkyl-substitutions and number of anchoring groups
-
Received: ,
Accepted: ,
This article was originally published by Elsevier and was migrated to Scientific Scholar after the change of Publisher.
Peer review under responsibility of King Saud University.
Abstract
In dye-sensitized solar cells (DSSCs), the dye material plays a crucial role in determining the amount of electrical current obtained, which is the primary outcome of the cell. Therefore, it is crucial to explain the performance of a dye at a molecular level. This work investigates using density functional theory and time-dependent density (DFT and TD-DFT, respectively) four experimentally tested anthanthrene-based dyes abbreviated as D1 to D4. The four dyes differ in their alkyl-substitutions (nonane or 3-ethylheptane) and the number of anchoring groups (one/two cyanoacrylic acid/s). To study the effect of these two structural features, the work involves the calculations of the geometrical structures, electronic and optical properties of isolated forms. In addition, the adsorption behaviour of these dyes on TiO2 clusters was explained. Properties such as the adsorption energies, and electro-optical properties were calculated and discussed.
Keywords
Anthanthrene-based dyes
Alkyl substituents
Anchoring groups
DFT calculations
Optoelectronic properties
Correlation study

1 Introduction
Nowadays, and due to the energy demand, it can be said that one of the most promising photovoltaic (PV) devices is the low-cost materials and processing, the dye-sensitized solar cells (DSSCs). In the DSSC device, the electrical current is produced without changing the chemical composition of its components. Thus, it is a conventional photo-electrochemical cell (Carella et al., 2018; Hagfeldt et al., 2010; Hamann et al., 2008). From the classical current–voltage (CV) relationship under solar light irradiation, the efficacy of a DSSC (power conversion efficiency (
)) can be related to some electrical parameters included: the short-circuit photocurrent density (
), the open-circuit voltage (
), the fill factor (FF), and the intensity of the incident light (
. The first three parameters constitute the maximum output power (
from the cell, and the ratio between
and
gives the value of
according to Eq. (1) as follows:
is the photocurrent density determined in short circuit conditions; it is related to the electron injection, which in turn depends quantitatively and qualitatively on the absorption properties of the photosensitizer and a favourable alignment of the sensitizer LUMO level with the semiconductor conduction band (CB) (Carella et al., 2018).
represents the open-circuit voltage and depends on the energy difference between the Fermi potential (under irradiation) of the semiconductor and the Nernst potential of the redox couple (Carella et al., 2018). The FF is given by Eq. (2) as follows:
Among the five components of the DSSC device (TiO2/ZnO photoanode (Rouhani et al., 2022; Kouhestanian et al., 2021), the electrolyte (Xie et al., 2016, 2015), the counter electrode (cathode), and the dye (photosensitizer)), the photosensitizer represents the most important component of a DSSC. The main role of the photosensitizer is to adsorb light and inject the photoexcited electrons into the conduction band (CB) of the semiconductor. Photosensitizers can be a Ruthenium-based (He et al., 2015; Aksakal et al., 2018), porphyrins-based (Al Mogren et al., 2020), or metal-free (MF) photosensitizer (Xia et al., 2015; Wang et al., 2014).
The typical configuration of an organic sensitizer is the push–pull structure, i.e., the D-π-A configuration, where a π-conjugated bridge linked an electron donor (D) group to an electron acceptor (A). Typically, the electron acceptor connects the dye to the semiconductor surface, acting as the anchoring group. In this type of configuration, the separation of photoexcited charges is enhanced. Since the electronic density will transfer from the donor side of the molecule (where the highest occupied orbital (HOMO) is primarily delocalized) to the acceptor side (where the lowest unoccupied orbital (LUMO) is primarily delocalized), and therefore ease the favourable process of electron injection to the CB of the semiconductor (TiO2). Simultaneously, blocking the unfavourable process of charge recombination between TiO2 and photo-oxidized molecule. The development of the most effective π-linkers, electron donors, and electron-withdrawing anchoring units was the topic of interest of materials scientists. Anthanthrene (naphtho[7,8,1,2,3-nopqr]tetraphene) is a polycyclic aromatic hydrocarbon. In literature, anthanthrene-based dyes are rarely investigated experimentally and theoretically (Geng et al., 2015; Giguère et al., 2013). Theoretical investigations have been used widely to interpret and predict the behavior of existing and designed anthanthrene-based photosensitizers at a molecular level. Lu et al. (2018) investigated theoretically a series of pyridinium ylide based anchors for DSSC application. The geometrical structures, electronic and optical properties of the isolated dyes and their interface with TiO2 were analyzed. The results showed the potential of novel pyridinium ylide-based anchors compared to the traditional carboxylic acid and rhodanime-3-acetic based anchors. The pyridinium ylide based anchors increased the light-harvesting efficiencies (LHEs) and improved intramolecular charge transfer (ICT) character as well as shifted up the conduction band edge of the TiO2 semiconductor, which benefits the increase in and values. Wazzan and Irfan (2018), using DFT and TDDFT calculations, explained the noticeable difference in the power conversion efficiencies (PCEs) of three existed triphenylamine-based organic dyes with mono-, di-, and tri-cyanoacrylic acid units as anchoring groups, and thiophene unit as π-bridges used as potential dyes in DSSC applications. Their results revealed that the increasing anchoring groups had a significant influence on the PCE of the cells. The dye with the maximum number of anchoring groups (TPA3T3A) has the smallest electron injection energy barrier, which showed that electron injection in this compound was superior. In addition, the results revealed that the TPA3T3A@TiO2 cluster was the most stable adsorption complex especially anchoring of TPA3T3A sensitizer at TiO2 cluster from B-side. Intramolecular charge transfer from occupied to unoccupied molecular orbitals has been shown and a red shift in the absorption spectra has been identified by increasing the number of anchoring groups. Saranya et al. (2018) used DFT calculations to study the co-adsorption of the 4-(7-(10-[bis(4-hydroxy-phenyl)-amino]-anthracen-9ylethynyl)-2-octyl-2H-benzotriazol-4-yl)-benzoic acid abbreviated as TY6 dye and the chenodeoxycholic acid abbreviated as CDCA on the anatase TiO2(0 0 1) surface for efficient DSSC. Their results show that the CDCA co-adsorbent plays an active role not only in stabilizing the dye/oxide system but also in preventing the surface tensile stress induced by the dye monolayer. The co-adsorbent increases the spacing between the dyes to reduce the surface tensile stress and thus prevents the decrease in the charge injection efficiency. Liu et al. (2020) investigated four anthracene-based dyes with DFT and TDDFT for DSSCs. The stable molecular geometries, electronic structures, absorption and fluorescence spectra, and the performance of photoelectric properties were calculated and analyzed. The relationship between structure and performance are established. Additionally, they designed six dyes based on of one of the investigated dyes to improve optical response and electron injection.
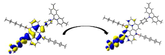
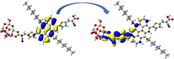
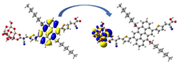
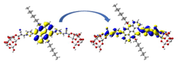
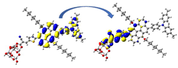
Anthanthrene-based photosensitizers in DSSCs has been investigated experimentally by the group (Geng et al., 2015). Four symmetric and asymmetric structural photosensitizers have been prepared so that the anthanthrene unit acted as a π-conjugated linker, and triphenylamine acted as a donor group. One or two cyanoacrylic acid group/s acted as an anchoring group -linked to a thiophene unit at the 6,12-positions or the 4,10-positions and substituted with nonane or 3-ethylheptane alkyl chain- to the anthanthrene core. They studied the effect of the number of the cyanoacrylic acid anchoring groups and the nature of on the overall performance of the resultant fabricated solar cells. The chemical structures of the four synthesized dyes by the group of Geng et al. (2015) are shown in Fig. 1. The four dyes have the following abbreviations and IUPAC names: D1, (2E,2′E)-3,3′-((6,12-bis(octyloxy)naphtho[7,8,1,2,3-nopqr]tetraphene-4,10-diyl)bis(thiophene-5,2 diyl))bis(2-(hydroperoxymethyl)acrylonitrile); D2, E)-2-cyano-3-(5-(10-(4-(di-p-tolylamino)phenyl)-6,12-bis(octyloxy)naphtho[7,8,1,2,3-nopqr]tetraphen-4-yl)thiophen-2-yl)acrylic acid; D3, (E)-3-(5-(12-(4-((E)-2-carboxy-2-cyanovinyl)thiophen-2-yl)-4,10-bis(4-((2-ethylhexyl)oxy)phenyl)naphtho[7,8,1,2,3-nopqr]tetraphen-6-yl)thiophen-2-yl)-2-cyanoacrylic acid; D4, (E)-2-cyano-3-(5-(12-(4-(di-p-tolylamino)phenyl)-4,10-bis(4-((2-ethylhexyl)oxy)phenyl)naphtho[7,8,1,2,3-nopqr]tetraphen-6-yl)thiophen-2-yl)acrylic acid. The main findings in Geng et al. (2015) related to the photovoltaic properties of DSSCs based on D1 to D4 dyes are summarized in Table 1. From Table 1, D4 based DSSC devices showed the largest
while D2 based devices displayed the largest
, compensate for the top overall efficiency of 5.27%. Since the work of Geng et al. (2015) has a brief theoretical explanation combined the experimental study, and thus lacking the interpretation of results at more a molecular level. In this work, we aim at investigating with much detailed and systematic DFT calculations the obtained results, giving interpretations from a molecular level insight, and correlating very well between the number of anchoring groups and nature of substitution with the photovoltaic parameters of this series of anthanthrene-based dyes (D1–D4). For the isolated dye configurations, the optimized geometries, electronic, absorption and emission properties, reorganization energies, some important quantum chemical descriptors and other parameters will be calculated and analyzed. In addition, the adsorption energies, electro and optical properties of eight dye@TiO2 adsorbed systems (representing all possible attachments of dyes to TiO2 clusters) will be calculated and analyzed. Our quantum chemical analysis explored a structure–property relationship for these four dyes at a molecular level which help in more understanding of the behavior of such type of photosensitizers and thus can enhance the solar cell efficiency.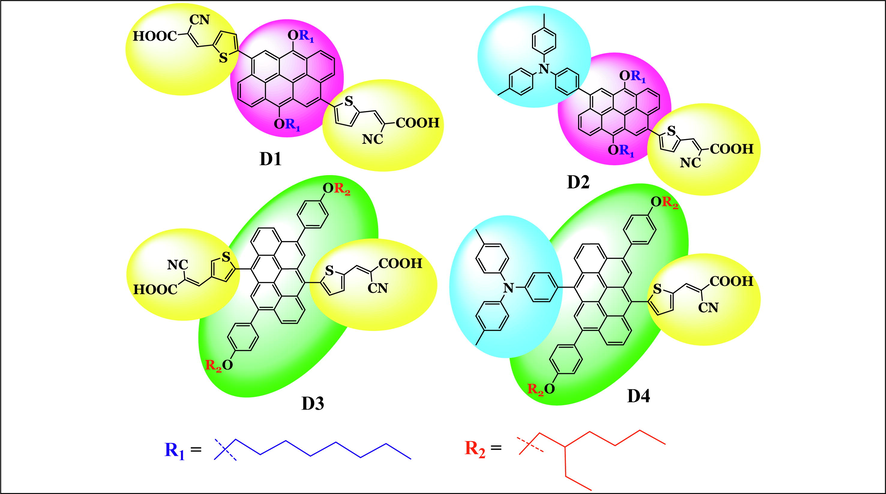
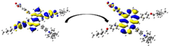
Chemical structures of the four investigated dyes (D1 to D4) taken from Geng et al. (2015) where they were tested experimentally as photosensitizers in DSSCs.
Dye
/eV
/eV
/mA.cm−2
/mV
/%
D1
−5.29
−2.91
2.38
8.18
606
0.75
3.73
D2
−5.06
−2.50
2.56
10.40
690
0.73
5.27
D3
−5.30
−2.86
2.44
6.54
658
0.76
3.28
D4
−5.10
−2.61
2.49
8.19
738
0.76
4.58
2 Method
The chemical structures of the four synthesized dyes by the group of Geng et al. (2015) are shown in Fig. 1, and the photovoltaic properties of DSSCs based on D1 to D4 dyes are summarized in Table 1. The equilibrium geometries of this series of anthanthrene-based dyes were fully optimized at a DFT level of theory with the standard 6-31+G(d,p) basis set (Ditchfield et al., 1971; Clark et al., 1983). The 6-31+G(d,p) basis set can be considered a large enough basis set. The single “+” indicates that a set of diffuse s-functions and a set of diffuse p-functions has been added to each heavy atom. The inclusion of the diffuse basis function is essential for describing the electrons of anion forms of the investigated dyes. While the notation (d,p) indicates, a set of polarizing d-functions is included on heavy atoms and a set of p-functions on hydrogen atoms. The DFT calculations were carried out with one of the hybrid functionals from the Truhlar group, M06-2X (Zhao and Truhlar, 2008). The geometries of the investigated dyes in their complexation forms with TiO2 were fully optimized without any structural constraints with 6-31+G(d,p) for C, N, O, S, and H, and with Los Alamos National Laboratory with double zeta (DZ) quality and the overall combination of ECP and valence basis set (LANL2DZ) and effective core potentials (or pseudopotentials) basis set for Ti atoms (Hay and Wadt, 1985). For all optimized geometries, vibrational frequencies were calculated to confirm that the geometries correspond to minima on the potential energy surface with only real frequencies. The non-Coulomb part of exchange functionals typically dies off too rapidly. As a result, it becomes widely inaccurate at large distances, making them unsuitable for modeling processes such as electron excitations to high orbitals. Therefore, the absorption (for twelve excited states) and emission (for three excited states) transitions were calculated from the optimized geometry in the ground state by TDDFT with one of the long-range-corrected functionals CAM-B3LYP (Yanai et al., 2004), with the 6-31+G(d,p) basis set. CAM-B3LYP is a functional of Handy and coworkers, and it is a long-range-corrected version of B3LYP using the Coulomb-attenuating method. All calculations were performed on Gaussian 09 suite program (Frisch, 2009). Molecular visualizations were performed using GaussView program (version 5.0.8) (Roy Dennington, 2009) and Chemcraft program version 1.8 (build 489) (Zhurko and Zhurko, 2009).
3 Results and discussion
3.1 Degree of planarity
The degree of planarity of the dye molecule has a key role in determining the extent of its intramolecular charge transfer properties. On the other hand, the nonplanarity of the triphenylamine (TPA) unit is beneficial to prevent the dye aggregation process. Therefore, the dihedral angle (DA) between the TPA unit and the anthanthrene core (DA1) of the four investigated molecules should be smaller or larger than 180 or 0° to represent a nonplanarity arrangement at this part molecule. While the dihedral angles DA2, DA3, DA4, and DA5, which represent the angle of attachment of the anthanthrene core with the thiophene unit 1 (TPH1), thiophene unit 2 (TPH1), alkyl substituent 1 (ALKY1), and alkyl substituent 2 (ALKY1), respectively, are preferably to be close to 180 or 0° to represent a planner configuration, see Table 2.
Aromatic core
DA1 (TPA)
DA2 (TPH1)
DA3 (TPH2)
DA4 (ALKY1)
DA5 (ALKY2)
6,12-Anthanthrene (D1)
–
123.56
49.21
88.60
94.17
6,12-Anthanthrene (D2)
54.12
56.73
–
90.98
91.13
4,10-Anthanthrene (D3)
–
97.56
80.63
178.67
179.44
4,10-Anthanthrene (D4)
69.65
80.19
–
179.97
179.15
As shown in Table 2, for D2, and D4 dye molecules, DA1 dihedral angles in D2 and D4 equal 54.12 and 69.65°, which indicates the nonplanarity of this part of the two molecules. Other dihedral angles DA2, DA4, and DA5 range from 56.73 to 179.970, which also show a nonplanarity configuration. For instance, the DA2 dihedral angles equal 56.73 and 80.19° in D2 and D4 dyes, respectively. The nonplanarity configuration of the D2 molecule is more evident than that of the D4 molecule since in D4, DA4 and DA5 are equal to 179.97 and 179.15o, respectively, and they are equal to 90.98 and 91.13°, respectively in the D2 molecule. On the other hand, the planarity of the D1 molecule is more evident than that of the D3 molecule at the DA2 (TPH1) unit since this angle in D1, and D3 equals 123.56 and 97.56°, respectively. The opposite is true with respect to DA3 (TPH2). Additionally, the D1 and D3 molecules are planner regarding the two alkyl substituents (nonane) units compared to the two alkyl substituents (3-ethylheptan) units in D1 and D4 molecules, which indicates the effect of the nature of alkyl substituents on the degree of planarity of the molecule. For instance, in D1 and D2 dyes, the DA4 (nonane) equals 88.60 and 90.98°, respectively, while in D3 and D4 dye molecules, DA4 (3-ethylheptan) equals 178.67 and 1789.97°, respectively. The four investigated dyes are characterized by a planner π-spacers (anthanthrene core) which signifies an effective transfer of charge between the electron-donor unit and electron-acceptor unit.
3.2 Frontier molecular orbitals of aromatic cores
In the D-π-A dye’s configuration, the electronic charge will transfer throughout the molecular skeleton following the direction from the donor unit to the acceptor unit through the π-bridge unit (Lin et al., 2009). This intramolecular electronic transfer can be attained by appropriate alignment of the HOMO and LUMO energy levels of these units with respect to each other. The HOMO and LUMO energy levels alignments of the donor unit (triphenylamine (TPA)), acceptor unit (thiophene (TPH)), and 6,12-positions or the 4,10-positions substituted with nonane or 3-ethylheptane alkyl chain anthanthrene core (π-bridge)) of the four investigated dyes are displayed in Fig. 2(a).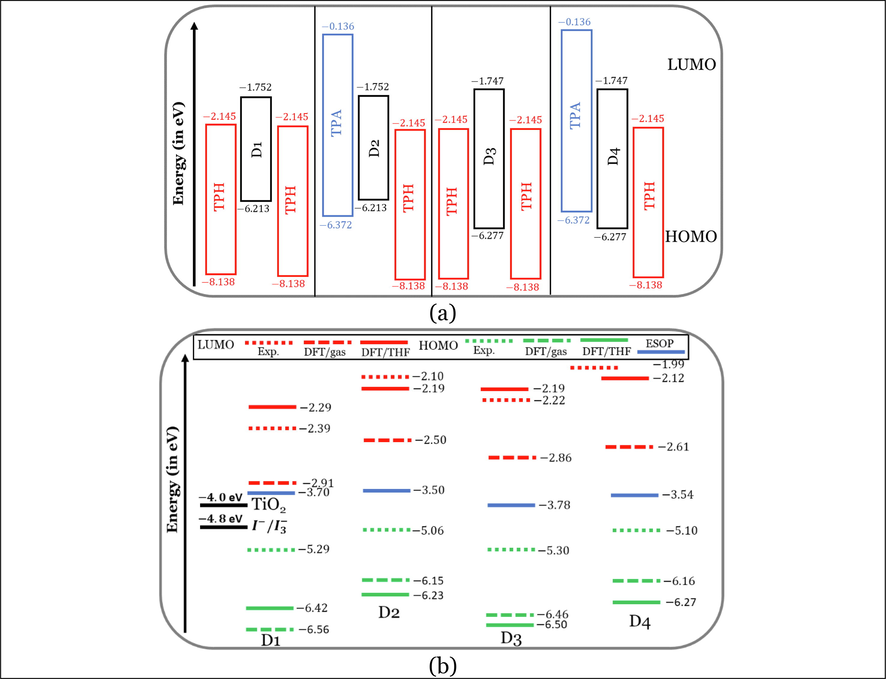
HOMO and LUMO energy levels of (a) the aromatic cores of the D1 to D4, and (b) four experimentally tested dyes (D1–D4) with the experimental values of the conduction band of TiO2 electrode and the redox potential of the electrolyte system. Note: HOMO and LUMO energy levels from experiment Geng et al. (2015).
As shown in Fig. 2(a), the HOMO energy level of TPA unit is higher than the HOMO of the anthanthrene core of D4 only by 0.095 eV. While the HOMO of TPH, TPA, and TPH is lower than the HOMOs of D1, D2, and D3 by 1.925, 0.159, and 1.861 eV, respectively. In contrast, the LUMO of the TPH unit is lower than the LUMOs of the anthanthrene cores of all dyes by not <0.393 eV. Therefore, the anthanthrene cores can act as good motivators for the intramolecular charge transfer within the D-π-A system, especially in the D4 molecule, followed by the D2 dye. Since D4 dye satisfies the requirement for good enforcement of charge transfer among the skeleton of the molecule completely. D2, although its HOMO is higher than that of the donor unit (TPA), the difference in energy between the two HOMOs can be considered insignificant (0.159 eV) when compared to the corresponding difference of the other two dyes, i.e., D1 and D3 (1.925, and 1.861 eV). Also, the energy gaps ( ) of the anthanthrene cores are smaller than those of TPA and TPH units. Since and eV for TPA, and TPH, respectively, while for the anthanthrene cores, it is in the range from 4.461 to 4.533 eV.
3.3 Frontier molecular orbitals of D1 to D4 dyes
Fig. 2(b) represents graphically the frontier molecular orbitals (FMOs) energy levels of the investigated dyes in the gas phase and THF solvent as calculated at the M06-2X/6-31+G(d,p), and CPCM/M06-2X/6-31+G(d,p) levels of theory. The FMOs are abbreviations for the two most important molecular orbitals, i.e., the highest occupied molecular orbital (HOMO) and the lowest unoccupied molecular orbital (LUMO). Fig. 2(b) shows too the HOMO and LUMO energy levels obtained experimentally (Geng et al., 2015). All energy levels were aligned with the CB of TiO2 semiconductor and the redox potential (RP) of electrolyte. The deviation between the experimental and calculated HOMO and LUMO values is more significant in the case of gas-phase calculated values. Adding solvent (THF) using the CPCM solvation model improves the agreement to a reasonable extent. It should be noted that the used level of theory can better predict the LUMOs rather than the HOMOs, since the deviations are smaller in the LUMOs (not exceeded 0.10 eV) compared to that in the HOMOs levels (not exceeded 1.20 eV).
One of the top requirements which determine the suitability of the dye as an active component in the fabricated DSSC is the proper level alignment between its HOMO and LUMO energy levels with those of the CB of TiO2 semiconductor (−4.0 eV) and the RP of the electrolyte (−4.8 eV). Where the LUMOs of the dye should be situated above the CB level of TiO2, the HOMOs should be located below the RP level of electrolyte. Since the proper energy levels alignment will ease the most important processes occurring in the DSSC framework, i.e., the electron injection process and the dye regeneration process. Considering the calculated HOMOs and LUMOs in the THF solvent only, and as can be noted from Fig. 2(b) that the LUMOs of the four investigated dyes were located above the CB of TiO2 with a difference ranging from 1.71 to 1.88 eV, in addition, the HOMOs were situated below the RP of electrolyte with a difference ranging from 1.63 to 1.90 eV. Therefore, the investigated dyes were approved theoretically as sensitizers since their energy levels (HOMOs and LUMOs) aligned properly with other components (TiO2 and ) of the DSSC device.
On the other hand, the
value can be obtained by the difference between HOMO energy (
and LUMO energy (
), i.e.,
. Smaller energy gaps is beneficial to ease the electron photoexcitation process and, thus, longer absorption wavelength (Chaitanya et al., 2015). Therefore, more photons can be absorbed at any given time, which guarantees a higher
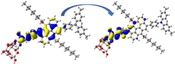
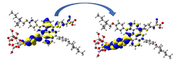
and overall power conversion efficiency. In addition, the HOMO and LUMO orbitals distribution are demonstrated in Fig. 3. As shown in Fig. 3, the HOMOs are mainly delocalized on the anthanthrene cores, while LUMOs are mainly delocalized on the thiophene unit and anchoring group/s. The delocalization of HOMOs and LUMOs in this manner is beneficial for effective charge transfer from the dye to the TiO2 at the interface of dye@ TiO2 adsorbed systems.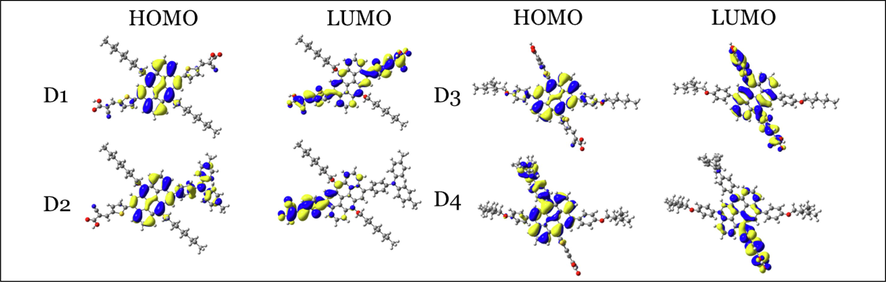
HOMO and LUMO orbitals distribution of the four investigated dyes at the CPCM/M06-2X/6-31+G(d,p) level of theory in THF.
3.4 UV–Vis absorption and emission properties
Experimentally (Geng, 2015), the four dyes exhibited two absorption peaks in the UV and the Vis region. The UV peak is more intense and found in the region from 320 to 360 nm. The Vis-peaks are less intense and fall in the region from 460 to 465 nm. Table 3 listed the calculated maximum absorption wavelengths as calculated at the CPCM/TDCAM-B3LYP/6-31+G(d,p) in THF solvent, along with the experimental values. The data are represented graphically in Fig. 3(a). The reliability in the calculated absorption wavelengths and, thus, the used level of theory is evident from the minor deviations (Δ) from the experimental ones. The maximum difference between the two sets of data did not exceed 21 nm, while the minimum and thus the better agreement is not <6 nm, see Table 3.
Dye
aΔ
Transition
Transition character
LHE
bIsodensity
D1
465
454.18
11
1.131
S0 → S1
H → L (55%)
0.926

360
340.12
20
1.402
S0 → S6
H-1 → L + 1 (30%)
0.960
D2
460
451.36
9
1.001
S0 → S1
H → L + 1 (49%)
0.900

330
350.77
−21
1.490
S0 → S4
H-2 → L (47%)
0.968
D3
465
458.76
6
1.215
S0 → S1
H → L (58%)
0.939
330
338.22
−8
1.229
S0 → S6
H-5 → L (32%)
0.941
D4
460
452.65
7
1.247
S0 → S1
H → L + 1 (56%)
0.943
320
305.96
14
1.553
S0 → S10
H-3 → L + 1 (40%)
0.972
In total agreement with the experiment, for each dye, the bands observed theoretically are two bands, an intense one in the UV region and a less intense one in the Vis region. The absorption bands in the visible region can be mostly attributed to π → π*. This is evident from the transition character associated with this band, since HOMO → LUMO transitions are the important contributor (ranging from 39% to 58%). On the other hand, the absorption bands in the UV region can be ascribed to the intramolecular charge transfer from the anthanthrene cores to the R1/R2 substituents on the 4,10-positions and 6,12-positions. This is evident from the transition character associated with this band, see the isodensity plots in Table 3.
Since it is more important for the efficient dye to absorb light in the visible region, we will now discuss the investigated dyes' absorption in this region only. Experimentally, it was evident that the maximum absorption wavelengths in the Vis region (
follow the order: D2 = D4 (460 nm) < D1 = D3 (465 nm), theoretically, the values show a similar trend but more precisely show some differences signifying the molecular structural differences between the four investigated dyes, i.e., D2 (451.36 nm) ≤ D4 (452.65 nm) < D1 (454.18 nm) ≤ D3 (458.76 nm). The trend shows a redshift in the wavelengths and thus the effect of symmetrical and asymmetrical cores and the number of anchoring groups on the absorption properties of the four dyes. The oscillation strength (
) of the maximum absorption wavelength is an important parameter that signifies the intensity of the absorption band and, consequently, the light-harvesting efficiency (LHE) of that specific dye. LHE value is directly proportional to the oscillation strength according to the following equation:
Therefore, the LHE is a function of the wavelength and the integrates photoelectrons generated by absorption over all relevant wavelengths. The LHE values of the investigated dyes are significant and not <90%. The values increase in the following order: D2 (1.001) < D1 (1.131) < D3 (1.215) < D4 (1.247). Accordingly, the LHEs increase in the same order. However, the LHEs are larger values and are higher than 0.926.
Table 3 lists the calculated maximum emission wavelengths at the CPCM/TDCAM-B3LYP/6-31+G(d,p) in THF solvent. The data are represented graphically in Fig. 3(b). The investigated dyes emit light in the Vis region. The emission bands are significantly red-shifted with respect to the absorption bands. The Stocks shift values ( ) ranges from 154 (D1) to 233 (D4). The large predicts large difference between the ground and excited state geometries (Wazzan and Irfan, 2018; Wazzan, 2019).
As the lifetime of the excited state (
) becomes shorter as more chance, the electron can be injected into the CB of TiO2. Conversely, as the
value becomes larger, it means that the excited electron can be deexcited to the ground state, combing with the left hole (charge recombination). From Table 4, the four dyes have
values in nanoseconds, thus the electron transport occurs from the singlet excited state (Venkatraman et al., 2020). The photoexcited electron lifetimes of the investigated four dyes are in the following order: D3 (5.579 ns) > D1 (5.149 ns) > D2 (4.817 ns) > D4 (4.803 ns). Thus, the feasibility of the electron injection process is expected to follow the same order. On the other hand, the electron injection process or the injection rate is also controlled by the energy difference between the excited state of the dye (abbreviated as
) and the CB edge of the TiO2 (Hagfeldt et al., 2010). As reported (Hara et al., 2005; Frontiera et al., 2009; Sánchez-de-Armas, 2012), it is beneficial that the excited state of the recently developed metal-free organic dyes is high in energy to increase the efficiency of electron injection. According to Koopmans’ theorem, HOMO energy is taken as ground state oxidation potential (GSOP) and abbreviated as
while the excited state oxidation potential (ESOP =
) involves both the GSOP and excitation energies (
) according to the equation (
). One can observe that all investigated dyes exhibited ESOPs very close to the CB of TiO2, see Fig. 2(b).
Dye
D1
608.24
2.038
1.063
154
5.149
D2
616.27
2.012
1.166
201
4.817
D3
668.15
1.856
1.183
209
5.579
D4
685.20
1.810
1.445
233
4.803
3.5 Reorganization energies
Based on Marcus’s theory (Marcus, 1993), the charge transfer rate (
) is expressed by Eq. (4):
The intramolecular reorganization energy can be expressed by Eqs. (5) and (6) (Zhao et al., 2013; Andijani et al., 2019; Chi and Li, 2015; Chitpakdee et al., 2014). The reorganization energy of the hole transfer (
) is the sum of two contributions,
that are explained as:
Similarly, the reorganization energy for electron transfer
is also the sum of two contributions
that is defined as:
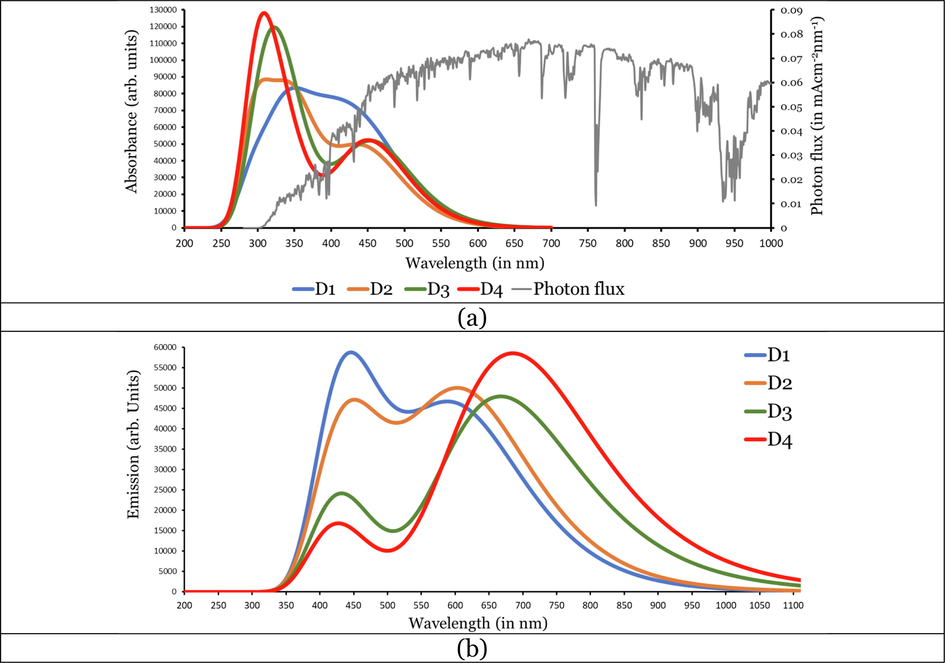
Simulated UV–Vis (a) absorption and (b) emission spectra of D1 to D4 dyes calculated at the CPCM/TDCAM-B3LYP/6-31+G(d,p) in THF.
The calculated electron, hole, and total reorganization energies (
,
and
in THF solvent of the four investigated dyes are summarized in Fig. 5. The four investigated dyes' hole/electron reorganization energies can be considered high values compared to those reported in the literature for other transporter materials (0.2–0.3 eV) (Costa et al., 2021).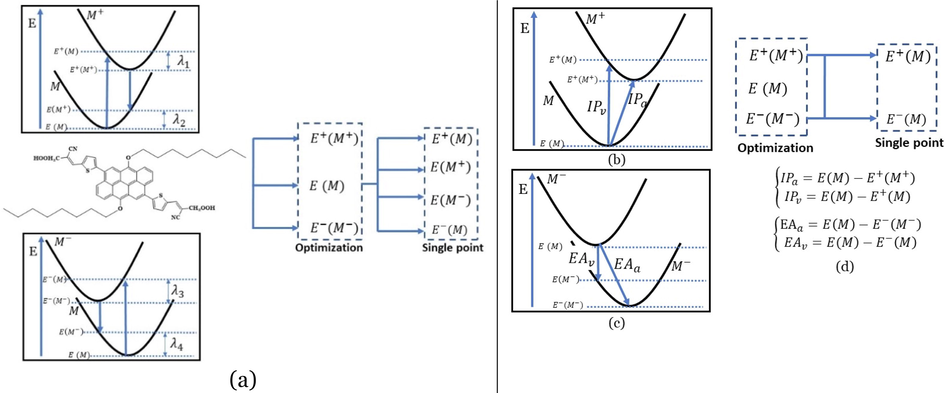
Graphical illustration of (a) the potential energy surfaces and calculations of hole reorganization energy, and electron reorganization energy for D1 dye as a representative example, (b) the neutral and cationic species, (c) the neutral and anionic species, and (d) calculations of the adiabatic and vertical ionization potential and electron affinity. Note: the definitions of each term were detailed in Section 2, Figures are reproduced from refs. (Metri et al., 2012; Brédas et al., 2004).
For more efficient performance of a solar cell, λ value should be as small as possible. This will enhance the charge transfer process, and thus better electronic injection into the TiO2 CB will be obtained. There is a direct and substantial relationship between the value and (Taniya, 2017). It can be seen from Fig. 5 that the hole reorganization energies for the four dyes are significantly smaller than their electron reorganization energies showing that they are better hole transfer compounds than electron transfer compounds (Irfan, 2014).
The values increase in the following order: D2 ≈ D4 < D3 < D1, indicating that the two dyes, D2 and D4, have the best ability to transfer holes. Moreover, the values increase in the following order: D2 < D3 < D1 < D4. So D2 also shows better performance as an electron transporter.
The difference ( ) between and refer to the balanced transport of both electrons and holes, which is an important parameter in improving the efficiency of DSSCs to acquire a considerable luminescence ability (Hosseinzadeh et al., 2017). From Fig. 5, the difference ( ) between and in dyes D1, D2, D3, and D4 are 0.464, 0.296, 0.423, and 0.582 nm, respectively. Consequently, D2 shows a better-balanced transport rate than the other three dyes, and therefore D2 shows a higher value, a result that agrees very well with the value obtained experimentally (Geng et al., 2015).
3.6 Molecular description parameters
Using the CPCM/M06-2X/6-31+G(d,p), the cationic, anionic, and neutral species' molecular energies were obtained considering the THF solvent's geometries. After that, the chemical reactivity parameters included the vertical and adiabatic ionization potential (
), vertical and adiabatic electron affinity (
), Chemical potential (
), chemical hardness (
, electrophilicity index (
), and electron-accepting power (
), and the electron-donating power (
were calculated, and the values of the four investigated experimentally tested dyes (D1 to D4) are listed in Table 5. Fig. 4(b, c, and d) represents the potential energy surfaces of the neutral and cationic species and the neutral and anionic species. Also, it shows the method of calculations of the adiabatic and vertical ionization potential and electron affinity.
Dye
D1
5.61
3.24
5.74
2.76
2.06
−4.36
4.59
0.64
4.99
D2
5.47
3.19
5.55
2.96
2.02
−4.21
4.40
0.60
4.81
D3
5.70
3.19
5.82
2.81
2.15
−4.35
4.38
0.56
4.90
D4
5.49
3.15
5.58
2.64
2.08
−4.20
4.24
0.54
4.74
The ionization energy should be small to guarantee an efficient electron injection to the TiO2 semiconductor. In contrast, the electron affinity should be large to ensure efficient electron injection to the LUMO level of the dye (Costa et al., 2021). From Table 5, the adiabatic and vertical ionization potentials also the adiabatic electron affinity show that D2 dye has the smallest, smallest, and largest values, respectively. Therefore, D2 dye has the most capability to receive and transfer electron/s.
The dye in DSSC plays dual roles because it injects the photoexcited electron into the TiO2 semiconductor and should pick up an electron from the electrolyte material to fill the hole. Therefore, the electron injection and hole receiving ability of D2 dye are expected to be better than those of other investigated dyes, D1, D3, and D4. This result can be safely used to interpret the experimental superior photo-current efficiency of D2 dye compared to other dyes.
The chemical hardness (
) of a molecule in its ground state is its resistance to exchange electronic charge with its environment. The value of
can be accurately determined using Eq. (7) (Pearson, 1997; Koopmans, 1934):
The ability of a dye to transfer electron/hole can be measured qualitatively by the chemical hardness value. The larger η value indicates a limited ability to transfer charge, and the smaller value indicates a good ability (Afolabi et al., 2020). The values increase in the following order: D2 (2.02 eV) < D1 (2.06 eV) < D4 (2.08 eV) < D3 (2.15 eV). Therefore, the ability of the dye molecules to transfer electron/hole can be arranged in a similar order, and the ability to produce larger value. The reported experimental values listed in Table 1 are agreed very well with this result.
The relationship between the LHE and
values is presented graphically in Fig. 6(a). The figure displays a funnel-like shape. It was reported that the inverse relationship between the two sets of data is associated better with photo-to-current efficiency in DSSCs. Additionally, as the difference between the two corresponding values becomes smaller, the light absorption wavelength becomes longer, which in turn means more efficient charge transfer and better performance (Afolabi et al., 2020; Semire et al., 2016).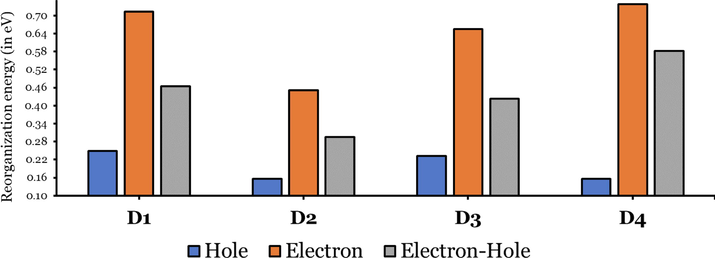
Hole, electron, and electron-hole reorganization energies of D1 to D4 dyes in THF solvent.
According to Parr et al. (1999);
is the measure of the stabilization energy of the molecular system, and can be calculated according to Eq. (8):
Additionally, the two concepts: electron-accepting power (
), and electron-donating power (
) has been introduced by Gázquez et al. (2007) according to Eqs. (9) and (10) as follows:
Higher and are preferable. The order of increasing the and for the four dyes show the same trend and it is: D4, 4.24 eV (0.54 eV) < D3, 4.38 eV (0.56 eV) < D2, 4.40 eV (0.60 eV) < D1, 4.59 eV (0.64 eV). However, D2 the dye that showed the best experimental photovoltaic performance, shows the third highest values of and and therefore, it is expected that D2 dye will show one of the most stabilization energy and electron-accepting ability and thus better charge transferability. The existence of an equilibrium between the electron-accepting donating and electron power is preferred (Soto-Rojo et al., 2015). We can calculate the difference between the and and the results can be ordered as follows: D4 (4.20 eV) ≤ D2 (4.21 eV) < D3 (4.34 eV) ≤ D1 (4.35 eV). Therefore, D2 and D4, and as evident experimentally, have the highest conversion efficiency ( ).
3.7 Solubility
Since the dye with a larger dipole moment would show good solubility in organic solvents. The increase in the dipole moments would increase the solubilities in organic solvents in the ground state (GS) and excited state (ES) (Ans et al., 2019), and it is expected that the crystallinity of the organic solar cells (OSC) would be enhanced. The dipole moments of D1 to D4 are calculated at the CPCM/TDCAM-B3LYP/6-31+G(d,p) level, and the data are represented graphically in Fig. 7.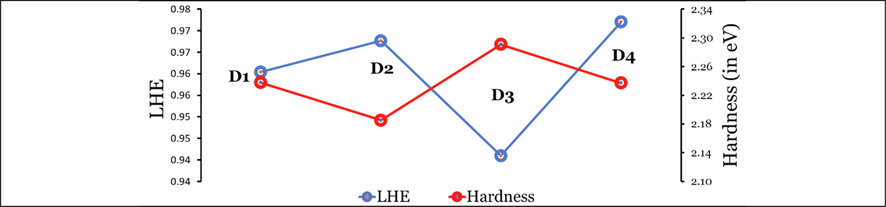
The relationship between LHE and
values of D1 to D4 dyes.
A larger dipole moment improves the reduction in the disorder between the donor and the acceptor and facilitates the self-assembly of the molecule. Also, it reduces the charge recombination and thereby increases the FF (Ans et al., 2019). From the data in Fig. 7, we can see that for the four tested dyes (D1–D4), the dipole moments of ground states ) are lower than those the first excited states ( ), except that of D2 dye. On the other hand, D2 and D4 dyes, the two asymmetrical dyes but with different cores, show the highest values of and , indicating that they should be more soluble in Tetrahydrofuran (THF) (the solvent used in the experimental tests of these dyes). Therefore, these dyes exhibited a better charge mobility. The change between the and ( ) values can be arranged in the following order: D2 (0.715 Debye) < D1 (0.872 Debye) < D3 (2.159 Debye) < D4 (2.452 Debye).
3.8 Chemical reactivity in relation to experimental parameters of efficiency
Excellent correlations between the chemical reactivity parameters and experimental efficiency parameters were obtained in the literature using Pearson correlation coefficients and their P-values (Soto-Rojo et al., 2015). Thus, in this study, such correlations were investigated. The results are summarized in Table 6 Pearson correlation coefficient measures the strength and direction of the linear relationship between two continuous variables. It has a value between +1 and −1, where +1 is a total positive linear correlation, 0 is no linear correlation, and −1 is a total negative linear correlation. On the other hand, we need to calculate the P-value to determine whether the correlation between variables is significant. In most cases, if the P-value ≤0.05 indicates strength in the association between the two variables. We aim to study the effect of the nature of alkyl substitutions and the number of anchoring groups for these four anthanthrene-based dyes used in DSSCs under the same conditions of manufacture and measurements in which one can predict new D-π-A molecular systems. However, the results should be considered cautiously because of the small number of molecules. Nevertheless, even though only four data sets were correlated, some good results were achieved.
Parameter
Parameter
0.848
0.643
0.962 (0.038)
─
0.978 (0.022)
─
0.970 (0.030)
0.970 (0.030)
─
─
0.979 (0.021)
─
0.840
0.691
0.973 (0.027)
0.642
0.897
0.889
─
─
─
0.717
─
0.616
0.963 (0.037)
─
0.857
0.795
─
0.789
─
0.994 (0.006)
─
Some of the chemical reactivity parameters show good correlations with some experimental data. Positive linear correlations are presented in all cases since the Pearson correlations are positive in all reported cases. According to the data in Table 6, it is expected that the experimental short-circuit photocurrent density ( ), would increase with increasing of the adiabatic ionization energies (0.848), adiabatic electron affinity (0.970, P = 0.030), Vertical ionization potential (0.840), hardness (0.963), hole reorganization energy (0.642), electron reorganization energy (0.717), and total reorganization energy. However, only the correlation between the and is supported by a P-values (0.030). The experimental open-circuit voltage ( ) would increase with the increase of (0.643), (0.970; P = 0.030), (0.691), electrophilicity (0.994; P = 0.006), electron-donating ability (0.978; P = 0.022), electron-accepting ability (0.979; P = 0.021), and (0.897), as can be seen most values were supported with P-values , which indicates that the correlations are significant. Moreover, the conversion efficiency ( ) was found to show good correlation with most of the calculated parameters. The values will be more significant with larger (0.962; P = 0.038), larger (0.973; P = 0.027), larger (0.857), larger hole/electron/total reorganization energies (0.889, 0.616, 0.789, respectively). The method above finds a correlation between the calculated chemical parameters and the experimental data that could expect the affective molecular configuration of D-π-A systems.
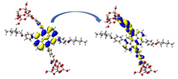
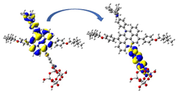
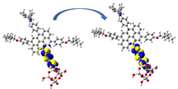
3.9 Adsorption behavior of dye@ TiO2 clusters
3.9.1 Adsorption energies
The literature has widely reported either a cluster or a periodic model system of TiO2 to model the dye@ TiO2 adsorbed system. Many researchers used minimum-sized clusters to compromise the computational cost and efficiency of simulation the electronic and optical properties of the complex system (Wazzan and Irfan, 2018; Venkatraman et al., 2020; Deogratias et al., 2020; Costa et al., 2022; Lundqvist et al., 2006). This study has applied a small cluster of (TiO2)6 to simulate the dye-TiO2 complex system. Such small cluster are a good cluster size in terms of computational cost and accuracy (Wazzan and Irfan, 2018; Deogratias et al., 2020; Costa et al., 2022). As proved earlier, the hydrogenated TiO2 clusters exhibit higher stability than corresponding dehydrogenated clusters (Syzgantseva et al., 2011). Therefore, Ti6O12H3 was applied. The band gap (
) of this cluster equals 4.561 eV higher than the typical bandgap of TiO2 anatase (3.2 eV (Dette et al., 2014) due to the difference in size. However, it corresponds well with previously calculated bandgaps for other similar small clusters (Wazzan and Irfan, 2018; Deogratias et al., 2020; Costa et al., 2022; Bora and Kalita, 2021). More importantly, the S0 → S1 optical gap was estimated to be 3.42 eV, which shows a minor deviation from the experimental bandgap. The geometrical parameters of the optimized TiO2 clusters with dyes show a slight elongation in the different bond lengths compared to those of the clean TiO2 cluster. For instance, the Ti—O average bond length in clean TiO2 is 1.8 Å, while it is 1.9 Å in the dye@TiO2 adsorbed systems. Similarly, the O—H average bond lengths is 0.95 Å and 0.96 Å in the adsorbed and clean TiO2 clusters, respectively. The Ti—Ti bond length is elongated by ∼0.2 Å. Since the distortion in the TiO2 cluster after binding to the dye signify the strength of the adsorption (Lundqvist et al., 2006). In the mechanism of adsorption of dye into the TiO2 cluster, it is well known that the adsorption occurs by the deprotonation of the Hydrogen atom from the carboxylic group. Then the Oxygen atom/s of the carboxylic group can be attached through three modes: mono- or bidentate bridging or chelating. It was proved that the bidentate bridging adsorption on the surface of TiO2 was found to be the most stable since it presents better electrons charge transfer performance (Wazzan and Irfan, 2018; Horn et al., 1972; Martsinovich and Troisi, 2011; Bates et al., 1998). Therefore, in this study, Oxygen atoms have been attached to the TiO2 cluster by bidentate bridging mode after deprotonating the hydrogen/s of —COOH. The adsorption energies (
) of the studied compounds@TiO2 cluster/s were calculated by using the following equation:
is the energy of the optimized complex (dye@TiO2), and
and
are the energies of the optimized dye and TiO2 cluster, respectively. The deprotonated hydrogen energies were added to the system to acquire reliable adsorption energies. Negative adsorption energy values indicate stable adsorption, see Fig. 8.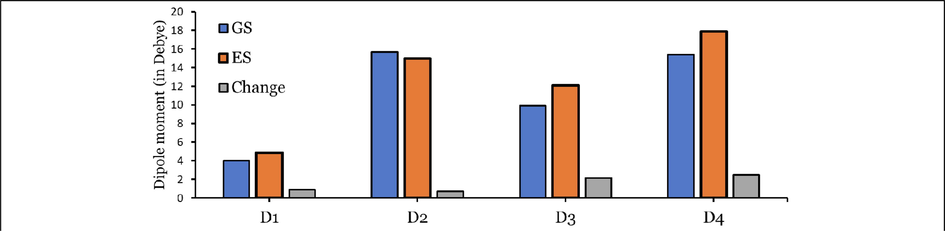
Simulated bar chart in THF solvent of the ground state
and excited state
and the change in dipole moments upon excitation
(
) (in Debye) of D1 to D4 dyes calculated at the CPCM/TDCAM-B3LYP/6-31+G(d,p) level.
Since D1 and D3 dyes have two carboxylic groups, we assigned these two groups as a and b. We calculated the adsorption energies for these sides separately, abbreviated as D1/3-a/b@TiO2. In addition, we calculated the adsorption energy due to the attachment of two TiO2 to these two sies simultaneously, abbreviated as D1/3-a&b@TiO2.
Among the three adsorbed configurations of D1 dye, D1-a&b@TiO2 is the most stable ( kJ/mol) followed by the adsorption at the adsorption on a or b sides have comparable adsorption energies and thus similar stability of the resultant adsorbed systems ( kJ/mol). On the other hand, the different adsorbed configurations of D3 dyes showed a significant difference in their stabilities, i.e., the D3-a&b@TiO2 configurations are more stable than D3-a@TiO2 and D3-b@TiO2 by 51.579 and 79.743 kJ/mol, respectively. Moreover, the attachment at the b side is more stable than the attachment at the a side of this dye by 28.164 kJ/mol. Among all adsorbed systems/configurations, we found that the most stable adsorbed systems are the bidentate configurations D1-a&b@TiO2 ( kJ/mol) and D3-a&b@TiO2 ( kJ/mol). D2@TiO2 and D4@TiO2 adsorbed systems are less stable than the three adsorbed configurations of D1 dye, and D2@TiO2 is more stable than D4@TiO2 by 16.554 kJ/mol. Therefore, ordering the eight adsorbed systems according to their stability (more negative values) results in the following: D3-b@TiO2 ( kJ/mol) < D4@TiO2 ( kJ/mol) < D3-a@TiO2 ( kJ/mol) < D2@TiO2 ( kJ/mol) < D1-a@TiO2 ( kJ/mol) ≤ D1-b@TiO2 ( kJ/mol) < D3-a&b@TiO2 ( kJ/mol) < D1-a&b@TiO2 ( kJ/mol). In addition, the higher values of the adsorption energies are indictor of a chemosorption type of adsorption.
3.9.2 Electro and optical properties
The calculated absorption wavelengths/energies, oscillator strengths, and light-harvesting efficiencies of dye@TiO2 adsorbed systems as calculated at CPCM/TDCAM-B3LYP with 6-31+G(d,p) and LANL2DZ in THF are collected in Table 7 and represented graphically in Fig. 9.
can be arranged in the following order: 438.38 nm (D4@TiO2) < 442.53 nm (D2@TiO2) < 444.52 nm (D1-a&b@TiO2) < 447.65 (D3-a&b@TiO2). Therefore, the dyes recorded the better experimental photovoltaic performance (D2 and D4) adsorbed light at shorter wavelengths. However, as evident from the LHE values, D1 and D3 absorbed light more intensely than D2 and D4 dyes. Also, if we compare the
values of di-adsorbed systems with those of isolated dyes, we will notice a redshift (shorter wavelengths) by 9.65, 8.83, 11.11, and 14.27 nm for the adsorbed systems of D1, D2, D3, and D4, respectively. The LHE values of the adsorbed systems are smaller/much smaller than those of isolated dyes. This result indicates the efficiency of isolated dyes in absorbing light and becoming photoexcited and injecting the photoexcited electrons to the semiconductor (TiO2) CB, thus enhancing the electronic coupling and starting the circle of electricity generation. The mono-adsorptions of D1 dye at the a and b sides (D1-a@TiO2 and D1-b@TiO2) occurred at maxima wavelength of 435.80 and 457.63 nm, respectively, thus they are blue- and red-shifted, respectively, compared to the that of the di-adsorbed system (D1-a&b@TiO2), since
equal 444.52 nm in the later system. While the mono-adsorption of D3 dye at the two sides (a & b) is red-shifted concerning the di-adsorbed system. Since for D3-a@TiO2 and D3-b@TiO2,
equal 333.99 and 445.54 nm, respectively, and for D3-a&b@TiO2, it equals 447.65 nm. Since it is most probably that D1 and D3 dyes will be adsorbed through the di-adsorption configuration, we will compare the
values of their di-adsorption with the those of D2, and D4 dyes. Accordingly,
can be arranged in the following order: 438.38 nm (D4@TiO2) < 442.53 nm (D2@TiO2) < 444.52 nm (D1-a&b@TiO2) < 447.65 (D3-a&b@TiO2). Therefore, the dyes recorded the better experimental photovoltaic performance (D2 and D4) adsorbed light at shorter wavelengths. However, as evident from the LHE values, D1 and D3 absorbed light more intensely than D2 and D4 dyes. Also, if we compare the
values of di-adsorbed systems with those of isolated dyes, we will notice a redshift (shorter wavelengths) by 9.65, 8.83, 11.11, and 14.27 nm for the adsorbed systems of D1, D2, D3, and D4, respectively.
Dye@TiO2
Transition
Transition character
LHE
aIsodensity
D1-a@TiO2
435.80/2.845
0.986
S0 → S9
H → L (52%)
0.897
386.77/3.206
0.999
S0 → S14
H → L + 4 (54%)
0.900
D1-b@TiO2
457.63/2.709
1.155
S0 → S9
H → L (58%)
0.930
393.07/3.154
1.304
S0 → S14
H → L + 4 (49%)
0.950
D1-a&b@TiO2
444.52/2.789
1.148
S0 → S17
H → L (61%)
0.929
D2@TiO2
442.53/2.802
0.863
S0 → S9
H → L (51%)
0.863
357.25/3.471
0.726
S0 → S16
H-3 → L (45%)
0.812
D3-a@TiO2
333.99/3.712
1.106
S0 → S19
H-6 → L (53%)
0.922
D3-b@TiO2
445.54/2.7828
1.003
S0 → S9
H → L (53%)
0.901
333.80/3.714
0.971
S0 → S19
H-6 → L (37%)
0.893
D3-a&b@TiO2
447.65/2.770
0.915
S0 → S17
H → L (58%)
0.878
D4@TiO2
438.38/2.828
0.894
S0 → S9
H → L (41%)
0.872
338.62/3.662
0.987
S0 → S18
H-6 → L (53%)
0.897
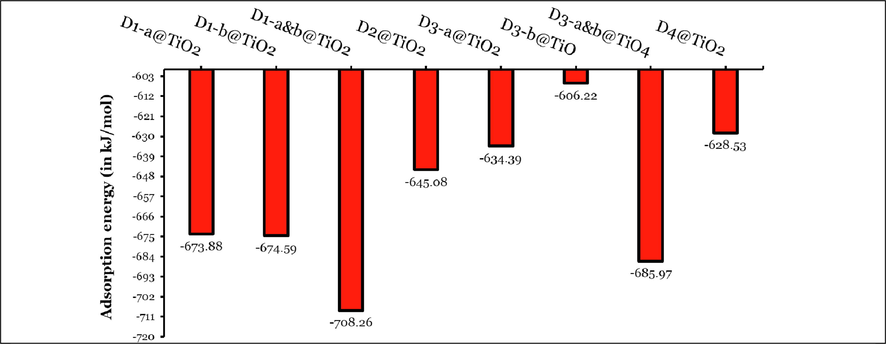
Bars represent the adsorption energies (in kJ/mol) of different adsorption configurations of investigated dyes on TiO2 clusters. Note: Adsorption energies for D1/3-a&b@TiO2 were calculated by taking the energy of two TiO2 clusters and two Hydrogen atoms. The adsorption energies of D1/3-a&b@TiO2 were divided by two to ease the comparison with other values.
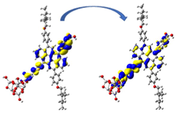
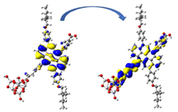
The charge density of FMOs of dye@TiO2 cluster/s involved in the major transitions is illustrated in Table 7. The major electronic transitions are attributed to HOMO/HOMO-6 to LUMO/LUMO + 4 molecular orbitals. The major transitions in the absorption spectrum of the mono-adsorbed D1-a@TiO2 system are from H to L and from H to L + 4 with 52 and 54% contributions, respectively. The HOMO orbital is delocalized over the anthanthrene π-linker, LUMO orbital is distributed over the thiophene unit toward the anchoring group and closer to the attached TiO2 cluster, while L + 4 orbital is delocalized on the anthanthrene π-linker and the thiophene unit toward the anchoring group and farther from the TiO2 cluster. In the mono-adsorbed D1-b@ TiO2 system, the major transitions are very similar to that of D1-a@ TiO2 except for the fact that the L + 4 orbital is distributed over the anchoring group and the TiO2 part of the system. The main transition in di-adsorbed system D1-a&b@ TiO2 is only due to the HOMO to LUMO with 62% contribution. The HOMO is delocalized on the anthanthrene π-linker like that in the two mono-adsorbed systems. At the same time, the LUMO is distributed on the two thiophene units and two anchoring groups. In the two mono-adsorbed systems of D3 dye, the transitions are due to H-6 → L with contributions of 53% and 37% for D3-a@ TiO2 and D3-b@ TiO2, respectively. The H-6 is distributed over the anthanthrene π-linker and the thiophene unit and anchoring group near the TiO2 cluster in the former and the anthanthrene π-linker only in the latter. The LUMO is distributed on similar parts of the whole skeleton of the system, i.e., the thiophene unit and anchoring group closer to the TiO2 cluster. The H → L (58%) transition led to the major transition in the di-adsorption of D3 dye. In the only one type of adsorption configuration for D2 and D4 dyes, H → L plays a key role with 51% and 41% contributions for D2@ TiO2 and D4@ TiO2, respectively. However, the H-6 → L with 53% gives another important transition in D4@ TiO2 system. Like the isodensity distributions of the orbitals in the former adsorbed systems (D1 and D3), the orbitals delocalized over different parts of the molecule, i.e., the HOMOs over the central region and LUMOs over the edged parts of the molecule toward or over the attached TiO2 cluster/s. In conclusion, coherent intramolecular charge transfer has been observed from HOMOs to LUMOs orbitals (Wazzan and Irfan, 2018).
3.9.3 Noncovalent interaction analysis
The Noncovalent interaction (NCI) approach proposed by Johnson et al. (2010) is a beneficial and popular method for revealing regions and types of weak interactions in chemical systems based on the electron density and its derivatives. It is based on a 2D plot of the reduced density gradient, RDG, and the electron density,
, according to the following equation:
Since
is the model of the electron density gradient and
is the electronic density. This approach provides a rapid and rich representation of van der Waals interactions, hydrogen bonds, and steric clashes, requiring only the atomic coordinates as input (Johnson, 2010). The gradient isosurfaces are colored according to the corresponding values of
, which is found to be a good indicator of interaction strength. Large, negative values of
are indicative of attractive interactions (such as dipole–dipole or hydrogen bonding); while if
is large and positive. The interaction is nonbonding. Values near zero indicate very week, van der Waals interactions. We attempt to examine the interaction between the dye and TiO2 by investigating the intermolecular interaction by the noncovalent interaction-reduced density gradient (NCI-RDG) plots analysis. As an illustrative example of mono- and di-adsorption, the NCI analysis was performed on D3@ TiO2 on its three configurations, i.e., D3-a@ TiO2, D3-b@ TiO2, and D3-a&b@ TiO2 systems. The corresponding NCI-RDG 2D scatter maps and 3D color-filled RDG isosurfaces at the C-PCM/B3LYP-D/6-31G(d,p) in methanol is illustrated in Fig. 10. The NCI analysis provides an index based on the electron density and its derivatives that enable the identification of noncovalent interactions developed by Johnson et al. (2010). The green region represents the Van der Walls interactions, and the red-colored region represents the repulsive interactions due to the strong steric effect. In contrast, the blue region referred to strong attraction due to hydrogen bond (H-bond), refer to the top illustration plot in Fig. 11.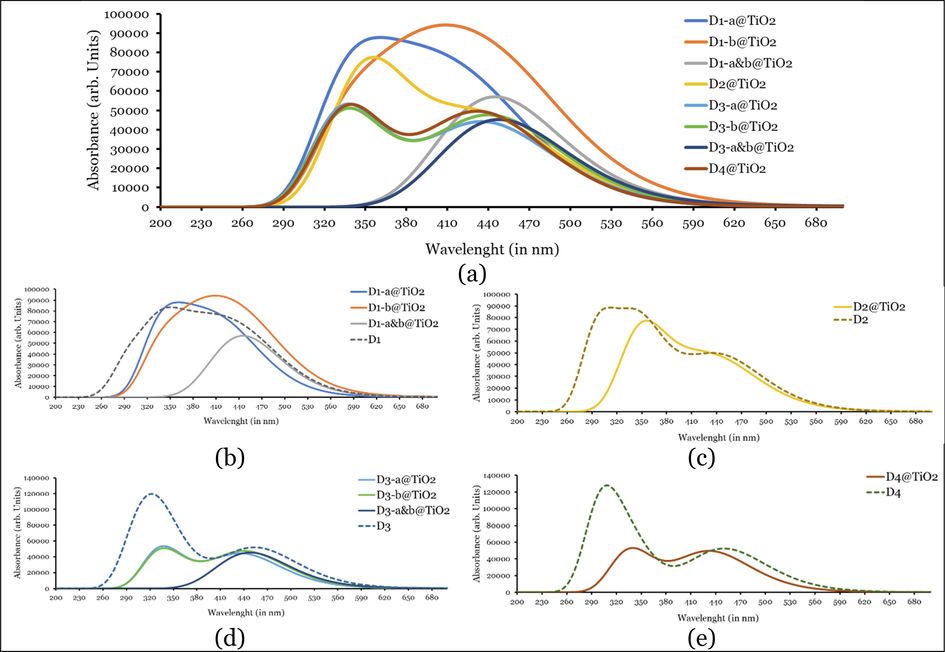
Simulated UV–Vis absorption spectra of isolated and adsorbed dyes on TiO2 clusters as calculated at CPCM/TDCAM-B3LYP with 6-31+G(d,p) and LANL2DZ in THF. Note: for clarity (a) all isolated dyes and adsorbed systems, and (b), (c), and (d) individual spectrum of isolated dye and its adsorbed system.
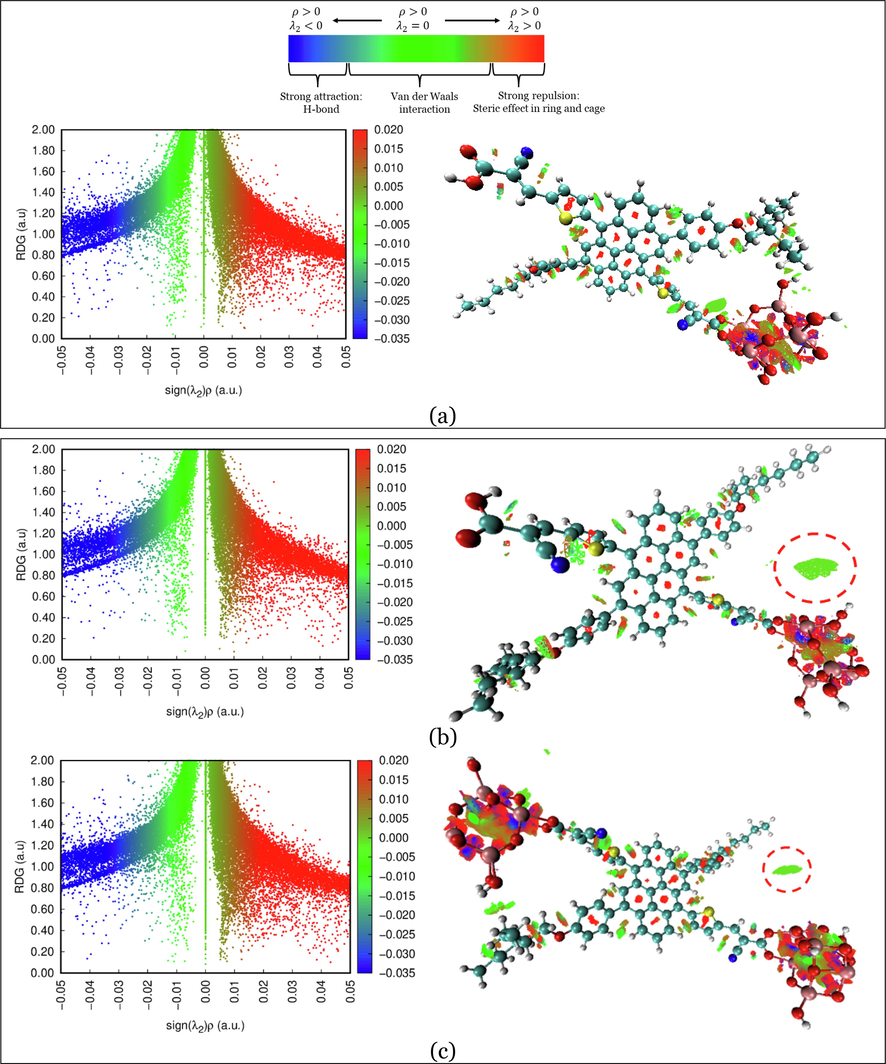
Left: NCI-RDG 2D scatter maps, and right: 3D colour-filled RDG isosurfaces of (a) D3-a@ TiO2, (b) D3-b@TiO2, and (c) D3-a&b@TiO2 systems at C-PCM/B3LYP-D/6-31G(d,p) in methanol.
NCI results reveal that the three types of NCI are present in the D3-a@TiO2, D3-b@TiO2, and D3-a&b@TiO2 systems. As we can see, the NCI within the TiO2 cluster was dominated in the first place by the strong steric effect, in the second place by the van der Waals interactions, and Hydrogen bonding in the third place, which is represented by red, green, and blue color, respectively. For example, from the NCI-RDG 2D scatter maps on the left side of Fig. 11, the D3-a&b-TiO2 system shows the most NCI resulting from the steric effect indicated by the strong appearance of red spikes. Another important note is the green plates (circled) that show a van der Waals interaction between the part of the TiO2 cluster and alkyl substituent (3-ethylheptane). This type of interaction will enhance the stability of the formed system.
4 Conclusions
Using DFT and TD-DFT, the behaviour of four experimentally tested anthanthrene-based dyes abbreviated as D1 to D4 dyes differ in alkyl-substitutions (nonane or 3-ethylheptane), and the number of anchoring groups (one/two cyanoacrylic acid/s) in their isolated and adsorbed (on TiO2) forms were performed. The following conclusions were drawn:
-
The nature of the alkyl group affects the planarity of the dye molecule and thus the extent of intramolecular charge transfer. In addition, in all investigated dyes, the anthanthrene core (π-spacers) is a planner which signifies an effective transfer of charge between the electron-donor unit and electron-acceptor unit.
-
As sensitizers, the investigated dyes approved theoretically that their energy levels (HOMOs and LUMOs) aligned properly with other components (TiO2 and ) of the DSSC device.
-
The maximum absorption wavelengths and LHEs showed a similar trend to the experiments. Still, they more precisely showed some differences that signify the molecular structural differences between the four investigated dyes.
-
The investigated dyes emit light in the Vis region. The emission bands are significantly red-shifted with respect to the absorption bands. From the values, D2 and D4 showed the most feasible electron injection process.
-
The values of most molecular description parameters explain the superiority of D2 dye with the highest conversion efficiency. For example, D2 dye has the most stabilization energy and electron-accepting ability, thus better charge transferability.
-
A relationship between the theoretical molecular properties and the experimental results that could predict the effective molecular configuration of D-π-A was achieved. Several excellent Pearson correlations and P-values were obtained between the most calculated reactivity parameters and the experimental photovoltaic parameters.
-
The higher values of the adsorption energies are indictor of a chemosorption type of adsorption.
-
A close analysis of the delocalization of FMOs in the dye@TiO2 systems indicates a coherent intramolecular charge transfer from HOMOs to LUMOs orbitals.
Acknowledgments
This work was supported by the Deanship of Scientific Research (DSR), King Abdulaziz University, Jeddah, under grant No. (D-043-135-1443). The author, therefore, gratefully acknowledges the DSR technical and financial support. I am looking forward to hearing from you.
Availability of data
The author confirms that the data supporting this study's findings are available within the article and its supplementary data.
Conflict of Interest statement
The author declares no conflict in this manuscript and publication.
References
- Design and theoretical study of phenothiazine-based low bandgap dye derivatives as sensitizers in molecular photovoltaics. Opt. Quant. Electron.. 2020;52(11):476.
- [Google Scholar]
- A novel photosensitizer based on a ruthenium(ii) phenanthroline bis(perylenediimide) dyad: synthesis, generation of singlet oxygen and in vitro photodynamic therapy. New J. Chem.. 2018;42(21):17538-17545.
- [Google Scholar]
- Molecular modeling and photovoltaic applications of porphyrin-based dyes: A review. J. Saudi Chem. Soc.. 2020;24(3):303-320.
- [Google Scholar]
- Modeling of efficient pyrene-core substituted with electron-donating groups as hole-transporting materials in perovskite solar cells. Sol. Energy. 2019;188:898-912.
- [Google Scholar]
- Designing indacenodithiophene based non-fullerene acceptors with a donor–acceptor combined bridge for organic solar cells. RSC Adv.. 2019;9(7):3605-3617.
- [Google Scholar]
- The adsorption and dissociation of ROH molecules on TiO2(110) Surf. Sci.. 1998;409(2):336-349.
- [Google Scholar]
- Tuning the charge transfer and optoelectronic properties of tetrathiafulvalene based organic dye-sensitized solar cells: a theoretical approach. RSC Adv.. 2021;11(62):39246-39261.
- [Google Scholar]
- Charge-Transfer and Energy-Transfer Processes in π-Conjugated Oligomers and Polymers: A Molecular Picture. Chem. Rev.. 2004;104(11):4971-5004.
- [Google Scholar]
- Can elongation of the π-system in triarylamine derived sensitizers with either benzothiadiazole and/or ortho-fluorophenyl moieties enrich their light harvesting efficiency? – A theoretical study. RSC Adv.. 2015;5(6):3978-3998.
- [Google Scholar]
- The theoretical investigation on the 4-(4-phenyl-4-[small alpha]-naphthylbutadieny)-triphenylamine derivatives as hole transporting materials for perovskite-type solar cells. PCCP. 2015;17(8):5991-5998.
- [Google Scholar]
- Theoretical studies on electronic structures and photophysical properties of anthracene derivatives as hole-transporting materials for OLEDs. Spectrochim. Acta Part A Mol. Biomol. Spectrosc.. 2014;125:36-45.
- [Google Scholar]
- Efficient diffuse function-augmented basis sets for anion calculations. III. The 3–21+G basis set for first-row elements, Li–F. J. Comput. Chem.. 1983;4(3):294-301.
- [Google Scholar]
- Designed complexes based on betanidin and L0 Dyes for DSSCs: thermodynamic and optoelectronic properties from DFT study. Mol. Simul. 2022:1-15.
- [Google Scholar]
- Betanidin isomerisation and decarboxylation, thermodynamic and charge transfer dye properties towards dye sensitised solar cells application. J. Phys. Org. Chem.. 2021;34(6):e4185.
- [Google Scholar]
- Effects of heteroatoms in π-conjugated linkers on the optical and electronic properties of modified triphenylamine based dyes: towards DSSCs’ applications. J. Mol. Model.. 2020;26(10):288.
- [Google Scholar]
- TiO2 anatase with a bandgap in the visible region. Nano Lett. 2014;14(11):6533-6538.
- [Google Scholar]
- Self-Consistent Molecular-Orbital Methods. IX. An Extended Gaussian-Type Basis for Molecular-Orbital Studies of Organic Molecules. J. Chem. Phys.. 1971;54(2):724-728.
- [Google Scholar]
- Frisch, M.J., 2009. Gaussian 09 Programmer's Reference. 2009, Gaussian.
- Probing Interfacial Electron Transfer in Coumarin 343 Sensitized TiO2 Nanoparticles with Femtosecond Stimulated Raman. J. Am. Chem. Soc.. 2009;131(43):15630-15632.
- [Google Scholar]
- Electrodonating and Electroaccepting Powers. J. Phys. Chem. A. 2007;111(10):1966-1970.
- [Google Scholar]
- Anthanthrene dye-sensitized solar cells: influence of the number of anchoring groups and substitution motif. RSC Adv.. 2015;5(119):98643-98652.
- [Google Scholar]
- 4,10-Dibromoanthanthrone as a New Building Block for p-Type, n-Type, and Ambipolar π-Conjugated Materials. Chem. – Eur. J.. 2013;19(1):372-381.
- [Google Scholar]
- Advancing beyond current generation dye-sensitized solar cells. Energy Environ. Sci.. 2008;1(1):66-78.
- [Google Scholar]
- Oligothiophene-Containing Coumarin Dyes for Efficient Dye-Sensitized Solar Cells. J. Phys. Chem. B. 2005;109(32):15476-15482.
- [Google Scholar]
- Ab initio effective core potentials for molecular calculations. Potentials for the transition metal atoms Sc to Hg. J. Chem. Phys.. 1985;82(1):270-283.
- [Google Scholar]
- He, J., et al., 2015. Ruthenium-Based Photosensitizers for Dye-Sensitized Solar Cells, in Organometallics and Related Molecules for Energy Conversion, W.-Y. Wong, Editor. 2015, Springer Berlin Heidelberg: Berlin, Heidelberg. p. 91–114.
- Refinement of the structure of anatase at several temperatures*. Z. Kristallogr. 1972:273.
- [Google Scholar]
- A computational investigation on the influence of different π spacer groups in the bithiazole-based organic dye sensitizers on the short-circuit photocurrent densities of dye-sensitized solar cells. J. Photochem. Photobiol., A. 2017;333:70-78.
- [Google Scholar]
- Modeling of efficient charge transfer materials of 4,6-di(thiophen-2-yl)pyrimidine derivatives: Quantum chemical investigations. Comput. Mater. Sci.. 2014;81(Supplement C):488-492.
- [Google Scholar]
- Über die Zuordnung von Wellenfunktionen und Eigenwerten zu den Einzelnen Elektronen Eines Atoms. Physica. 1934;1(1):104-113.
- [Google Scholar]
- Investigating the Effects of Thickness on the Performance of ZnO-Based DSSC. Progress Color Colorants Coatings. 2021;14(2):101-112.
- [Google Scholar]
- Organic Dyes Containing Furan Moiety for High-Performance Dye-Sensitized Solar Cells. Org. Lett.. 2009;11(1):97-100.
- [Google Scholar]
- DFT characterization and design of anthracene-based molecules for improving spectra and charge transfer. Spectrochim. Acta Part A Mol. Biomol. Spectrosc.. 2020;227:117627
- [Google Scholar]
- Promising pyridinium ylide based anchors towards high-efficiency dyes for dye-sensitized solar cells applications: Insights from theoretical investigations. Electrochim. Acta. 2018;283:1798-1805.
- [Google Scholar]
- DFT study of bare and dye-sensitized TiO2 clusters and nanocrystals. Int. J. Quantum Chem.. 2006;106(15):3214-3234.
- [Google Scholar]
- Electron transfer reactions in chemistry. Theory and experiment. Rev. Mod. Phys.. 1993;65(3):599-610.
- [Google Scholar]
- High-Throughput Computational Screening of Chromophores for Dye-Sensitized Solar Cells. J. Phys. Chem. C. 2011;115(23):11781-11792.
- [Google Scholar]
- Processable Star-Shaped Molecules with Triphenylamine Core as Hole-Transporting Materials: Experimental and Theoretical Approach. J. Phys. Chem. C. 2012;116(5):3765-3772.
- [Google Scholar]
- Pearson, R.G., 1997. Density Functional Theory, in Chemical Hardness. Wiley‐VCH Verlag GmbH, Weinheim. p. 59–97.
- Investigation of the Effect of rGO/TiO2 on Photovoltaic Performance of DSSCs Devices. Progress Color Colorants Coatings. 2022;15(2):123-131.
- [Google Scholar]
- Roy Dennington, T. Keith, Millam, J., 2009. GaussView, S. Mission, Editor. Semichem Inc.: KS.
- Molecular modification of coumarin dyes for more efficient dye sensitized solar cells. J. Chem. Phys.. 2012;136(19):194702.
- [Google Scholar]
- Roles of Chenodeoxycholic Acid Coadsorbent in Anthracene-Based Dye-Sensitized Solar Cells: A Density Functional Theory Study. J. Phys. Chem. C. 2018;122(41):23280-23287.
- [Google Scholar]
- Design of (2Z)-2-cyano-2-[2-[(E)-2-[5-[(E)-2-(4-dimethylaminophenyl)vinyl]-2-thienyl]vinyl]pyran-4-ylidene]acetic acid derivatives as D-π-A dye sensitizers in molecular photovoltaics: a density functional theory approach. Res. Chem. Intermed.. 2016;42(5):4605-4619.
- [Google Scholar]
- Study of chemical reactivity in relation to experimental parameters of efficiency in coumarin derivatives for dye sensitized solar cells using DFT. PCCP. 2015;17(21):14122-14129.
- [Google Scholar]
- Theoretical Investigation of the Hydrogenation of (TiO2)N Clusters (N = 1–10) J. Phys. Chem. C. 2011;115(32):15890-15899.
- [Google Scholar]
- Computational studies on optoelectronic and charge transfer properties of some perylene-based donor-π-acceptor systems for dye sensitized solar cell applications. Int. J. Quantum Chem.. 2017;117(5):e25332
- [Google Scholar]
- Aromaticity-Photovoltaic Property Relationship of Triphenylamine-Based D-π-A Dyes: Leads from DFT Calculations. J. Phys. Chem. A. 2020;124(17):3374-3385.
- [Google Scholar]
- Molecular design of organic dyes with diketopyrrolopyrrole for dye-sensitized solar cell: A theoretical approach. Int. J. Quantum Chem.. 2014;114(9):560-567.
- [Google Scholar]
- A DFT/TDDFT investigation on the efficiency of novel dyes with ortho-fluorophenyl units (A1) and incorporating benzotriazole/benzothiadiazole/phthalimide units (A2) as organic photosensitizers with D-A2–π–A1 configuration for solar cell applications. J. Comput. Electron. 2019
- [Google Scholar]
- Theoretical study of triphenylamine-based organic dyes with mono-, di-, and tri-anchoring groups for dye-sensitized solar cells. Org. Electron.. 2018;63:328-342.
- [Google Scholar]
- Theoretical studies of electronic and optical properties of the triphenylamine-based organic dyes with diketopyrrolopyrrole chromophore. Dyes Pigm.. 2015;113:87-95.
- [Google Scholar]
- Discovering the intermediate of dye regeneration in dye-sensitized solar cells: Theoretical investigations on the interaction between organic dye with different donors and X−/X3− (X = I, Br) Dyes Pigm.. 2015;120:74-84.
- [Google Scholar]
- Theoretical description of dye regeneration on the TiO2–dye–electrolyte model. Comput. Mater. Sci.. 2016;111:239-246.
- [Google Scholar]
- A new hybrid exchange–correlation functional using the Coulomb-attenuating method (CAM-B3LYP) Chem. Phys. Lett.. 2004;393(1):51-57.
- [Google Scholar]
- Tuning the Electron-Transport and Electron-Accepting Abilities of Dyes through Introduction of Different π-Conjugated Bridges and Acceptors for Dye-Sensitized Solar Cells. ChemPhysChem. 2017;18(4):366-383.
- [Google Scholar]
- The M06 suite of density functionals for main group thermochemistry, thermochemical kinetics, noncovalent interactions, excited states, and transition elements: two new functionals and systematic testing of four M06-class functionals and 12 other functionals. Theor. Chem. Acc.. 2008;120(1):215-241.
- [Google Scholar]
- Molecular design toward good hole transport materials based on anthra[2,3-c]thiophene: A theoretical investigation. Comput. Theor. Chem.. 2013;1010:25-31.
- [Google Scholar]
- Zhurko, G., Zhurko, D., 2009. Chemcraft program, Academic version 1.8.


