

Translate this page into:
Catalytic reduction of hazardous acid orange 10 dye by BiVO4/TiO2 nanocrystalline heterojunction and influence of aeration, FeSO4, H2O2 and FeCl3 on removal efficiency: A novel and environmentally friendly process
⁎Corresponding authors at: Department of Environmental Health Engineering, School of Health, Isfahan University of Medical Sciences, Isfahan, Iran. b.r.rahimi17@gmail.com (Behzad Rahimi), a_ebrahimi@hlth.mui.ac.ir (Afshin Ebrahimi)
-
Received: ,
Accepted: ,
This article was originally published by Elsevier and was migrated to Scientific Scholar after the change of Publisher.
Peer review under responsibility of King Saud University.
Abstract
Bismuth vanadate in combination with titanium dioxide were synthesized by hydrothermal method and its photocatalytic activity was investigated under visible light irradiation for acid orange 10 (AO10) dye removal. The 10% BiVO4/TiO2 showed the highest catalytic activity in comparison with 20, 30, 40 and 50% BiVO4/TiO2 ratios. The removal of AO10 azo dye in aqueous solutions was studied in laboratory-scale experiments using 25 removal processes and their removal efficiencieswere evaluated, separately. The results showed that the amount of de-colorization for each oxidation process is completely different. The order of the investigated processes in removing the dye after 90 min is as follows: LED < TiO2 < BiVO4 < 10% BT/without LED < BiVO4/ LED < 50% BT < 40% BT < 30% BT < 20% BT < UV/H2O2 < 10% BT < 5a-10 %BT < 5F-10 %BT < 10a-10 %BT < 50F-10 %BT < 20a-10 %BT < 10F-10 %BT < 20F-10 %BT < 20H-10 %BT < 40H-10 %BT < 50H-10 %BT < 20a-20F-10 %BT < 20a-20F-50H-10 %BT. Among the above processes, 20a-20F-50H-10 %BT had the best removal performance and can be suggested for using in real conditions. Coagulation/precipitation process was done using 5 mg/L of FeCl3 as post-treatment reaching efficiency of 100% in the studied system.
Keywords
Acid orange10
BiVO4/TiO2 nanocomposite
Photocatalytic process
RSM

1 Introduction
advancement of technology in industrialized and growing societies from a perspective for the people of those communities have brought prosperity and comfort, but on the other hand, injuries and losses to their environment has introduced that sometimes catastrophic and in most cases the possibility of compensation intrusion into the surrounding ecosystem has made it impossible (Roco and Bainbridge, 2007; Steinfeldt et al., 2007). Disturbing the active balance of the ecosystem has led to the extinction of various animal and plant species or has put them on the verge of extinction. (Noss et al., 1997; Kronenberg and Winkler, 2009). All industries directly, or indirectly, need to Significant amounts of water which its consumption varies by the type of industry and their productions. As well, the industries generally use clean water that the amount and volume of consumption in some industries such as the textile industry is very high and eventually their by-product would be polluted the receiving waters. So, it can be concluded that the industrialization of societies will inadvertently give products to society that polluted water is industrial wastewater. (Moore and Ausley, 2004; Anjaneyulu et al., 2005; Hanchang, 2009; Guittonny-Philippe et al., 2014). Most dyes are toxic, carcinogenic, and mutagenic, so it is important to remove the dye from wastewater (Gičević et al., 2019; Kaur and Singh, 2019). The presence of dye in wastewater increases the potential for the formation of trihalomethanes, as well its generating compounds may precipitate in the sewage collection network which may be suspended again by reaching the right conditions (Chang and Juang, 2004; Mahato and Gupta, 2020).
Oxidation involves processes based on the production of hydroxyl free radicals that have a high ability to decompose various organic matter. Oxidation methods are two methods of chemical oxidation using oxidizing agents and advanced oxidation processes (Javaid and Qazi, 2019; Mei et al., 2019). Recently, most attention has been paid to the separation of hard biodegradable organic sources and the treatment of toxic wastewater by advanced oxidation processes (AOPs) using homogeneous or heterogeneous catalysts. Also, it can be used to degrade contaminants that remain in the effluent after the treatment process and have solved the problem of wastewater pollutants that operate at normal temperatures and pressures. AOPs techniques are a good complement to other purification techniques such as flotation (Hu et al., 2020), precipitation (Raïs et al., 2002), adsorption on granular activated carbon (Gomez et al., 2007), reverse osmosis (Ebrahim et al., 2018) and aerobic bio-oxidation (Srinivasan and Sadasivam, 2018). A number of the mentioned techniques transfer pollutants from the aqueous phase to another one, but do not destroy them. The others selectively act, but the rate of pollutant degradation is normal. In some cases, the rate of destruction is high but it is not selective. These increases the cost of energy used to degrade pollutants. Aerobic bio-oxidation is limited to effluents that contain substances that are destroyed by biochemical degradation (Joshi et al., 2004; Syarizan, 2004; Tayal et al., 2011). AOPs by strong ultraviolet radiation, along with hydrogen peroxide and catalysts, have been widely used to degrade toxic and organic pollutants resistant to biodegradation in aqueous solutions. In this method, no harmful by-products and no sludge are produced, which requires additional steps for treatment (Collivignarelli and Sorlini, 2004; Chuang et al., 2017; Xing et al., 2018).
Various combined methods, including homogeneous and heterogeneous processes, are used to generate radicals, which can be implemented by methods such as a) photochemical radiation with ultraviolet (combined with strong oxidizing agents such as hydrogen peroxide or semiconductors) (Henderson et al., 2003; Tezcanli-Güyer and Ince, 2004; Qiao et al., 2005); b) Fenton and photo-Fenton catalytic processes (Gonçalves et al., 2019; Tarkwa et al., 2019; Kirchon et al., 2020); c) electron irradiation techniques (Nablo and Fussa, 1981; Payamara et al., 2010; Capelli et al., 2019); and d) sonolysis (Stock et al., 2000; Selli, 2002). The Fenton method is one of the traditional oxidation methods. In which the process of producing non-selective hydroxy radicals takes place through the reaction between hydrogen peroxide and divalent iron salts as a catalyst. The reaction depends on the concentration of hydroxyl radicals produced in the reaction (Kim and Metcalfe, 2007; Page et al., 2010). Hydrogen peroxide is known as an excellent oxidizer for oxidizing amines, aldehydes, and cyanides without the use of catalysts due to its unstable state and the fact that it easily loses excess atomic oxygen. Iron ions (Fe+ 2) are the main catalysts used to oxidize hard decomposing contaminants with hydrogen peroxide. Mixing hydrogen peroxide and iron sulfate (FeSO4) or other divalent iron salts at low pH (2 to 4) causes the catalytic decomposition of hydrogen peroxide by iron (II) ions to hydroxyl radicals. (Fu et al., 2010; Patil and Raut, 2014; Mansouri et al., 2019).
Our investigation aims the photocatalytic activity of acid orange 10 removal by designing experiments with different ratios of BiVO4/TiO2. On the other hand, 25 removal methods have been applied to compare the removal of AO10 for better understanding which methods are more effective for the dye removal. Additionally, since this type of textile wastewaters can also contain amounts of turbidity, different turbidity values were used for its effect on the dye removal. Also, in the continuous system, a coagulant called FeCl3 was used to remove all dye and nanomaterials applied in this study.
2 Experimental section
2.1 Materials
Acid orange 10 azo dye (C16H10N2Na2O7S2) was obtained from Sigma Aldrich co. Bismuth nitrate and ammonium metavanadate, titanium dioxide powder in the anatase form (APS: 20 nm, and SSA: > 200 m2.g), hydrogen peroxide (H2O2), FeSO4, FeCl3, methanol, ethanol, hydrogen chloride (HCl) and sodium hydroxide (NaOH) also were purchased from Merck co.
2.2 Preparation of BiVO4
Hydrothermal method was used to synthesis BiVO4 powder. In this method, the precursors of BiVO4 nanoparticle including 0.02 mol of Bi(NO3)3·5H2O, and NH4VO3 were dissolved in a proper solvent. Combining the two solutions and kept under stirring for 2 h to obtain homogeneous solution at room temperature was the next step. Then, the mixture was transferred into an autoclave and then heated to 180 °C for 24 h. The products were calcined using furnace at 500 °C for 5 h to get a yellow powder.
2.3 Preparation of BiVO4/TiO2
BiVO4/TiO2 nanocomposites were prepared by hydrothermal method. The as-prepared BiVO4 powder was added at five different percentage ratios of BiVO4/TiO2: 10:90, 20:80, 30:70, 40:60, and 50:50, respectively. These different percentage ratios of nanocomposite were transferred to an autoclave and were heated to 180 °C for 24 h. After cooling, the prepared nanomaterial was repeatedly washed with ethanol and distilled water and then was dried at 80 °C for 6 h. Finally, the dry materials transferred to a furnace at 400 °C for 2 h, thereby forming BiVO4/TiO2composite.
2.4 Analysis
To prepare the stock solution of the investigated dye and preparing a calibration curve, 1 g of the AO10 powder was poured to 1000 mL of distilled water and the experiments were continued by preparing different dilution series. All measurements were performed after adsorption experiments using UV/vis spectrophotometer model DR-5000, HACH LANGE, USA, λmax = 475 nm. Adsorption of the dye on the nanomaterials was determined by the following equation:
Mineralization was also performed to measure the amount of bismuth by ANATOC ™ Series II device manufactured by SGE Australia with a diagnostic range of 0.05–5000 mg/L in optimal conditions and ultimately the final concentration was obtained. The amount of mineralization was estimated using the following equation:
2.5 Experimental design and procedure of response surface methodology (RSM)
The study was based on the central composite design (CCD) as a subset of the response surface methodology in DOE. The variables considered in this study are dye concentration, initial pH, reaction time and catalyst dosage. Using the design, the combined effect of all 4 variables on the percentage of dye removal, which will be mentioned in this design as the response, was studied and modeled at the same time. To optimize the process, a model in experimental design software was selected to combine all independent and dependent variables together under optimal conditions. The optimal objectives for designing the optimal range of experiments for the variables studied in this work were set in the whole range of their changes and the percentage of dye removal in the maximum value to obtain the maximum percentage of dye removal. The method of designing the experiment was that based on previous studies and additional experiments, the desired range of changes for each variable was introduced to the program. Each variable was coded according to the intended range in five levels with the program, which can be seen in Table 1 of the range of experiments and levels of independent variables.
Independent variables
Ranges and levels
−2
−1
0
+1
+2
Concentration of dye (mg/L) (A)
10
20
30
40
50
Initial pH (B)
3
4.5
6
7.5
9
Reaction time (min) (C)
10
90
180
270
360
Catalyst dosage (g/100 mL) (D)
0.05
0.1
0.15
0.2
0.25
2.6 Experimental procedure
To perform the removal experiments, a Pyrex glass vessel containing different concentrations of dye and different doses of nanomaterials as a reactor was used. Also, an ultraviolet lamp with a peak emission wavelength of 247 nm, UV-C type, with a power of 12 W made by Philips company, as well, a 12 W LED lamp (white light, light intensity = 28 mW/cm2, wavelength emission = 400–600 nm) as sources for UV and visible radiation, respectively, were used. During the photocatalytic degradation process of AO10 dye, the contents of the reactor were mixed with a magnetic stirrer and at the time specified by the pipette, the solution was sampled from the surface and the amount of dye removal was determined using a spectrophotometer.
2.7 Analytical procedure
In this study, fourier transform infrared spectroscopy (FTIR), tensor 27-equinox 55 model, Bruker company spectrophotometer was used to analyze and identify the functional groups and the infrared spectrum was recorded in the range of 400 to 4000 cm−1. FE-SEM image was obtained by field-emission scanning electron microscope, the MIRA3 model, TESCAN Co., with a resolution of 1.5 nm at 15 KV and 4.5 nm at 1 KV voltage model. In addition, for X-ray diffraction analysis, D8 advanced device made in the Germany with a Cu Kα radiation (λ = 1.7890 Å at 40 kV and 40 mA (was used. The Brunauer-Emmett-Teller (BET) method analysis was used to determine the pore size and pore volume of the prepared nanocomposite. The energy dispersive X-ray (EDX) analysis was used to determine the elements present and their dispersion in the structure of the nanocomposite. UV–vis diffuse reflectance spectra (DRS) of the samples were measured with a Shimadzu UV-3600 spectrophotometer, which was employed as a reference sample in BaSO4 reflection mode.
3 Results and discussion
3.1 Catalyst characterizations
In order to determine the crystalinity of the as-prepared BiVO4/TiO2 samples, XRD diffractions patterns was carried out and the results showed in Fig. 1. The high crystallization of the as-prepared BiVO4 catalysts with sharp distinct peaks in the XRD patterns are shown in the figure is confirmed and was completely in good agreement with the data obtained from the JCPDS card number 14–0688 of the single-phase monoclinic scheelite (m-BiVO4). The main and strongest diffraction peak related to the crystalline structure of BiVO4 was exhibited at angel 21° (1 2 1) for different percentages of BiVO4/TiO2. According to Fig. 1, the diffraction peaks of different contents of BiVO4/TiO2 hetrosteructure nanocomposite illustrated only the characteristic peaks of TiO2 nanoparticle anatase phase activity, indicating that the combination of these two nanoparticles retains the crystalline structure of titanum dioxide. For all synthesized samples of BiVO4 or different ratios of BiVO4/TiO2 in their XRD patterns, no impurities were observed, indicating that the BiVO4 nanoparticles were well dispersed on the TiO2 surface. In this work, it is clear that when the BiVO4 content is increased, the diffraction intensity of the samples reduces, which leads to a decrease in the crystallization of TiO2. To better understand, Zhang et al., (Zhang et al., 2014) reported that the presence of more defects in the surface of the matrix is one of the main reasons for the reduction of nanoparticle crystallization. The authors further state that these defects could affect the photocatalytic property and seriously impair it. Many similar previous studies have shown that high crystallization and small particle size is beneficial for the photocatalytic activity of contaminant removal and the results of the following dye removal are consistent with these previous studies (Kato et al., 2003; Zhou et al., 2011; Joo et al., 2012).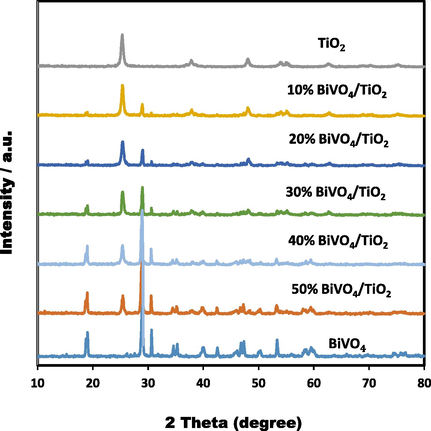
XRD patterns of different ratios of BiVO4/TiO2 with BiVO4 and anatase TiO2.
The field-emission scanning electron microscope images of TiO2, BiVO4, 10% BiVO4/TiO2 and 50% BiVO4/TiO2 sampels are represented in Fig. 2. According to Fig. 2a, TiO2 nanoparticles have asymmetrical and angular shapes and homogeneous polyhedral BiVO4 with visible holes are depicted in Fig. 2b. The morphology of the as-prepared 50% BiVO4/TiO2 and 10% BiVO4/TiO2 nanocomposites under hydrothermal conditions are shown in Fig. 2c and Fig. 2d and 2e, respectively. Fig. 2c is similar to Fig. 2a due to the higher concentration of TiO2 particles, which are dispersed upwards with heterogeneous sizes and cause a random distribution of grain agglumeration. From Fig. 2d and 2e, it can be clearly seen that the BiVO4/TiO2 composite is composed of spherical displays with a size of 19–56 nm. The fine size of composite plus its high crystallization can be very helpful for photocatalytic activity and facilitate the removal of contaminants to an acceptable level. This figure also shows that spherical TiO2 nanoparticles are attached to the polyhedral surface of BiVO4 nanoscale without agglomeration. Based on the above results, the sample synthesized from two nanoparticles of TiO2 and BiVO4, all indicated compatibility with XRD results. In Fig. 2f, the EDX analysis can be seen to determine the available compounds of the synthesized 10% BiVO4/TiO2 sample. The results of this analysis showed that only oxygen, titanium, vanadium and bismuth were present in the synthesized samples.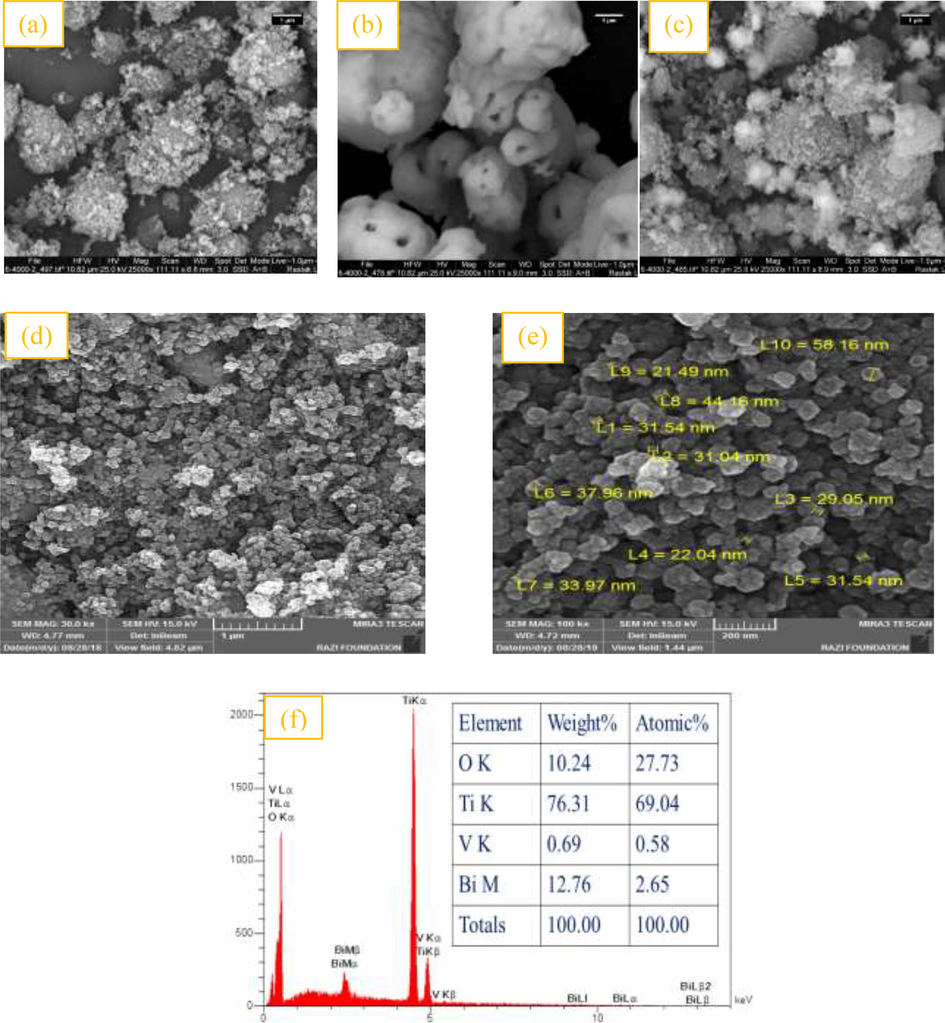
FE-SEM images of: (a) TiO2, (b) BiVO4, (c) 50% BiVO4/TiO2, (d) and (e) 10% BiVO4/TiO2, (f) EDX pattern of 10% BiVO4/TiO2.
In order to study the functional groups and molecular structure of the studied nanomaterials, a FT-IR device was used in this work, which is shown in Fig. 3. From Fig. 3a, 3c and 3d, it can be seen that the index peaks of about 3407 cm−1, 1633 cm−1 and 600–1000 cm−1 are related to TiO2, which are related to the stretching vibrations of O—H groups, the bending vibrations of H2O molecules and Ti—O—Ti vibration, respectively (Venkatachalam et al., 2007; Zhu et al., 2007). The adsorption bands of BiVO4 at wavelengths of about 480 cm−1 and 726 cm−1 are related to the VO43− symmetry bending and the asymmetric stretching vibration of the V—O—V band, which are seen in Fig. 3b, 3c and 3d, respectively (Zhang and Zhang, 2009; Dong et al., 2014). Also, considering Fig. 3c and 3d, a clear decrease in wavelength of 477.296 cm−1 to 439.939 cm−1 is observed, which is related to the reduction of BiVO4 concentration in BiVO4/TiO2 nanocrystallin hetrostructure from 50% to 10%. This achievement is consistent with the results of research by Zhu et al (Zhu et al., 2017).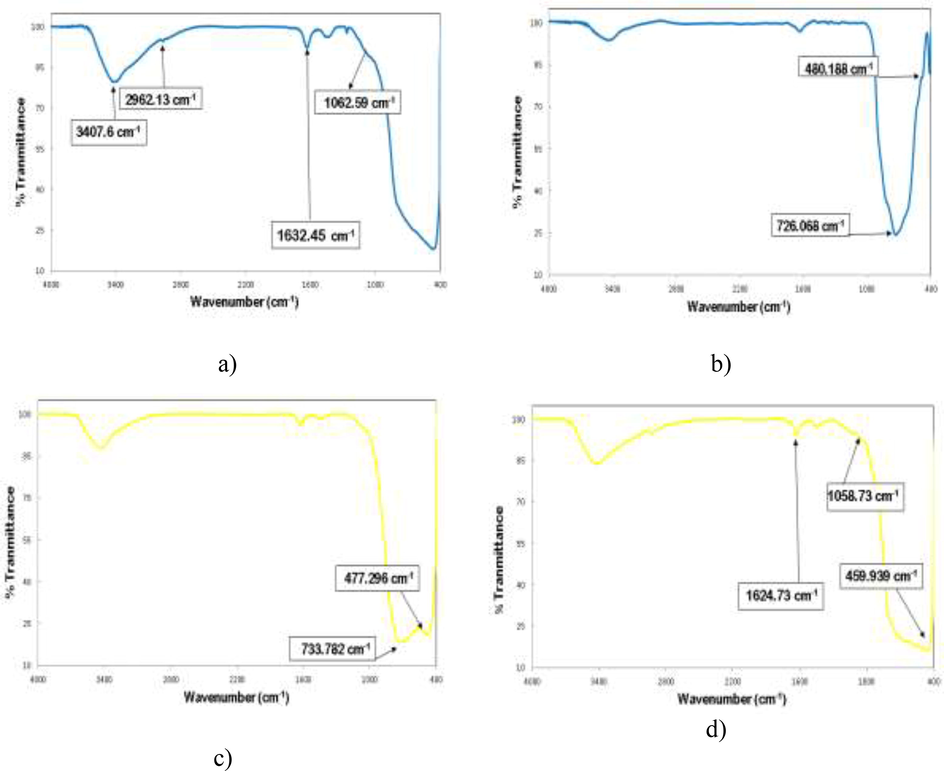
FT-IR spectra of: a) TiO2; b) BiVO4; c) 50% BiVO4/TiO2; and d) 10% BiVO4/TiO2.
The DRS patterns TiO2, BiVO4 and the different ratios of the BiVO4/TiO2 nanocomposite are shown in Fig. 4 present the BiVO4/TiO2 hetrujunction obviously increases the absorption intensity of visible light compared to two nanoparticles of BiVO4 and TiO2. Here, 10% BiVO4/TiO2 offers further development regarding visible light absorption (visible area, >400 nm) with estimated band gap value of 2.47 eV, indicating the significant role of low BiVO4 content in reducing the band gap. The absorption edge of TiO2 show a slight red shift and located at about 387 nm, corresponding to the band gap energy of 3.2 eV. Therefore, according to the above topics, it can be stated that the manufactured 10% BiVO4/TiO2 has the potential to perform an effective photocatalytic activity as a superior photocatalyst in the visible region.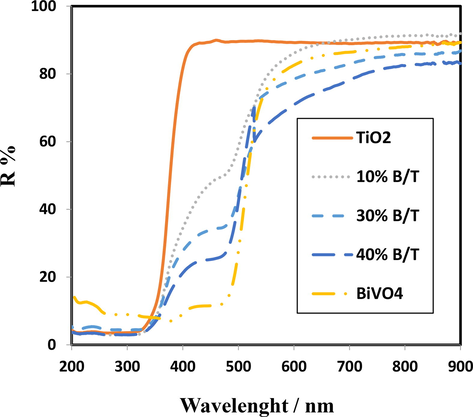
The UV–vis DRS spectra of TiO2, BiVO4 and the different contents of the BiVO4.
The Brunauer-Emmett-Teller (BET) method analysis was used to determine the amount of nitrogen gas adsorption–desorption by the surface of the material at a constant nitrogen temperature (77 K) for the as-prepared 10% BiVO4/TiO2 hetrojunction nanocrystalline that was carried out to mesurement the specific surface areas, and the pore size with an average crystallite pore size was 19.67 nm. The specific surface area and total pore volume of this nanomaterial was determined to be 71.01 m2/g and 0.49 cm3/g, respectively, indicating that the as-made catalyst was a nanoporous feature. In this research, the 10% BiVO4/TiO2 studied had a higher specific surface area compared to wetchakun et al., (Wetchakun et al., 2015) findings, which can cause higher adsorption of the desired pollutant.
In general, based on the catalyst characteristic findings of the above results, it can be concluded that the as-made 10% BiVO4/TiO2 as a nanosphere catalyst is very sensitive, has a low band gap characteristic, and is able to effectively harvest radiate with long wavelengths. These properties lead to the synthesized BiVO4/TiO2 catalyst acting as an efficient photocatalyst.
3.2 Pre-tests for selection of the best catalyst
The selection of the best catalyst was based on achieving the highest AO10 hazardous dye removal efficiency. Thus, for further analysis, the individual and synergistic effects of the components were evaluated and are shown in Fig. 5 for comparison proposes. The results showed that TiO2 alone did not have good catalytic activity both under visible light and non-visible light and only was able to remove about 2% of the dye by adsorption of dye. As shown, BiVO4 and BiVO4/LED brought about 5.09% and 23.57% AO10 removal efficiencies, respectively. The percentage of deletions obtained indicates the principle that photocatalytic activity can be significantly improved by BiVO4 coupling. So, all synthesized BiVO4/TiO2 nanocomposites; displayed much better photocatalytic activities, far greater than the single components. When the BiVO4 content in the composite is 10%, the catalytic activity is the best and the removal of AO10 after 90 min of reaction reaches about 81.97%. While the BiVO4 content in the composite reaches 50%, the sample exhibits a weaker photocatalytic activity and the AO10 removal rate only reaches 44.39%. As the percentage of BiVO4 content in the composite increased from 10% to 50%, a decrease in catalytic activity in dye removal was observed. The reason for this can be attributed to the lack of heterojunction of some BiVO4 particles during the hydrothermal process with TiO2, when BiVO4 was superfluous. This claim is in line with a study conducted by Lv et al., (Lv et al., 2019), which reached similar conclusions. They also went on to point out that by increasing the percentage of BiVO4 content in the composite during the visible light reaction process, BiVO4 particles may act as recombination centers by light and created electron-hole pairs reduce the catalytic activity of RhB dye removal by BiVO4/TiO2. Therefore, to illustrate the superiority of 10% BiVO4/TiO2, the two forms are reported comparatively with the other photo-catalysts in Fig. 1(a and b). This indicates that 10% BiVO4/TiO2 actually performs excellent performance in visible light and used for further experiments. However, in order to eliminate higher dye concentrations and also to save more time during the reaction, other materials can be used according to the hierarchy method, such as aeration, H2O2, FeSO4, and FeCl3, which is described in details in the following sections on the photocatalytic system.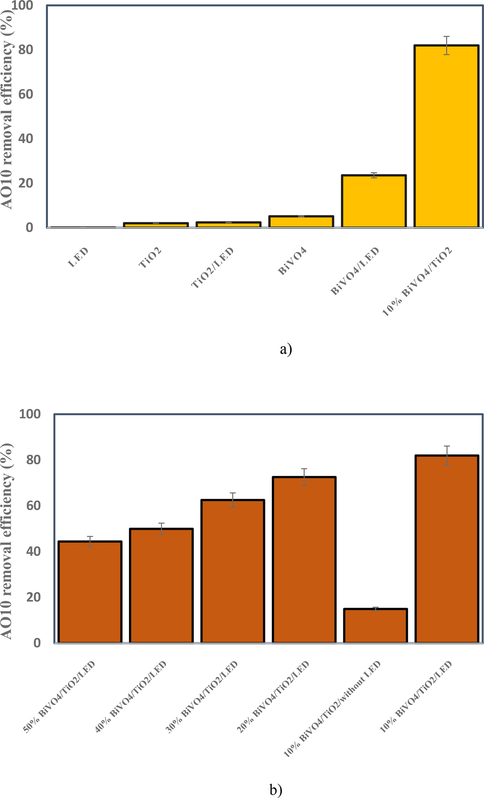
Selection of the best catalyst. (Natural pH, 10 mg/L AO10, 0.2 g/100 mL catalyst and 90 min).
3.3 The Influence of independent variables
3.3.1 Influence of initial pH of the photocatalytic reaction solution
The pH of dye solutions plays an important role in photocatalytic processes, which it can be noted that when the number of dye molecules adsorbed on the surface of the BiVO4/TiO2 composite, the removal rate of the dye molecules will increase, due to various parameters such as: 1) adsorbent surface charge; 2) size of the photo-catalyst aggregation; 3) ionization rate of substances in solution; 4) the concentration of hydroxyl radicals; 5) separation of functional groups in adsorption sites; and also 6) electrostatic adsorption at the BiVO4/TiO2 composite surface.(Habibi et al., 2005; Özacar and Şengil, 2005; Natarajan et al., 2011; Rahimi et al., 2019). In order to investigate the effect of pH of the reaction solution on the acid orange 10 dye removal efficiency, the pH of the photocatalytic reaction solution between 3 and 11 was selected differently. For the required changes in the acidic and alkaline conditions of the reaction solution, the appropriate amount of NaOH and HCl at a concentration of 0.2 mol/L were added. The results obtained in Fig. 6a presents that 10% BiVO4/TiO2 nanocomposite has a higher removal efficiency at lower pH of the photocatalytic reaction solution against AO10 dye molecules. This nanocomposite showed removal efficiencies of about 94.06% at pH = 3 and 77.34% at pH = 5. The reason for the decrease in removal efficiency at higher pH maybe is the decrease in dye adsorption on the surface of photo-catalyst particles (Dehghani et al., 2019). Based on the 10% BiVO4/TiO2 zero charge point, the more acidic the pH, the more positively charged the surface of the photo-catalyst particles surface will be, and the higher the alkaline pH, the more negatively charged the particles surface will be (Wang et al., 2011). In this regard, according to the experiments, it was determined that the pHzpc of the studied photo-catalyst is 6.9 (Fig. 6b). As a result, at pH > 6.9, the adsorbent surface has a negative charge and at pH < 6.9, the adsorbent surface is covered with a positive charge. Therefore, according to the above, the electrostatic attraction between the adsorbent and the dye is the main factor in increasing the adsorption capacity in acidic conditions. Referring to the results obtained in section 3.10 of the experiments, to determine the most important scavenger, h+ played a major role in AO10 dye removal, which can be explained as apparently through the production of more ROS (Reactive Oxygen Species) and direct electron transfer to the AO10 has enhanced the oxidation power (Rahimi et al., 2019; Ribao et al., 2019). At high pH, the adsorption action is not optimal due to the presence of electrostatic repulsion forces between the anionic dye molecules and the negatively charged sites on the adsorbent surface. Because in alkaline pH, the production of hydroxide functional groups in the environment will increase, which will lead to a negative electric charge on the adsorbent surface. Therefore, there will be weak interaction or even repulsive force between the dye and the adsorbent surface, which will reduce the amount of adsorption (Zhang et al., 2018; Abidi et al., 2019). Also, regarding the pKa of acid orange 10 dye, it was anionic in all experimental stages of this study and as a result in acidic pH, it is better to adsorb the surface of positively charged photo-catalyst particles and the removal process in acidic pH is much more effective than alkaline pH, which is completely consistent with the study conducted by Hassan et al.,(Hassan et al., 2020). They obtained the most suitable pH by using SnO2/CeO2 nanocomposite to remove the alizarine dye from the aqueous solution, pH of 3.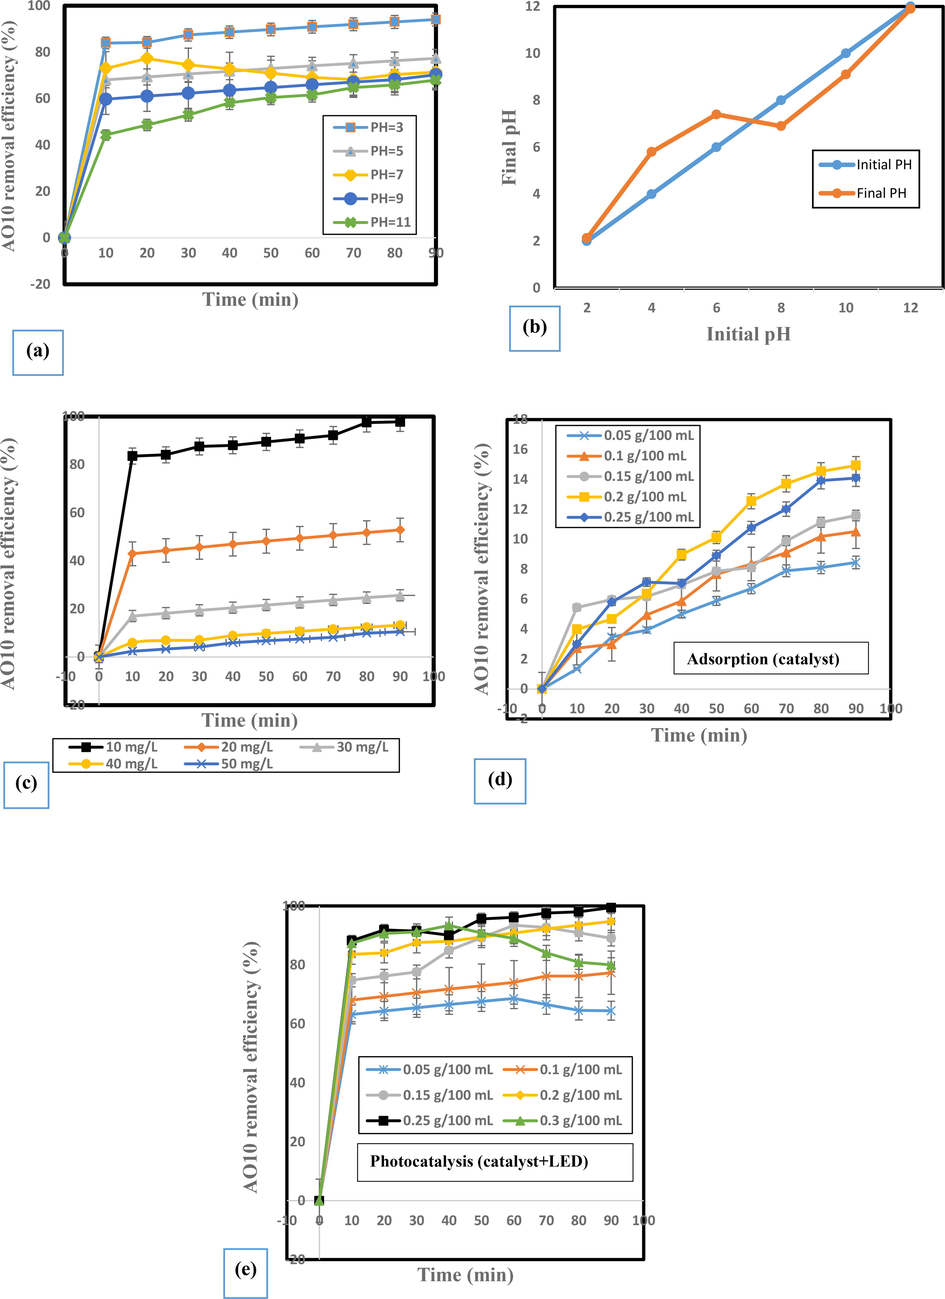
Influence of independent variables on AO10 removal efficiency: a) initial dye concentrations (pH = 5, 0.2 mg/100 mL catalyst); b) initial solution pH (10 mg/L AO10, 0.1 mg/100 mL catalyst); c) adsorption conditions; and d) photo-catalysis conditions.
3.3.2 The Influence of initial AO10 concentration and photo-catalyst dosage in the photocatalytic reaction solution
To determine the dependence of initial AO10 concentration on the photocatalytic removal ability of 10% BiVO4/TiO2 photo-catalyst, the effect of initial concentration of AO10 dye molecules on its removal efficiency has been studied by 10% BiVO4/TiO2 nanocomposite heterostructure. Fig. 6c illustrates the photocatalytic removal efficiency of 10% BiVO4/TiO2 photo-catalyst at different initial concentrations of AO10 dye from 10 to 50 mg/L. Experimental results showed that 10% BiVO4/TiO2 nanocomposite has the ability to remove higher dye at lower AO10 concentrations. As the concentration of AO10 in the photocatalytic reaction is increased, the photocatalytic removal efficiency of 10% BiVO4/TiO2 gradually decreased from 97.79% at 10 mg/L to 10.53% at 50 mg/L of AO10. The removal of AO10 molecules strongly depends on the formation of OH• radicals on the surface of the 10% BiVO4/TiO2 composite and the probability of a reaction between the AO10 molecules and the OH• radicals produced in the aqueous solution. In addition, the intensity of the photons entering the reaction solution decreases at higher concentrations of AO10 molecules, resulting in less photon absorption by the 10% BiVO4/TiO2 composite (Yao et al., 2013; Shanavas et al., 2017). Therefore, with less absorption of photons by the 10% BiVO4/TiO2 composite, the removal rate of AO10 molecules naturally decreases and can directly affect the removal efficiency. In this regard, higher initial concentrations of AO10 molecules also affect the adsorption of O2 and OH− at the surface of the 10% BiVO4/TiO2 catalyst. The influence of the initial dose of 10% BiVO4/TiO2 on AO10 dye removal performance was studied with different ranges from 0.05 g/100 mL to 0.3 g/100 mL and the results are shown in Fig. 6d and 6e. The 10% BiVO4/TiO2 photo-catalyst showed 64.46% and 99.44% removal efficiencies of 0.05 g/100 mL and 0.25 g/100 mL, respectively, within 90 min (Fig. 6e). The reason for further elimination is the greater availability of the total active surface of the 10% BiVO4/TiO2 composite at its highest dosage. In addition, the density of 10% BiVO4/TiO2 composite in visible light increases the probability of light absorption harvesting, resulting in the production of more active species to remove the AO10 molecule. It was also observed in Fig. 6e that at higher doses of the catalyst, especially at about 0.3 g/100 mL, the reduction in AO10 removal decreases in the duration of 50 min as opposed to expected, resulting in a lower reaction rate and less AO10 removal. This can be explained by the fact that too much catalyst in the solution causes turbidity and prevents light on the surface of the catalyst, while there must be enough surface area for the reaction to occur. Similarly, by adding extra catalyst with fewer photons, it overcomes the adsorption and the removal process slows down the photo-catalysis (Nosaka and Nosaka, 2017). The individual effect of a photo-catalyst in the absence of LED was also studied and the data are illustrated in Fig. 6d. Compared to previous conditions in which 99.44% AO10 removal was observed, performance in the absence of LED was reduced to 14.93% within 90 min. Thus, the synergistic action of 10% BiVO4/TiO2 and LED was strongly demonstrated (99.44% AO10 removal in 90 min).
3.4 RSM design for the preparation of the 10% BiVO4/TiO2 nanocomposite
RSM as a set of statistical methods, is one of the best methods for optimizing various parameters that have several advantages such as availability of raw materials, saving time and reducing the number of experiments. Here, we focused mainly on initial AO10 concentration, initial pH, reaction time, and catalyst dosage. The above four parameters are considered for the study of five different parameters such as mean square, degree of freedom, sum of squares, F-value and P-value. Experiments were performed using software to check the amount of dye removal by considering the variables at different levels, in each of which, the response as an objective function, the amount of dye removal was considered. In this case, by performing a limited number of experiments, a quadratic function model for the amount of dye removal is proposed, which can well investigate the effect of each of the selected variables and their interference effects in the response. Using the obtained function and model, the amount of dye removal can be determined at different levels of each of the variables in the selected range, and also the values of each variable can be determined at the optimal point where the highest amount of dye removal occurs. In this research, first the best model is selected to investigate the amount of dye removal and then using the obtained model, the effect of each of the considered variables is investigated. According to the results obtained from Table 2, the quadratic model is proposed by the software.
Source
df
Sum of squares
Mean squares
F-value
p-value
Mean vs total
1
26361.82
26361.82
Linear vs Mean
4
9202.90
2300.73
23.42
< 0.0001
2FI vs Linear
6
226.21
37.70
0.3112
0.9177
Quadratic vs 2FI
4
1719.47
429.87
12.64
0.0001
Suggested
Cubic vs Quadratic
8
108.84
13.61
0.2372
0.9695
Residual
7
401.65
57.38
Total
30
38020.91
1267.36
Then, using the results obtained from the analysis of variance table with RSM, the following quadratic polynomial function was obtained:
The results of the analyzed experiment using the interaction between each independent variable for the removal of AO10 dye and the results of ANOVA are shown in Table 3 and Table 4, respectively. Subsequently, the assumption of the final regression model was confirmed by Anderson-Darling, Breusch-Pagan and Durbin-Watson tests, which its P-values were 0.21, 0.73 and 1.67, respectively, and showed the superiority of the model in this process. Also, Coefficients in terms of actual values illustrated in Table 5. The bolded values shown in Table 5 indicate the significant main variables (dye concentration, pH, time and catalyst dose) and a significant quadratic member (dye concentration2). The order of significance of these factors was determined based on the estimated values: dye concentration and dye concentration2 > catalyst dose > Time > pH > pH2 > dye concentration* Catalyst dose > Dye concentration* pH > pH* Catalyst dose > dye concentration* Time > Catalyst dose2 > Time* Catalyst dose > Time2 > pH*Time. Also, due to the accumulation in the repetition of the measurement, it was found that the confidence intervals are slightly longer for all coefficients. In this regard, the regression coefficient standing with the square member of dye concentration2 is estimated at 7.26 and the confidence interval is 4.91–9.62.
Run
Std
A
B
C
D
AO10 removal (%)
Exp.
Pred.
1
13
20
4.5
270
0.2
77.05
70.84
2
5
20
4.5
270
0.1
51.41
51.60
3
18
50
6
180
0.15
14.28
15.78
4
2
40
4.5
90
0.1
10.25
8.75
5
24
30
6
180
0.25
28.47
35.66
6 (C)
28
30
6
180
0.15
21.75
22.31
7
4
40
7.5
90
0.1
9.11
8.35
8 (C)
29
30
6
180
0.15
25.93
22.31
9
6
40
4.5
270
0.1
16.77
12.76
10
21
30
6
10
0.15
5.75
11.39
11 (C)
26
30
6
180
0.15
22.33
22.31
12
9
20
4.5
90
0.2
61.64
56.65
13
8
40
7.5
270
0.1
12.37
12.84
14
20
30
9
180
0.15
17.76
23.48
15
7
20
7.5
270
0.1
49.05
44.01
16
3
20
7.5
90
0.1
38.47
33.78
17 (C)
27
30
6
180
0.15
17.89
22.31
18
11
20
7.5
90
0.2
44.23
41.27
19
10
40
4.5
90
0.2
17.68
15.75
20
14
40
4.5
270
0.2
24.01
24.19
21
17
10
6
180
0.15
77.87
87.85
22
1
20
4.5
90
0.1
46.58
41.85
23
22
30
6
360
0.15
21.97
26.06
24 (C)
25
30
6
180
0.15
20.07
22.31
25
19
30
3
180
0.5
33.03
38.79
26
15
20
7.5
270
0.2
58.94
55.93
27
23
30
6
180
0.05
12.46
16.75
28
16
40
7.5
270
0.2
19.19
16.95
29
30
30
6
180
0.15
26.52
22.31
30
12
40
7.5
90
0.2
12.73
8.03
Source
Sum of squares
df
Mean square
F value
P-value
Model
10894.48
14
778.18
23.17
<0.0001
A
7791.85
1
7791.85
233.04
<0.0001
B
351.44
1
351.44
10.47
0.0055
C
421.10
1
421.10
12.54
<0.0030
D
536.57
1
536.57
15.98
<0.0012
AB
58.83
1
58.83
1.75
0.2055
AC
33.95
1
33.95
0.9812
0.3376
AD
61.00
1
61.00
1.82
0.1977
BC
0.2304
1
0.2304
0.0069
0.9351
BD
53.58
1
53.58
1.60
0.2258
CD
19.62
1
19.62
0.5844
0.4564
A2
1449.78
1
1449.78
43.17
<0.0001
B2
120.19
1
120.19
3.58
0.0780
C2
16.87
1
16.87
0.5021
0.4894
D2
20.25
1
20.25
0.6029
0.4495
Residual
503.69
15
33.58
Lack of fit
448.06
10
44.81
4.03
0.0687
Pure error
55.63
5
11.13
Core total
11398.17
29
Factor
Coefficient Estimate
Standard Error
P-value
Lower 95%
Higher 95%
Intercept
22.31
2.36
<0.0001
17.27
27.35
Dye conc.
−18.02
1.18
<0.0001
−20.54
−15.50
pH
−3.83
1.18
0.0055
−6.35
−1.31
Time
4.23
1.19
<0.0030
1.68
6.78
Catalyst dose
4.73
1.18
<0.0012
2.21
7.25
Dye conc.* pH
1.92
1.45
0.2055
−1.17
5.01
Dye conc.* Time
−1.43
1.45
0.3376
−4.52
1.65
Dye conc.* Catalyst dose
−1.95
1.45
0.1977
−5.04
1.14
pH*Time
0.12
1.45
0.9351
−2.97
3.21
pH* Catalyst dose
−1.83
1.45
0.2258
−4.92
1.26
Time* Catalyst dose
1.11
1.45
0.4564
−1.98
4.20
Dye conc.2
7.26
1.10
<0.0001
4.91
9.62
pH2
2.09
1.10
0.0780
−0.26
4.45
Time2
−0.82
1.16
0.4894
−3.29
1.65
Catalyst dose2
0.85
1.10
0.4495
−1.50
3.21
As can be seen from the normal graph of the residuals and the graphical representation of the values of the observed data versus predicted values (Fig. 7a and 7b), the obtained regression model fully explains the studied experimental range. Given these figures, it is clear that the degree of difference in the results in all experiments was not significant, which also shows that the results of the model and experimental data are very consistent with each other and the model can be used with confidence.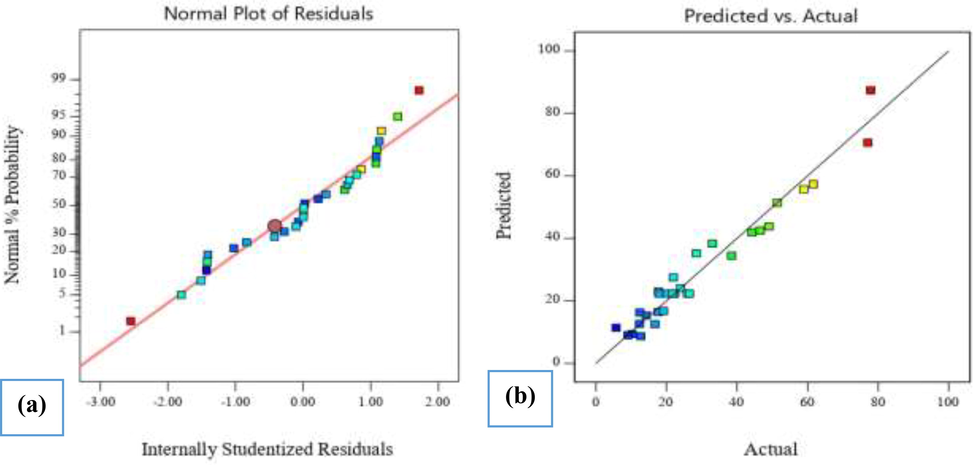
Model evaluation plots for AO10 dye removal by 10% BiVO4/TiO2: a) the normal plot of residuals; b) predicted vs. actual data.
3.5 Analysis of AO10 dye removal by three-dimensional contour plotting and response surface
The three-dimensional response surface or contour plots were applied for the analysis of the combined effects between independent variables (Mirzaei et al., 2018; Rahimi and Ebrahimi, 2019). Fig. 8 (a) to (c) graphically represents the significant graphical interactions of the extended model of AO10 dye removal parameters. From Fig. 8a, it has been observed that the AO10 dye removal efficiency for 10% BiVO4/TiO2 nanocomposite hetero-structure increases with increase in reaction time and decreases with further increase in initial dye concentration, while the 10% BiVO4/TiO2 dosage and pH values were kept constant at 10 mg/L and 7, respectively. Fig. 8b shows that the AO10 dye removal efficiency increases with increase in reaction time and decreases with further increase in initial pH due to the reduction of h+ ions in the reaction solution, while the 10% BiVO4/TiO2 dosage and AO10 dye concentration were kept constant at 0.1 g/100 mL and 10 mg/L, respectively. Fig. 8c illustrates the dependence of AO10 dye removal efficiency on reaction time and 10% BiVO4/TiO2 dosage. As can be seen, the removal activity increases with further increase in reaction time and catalyst dosage, together, by fixing AO10 concentration and initial pH at 10 mg/L and 7, respectively.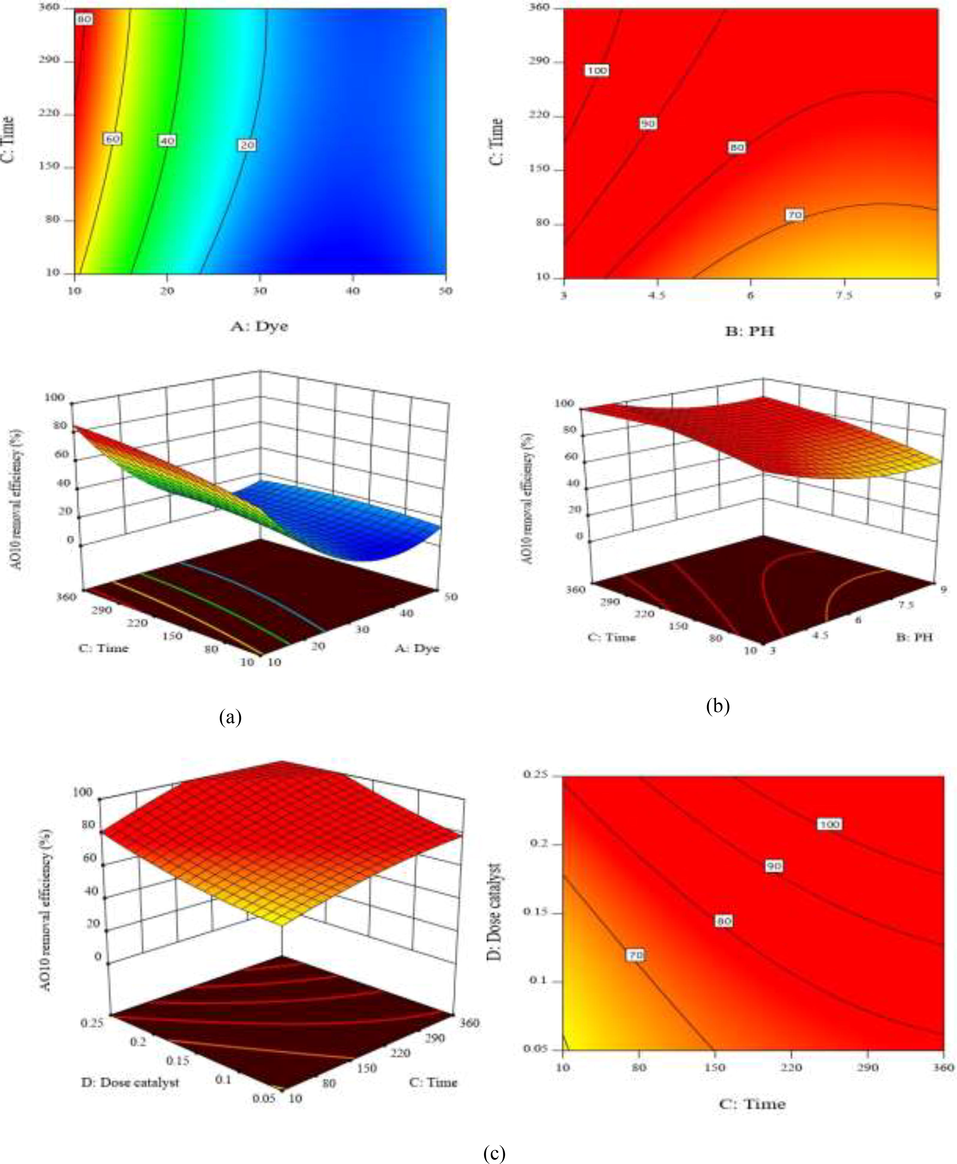
Response surface plot showing AO10 removal efficiency and reaction time versus: a) initial dye concentration; b) initial pH; and c) catalyst dosage.
3.6 Model optimization
Model optimization and finding the optimal amount of variables in the dye removal process by 10% BiVO4/TiO2 was done by software. For this purpose, in the software, the optimization conditions related to each variable and response were determined, and finally, all parameters were set in the range related to the design and the removal rate was set to the maximum value. Under these conditions, a dye concentration of 10 mg/L, pH of 5, reaction time of 90 min and catalyst dosage of 0.2 g/100 mL were predicted for dye removal. The experimental and predicted dye removal values under optimal conditions were 98.19 % and 97.38 %, respectively. In many studies using different processes due to the classical study and the lack of statistical model, a gap is created in the study, and that is the lack of determination of the relationship and interaction of the variables.
3.7 Investigation of adsorption isotherms
To determine the model of adsorption isotherms, experiments with different concentrations of AO10 dye (between 10 mg/L to 50 mg/L) were designed, which according to the optimization of experiments in the previous stages, with pH conditions equal to 5 in Ambient temperature and adsorbent value were 0.2 g/100 mL for each sample. The Langmuir model includes hypotheses such as monolayer adsorption, surface uniformity, and elimination of the interactions of adsorbed molecules (Ali et al., 2016). The Friendlich isotherm is also obtained by assuming a heterogeneous surface with a non-uniform distribution of heat absorption on the surface (Liu et al., 2014). For single-layer adsorption of the Langmuir equation as well as the Friendlich model, the adsorption process is defined by the following Eqs. (4) and (5), respectively:
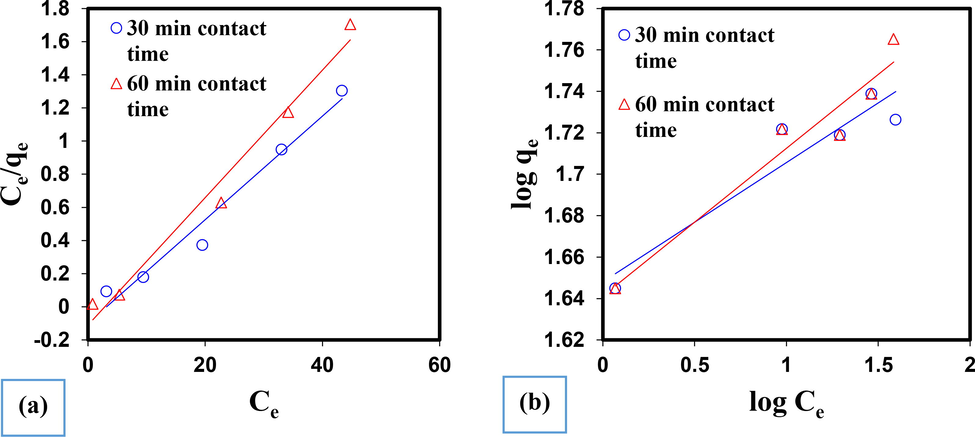
AO10 dye adsorption diagrams in a) Langmuir isotherm model and b) Freundlich isotherm model.
Langmuir model
Freundlich model
Time (min)
Qmax
KL
R2
KF
1/n
R2
30
31.98
0.0534
0.9722
3.5
0.0575
0.8925
60
37.59
0.2391
0.9817
4.1
0.0712
0.9379
3.8 Investigation of adsorption kinetics
Since by studying the kinetic of reactions, the adsorption mechanism and the rate-determining step can be understood, in the present work, pseudo-first-order and pseudo-second-order kinetic equations have been investigated. Adsorption kinetics are used to determine the control mechanism of adsorption processes. The mechanism of the adsorption process depends on the physical and chemical properties of the adsorbent. Eqs. (6) and (7) were used to investigate pseudo-first-order and pseudo-second-order kinetics, respectively (Zhao et al., 2020).
In general, pseudo-first-order and pseudo-second-order kinetic models are used to quantitatively express adsorption kinetics. Simply put, in a pseudo-first-order kinetic model, the rate of change of adsorption of the dissolved substance over time is directly proportional to the changes in saturation concentration and amount of adsorption over time. For pseudo-first-order kinetic, the relation of 6 the linear form of the first degree equation was used.
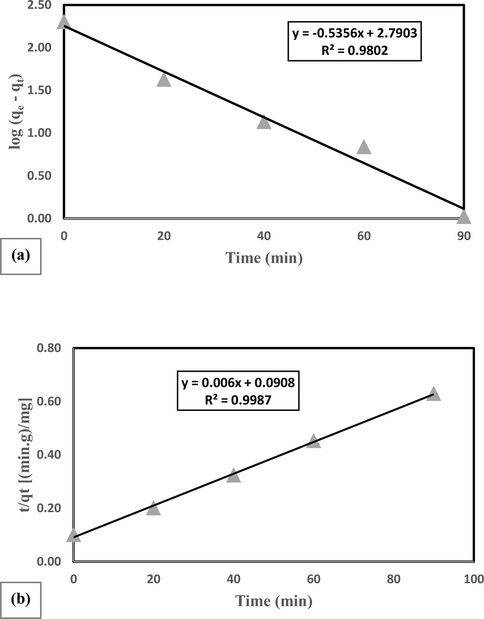
Plots of the applications of a) the pseudo-first-order kinetic model and b) the pseudo-second-order kinetic model to the data for the adsorption of AO 10 dye onto 10% BiVO4/TiO2 composite.
pseudo-second-order kinetic show that chemical adsorption is a phase-slowing step that controls surface adsorption processes and is based on solid phase adsorption in which the rate of adsorption sites is proportional to the square of the number of sites not occupied. For pseudo-second-order kinetic, Eq. (7) obtained by Ho and McKay was used.
Employing this equation and plotting versus t gives a straight line of slope and intercept (Fig. 10b).
Table 7 lists the rate constants for the pseudo-first-order (k1) and pseudo-second-order (k2) models, the equilibrium sorption capacity (qe) and the correlation coefficient (R2). The data show good agreement with the pseudo-second-order model compared to the pseudo-first-order model because it had a high correlation coefficient (0.9987). This suggests that the pseudo-second-order kinetic model demonstrates a better explanation of the kinetic adsorption data obtained in the present work. Accordingly, considering to the results, the behavior of AO10 adsorption, shows that AO10 adsorption is highly influenced by chemical mechanisms.
Pseudo-first-order
Pseudo-second-order
Catalyst
K1
qe
R2
K2
qe
R2
10% BiVO4/TiO2
0.0795
1.11
0.9802
0.0195
34.91
0.9987
3.9 Influence of anions
Anions in the aqueous environment and treatment processes are often considered to be influential factors. The presence of these anions may affect the treatment conditions especially ROS-based systems and those that benefit from the electromagnetic spectrum. Therefore, to evaluate the decreasing trend of AO10 removal, the effect of some typical anions on the performance of the 10% BiVO4/TiO2 process after 90 min reaction time was investigated. As presented in Fig. 11a, AO10 dye removal efficiencies in presence of sulfate, chloride, nitrate, carbonate and phosphate decreased to 94.01, 90.95, 77.55, 67.79 and 56.09%, respectively. On this account, sulfate and chloride showed the least suppressing effect in the removal process. The next anion called nitrate was able to reduce the process efficiency to 77.55%. The reason for this is that it can be related to the reduction of nitrate to nitrite in reaction with the electrons produced and the absorption of light, leading to a reversal of the reaction towards its re-oxidation to nitrate. Carbonate and phosphate reduced AO10 concentration to 67.79 and 56.09%, respectively, mostly due to their inhibitory effects on ROSs (Moradi and Moussavi, 2018).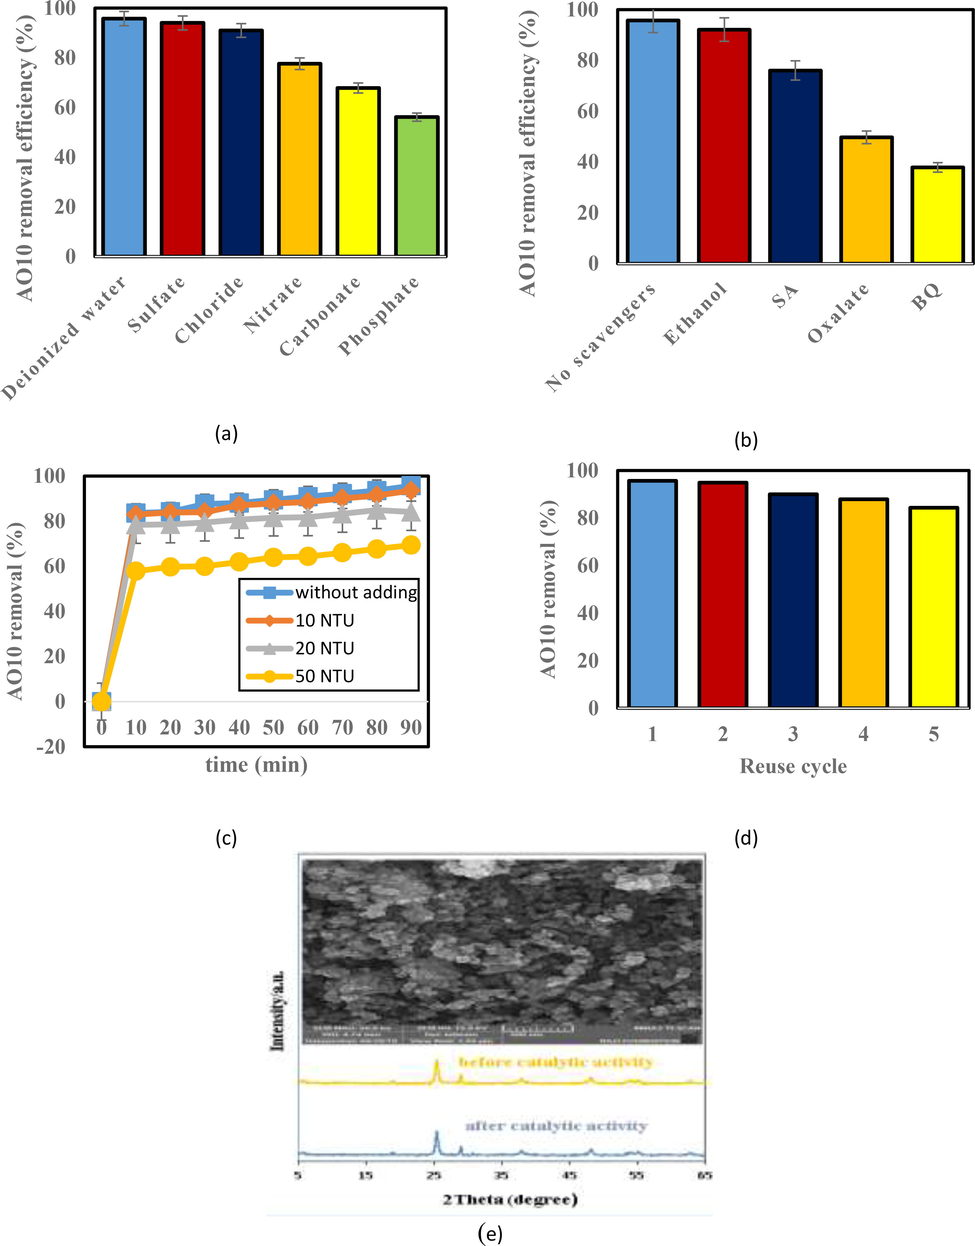
Influence of: a) anions; b) scavengers; c) turbidity; d) reusability of the catalyst; and e) XRD and FESEM after photocatalytic runs on AO10 removal efficiency (pH = 5, 10 mg/L AO10, 0.2 g/100 mL catalyst, 50 mg/L anion, 50 mg/L scavenger and reaction time = 90 min).
3.10 Influence of different radical scavenger compounds
In order to identify the type of dominant reactive species generated in the 10% BiVO4/TiO2 photocatalytic process, four kinds of typical reagent, ethanol (HO• scavenger), SA (1O2 scavenger), oxalate (h+ scavenger) and BQ (O2•− scavenger) were selected. At the presence of these compounds, the AO10 dye removal efficiency was decreased to 37.87%, 49.7%, 75.99% and 92.11%, respectively (Fig. 11b). O2•− (direct oxidation of AO10 and generation of 1O2) and then h+ were identified as the main factors responsible for AO10 removal. 1O2 has also played a notable role, while ethanol showed that HO• had a minor role in the removal of AO10.
3.11 Influence of turbidity
Turbidity is one of the main pollutants that can be present in industrial wastewater containing dye. This type of wastewater discharged from industrials can reduce the transmission of light to wastewater and ultimately reduce photosynthesis and the amount of dissolved oxygen in wastewater. In this regard, the effect of different turbidity amounts on the AO10 dye removal efficiency was investigated and the results are shown in Fig. 11c. According to the above, the reason for the decrease in dye removal efficiency can be stated that factors such as turbidity can interfere with the arrival of visible light to the catalyst and reduce the performance of the photocatalytic system.
3.12 Catalyst reusability
In terms of application, it is important to consider the recyclability and stability of a catalyst along with its catalytic activity (Mao et al., 2018). For this reason, first the as-made 10% BiVO4/TiO2 was used and then it was reused again for recovery in successive runs in the photocatalytic process. In each recycling period, parallel experiments were performed under the same conditions to obtain a sufficient amount of photo-catalysts to perform the next recycling test. As demonstrated in Fig. 11d, AO10 dye removal efficiencies in the 1st, 2nd, 3rd, 4th, and 5th runs were 95.72, 94.95, 90.03, 87.89 and 84.36, respectively. With these interpretations, the as-prepared 10% BiVO4/TiO2 had excellent reusability as well as photocatalytic stability after consecutive cycles. In the continuation of the work, for further confirmation and evaluation, the used catalyst was analyzed after 5 successive times. The XRD and FE-SEM analyses of the reused 10% BiVO4/TiO2 are illustrated in Fig. 11e. As shown in this figure, the major peaks of the 10% BiVO4/TiO2 were sharply observed in the reuse catalyst and also remained basically unchanged in the case of FE-SEM before and after 5 photocatalytic runs, indicating the high stability of nanocomposite during photo-catalysis process. Taking the above observations into account, it can be demonstrated that the surface characteristics and crystallization of the 10% BiVO4/TiO2 as a highly efficient photo-catalyst were stable after 5 consecutive photocatalytic cycles.
3.13 Catalytic mechanism
Based on the analysis of the above experimental results, the reaction mechanism of BiVO4/TiO2 composite for the removal of AO10 dye in the visible light can be suggested. The Catalytic mechanism was further investigated by estimating the band edge positions of the valence band (VB) and conduction band (CB) potentials of the BiVO4 and TiO2 samples according to the following experimental equations (Nethercot Jr, 1974; Butler and Ginley, 1978).
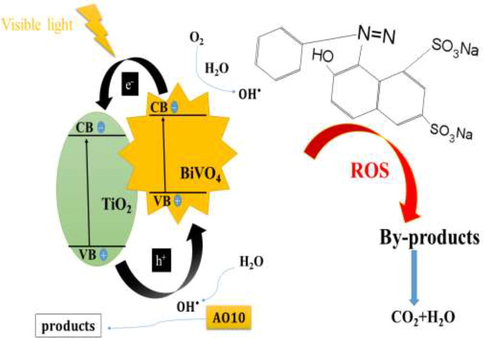
Reaction mechanism of BiVO4/TiO2 catalyzed removal of AO10 dye.
On the basic of the above experimental results, it can draw a conclusion that the photocatalytic reaction of prepared BiVO4/TiO2 heterojunctions, which could improve the photogenerated electron–hole pairs separation and reduction ability for efficiency removal of organic pollutants.
3.14 Influence of aeration rate and FeSO4 adding on AO10 removal
Effect of aeration in improving the photocatalytic removal process of AO10 dye by continuous air injection were studied with regard to 20 mg/L AO10 solution and 0.2 g/100 mL catalyst at pH of 5 at room temperature. For comparison, the amount of different aeration flows of 5, 10 and 20 mL/min was performed using 10% BiVO4/TiO2 nanocomposite in combination. Fig. 13a reveals that when aeration was performed in conjunction with nanocomposite, the removal efficiency of AO10 was slightly improved. In this study, aeration was continuously injected into AO10 solution to improve the reaction rate of the composite and further production of O2•− radicals, which in section 3.10 related to the effect of scavengers, it was revealed that O2•− radicals play the most important role in the photocatalytic process of the present study. It also disperses the catalyst into the aqueous solution during the aeration reaction to prevent the catalyst from aggregation. Accordingly, in 90 min with 20 mL/min aeration, removal efficiency was 66.91% comparing to 53.59% in non-aeration condition.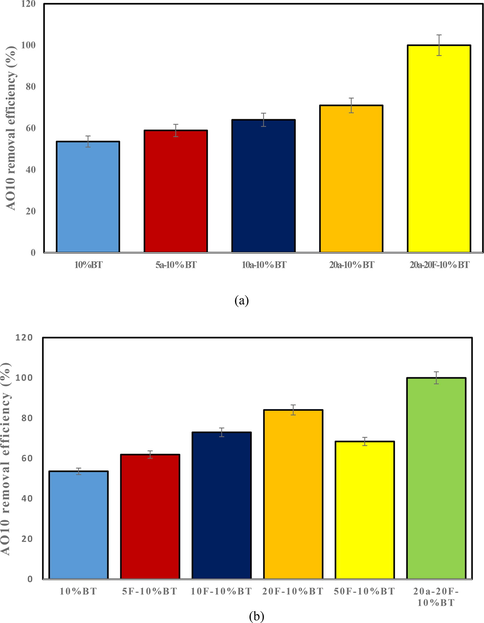
Influence of: a) aeration; b) FeSO4 loading, on AO10 removal efficiency.
The effect of adding FeSO4 ion on the removal of AO10 has been studied through varying the loading of FeSO4 ions in the range of 5, 10, 20 and 50 mg/L using 10% BiVO4/TiO2 nanocomposite in combination. Based on the results of Fig. 13b, it can be seen that the amount of iron ions can be one of the parameters affecting the Fenton process. By increasing the concentration of iron ions from 5 to 20 mg/L at 90 min, the de-colorization increased from 61.87.1% to 84.05%, respectively. This process of increasing dye removal with increasing iron concentration is similar to the results of research by Gan et al., (Gan and Li, 2013). In this study, the results of dye removal with Fenton-like oxidation system showed that increasing the catalyst concentration from 0.5 g/dm3 to 0.2 g/dm3, leads to a significant reduction in the amount of dye. However, the results of other studies have not shown a key role for iron concentration in the dye removal process. Hou et al., (Hou et al., 2011) investigated the effect of zero-valent iron concentration on the Fenton process to remove Rhodamine B dye. The results showed that this parameter does not play a key effect. So that with increasing the concentration of zero-valent iron from 0.25 to 1.5 g/L, the percentage of increase in dye removal was very small. In the continuation of the present study, with increasing the concentration of FeSO4 to 50 mg/L, the removal rate decreased (Fig. 13b). The reason for this is that with the increase of FeSO4, this substance has a destructive effect and causes the conversion of HO• radical to HO− ion according to Eq. (18):
The materials used at room temperature were 10% BiVO4/TiO2, 5 mL/min aeration/10 %BiVO4/TiO2, 10 mL/min aeration/10 %BiVO4/TiO2, 20 mL/min aeration/10 %BiVO4/TiO2, 5 mg/L FeSO4/10 %BiVO4/TiO2, 10 mg/L FeSO4/10 %BiVO4/TiO2, 20 mg/L FeSO4/10 %BiVO4/TiO2, 50 mg/L FeSO4/10 %BiVO4/TiO2 and 20 mL/min aeration/20 mg/L FeSO4/10 %BiVO4/TiO2 denoted by 10 %BT, 5a-10 %BT, 10a-10 %BT, 20a-10 %BT, 5F-10 %BT, 10F-10 %BT, 20F-10 %BT, 50F-10 %BT and 20a-20F-10 %BT, respectively. After adding two optimized aeration and FeSO4 parameters to the 10% BiVO4/TiO2 nanocomposite process, the performance of 20a-20F-10 %BT was generally greatly improved, capable of removing 99.99% of the dye under visible light. Considering the degree of de-colorization of AO10 dye in 90 min, the order of the reaction is as follows: 10 %BT < 5a-10 %BT < 5F-10 %BT < 10a-10 %BT < 50F-10 %BT < 20a-10 %BT < 10F-10 %BT < 20F-10 %BT < 20a-20F-10 %BT.
According to the above reaction order, the 20a-20F-10 %BT process had the highest efficiency in removing AO10 dye when it reached 99.99%, which shows the high superiority of this system over others. Much higher AO10 removal can be attributed to the production of efficient radicals to facilitate of Fenton-like excitation of H2O2.
3.15 Influence of H2O2 on AO10 removal
At the beginning, the effect of UV/H2O2 alone at a dose of 50 mg/L, pH = 5 on dye removal was investigated. In this experiment, it was not much dye removal observed. Then, the effect of H2O2 in the range of 20, 40 and 50 mg/L using 10% BT nanocomposite in combination was measured, but in this case, no high removal occurred. Therefore, further experiments were carried out with aeration and FeSO4. The effect of H2O2 concentration with 10% BT nanocomposite, aeration and FeSO4 on AO10 de-colorization was investigated and the results are illustrated in Fig. 14.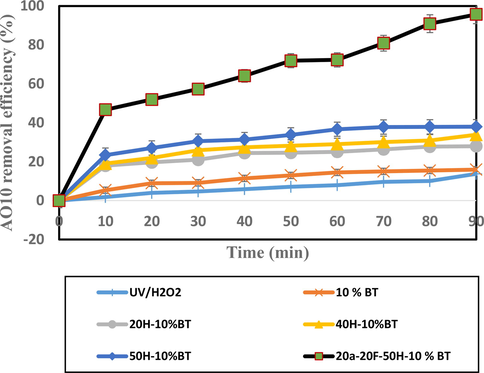
Influence of H2O2 on AO10 dye removal by different processes.
The materials used at room temperature were UV/H2O2, 10% BT, 20 mg/L H2O2/10 %BiVO4/TiO2, 40 mg/L H2O2/10 %BiVO4/TiO2, 50 mg/L H2O2/10 %BiVO4/TiO2, and 20 mL/min aeration/20 mg/L FeSO4/50 mg/L H2O2/10 %BiVO4/TiO2 denoted by UV/H2O2, 10 %BT, 20H-10 %BT, 40H-10 %BT, 50H-10 %BT, and 20a-20F-50H-10 %BT respectively. After adding three optimized aeration, FeSO4 and H2O2 parameters to the 10% BT nanocomposite process, the performance of 20a-20F-50H-10 %BT was generally greatly improved, capable of removing 95.71% of the dye under visible light. Considering the degree of de-colorization of AO10 dye in 90 min, the order of the reaction is as follows: UV/H2O2 < 10 %BT < 20H-10 %BT < 40H-10 %BT < 50H-10 %BT < 20a-20F-50H-10 %BT.
3.16 Mineralization study
In the discussion of using processes on an environmental scale, in addition to removing the contaminant in question, the efficiency of the process in reducing the load of organic pollution is also important. Fig. 15 shows the process of removing TOC in optimum condition by 20a-20F-50H-10 %BT. 95.71% AO10 removal rate was in 100 min while 87.39% mineralization occurred in 160 min reaction time. Accordingly, as expected, the removal of TOC showed a much slower reaction rate due to the formation of more resistent molecular structures or intermediate products, especially linear compounds and it will take more time to complete the mineralization (Babaei et al., 2017). However, these intermediate products can be further decomposed with longer reaction times to non-toxic CO2 and H2O.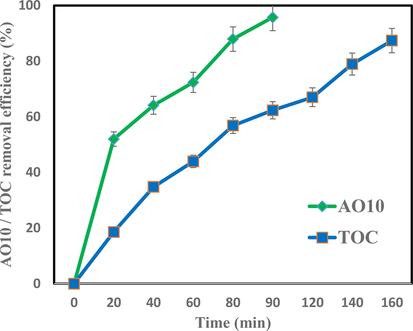
AO10 and TOC removal efficiencies by 20a-20F-50H-10 %BT (pH of 5, 50 mg/L AO10, 0.2 mg/100 mL 10% BT).
3.17 Comparison of the performance of different photocatalytic processes for the removal of dyes in the textile industry
Table 8 compares the performance of the developed system in this study (20a-20F-50H-10 %BT) with previously published photocatalytic processes for the removal of various dyes. As can be seen in Table 8, the removal of AO10 dye obtained in the system was much higher than in the other reported photocatalytic processes. This confirms that the 10% BT nanosphere has a much higher catalytic activity with aeration, ferrous sulfate and peroxide hydrogen compared to other dual and ternary catalysts. Accordingly, it was clearly established that the 10% BT nanospheres fabricated in the present study are a highly active catalyst that can be effectively activated even at different pHs using low-dose LED lamps. High catalytic activity with the positive points mentioned above along with low cost and low toxicity introduces the 10% BT composite as a promising catalyst for photocatalytic removal of contaminants in textile wastewater. *Visible light; **UV light; ***Methylene blue; ****Methylene orange; *****Rhodamine B.
Process
Textile pollutants
Removal (%)
Conditions
Wight of photocatalyst (g)
Solution concentration (mg/L)
Reaction time (min)
Irradiation source
Ref.
Fe3+-TiO2/FAC
MB***
50.0
1.800
20
–
Vis*
(Wang et al., 2011)
N-TiO2/FACs
MB
58.0
1.800
20
540
Vis
(Li et al., 2013)
Graphene–TiO2
MB
94
1
20
60
UV**
(Huimin et al., 2012)
La/TiO2–graphene
MB
>80
1
10
60
Vis
(Khalid et al., 2012)
ZnO/graphene
MB
72.1
0.5
10
56
UV
(Fan et al., 2012)
rGO–Bi2WO6
MB
93.5
0.5
15
90
Vis
(Xu et al., 2013)
CoFe2O4–graphene
MO****
71
0.25
20
240
Vis
(Fu et al., 2012)
Ag3VO4/TiO2/graphene
MO
81
1
10
180
Vis
(Wang et al., 2013)
S, NCo/ TiO2
MO
65
0.2
20
60
Vis
(Lv et al., 2013)
g-C3N4/NTiO2
MO
72.2
–
20
180
Vis
(Zhao et al., 2017)
Ag@Ag3PO-/rGO
MO
97
2
12
18
Vis
(He et al., 2013)
Graphene-neodymium/TiO2
MO
70
1
10
180
Vis
(Khalid et al., 2013)
Au@Mo–GO
RB*****
80
–
10
120
Vis
(Barras et al., 2013)
TiO2–dx–rGO
RB
>90
0.2
5
<60
UV
(Shi et al., 2012)
AgCI-TiO2
RB
95
0.2
12
180
Vis
(Huo et al., 2010)
PVP/BiOBr
RB
83
0.1
15
80
Vis
(Lin et al., 2014)
TiO2/C@SiO2
RB
95
0.02
19
100
Vis
(Chen et al., 2016)
Fe-N-TiO2/FACs-Cts
RB
93.1
0.2
8
240
Vis
(Song et al., 2017)
MnO2/TiO2
Brilliant Red X-3B
95
0.15
100
90
UV
(Zhang et al., 2009)
ZnO–Bi2O3/GO
Reactive Blue
44.23
0.5
10
120
Vis
(He et al., 2012)
20a-20F-50H-10 %BT
AO10
95.71
0.2
50
90
Vis
Present study
3.18 Coagulation/precipitation process for simultaneous removal of AO10 and 10%BT
In connection with the problems related to treatment by nanomaterials, it is necessary to separate them. The simplest possible suggestion is to use coagulant such as FeCl3 (Kagaya et al., 1999; Baran et al., 2005). This coagulant also appears to have excellent precipitation/removal capability for dye. Therefore, for simultaneous removal of AO10 dye and 10% BT by coagulation/precipitation processes, FeCl3 after catalytic reduction of dye was added with the following conditions: 0.2 mg/L catalyst, 50 mg/L AO10, pH of 5, 20 mL/min aeration, 20 mg/L FeSO4, 50 mg/L H2O2 and reaction time of 90 min. The variables mentioned in the 20a-20F-50H-10 %BT process were adjusted to simulate conditions that may exist in the real treatment conditions. Preliminary experiments showed that 90 min reaction time for the 20a-20F-50H-10 %BT process as well 1 h of sedimentation time related to the coagulation/precipitation process was sufficient to achieve 100% removal of 50 mg/L of dye. The results are summarized in Table 9 Without coagulation, complete removal of the dye and catalyst will not be done, in which FeCl3 demonstrated a high ability. Therefore, the combined usage of “20a-20F-50H-10 %BT + coagulation with Fe(III)” is recommended for the treatment of high concentrations of the dangerous AO10 dye in real conditions. Preoxidation conditions: 0.2 mg/L catalyst, 50 mg/L AO10, pH of 5, 20 mL/min aeration, 20 mg/L FeSO4, 50 mg/L H2O2 and reaction time of 90 min.
Fe (III) mg/L
Removal (%)
0
95.71
3
97.45
5
100
4 Conclusions
BiVO4/TiO2 heterojunction nanocomposite was hydrothermally synthesized and characterized by XRD, FESEM, EDX, FTIR, BET and DRS spectra. In this work, removal of acid orange 10 (AO10) azo dye in wastewater was investigated using 25 removal processes. Dye removals were evaluated for each oxidation system. Considering the degree of de-colorization of AO10 dye in 90 min, the order of the reaction is as follows: LED < TiO2 < BiVO4 < 10% BT/without LED < BiVO4/ LED < 50% BT < 40% BT < 30% BT < 20% BT < UV/H2O2 < 10% BT < 5a-10 %BT < 5F-10 %BT < 10a-10 %BT < 50F-10 %BT < 20a-10 %BT < 10F-10 %BT < 20F-10 %BT < 20H-10 %BT < 40H-10 %BT < 50H-10 %BT < 20a-20F-10 %BT < 20a-20F-50H-10 %BT.
In general, the processes that use H2O2 with FeSO4 get better results. The highest AO10 dye removal was achieved by the 20a-20F-50H-10 %BT process, which had an elimination of 95.71% at a concentration of 50 mg/L in 90 min. In the case of heterogeneous photo-catalysis using bismuth vanadate/titanium dioxide, the 20a-20F-50H-10 %BT process achieves better results for AO10 dye removal. The use of nanomaterials to remove dye requires a post-treatment in which BiVO4 and TiO2 must be removed from the wastewater. For this purpose, we used FeCl3 as a coagulant, and the result is that the combined use of nanomaterials and coagulation may be a practical solution for the treatment of dye contamination.
Acknowledgments
This research was financially supported by the Isfahan University of Medical Sciences (No. 196213).
Declaration of Competing Interest
The authors declare that they have no known competing financial interests or personal relationships that could have appeared to influence the work reported in this paper.
References
- Removal of anionic dye from textile industries' effluents by using Tunisian clays as adsorbents. Zeta potential and streaming-induced potential measurements. Compt. Ren. Chim.. 2019;22:113-125.
- [Google Scholar]
- Potential of using green adsorbent of heavy metal removal from aqueous solutions: adsorption kinetics, isotherm, thermodynamic, mechanism and economic analysis. Eco. Engin.. 2016;91:317-332.
- [Google Scholar]
- Decolourization of industrial effluents–available methods and emerging technologies–a review. Rev. Environ. Sci. Bio.. 2005;4:245-273.
- [Google Scholar]
- Comparative treatment of textile wastewater by adsorption, Fenton, UV-Fenton and US-Fenton using magnetic nanoparticles-functionalized carbon (MNPs@ C) J. Ind. Eng. Chem.. 2017;56:163-174.
- [Google Scholar]
- The separation of catalyst after photocatalytic reactions conducted in the presence of TiO2/FeCl3/UV. Chem.. 2005;59:853-859.
- [Google Scholar]
- One-pot synthesis of gold nanoparticle/molybdenum cluster/graphene oxide nanocomposite and its photocatalytic activity. Appl. Catal. B: Environ.. 2013;130:270-276.
- [Google Scholar]
- Prediction of flatband potentials at semiconductor-electrolyte interfaces from atomic electronegativities. J. Electro. Soc.. 1978;125:228.
- [Google Scholar]
- Increased nitrogen-vacancy centre creation yield in diamond through electron beam irradiation at high temperature. Carbon. 2019;143:714-719.
- [Google Scholar]
- Adsorption of tannic acid, humic acid, and dyes from water using the composite of chitosan and activated clay. J. Coll. Inter. Sci.. 2004;278:18-25.
- [Google Scholar]
- A novel Zn–TiO2/C@ SiO2 nanoporous material on rice husk for photocatalytic applications under visible light. Des. Wat. Treat.. 2016;57:9660-9670.
- [Google Scholar]
- Comparing the UV/monochloramine and UV/free chlorine advanced oxidation processes (AOPs) to the UV/hydrogen peroxide AOP under scenarios relevant to potable reuse. Environ. Sci. Technol.. 2017;51:13859-13868.
- [Google Scholar]
- AOPs with ozone and UV radiation in drinking water: contaminants removal and effects on disinfection byproducts formation. Wat. Sci. Technol.. 2004;49:51-56.
- [Google Scholar]
- High performance degradation of phenol from aqueous media using ozonation process and zinc oxide nanoparticles as a semiconductor photo catalyst in the presence of ultraviolet radiation. Des. Wat. Treat.. 2019;166:105-114.
- [Google Scholar]
- Shape-controlled synthesis of BiVO4 hierarchical structures with unique natural-sunlight-driven photocatalytic activity. App. Cat. B: Environ.. 2014;152:413-424.
- [Google Scholar]
- Removal of Acid Blue Dye from Industrial Wastewater by using Reverse Osmosis Technology. Association of Arab Universities. J. Eng. Sci.. 2018;25:29-40.
- [Google Scholar]
- ZnO–graphene composite for photocatalytic degradation of methylene blue dye. Cat. Com.. 2012;29:29-34.
- [Google Scholar]
- Interface-confined ferrous centers for catalytic oxidation. Sci.. 2010;328:1141-1144.
- [Google Scholar]
- Combination of cobalt ferrite and graphene: high-performance and recyclable visible-light photocatalysis. Appl. Cat. B: Environ.. 2012;111:280-287.
- [Google Scholar]
- Efficient removal of Rhodamine B using a rice hull-based silica supported iron catalyst by Fenton-like process. Chem. Eng. J.. 2013;229:351-363.
- [Google Scholar]
- Toxicity of azo dyes in pharmaceutical industry. In: Inter. Con. Med. Bio. Eng.. Springer; 2019.
- [Google Scholar]
- Kinetic and adsorption study of acid dye removal using activated carbon. Chem.. 2007;69:1151-1158.
- [Google Scholar]
- Performance of magnetite/layered double hydroxide composite for dye removal via adsorption, Fenton and photo-Fenton processes. Appl. Clay Sci.. 2019;179:105152
- [Google Scholar]
- Constructed wetlands to reduce metal pollution from industrial catchments in aquatic Mediterranean ecosystems: A review to overcome obstacles and suggest potential solutions. Environ. Inter.. 2014;64:1-16.
- [Google Scholar]
- The effect of operational parameters on the photocatalytic degradation of three textile azo dyes in aqueous TiO2 suspensions. J. Photochem. Photobio. A: Chem.. 2005;172:89-96.
- [Google Scholar]
- Hanchang, S., 2009. Industrial wastewater-types, amounts and effects. Point sources of pollution: Local effects and their control. 2, 191.
- A sno2/ceo2 nano-composite catalyst for alizarin dye removal from aqueous solutions. Nanomater.. 2020;10:254.
- [Google Scholar]
- ZnO–Bi2O3/graphene oxide photocatalyst with high photocatalytic performance under visible light. Mater. Technol.. 2012;27:278-283.
- [Google Scholar]
- Graphene sheets-based Ag@ Ag3PO4 heterostructure for enhanced photocatalytic activity and stability under visible light. Powder tech.. 2013;246:278-283.
- [Google Scholar]
- Photochemical charge transfer and trapping at the interface between an organic adlayer and an oxide semiconductor. J. Amer. Chem. Soc.. 2003;125:14974-14975.
- [Google Scholar]
- Degradation of rhodamine B by Fe (0)-based Fenton process with H2O2. Chem.. 2011;83:1279-1283.
- [Google Scholar]
- Flotation-based dye removal system: Sweet potato protein fabricated from agro-industrial waste as a collector and frother. J. Cle Pro. 2020:122121.
- [Google Scholar]
- BiVO4/TiO2 nanocrystalline heterostructure: a wide spectrum responsive photocatalyst towards the highly efficient decomposition of gaseous benzene. Appl. Catal. B: Environ.. 2011;104:30-36.
- [Google Scholar]
- Graphene-TiO2 composite photocatalyst with enhanced photocatalytic performance. Chin. J. Catal.. 2012;33:777-782.
- [Google Scholar]
- Floating photocatalysts of fly-ash cenospheres supported AgCl/TiO2 films with enhanced Rhodamine B photodecomposition activity. Des.. 2010;256:196-200.
- [Google Scholar]
- Catalytic oxidation process for the degradation of synthetic dyes: an overview. Inter. J. Environ. Res. Pub. Hea.. 2019;16:2066.
- [Google Scholar]
- Control of the nanoscale crystallinity in mesoporous TiO2 shells for enhanced photocatalytic activity. En. Environ. Sci.. 2012;5:6321-6327.
- [Google Scholar]
- Joshi, M., Bansal, R., Purwar, R., 2004. Colour removal from textile effluents.
- Separation of titanium dioxide photocatalyst in its aqueous suspensions by coagulation with basic aluminium chloride. Wat. Res.. 1999;33:1753-1755.
- [Google Scholar]
- Highly efficient water splitting into H2 and O2 over lanthanum-doped NaTaO3 photocatalysts with high crystallinity and surface nanostructure. J. Amer. Chem. Soc.. 2003;125:3082-3089.
- [Google Scholar]
- Review on titanium and titanium based alloys as biomaterials for orthopaedic applications. Mat. Sci. Eng.. 2019;C. 102:844-862.
- [Google Scholar]
- Synthesis and photocatalytic properties of visible light responsive La/TiO2-graphene composites. Appl. Sur. Sci.. 2012;263:254-259.
- [Google Scholar]
- Graphene modified Nd/TiO2 photocatalyst for methyl orange degradation under visible light irradiation. Cer. Inter.. 2013;39:3569-3575.
- [Google Scholar]
- Investigation of the generation of hydroxyl radicals and their oxidative role in the presence of heterogeneous copper catalysts. Chem.. 2007;69:689-696.
- [Google Scholar]
- Effect of Isomorphic Metal Substitution on the Fenton and Photo-Fenton Degradation of Methylene Blue Using Fe-Based Metal-Organic Frameworks. ACS Appl. Mater. Inter.. 2020;12:9292-9299.
- [Google Scholar]
- Wasted waste: An evolutionary perspective on industrial by-products. Eco. Economics.. 2009;68:3026-3033.
- [Google Scholar]
- Preparation and characterization of buoyant nitrogen-doped TiO2 composites supported by fly ash cenospheres for photocatalytic applications. J. Mater. Sci. Technol.. 2013;29:835-840.
- [Google Scholar]
- Novel photocatalysts of fly ash cenospheres supported BiOBr hierarchical microspheres with high photocatalytic performance. J. alloys com.. 2014;615:929-932.
- [Google Scholar]
- Attapulgite/bentonite interactions for methylene blue adsorption characteristics from aqueous solution. Chem. Eng. J.. 2014;237:403-410.
- [Google Scholar]
- N, S co-doped-TiO2/fly ash beads composite material and visible light photocatalytic activity. Appl. Sur. Sci.. 2013;284:229-234.
- [Google Scholar]
- BiVO4/TiO2 heterojunction with enhanced photocatalytic activities and photoelectochemistry performances under visible light illumination. Mater. Res. Bul.. 2019;117:35-40.
- [Google Scholar]
- Modification of Bael fruit shell and its application towards Natural organic matter removal with special reference to predictive modeling and control of THMs in drinking water supplies. Environ. Technol. Inno.. 2020;18:100666
- [Google Scholar]
- A comparative study on ozone, hydrogen peroxide and UV based advanced oxidation processes for efficient removal of diethyl phthalate in water. J. Haza. Mater.. 2019;363:401-411.
- [Google Scholar]
- Pt–Ni x alloy nanoparticles: a new strategy for cocatalyst design on a CdS surface for photo-catalytic hydrogen generation. RSC adv.. 2018;8:31529-31537.
- [Google Scholar]
- Sulfate and hydroxyl radicals-initiated degradation reaction on phenolic contaminants in the aqueous phase: mechanisms, kinetics and toxicity assessment. Chem. Eng. J.. 2019;373:668-676.
- [Google Scholar]
- Enhanced photocatalytic degradation of sulfamethoxazole by zinc oxide photocatalyst in the presence of fluoride ions: Optimization of parameters and toxicological evaluation. Wat. Res.. 2018;132:241-251.
- [Google Scholar]
- Systems thinking and green chemistry in the textile industry: concepts, technologies and benefits. J. Cle. Pro.. 2004;12:585-601.
- [Google Scholar]
- Investigation of chemical-less UVC/VUV process for advanced oxidation of sulfamethoxazole in aqueous solutions: Evaluation of operational variables and degradation mechanism. Sep. Pur. Technol.. 2018;190:90-99.
- [Google Scholar]
- Process and apparatus for the curing of coatings on sensitive substrates by electron irradiation. Google Patents. 1981
- [Google Scholar]
- Study on UV-LED/TiO2 process for degradation of Rhodamine B dye. Chem. Eng.. 2011;J.169:126-134.
- [Google Scholar]
- Prediction of Fermi energies and photoelectric thresholds based on electronegativity concepts. Phys. Rev. Let.. 1974;33:1088.
- [Google Scholar]
- Generation and detection of reactive oxygen species in photocatalysis. Chem. Rev.. 2017;117:11302-11336.
- [Google Scholar]
- The science of conservation planning: habitat conservation under the Endangered Species Act. Island Press; 1997.
- Adsorption of metal complex dyes from aqueous solutions by pine sawdust. Bio.technol.. 2005;96:791-795.
- [Google Scholar]
- Sensitive and selective time-gated luminescence detection of hydroxyl radical in water. Chem. Com.. 2010;46:2423-2425.
- [Google Scholar]
- Patil, A D., Raut, P., 2014. Treatment of textile wastewater by Fenton’s process as a Advanced Oxidation Process. IOSR J. Environ. Sci.Tox. Fo. Technol. (IOSR-JESTFT) e-ISSN. 2319–2402.
- Effect of electron irradiation on dye and printability of polypropylene (PP) fabrics: A novel method for decoration of PP fabrics. J. Tex. Ins.. 2010;101:988-995.
- [Google Scholar]
- Degradation of microcystin-RR by UV radiation in the presence of hydrogen peroxide. Tox.. 2005;45:745-752.
- [Google Scholar]
- Photocatalytic process for total arsenic removal using an innovative BiVO4/TiO2/LED system from aqueous solution: optimization by response surface methodology (RSM) J. Tai. Ins. Chem. Eng.. 2019;101:64-79.
- [Google Scholar]
- Photodegradation process for the removal of acid orange 10 using titanium dioxide and bismuth vanadate from aqueous solution. Glob. J. Env. Sci. Man.. 2019;5:43-60.
- [Google Scholar]
- Application of efficient photocatalytic process using a novel BiVO/TiO2-NaY zeolite composite for removal of acid orange 10 dye in aqueous solutions: Modeling by response surface methodology (RSM) J. Environ. Chem. Eng.. 2019;7:103253
- [Google Scholar]
- Dyes’ removal from textile wastewater by phosphogypsum using coagulation and precipitation method. Phys. Chem. News.. 2002;7:100-109.
- [Google Scholar]
- Role of reactive oxygen species on the activity of noble metal-doped TiO2 photocatalysts. J. Haz. Mater.. 2019;372:45-51.
- [Google Scholar]
- Synergistic effects of sonolysis combined with photocatalysis in the degradation of an azo dye. Phy. Chem. Chem. Phy.. 2002;4:6123-6128.
- [Google Scholar]
- Mechanistic investigation of visible light driven novel La2CuO4/CeO2/rGO ternary hybrid nanocomposites for enhanced photocatalytic performance and antibacterial activity. J. Photochem. Photobio. A: Chem.. 2017;340:96-108.
- [Google Scholar]
- Preparation of graphene–TiO2 composite by hydrothermal method from peroxotitanium acid and its photocatalytic properties. Col. Sur. A: Physico. Eng. Asp.. 2012;405:30-37.
- [Google Scholar]
- Photocatalytic enhancement of floating photocatalyst: Layer-by-layer hybrid carbonized chitosan and Fe-N-codoped TiO2 on fly ash cenospheres. Appl. Sur. Sci.. 2017;391:236-250.
- [Google Scholar]
- Exploring docking and aerobic-microaerophilic biodegradation of textile azo dye by bacterial systems. J. Wat. Pro. Eng.. 2018;22:180-191.
- [Google Scholar]
- Nanotechnologies, hazards and resource efficiency. Springer, Berlin. Linkov, I. and Seager, TP (2011) Coupling multi-criteria decision analysis, life-cycle k assessment, and risk assessment for emerging threats. Environ. Sci. Technol.. 2007;45:5068-5074.
- [Google Scholar]
- Combinative sonolysis and photocatalysis for textile dye degradation. Environ. Sci. Technol.. 2000;34:1747-1750.
- [Google Scholar]
- Syarizan, M., 2004. Removal of Phenol and Benzene Using Photo Fenton Reagent.
- Photo-Fenton oxidation of Orange G azo dye: process optimization and mineralization mechanism. Environ. Chem. Let.. 2019;17:473-479.
- [Google Scholar]
- Tayal, S., A. G. Verma and P. G. Manekar, 2011. Feasibility Studies on Recycling/Reuse of Wastewater from Automobile Industry.
- Individual and combined effects of ultrasound, ozone and UV irradiation: a case study with textile dyes. Ultrasonics. 2004;42:603-609.
- [Google Scholar]
- Selective preparation of monoclinic and tetragonal BiVO4 with scheelite structure and their photocatalytic properties. Chem. Mater.. 2001;13:4624-4628.
- [Google Scholar]
- Sol–gel preparation and characterization of alkaline earth metal doped nano TiO2: Efficient photocatalytic degradation of 4-chlorophenol. J. Mol. Cat. A: Chem.. 2007;273:177-185.
- [Google Scholar]
- Preparation and characterization of Fe3+-doped TiO2 on fly ash cenospheres for photocatalytic application. Appl. Sur. Sci.. 2011;257:3473-3479.
- [Google Scholar]
- A high efficient photocatalyst Ag3VO4/TiO2/graphene nanocomposite with wide spectral response. Appl. Catal. B: Environ.. 2013;136:94-102.
- [Google Scholar]
- Photocatalytic activity of heterostructures based on TiO2 and halloysite nanotubes. ACS Appl. Mater. Inter.. 2011;3:4154-4158.
- [Google Scholar]
- Efficient photocatalytic degradation of methylene blue over BiVO4/TiO2 nanocomposites. Cer. Inter.. 2015;41:5999-6004.
- [Google Scholar]
- On the heterostructured photocatalysts Ag3VO4/g-C3N4 with enhanced visible light photocatalytic activity. Appl. Sur. Sci.. 2015;324:324-331.
- [Google Scholar]
- Metal sulfides as excellent co-catalysts for H2O2 decomposition in advanced oxidation processes. Chem.. 2018;4:1359-1372.
- [Google Scholar]
- A simple method for the preparation of Bi2WO6-reduced graphene oxide with enhanced photocatalytic activity under visible light irradiation. Mater. Let.. 2013;92:126-128.
- [Google Scholar]
- Facile synthesis of Mn3O4–reduced graphene oxide hybrids for catalytic decomposition of aqueous organics. Ind. Eng. Chem. Res.. 2013;52:3637-3645.
- [Google Scholar]
- The effect of hydrothermal temperature on the synthesis of monoclinic bismuth vanadate powders. Mate. Sci Pol. 2009:27.
- [Google Scholar]
- Design of a direct Z-scheme photocatalyst: preparation and characterization of Bi2O3/g-C3N4 with high visible light activity. J. Haz. Mater.. 2014;280:713-722.
- [Google Scholar]
- MnO2-doped anatase TiO2–An excellent photocatalyst for degradation of organic contaminants in aqueous solution. Catal. Com.. 2009;10:1414-1416.
- [Google Scholar]
- Effect of the synergetic interplay between the electrostatic interactions, size of the dye molecules, and adsorption sites of MIL-101 (Cr) on the adsorption of organic dyes from aqueous solutions. Cry. Gro. Des.. 2018;18:7533-7540.
- [Google Scholar]
- Facile synthesis of V4+ self-doped,[010] oriented BiVO4 nanorods with highly efficient visible light-induced photocatalytic activity. Phy. Chem. Phy.. 2014;16:24519-24526.
- [Google Scholar]
- Facile preparation of self-assembled chitosan-based POSS-CNTs-CS composite as highly efficient dye absorbent for wastewater treatment. ACS Ome.. 2020;6:294-300.
- [Google Scholar]
- Fly ash cenospheres as multifunctional supports of g-C3N4/N-TiO2 with enhanced visible-light photocatalytic activity and adsorption. Adv. Pow. Technol.. 2017;28:3233-3240.
- [Google Scholar]
- Well-ordered large-pore mesoporous anatase TiO2 with remarkably high thermal stability and improved crystallinity: preparation, characterization, and photocatalytic performance. Adv. Funct. Mater.. 2011;21:1922-1930.
- [Google Scholar]
- Nanocrystalline anatase TiO2 photocatalysts prepared via a facile low temperature nonhydrolytic sol–gel reaction of TiCl4 and benzyl alcohol. Appl. Catal. B: Environ.. 2007;76:82-91.
- [Google Scholar]
- Insight into the role of Ti3+ in photocatalytic performance of shuriken-shaped BiVO4/TiO2− x heterojunction. Appl. Catal. B: Environ.. 2017;203:526-532.
- [Google Scholar]


