

Translate this page into:
Synthesis, characterization, and application of metal-free sulfonamide-vitamin C adduct to improve the optical properties of PVA polymer
⁎Corresponding author.at: Department of Chemistry, College of Education, University of Sulaimani, Sulaimani, Kurdistan Region, Iraq. srood.rashid@univsul.edu.iq (Srood Omer Rashid)
-
Received: ,
Accepted: ,
This article was originally published by Elsevier and was migrated to Scientific Scholar after the change of Publisher.
Peer review under responsibility of King Saud University.
Abstract
Improving optical properties is an important topic in the field of polymer science. In this research, a novel, metal-free, and inexpensive vitamin C sulfonamide adduct has been developed to enhance the optical behaviors of polyvinyl alcohol (PVA). Initially, the vitamin C adduct has been fabricated through atom economic reaction and then characterized using several spectroscopic techniques, including 1H NMR, 13C NMR, DEPT-135, Fourier transform infrared spectroscopy (FTIR), and X-ray diffraction (XRD). Accordingly, a dramatic chemical alteration in ascorbic acid structure has been confirmed and led to enhancing chemical interactions with the host polymer. The ascorbic acid adduct has been doped into PVA to prepare a flexible film of polymer composites with potential optical behaviors. The identity of composite film has specified from FTIR, XRD, and UV–vis spectroscopy. The XRD pattern of the hybrid polymer has revealed a remarkable boost in its amorphous structure compared to the PVA host. The FTIR data of both matrix PVA and its composites reveal the potent chemical interactions of functional groups within the hybrid PVA. The main optical information of synthesized hybrid film was obtained from the UV–vis spectra. The refractive index (n) and dielectric loss (εi) values are elevated notably, whereas the optical band gap energy (Eg) declined from 6.3 to 3.6 eV. The direct electronic transition between the valence band (VB) and conduction band (CB) was determined by implementing Tauc’s model. These preliminary results suggest that the fabricated flexible composite will have an excellent opportunity to use in the manufacturing optical devices.
Keywords
Atom economy
NMR studies
FTIR and XRD studies
Sulfonamides
PVA polymer
Optical properties
Band gap study

1 Introduction
Organic compounds with sulfonamide linkages have many pharmaceutical and physical applications (Hu et al., 2014; Peiris et al., 2017; Ali et al., 2010). The antagonist behavior of the sulfonamide group is well studied and recognized in several biological systems, such as microbes and cancer cell lines (Gutiérrez et al., 2010; Vila-Costa et al., 2017; Krasavin, 2019; Koyuncu et al., 2019). However, the electrical conductivity, optical behavior, and thermal applications of organo-sulfonamide compounds have been observed in numerous researches (Pochekailov et al., 2012; Kumar and Chae, 2017; Taghvaei-Ganjali et al., 2015). Ascorbic acid, as a degradable vitamin, has a number of biological and chemical significance (Du et al., 2012; Smirnoff, 2018; Mallakpour and Rashidimoghadam, 2019). Applications of vitamin C in the field of organic chemistry have grown remarkably (Tripathi et al., 2009; Xu et al., 2005). Recently, the reaction of excess ascorbic acid with diazonium salts to form vitamin C adducts has caught the attention of researchers who plan to use this facile, economical procedure for synthesizing different organic compounds through the safe and stable vitamin C adduct reagent (Norris et al., 2020; Ashcroft et al., 2011; Poh et al., 2016; Browne et al., 2011; Hu et al., 2016).
A polymer composite is comprised of two or more components with physically and chemically distinct properties (Thévenot et al., 2013; Fathi-Azarbayjani et al., 2013). Recently, polyvinyl alcohol (PVA) composite have been used to improve many physical features of various materials (Thong et al., 2016; Bora et al., 2021; Fahmy et al., 2020; Aziz, et al., 2020; Aslam et al., 2018). Basically, this is due to superior properties of PVA polymer, such as stability, solubility, reactivity, and being inexpensive with a superb biological profile, including nontoxicity, biodegradability, odorless, and tasteless (DeMerlis and Schoneker, 2003; Kaith et al., 2011; Zeeshan, 2021). In addition, PVA has a semi-crystalline or linear synthetic polymer composition, and polymer functional groups interact with each other, which may help it interact well with a variety of metals and organometals (Kim et al., 1994; Khaliullin et al., 2019; Mishra and Kannan, 2014).
The literature review shows that PVA has used as a proper substrate for minimizing optical band gap by combining with various inorganic complexes. The amorphous PVA-based polymer composites of the Ce(III) complex was synthesized by Brza et al. in an attempt to reduce the optical band gap energy from 5.7 to 1.7 eV (Brza, 2020). The synthetic polymer composite of mercury(II) complex and the PVA matrix shows the lowering of optical band gap energy by creating new energy states (Abdalkarim, et al., 2021). More recently, another effort has been observed by Aziz and coworkers to reduce optical band gap energy by fabricating PVA-Al(III) metal complex-based composite systems using the casting method (Aziz, et al., 2021) (see Fig. 1).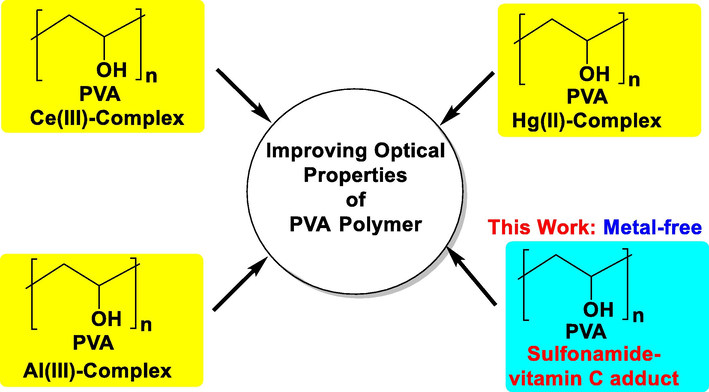
Developments of PVA polymer composites in improving optical properties.
Metal-free PVA-polymer composites are benign and eco-friendly polymers with many outstanding applications. A porous polymer composite was prepared by blending of methylcellulose with poly(vinyl alcohol) via freeze drying method which have biomedical applications (Kumar et al., 2012). PVA combines with carboxymethyl cellulose to produce metal-free polymer composites with a wide range of properties, including medicine delivery, food packaging, agriculture, electric, and physiochemical properties (Hiva Nargesi Khoramabadia et al., 2020). In another study, a metal-free combined polymer composite was prepared by A. Cagriata et al. using the MADIX polymerization technique. This polymer composite possesses several desired properties, such as relatively low molecular weight, polydispersity, and polymer chain size (CagriAta et al., 2021).
In this study, the metal-free sulfonamide-vitamin C adduct was prepared and characterized via 1H NMR, 13C NMR, DEPT-135, FT-IR, and XRD. The metal-free polymer composites was synthesized by introducing vitamin C adduct to the aqueous solution of PVA polymer using cast method. Further investigations on synthesized metal-free polymer composite was performed via XRD, FTIR, and UV–visible spectroscopy to study its physical behavior. The experimental data show that the sulfonamide-vitamin C adduct interacted with PVA polymer homogenously and significantly reduced band gap energy. The details of the synthesis, characterization, and measurement of physical properties of this polymer composite will present in the result and discussion part.
2 Experimental section
2.1 Materials and characterization
All chemicals were purchased from Merck Company and directly used without purifications. The PVA was used has a CAS number of 9002–89–5; Molecular weight = 89,000–98,000, 99+% g mole-1. The melting point was recorded using auto melting point equipment (OptiMelt) (Sunnyvale, CA, USA). The reactions were monitored using TLC (plates aluminum backed silica gel 60 F254 features). The TLC spots were visualized with the aid of a UV lamp (λ = 254 nm). The IR-disks were prepared by blending a minimum quantity of the sample with KBr pellets and pressed under pressure (15 tons). The FT-IR spectra were obtained using a Perkin-Elmer spectrophotometer (Waltham, MA, USA). The 1H NMR, 13C NMR, and DEPT-135 NMR spectra were acquired from Bruker DRX-400 MHz (Billerica, MA, USA). The chemical shift (δ) was measured downfield of TMS and expressed in ppm unit. s = singlet, d = doublet, t = triplet, q = quadruplet. The DEPT-135 represents 13C NMR signals in a way CH with CH3 (up) and CH2 (down). The UV–vis spectra of the sample films (PVA polymer and polymer composite) were recorded using the Perkin Elmer double beam UV–vis–NIR spectrometer (Lambda 25 model). The thickness of polymeric films for FT-IR measurements were thinner than those of the films analyzed using UV–Vis spectrophotometer. The structural properties were investigated using an X-ray diffractometer (XPERT-PRO) equipped with a Cu kα (λ = 0.154 nm) radiation source in the 2θ between 10° and 80° at a scan rate of 2° min−1.
2.2 Synthesis of 4-hydroxy-2-oxotetrahydrofuran-3-yl 2-oxo-2-(2-(4-sulfamoylphenyl)hydr- azineyl)acetate
To a clear and cold (0–5 °C) solution of sulfanilamide (0.43 g, 2.5 mmol; 1 equiv. in 5 mL, 2 N HCl), a solution of sodium nitrite (0.2.58 g, 3.75 mmol; 1.5 equiv. in 2 mL of distilled water) was added dropwise with stirring and keeping the temperature below 5 °C. The resultant solution was stirred for 1 h. Then, a solution of L-ascorbic acid (1.1 g, 6.25 mmol; 2.5 equiv. in 6.5 mL of water) was added, the reaction mixture immediately turned into a clear, intense yellow. The formed mixture was stirred for about one hour (till the stirrer bar stopped moving). The yellow precipitate was formed. The solution was filtered under a vacuum and washed several times with distilled water. Drying of the precipitate was performed in a desiccator, the titled compound was obtained as a yellow solid (95%). mp: 135 °C, Rf:0.86, (Ethyl acetate: n-Hexane 3:1); FT-IR ( ): 3468, 3300, 3357–3257, 3099, 2960, 1801, 1756, 1704, 1601, 1327–1156 cm−1. 1H NMR (acetone- d6, 400 MHz): δ 11.16 (s, 1H), 8.69 (s, 1H), 7.63 (d, J = 8.6 Hz, 2H), 7.10 (s, 2H), 6.81 (d, J = 8.6 Hz, 2H), 6.21 (s, 1H), 5.72 (d, J = 7.9 Hz, 1H), 4.72 (q, J = 7.8 Hz, 1H), 4.53 (t, J = 8.0 Hz, 1H), 4.08 (t, J = 8.3 Hz, 1H). 13C NMR (acetone- d6, 101 MHz): δ 170.70, 159.09, 156.35, 151.18, 134.34, 127.68, 111.73, 76.43, 70.02, 69.81. DEPT-135 (acetone- d6, 400 MHz): δ 127.68, 11.73, 76.47, 69.81, 70.02.
2.3 Preparation of polymer composite (composite film) by cast method
Solution 1 (PVA-0): A polyvinyl alcohol (2 g) was dissolved in 100 mL of distilled water and stirred for one hour at 80 °C.
Solution 2 (dopant solution): The metal-free sulfonamide-vitamin C compound (0.055 g) was dissolved in 30 mL of (1:1 acetone: water).
Solution 2 was added to solution 1 and then stirred for 50 min. The polymer composite film (PVA-1) was synthesized by placing the mixture into Petri dishes, and the mixture was left for 24 h to dry at 25 °C. Then a composite film was characterized using XRD, FTIR, and UV–Visible spectroscopy.
3 Results and discussion
3.1 Chemical synthesis
The newly dopant, sulfonamide-vitamin C adduct was synthesized via two consecutive steps. Initially, the sulfonamide (1): was diazotized by NaNO2/HCl to form sulfonamide-diazonium salt (2):. Afterward, the L-ascorbic acid adduct (3): was produced in a relatively high yield (95%) by the reaction of excess (2.5 equiv.) of vitamin C and diazonium salt (2): as shown in Scheme 1. These reactions are facile, fast, and free chromatography.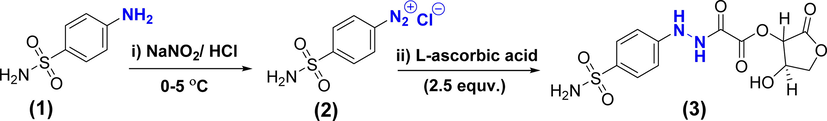
Synthesis of L-ascorbic acid adduct (3).
A novel, metal-free polymer composite was fabricated successfully by adding dopant solution (1:1 H2O: acetone, 0.153 mmol, 3) to the aqueous solution (100 mL H2O, 13.3–14.6 % mmol) of PVA host polymer using the casting method (see Scheme 2). The interactions within synthesized polymer composite were confirmed via several spectroscopic investigations including XRD, FT-IR, UV–vis spectroscopy, refractive index (n), and the optical band gap energy. The nature of the chemical interactions between the PVA polymer and the functional groups of dopant (3) are explained in the following sections.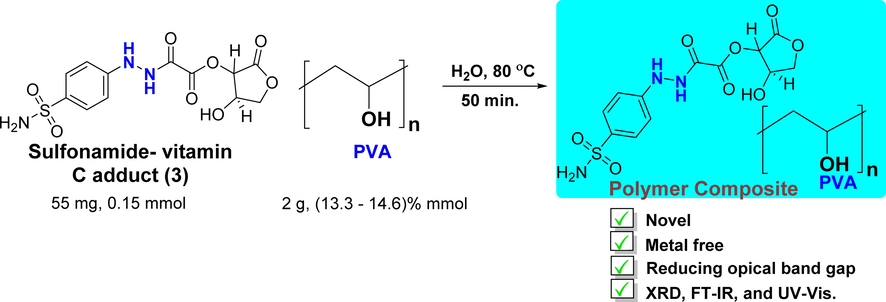
Synthesis of a metal-free PVA polymer composite.
3.2 Characterization of dopant sulfonamide-vitamin C adduct
3.2.1 FT-IR
The absorption of infrared (IR) radiation causes an excitation of molecules from lower to higher vibrational energy levels (Shen et al., 2009). These vibrational transitions will translate to IR signals serving as valuable diagnostic information for determining organic functional groups and various spectroscopic studies (Movasaghi et al., 2008; Rashid, 2019). Fortunately, the important functional groups of dopant sulfonamide (3) were confirmed from FT-IR spectroscopy (see Fig. 2). The functional group area of the IR spectrum shows a sharp, less intense, and at a high vibrational frequency (3436 cm−1) of O-Hstr. relative to N-H stretchings (–NH2 str.: asymmetric N–Hstr. = 3357, symmetric N–Hstr. = 3257, and amide N-H str.: 3300 cm−1). This would be due to less sharing of the O-H group to form hydrogen bonding compared to the N-H group in compound (3) (Bratlie et al., 2008). The C-H stretchings of both sp2 and sp3 carbons appeared at 3099 and 2960 cm−1; respectively.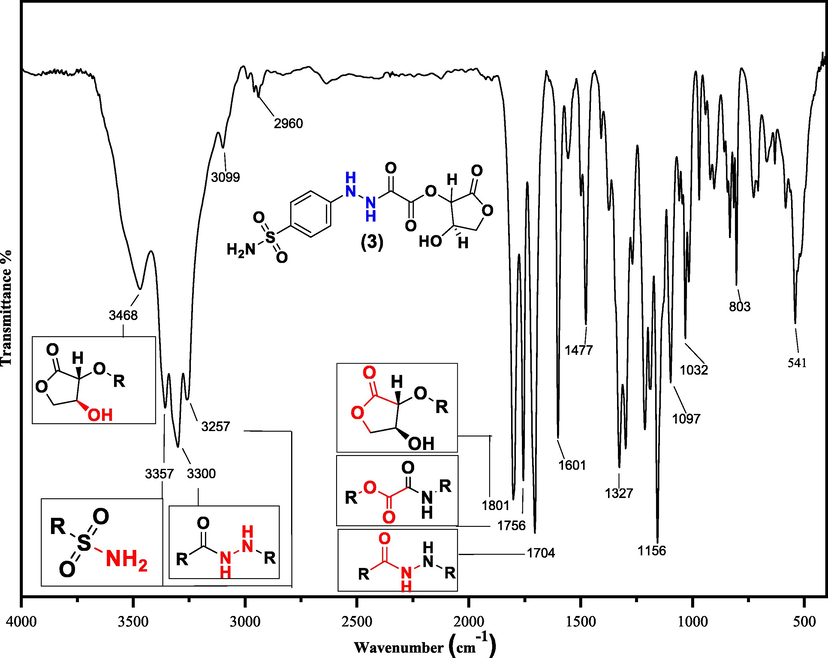
FTIR spectrum of a sulfonamide compound (3).
The most significant signals in the spectrum are those related to C=O stretchings. The C=Ostr. signals at 1801, 1756, and 1704 cm−1 strongly confirm the formation of the dopant ascorbic acid-adduct (3) (Browne et al., 2011). The existence of an inductive effect in both esteric C=Ostr. in compound (3) leads to the appearance of carbonyl stretchings at higher vibrational absorption frequencies (Dunn and McDonald, 1969), while the mesomeric effect is dominant in amide C=Ostr. and appears at a lower wavenumber (Sajan et al., 2011). Further molecular structure confirmations of dopant (3) were obtained from the fingerprint area of the IR spectrum. The C-O, C-N, and S=O stretchings will appear at 1327, 1156, 1097, and 1032 cm−1.
3.2.2 1H NMR
The hydrogen configuration of the sulfonamide compound (3) was determined by 1H NMR spectroscopy (Bharti and Roy, 2012). The 1H NMR spectrum of compound (3) was obtained by dissolving the sample in acetone‑d6 at room temperature as exhibited in Fig. 3.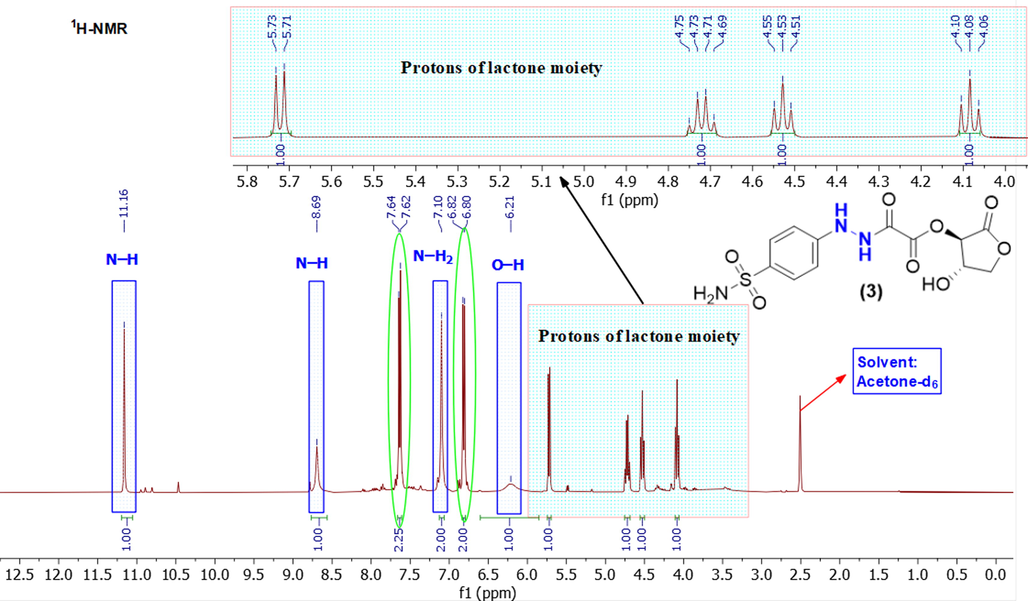
1H NMR spectrum of a sulfonamide compound (3) in acetone‑d6.
The exchangeable protons (O-H and N-H) are clearly seen in the 1H NMR spectrum (Browne et al., 2011). The two protons of N-H were more deshielded (appear more downfield) and resonate at higher frequencies (δ = 11.16 and 8.69) ppm as singlet. These could be correlated to the existence of molecular hydrogen bondings and this information agree with the IR data of the compound (3). The two protons of N-H2 sulfonamide were obtained as one broad singlet at (δ = 7.10) ppm. The proton of the hydroxyl group (O-H) is slightly bit shielded (appears up-field) and resonates at the frequency (δ = 6.21 ppm) as a broad signal (Nerantzaki et al., 2011).
The four aromatic protons locate in the range of 6.6–7.7 ppm. The two chemical equivalence protons lie at δ = 7.63 ppm as a doublet and the other two chemical equivalence protons observed at δ = 6.81 ppm. Both pairs have the same coupling constant (J = 8.60 Hz). This implies that these two pairs of protons are chemically non-equivalent. However, they are magnetically equivalent (Browne et al., 2011).
The protons of lactone moiety were observed in the range (5.72–4.08) ppm. The two diastereotopic protons (CH2) appear at upfield of the spectrum (δ = 4.08 and 4.53 ppm) as two separate pseudo triplet signals. In addition, the symmetrical analyses of these signals reveal the existence of two potential doublet of doublet. The signal (δ = 4.53 ppm) appears as (dd, J = 7.85, 8.10 Hz) and the other one (4.08 ppm) shows very slightly spin coupling (dd, J = 8.25, 8.28 Hz). The remaining two protons of two chiral carbons resonate at 5.72 (d, J = 7.9 Hz, 1H) and 4.72 (q, J = 7.8 Hz, 1H).
3.2.3 13C NMR and DEPT-135
The three 13C NMR signals of carbonyl groups (C=O) in compound (3) are clearly seen more downfield in the spectrum (see Fig. 4). The most deshielded signal is a lactonic carbonyl group lies at δ = 170 ppm, the esteric carbonyl group resonates at δ = 159 ppm and the lower deshielded C=O signal belongs to the amide group at δ = 155 ppm (Browne et al., 2011).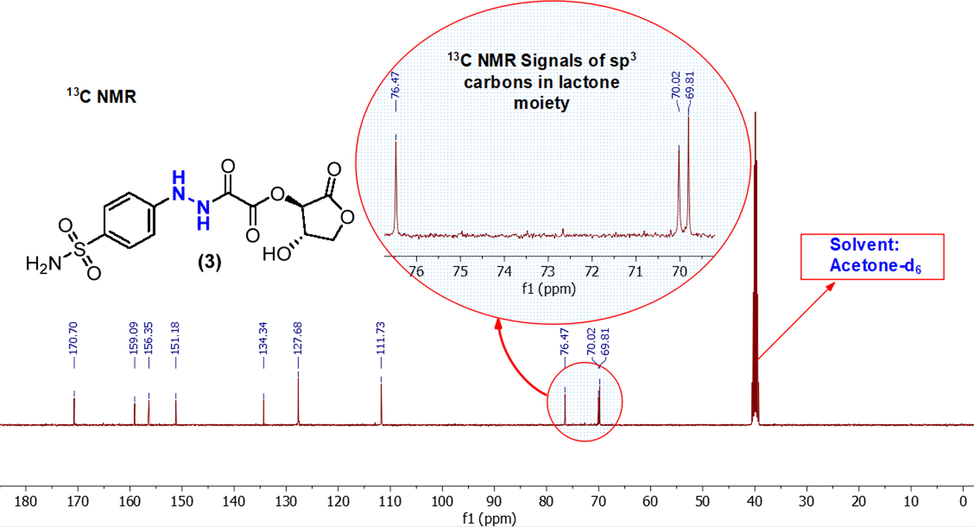
13C NMR spectrum of a sulfonamide (3) in acetone‑d6.
The aromatic carbons in compound (3) possess four signals; two ortho carbons of sulfonamide group are more deshielded to δ = 127 ppm, whereas the other two aromatic carbons which are in ortho position to hydrazide group, observed at δ = 111 ppm. The two aromatic quaternary carbons are seen at δ = 150 and 134 ppm. The carbon skeleton structure of the remaining lactone moiety has been confirmed by the appearance of the exact number of carbon-13 peaks at δ = 76, 70, and 69 ppm.
Further spectroscopic confirmation about the formation of sulfonamide-vitamin C adduct (3) has been obtained from the DEPT-135 spectrum, as illustrated in Fig. 5. In a manner, all quaternary carbons (δ = 170, 159, 155, 150, and 134 ppm) vanish from the spectrum. The methylene (CH2) carbon appears (δ = 69 ppm) at the bottom and the rest (CH) of carbons occur at (δ = 127, 111, 76, and 69 ppm) at the top of the spectrum.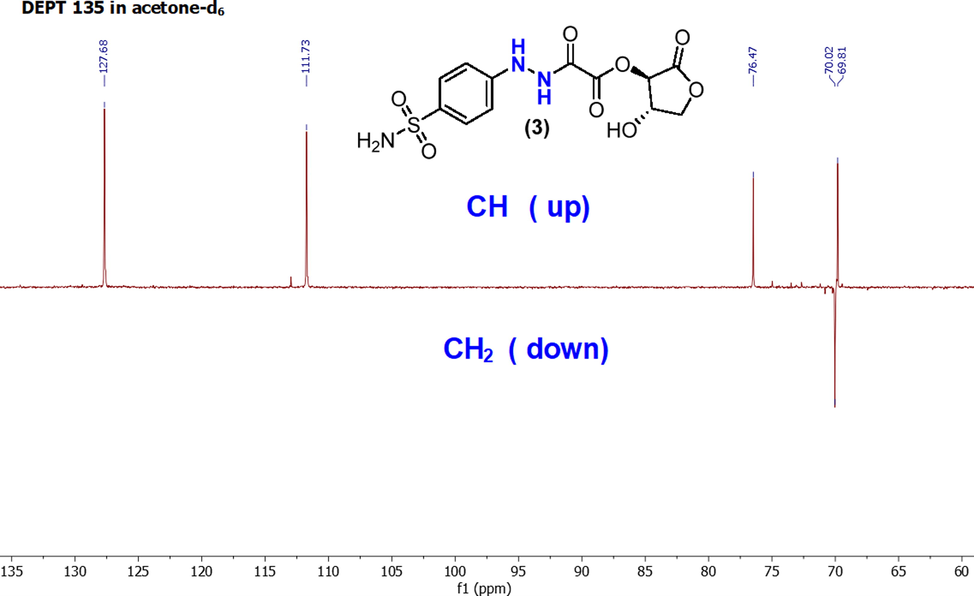
DEPT-135 spectrum of a sulfonamide (3) in acetone‑d6.
3.3 Spectroscopic study of polymer composites
3.3.1 XRD Study
X-ray diffraction spectroscopy is a valuable technique to gain insight into the structural properties of solid samples and polymer composites by giving precise, direct, and fast structural information (Nofal, 2020; Anderson and Paulo, 2014). The XRD pattern of pure dopant (3) is displayed in Fig. 6. Simply, the observed crystalline peaks in the XRD spectrum were calculated by the origin 2021 program. The relative percentage crystallinity has been determined through the area of crystalline peaks and accordingly the crystallinity of dopant (3) is 76.83%.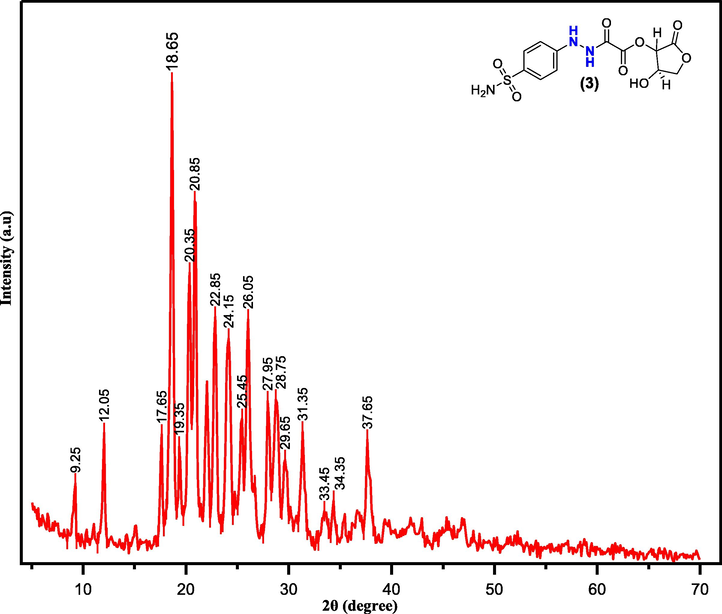
XRD pattern for a sulfonamide dopant (3).
In Fig. 7, both the XRD patterns of pure PVA polymer (PVA-0) and PVA polymer composite (PVA-1) samples are illustrated in red and blue lines, respectively. The (PVA-0) sample has two peaks at 2θ = 19.65° and 28.65°. These peaks indicate the crystalline structure of pure PVA (Aziz, et al., 2021; Brza, et al., 2021). While in the polymer composite (PVA-1) sample, the peaks of both pure (PVA-0) at 28.65° and the other signals of pure dopant (3) are disappeared. Only the signal at 2θ = 19.65° remains with relatively low intensity. The origin calculation of the peak areas show that the crystallinity of (PVA-0) was reduced from 47% to 34% by blending with dopant (3) (Kumar et al., 2021). The vanishing of these peaks tell us the dopant (3) completely and homogeneously formed through the functional group interactions between pure PVA polymer and sulfonamide dopant (3) (Nofal, 2020). However, the lowering and broadening of intensity at 2θ = 19.65° refers to the increasing amorphous structure of formed polymer composite, and this is supposed to be by broking and reducing a regular intermolecular hydrogen bonding within (PVA-0) and replacing by other random intermolecular hydrogen bonding in the host polymer composed (PVA-1) (Aziz, 2020). Despite the lowering crystalline composition of (PVA-1), there is still somewhat crystallinity remaining within host polymer composed (PVA-1).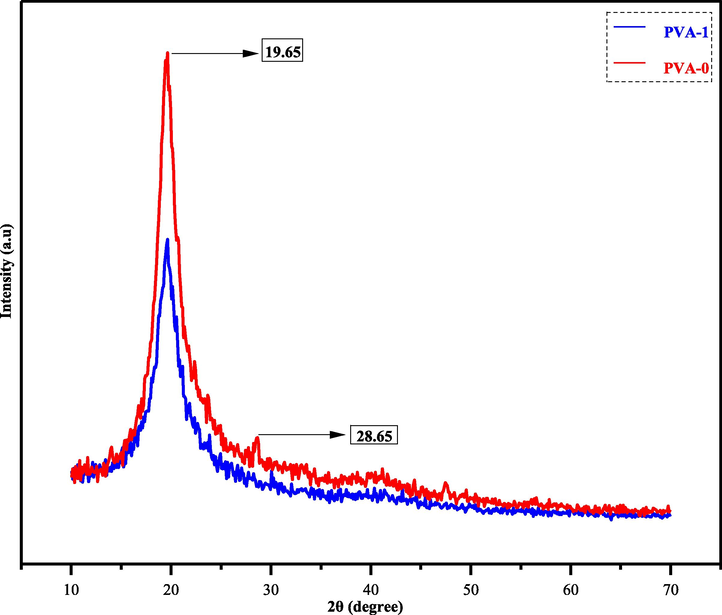
XRD pattern of pure PVA (PVA-0) and doped PVA with metal-free sulfonamide compound (PVA-1).
3.3.2 FT-IR study
FT-IR spectroscopy is a molecular absorption spectroscopic technique that obeys Lambert-Beer’s Law and gives beneficial information on polymer composite in molecular level (Brza et al., 2020; Cañavate et al., 2000). The IR spectra of both pure (PVA-0) and doped polymer (PVA-1) are explained in Fig. 8. The comparison of IR spectra for both polymers confirms large extent about the exact formation of polymer composite (PVA-1) and provides information about the interactions between dopant (3) and pure PVA polymer. Here, it will be very useful to study the impact of these interactions by monitoring the changes in positions, intensities, and shapes of maximum absorption wavelength (λ-max) of all organic functional groups in both polymers (Aziz, et al., 2021; Brza, et al., 2021). Based upon these interpretations, the chemical interactions are responsible for achieving successful composite formation.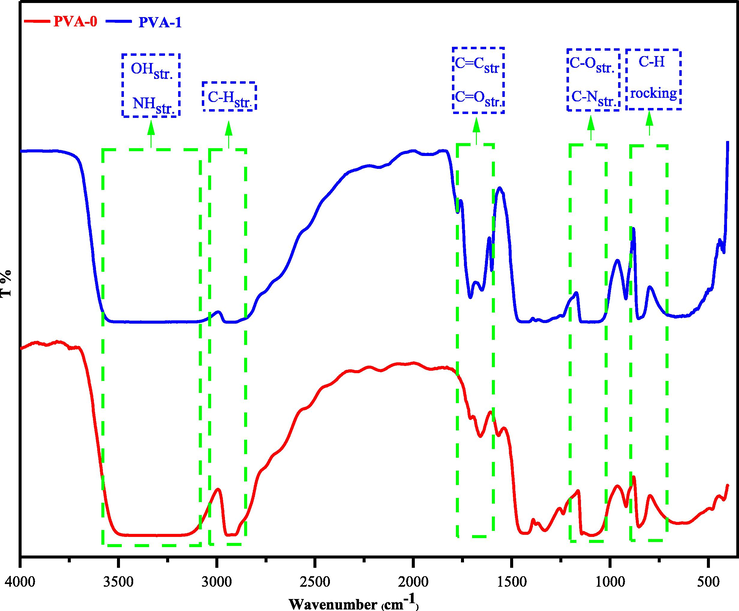
FT-IR spectrum for the pure PVA (PVA-0) and doped PVA with metal-free sulfonamide compound (PVA-1).
Generally, the intensity of O-Hstr. in doped polymer (PVA-1) reduces and shifts to lower absorption frequency and undergoing broadening (3060–3560 cm−1), whereas the IR signals of O-Hstr. for pure PVA sample fall in (3144–3510 cm−1) (Makled et al., 2013; Hema et al., 2008). These imply that the O-H bonds in (PVA-1) are weakened by the effect of formation extra intermolecular hydrogen bonding between polar groups in sulfonamide-vitamin C adduct (3) and pure polymer.
The C-H stretchings of sp3 and sp2 carbons in (PVA-1), whilst C-Hstr. of sp3 carbon for pure PVA polymer locates in the range (2841–3010 cm−1) (Brza, 2021; Ghanipour and Dorranian, 2013). Interestingly, the existence of aromatic sp2 carbons are obviously observed in the (PVA-1) infrared spectrum near (3010 cm−1). In contrast, the C-H stretches in (PVA-0) are in the range (2893–2954 cm−1) for all symmetric and asymmetric C-H stretchings of sp3 carbons without the appearance of IR signal for sp2 carbons. This emphasizes the formation of (PVA-1) and asserts the ascorbic acid-adduct (3) existence in (PVA-1) composition.
The carbonyl groups stretching of ascorbic acid-adduct (3) remain in (PVA-1) FTIR spectrum, but it shifts to lower vibrational frequency and appears clearly at (3x C=Ostr. = 1776, 1714, and 1655 cm−1). This is owing to the use of these carbonyl groups in the formation of intermolecular hydrogen bonding with the O-H groups in pure PVA polymer. Furthermore, the vibrational signal at 1601 cm−1 belongs to C=Cstr. of aromatic sp2 carbons. All these signals are absent in (PVA-0) FTIR spectrum.
The fingerprint region (1400–600 cm−1) of FT-IR spectrum for (PVA-0) includes vibrational bending of CH2 wagging (out of plane) at 1411 cm−1 which is a characteristic of pure PVA and CH2 in-plane rocking (long chain band) at 849 cm−1. Meanwhile, the signal of CH2 wagging drops clearly in polymer hybrid (PVA-1). The C-Ostr. in (PVA-0) spectrum occurs in the range (1039–1146 cm−1), but in (PVA-1) spectrum more broader (1030 –1148 cm−1) due to the presence of C-Nstr. and having more electrostatic interactions (Hema et al., 2008; Malathi et al., 2010). The C-O str. and C-Nstr. region in (PVA-1) spectrum has lower intensity, as a result of increasing the molecular mass of PVA polymer after binding with the dopant (3) to form (PVA-1) (Abdalkarim, et al., 2021).
3.3.3 UV–Visible study
3.3.3.1 Absorption study
UV–vis spectroscopy is an influential spectroscopic technique for evaluating several physical constants of polymer composites (Brza, 2020). The absorption coefficient, optical band gap, and other optical parameters could be easily determined from the UV–Vis. spectrum. Fig. 9 depicts the UV–Vis absorption spectra of neat PVA with composite polymer (PVA-1). Pristine PVA polymer is incapable to absorb the photon of visible radiation and almost appears transparent. This is due to the absence of free electrons in its conduction band and only achievable by absorbing the UV radiation which overcomes the barrier band gap energy between the conduction band and valence band (Brza, 2020). Upon the addition of a low concentration of dopant sulfonamide adduct (3) into pure PVA polymer (dopant (3)/ pure PVA; 55 mg/ 2 g, %W/W = 2.75), the optical behavior of the formed composite (PVA-1) has remarkably improved by shifting the absorption to longer wavelength (bathochromic shift, lower energy). Also, it results in an intense absorption occurrence through the all UV region and a propagation in the wide visible region (Abdalkarim, et al., 2021; Abdul-Kader, 2013; Aziz et al., 2017; Aziz et al., 2013). These improvements have performed via reducing band gap energy of (PVA-1). These data reveal the eligibility of these kinds of dopant metal-free (3) materials for various electric and electronic applications (Brza, 2021; Aziz et al., 2019; Yakuphanoglu et al., 2007).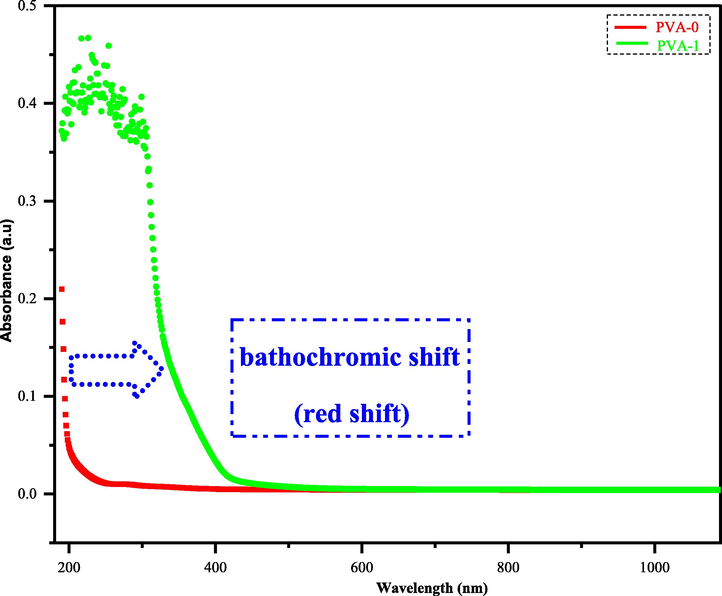
Absorption spectra of pristine PVA and composite film.
3.3.3.2 Refractive index study
The refractive index (n) is an important physical constant which has frequent use in polymer composites study, since it tells how light-speed changes when it passes through various optical materials (Nofal, et al., 2021). The n value is related to the degree of polarizability and density of the sample, which is affected by temperature and pressure changes (Yakuphanoglu and Arslan, 2007). Its value is mathematically expressed by employing Kramer’s–Kronig relations (Aziz, et al., 2021):
In equation (1), R is the reflectance and k is the extinction coefficient. k-value is determined from k = λα/4πt, λ = wavelength of incident light and t is the thickness of the thin films.
In Fig. 10, the n values of both (PVA-0) and (PVA-1) are drawn as a function of wavelength. Obviously, the relative higher n value is associated to hybrid polymer (PVA-1), indicating a remarkable dispersion, while (PVA-0) spectrum has lower n-value. Now, the reason is clear which returns to the impact of sulfonamide adduct (3) when it was combined with neat PVA polymer, leading to raise the density of the combined polymer (PVA-1).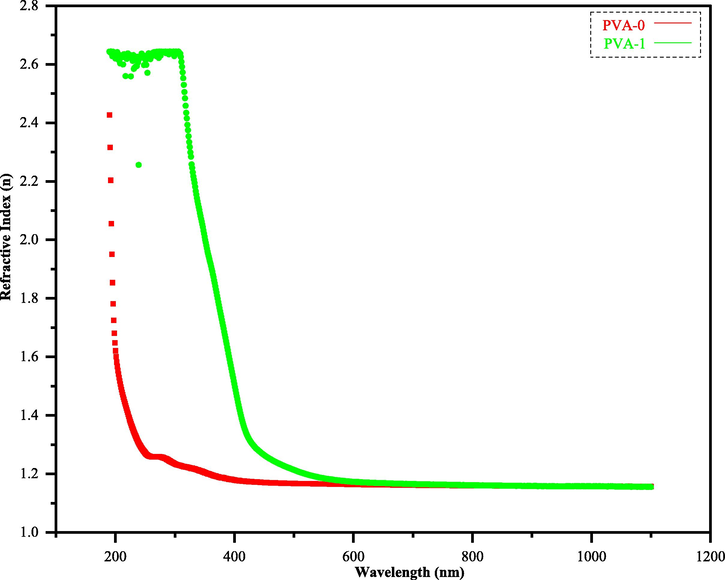
Refractive index (n) versus wavelength (λ) for the pristine PVA with polymer composite.
Like the other polymer composite with high n value, the fabricated hybrid polymer (PVA-1) possesses light weight and good flexibility, which will validate the worthy applications in optical devices manufacturers (Yetisen et al., 2016; Kim, 2015; Li et al., 2013; Sanders, 2010).
3.3.3.3 Band gap study
The optical band gap energy (Eg) is another physical constant that describes the energy difference between conduction and valence bands within the polymer (Brza, 2020). The optical band gap and electronic transitions can be derived from the optical dielectric loss (ɛi) parameter and Tauc’s model as described in equations (2) and (3), respectively (Brza, 2020; Aziz, et al., 2021; Brza, 2021).
Where, B = interband transitions; hυ = energy of photon; γ = defining the kind of electron transition.
Optical dielectric function (ε*) barely influences the band structure of materials and gives information about optical properties of matters. The value of (ε*) is the summation of both εr (a real component of dielectric function) and εi (an imaginary component of dielectric function) as shown in equation (4). It is obvious that the material’s band structure is notably supported by employing UV–vis spectroscopy in testing the ε* (Aziz et al., 2017; Aziz et al., 2017).
Several studies have confirmed a strong linkage between the optical properties of the materials and their corresponding electronic band structure. On the other hand, the researchers have revealed that the interband transitions will lead to appearance of signals in the εi spectra (Guo and Du, 2012; Bouzidi et al., 2016). Fig. 11 displays the relationship between optical dielectric loss (εi) and photon energy (hυ). Accordingly, the exact optical band gap energy (Eg, in eV) was determined for both (PVA-0) and (PVA-1) from the linear regions of εi spectra.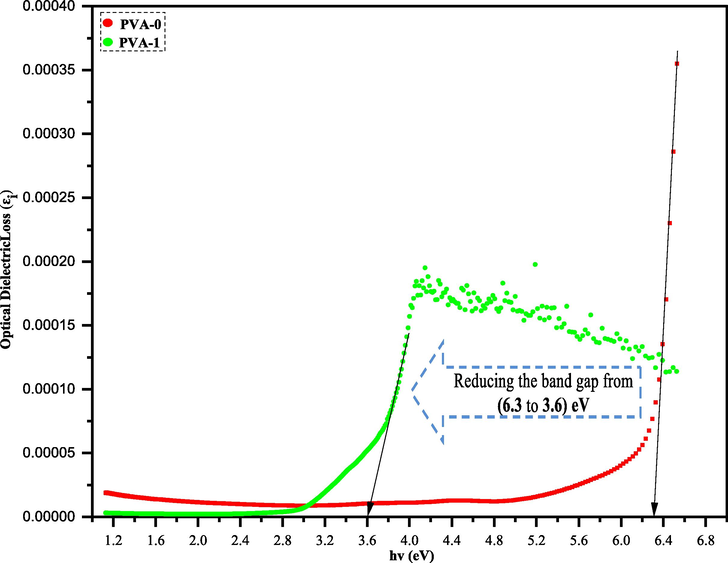
Optical dielectric loss plot for (PVA-0) and its polymer composite (PVA-1).
The kind of electronic transitions between valence band and conduction band were determined using Tauc’s model (see equation (3)). For direct allowed electron transitions, γ is equal to (½), for indirect allowed transitions γ is equal to 2, for direct forbidden transition, γ = 3/2, whereas in indirect forbidden transition γ is 3 (Jain et al., 2009; Aziz, 2017).
The y-axes (αhυ)1/γ of polymers (PVA-0) and (PVA-1) were plotted against x-axes (hυ) as exhibited in Fig. 12 (a-d). The extrapolation intersections of linear regions of (αhυ)1/γ were used in determining the values of Eg (Aziz, 2017). In all cases of Fig. 12 (a-d), the obtained Eg values decrease which is in accordance with the well-documented previous researches. The reason is the existence of some trap states (localized states) within the forbidden band gap; as a consequence of the formation of insertion fillers into the hosted polymer (Aziz, 2017; Abdullah et al., 2015).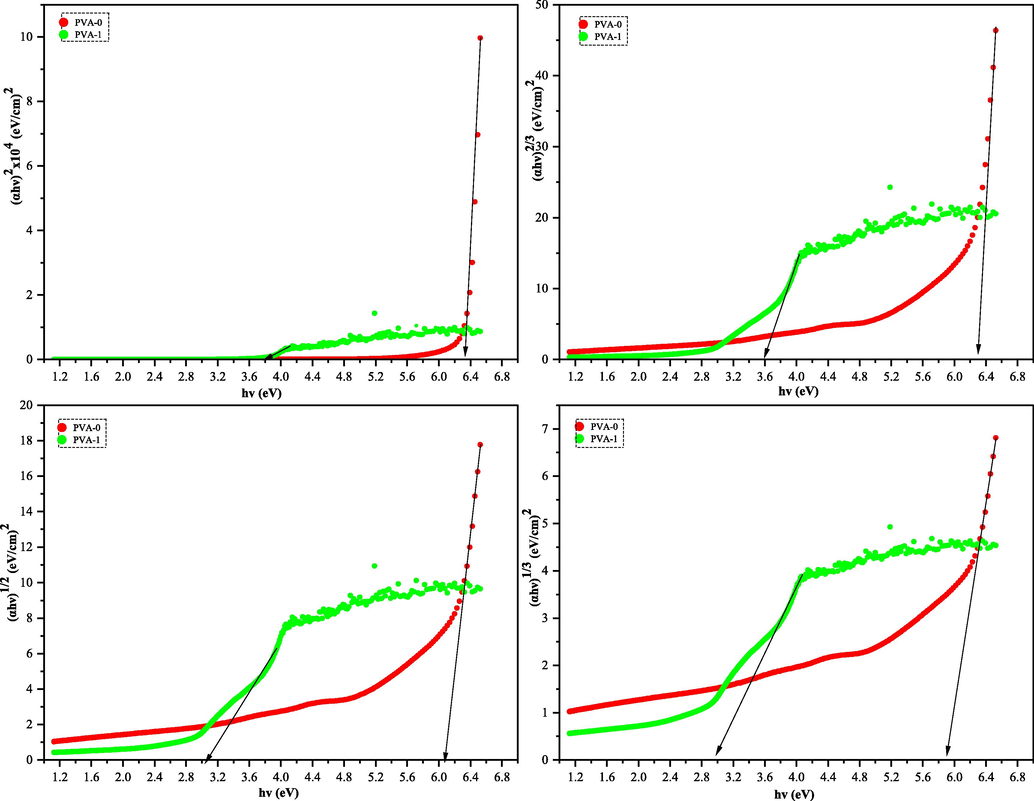
Plot of (αhυ)1/γ versus hυ for the neat PVA and its composite. Where γ= ½, 2, 3/2, and 3.
Table 1 reveals the values of the four optical band gaps (Eg) with their γ values for both films of matrix polymer and its polymer composites. Obviously, considerable detraction in the value of optical band gap energies are seen after addition of the ascorbic acid dopant (3).
Plainly, the type of electronic transition in the pure PVA and its hybrid polymer films can be recognized by comparing the values of Eg extracted from Tauc’s model (Fig. 12 (a-d)) and dielectric loss “εi” (Fig. 11) (Aziz, 2017). The values of Eg of the films fully fit the γ = 3/2 which refers to direct forbidden transition between valence and conduction bands in (PVA-0) and (PVA-1). Based on the obtained data points in Fig. 11 and confirmation of gamma value (γ = 3/2) in Table 1, the band gap energy of pristine PVA is reduced from 6.3 to 3.6 eV.
Films
γ = 1/2
γ = 3/2
γ = 2
γ = 3
Dielectric loss, εi
PVA-0
6.3
6.3
6.1
5.9
6.3
PVA-1
3.8
3.6
3
2.7
3.6
Here, the fabricated hybrid polymer will be a successful candidate to employ in various physical applications, for examples photovoltaic, laser diodes, and light-emitting diodes (LEDs) (Brza, 2021).
4 Conclusion
-
The biodegradable and inexpensive vitamin C was used to synthesis a metal-free sulfonamide-vitamin C adduct (3). The isolated product was obtained through smooth, rapid protocol, and relatively high yield.
-
The strong interactions between the components of the composites were evidenced obviously.
-
The amorphous region becomes dominant throughout the structure of the blended polymer hybrid beyond the casting process, which is desired as a means of improving optical properties; for example, refractive index (n), dielectric loss (εi), and band gap energy (Eg).
-
A novel metal-free polymer hybrid results reveal a substantial increase in n and εi values that accompanied the optical band gap energy descending.
-
The electronic transition within the polymer composites is determined to be the direct forbidden transition.
-
All these outcomes make the polymer composite to be qualified for usage in optoelectronic applications.
Author Agreement.
We the undersigned declare that this manuscript is original, has not been published before and is not currently being considered for publication elsewhere. We confirm that the manuscript has been read and approved by all named authors and that there are no other persons who satisfied the criteria for authorship but are not listed. We further confirm that the order of authors listed in the manuscript has been approved by all of us.
Acknowledgments
The authors are very grateful to the director and staff in Hameed Majid Advanced polymeric materials research laboratory in the Physics Department, College of Science, University of Sulaimani for kind helping to perform some physical measurements.
Declaration of Competing Interest
The authors declare that they have no known competing financial interests or personal relationships that could have appeared to influence the work reported in this paper.
References
- K. A. Abdalkarim et al., “Synthesis of Hg Metal Complex and its application to Reduce the Optical Band Gap of Polymer,” Arab. J. Chem., p. 103215, 2021, doi: 10.1016/j.arabjc.2021.103215.
- The optical band gap and surface free energy of polyethylene modified by electron beam irradiations. J. Nucl. Mater.. 2013;435(1–3):231-235.
- [CrossRef] [Google Scholar]
- Reducing the optical band gap of polyvinyl alcohol (PVA) based nanocomposite. J. Mater. Sci. Mater. Electron.. 2015;26(7):5303-5309.
- [CrossRef] [Google Scholar]
- Physical properties and biological applications of novel substituted biphenyl-sulfonamides. Int. J. Genet. Mol. Biol.. 2010;2(5):78-91.
- [CrossRef] [Google Scholar]
- X-ray diffraction – new eyes on the process Luciano Gobbo Harald van Weeren. IEEE-IAS/PCA Cem. Ind. Tech. Conf. 2014:1-9.
- [CrossRef] [Google Scholar]
- Second-generation process research towards eletriptan: a fischer indole approach. Org. Process Res. Dev.. 2011;15(1):98-103.
- [CrossRef] [Google Scholar]
- M. Aslam, M. A. Kalyar, and Z. A. Raza, “Polyvinyl Alcohol : A Review of Research Status and Use of Polyvinyl Alcohol Based Nanocomposites,” pp. 1–14, 2018, doi: 10.1002/pen.24855.
- Morphological and optical characteristics of chitosan(1–x): Cuox (4 ≤ x ≤ 12) based polymer nano-composites: Optical dielectric loss as an alternative method for tauc’s model. Nanomaterials. 2017;7(12):1-15.
- [CrossRef] [Google Scholar]
- The study of plasticized amorphous biopolymer blend electrolytes based on polyvinyl alcohol (PVA): chitosan with high ion conductivity for energy. Polymers (Basel). 2020;vol. 12:1938.
- [CrossRef] [Google Scholar]
- S. B. Aziz, M. A. Rasheed, and H. M. Ahmed, “Synthesis of polymer nanocomposites based on [methyl cellulose](1-x):(CuS)x (0.02M ≤ x ≤ 0.08 M) with desired optical band gaps,” Polymers (Basel)., vol. 9, no. 6, 2017, doi: 10.3390/polym9060194.
- S. B. Aziz, M. H. Hamsan, M. F. Z. Kadir, W. O. Karim, and R. M. Abdullah, “Development of polymer blend electrolyte membranes based on chitosan: Dextran with high ion transport properties for EDLC application,” Int. J. Mol. Sci., vol. 20, no. 13, 2019, doi: 10.3390/ijms20133369.
- Optical characteristics of polystyrene based solid polymer composites: effect of metallic copper powder. Int. J. Met.. 2013;2013:1-6.
- [CrossRef] [Google Scholar]
- Fabrication of polymer blend composites based on [PVA-PVP](1–x):(Ag2S)x (0.01 ≤ x ≤ 0.03) with small optical band gaps: Structural and optical properties. Mater. Sci. Semicond. Process.. May 2017;71:197-203.
- [CrossRef] [Google Scholar]
- S. B. Aziz et al., “The study of electrical and electrochemical properties of magnesium ion conducting CS: PVA based polymer blend electrolytes: Role of lattice energy of magnesium salts on EDLC performance,” Molecules, vol. 25, no. 19, 2020, doi: 10.3390/molecules25194503.
- S. B. Aziz et al., “Characteristics of poly(Vinyl alcohol) (PVA) based composites integrated with green synthesized Al3+-metal complex: Structural, optical, and localized density of state analysis,” Polymers (Basel)., vol. 13, no. 8, 2021, doi: 10.3390/polym13081316.
- Chemically room temperature crosslinked polyvinyl alcohol (PVA) with anomalous microwave absorption characteristics. Macromol. Rapid Commun.. 2021;42(10):1-7.
- [CrossRef] [Google Scholar]
- Synthesis, characterization and DFT calculations of electronic and optical properties of CaMoO4. Phys. B Condens. Matter. 2016;497:34-38.
- [CrossRef] [Google Scholar]
- Sum frequency generation vibrational spectroscopy of pyridine hydrogenation on platinum nanoparticles. J. Phys. Chem. C. 2008;112(31):11865-11868.
- [CrossRef] [Google Scholar]
- Piecing together the puzzle: understanding a mild, metal free reduction method for the large scale synthesis of hydrazines. Tetrahedron. 2011;67(52):10296-10303.
- [CrossRef] [Google Scholar]
- Tea from the drinking to the synthesis of metal complexes and fabrication of PVA based polymer composites with controlled optical band gap. Sci. Rep.. 2020;10(1):1-17.
- [CrossRef] [Google Scholar]
- Green coordination chemistry as a novel approach to fabricate polymer:Cd(II)-complex composites: Structural and optical properties. Opt. Mater. (Amst). 2021;116:111062
- [CrossRef] [Google Scholar]
- Structural, ion transport parameter and electrochemical properties of plasticized polymer composite electrolyte based on PVA : a novel approach to fabricate high performance EDLC devices. Polym. Test.. June 2020;vol. 91:106813
- [CrossRef] [Google Scholar]
- M. A. Brza et al., “Characteristics of a Plasticized PVA-Based Polymer Electrolyte Membrane and H + Conductor for an Electrical Double-Layer Capacitor : Structural , Morphological , and Ion Transport Properties,” Membranes (Basel)., vol. 11, no. 1, 2021, doi: 10.3390/membranes11040296.
- Synthesis and characterization of polyvinyl alcohol-g-polystyrene copolymers via MADIX polymerization technique. Iran. Polym. J. (English Ed.). 2021;30(9):885-895.
- [CrossRef] [Google Scholar]
- Determination of small interactions in polymer composites by means of FTIR and DSC. Polym. Bull.. 2000;300:293-300.
- [CrossRef] [Google Scholar]
- Review of the oral toxicity of polyvinyl alcohol (PVA) Food Chem. Toxicol.. 2003;41(3):319-326.
- [CrossRef] [Google Scholar]
- Ascorbic acid: chemistry, biology and the treatment of cancer. Biochim. Biophys. Acta - Rev. Cancer. 2012;1826(2):443-457.
- [CrossRef] [Google Scholar]
- Infrared spectra of aqueous sodium benzoates and salicylates in the carboxyl-stretching region: chelation in aqueous sodium salicylates. Can. J. Chem.. 1969;47(24):4577-4588.
- [CrossRef] [Google Scholar]
- Structure/property relationship of polyvinyl alcohol/dimethoxydimethylsilane composite membrane: experimental and theoretical studies. Spectrochim. Acta - Part A Mol. Biomol. Spectrosc.. 2020;228:117810
- [CrossRef] [Google Scholar]
- Ascorbic acid for the safe use of a sunscreen agent: accumulation of nano zinc oxide and titanium dioxide on the skin. Sci. Pharm. 2013
- [CrossRef] [Google Scholar]
- Effect of Ag-nanoparticles doped in polyvinyl alcohol on the structural and optical properties of PVA films. J. Nanomater.. 2013;2013:2.
- [CrossRef] [Google Scholar]
- First-principles study of electronic structures and optical properties of Cu, Ag, and Au-doped anatase TiO 2. Phys. B Condens. Matter. 2012;407(6):1003-1007.
- [CrossRef] [Google Scholar]
- Effect of sulfonamide antibiotics on microbial diversity and activity in a Californian Mollic Haploxeralf. J. Soils Sediments. 2010;10(3):537-544.
- [CrossRef] [Google Scholar]
- Structural, vibrational and electrical characterization of PVA-NH4Br polymer electrolyte system. Phys. B Condens. Matter. 2008;403(17):2740-2747.
- [CrossRef] [Google Scholar]
- M. M. Hiva Nargesi Khoramabadia*, Mehrnoosh Arefianb, Mahsa Hojjatic, Iman Tajzadd, Ali Mokhtarzadee and Ata Jamavarig, “A review of polyvinyl alcohol/carboxymethyl cellulose (PVA/CMC) composites for various applications,” J. Compos. Compd., vol. 2, pp. 69–76, 2020, doi: https://doi.org/10.29252/jcc.2.2.2.
- T. Hu, I. R. Baxendale, and M. Baumann, “Exploring flow procedures for diazonium formation,” Molecules, vol. 21, no. 7, 2016, doi: 10.3390/molecules21070918.
- 1,3,4-Thiadiazole: Synthesis, reactions, and applications in medicinal, agricultural, and materials chemistry. Chem. Rev.. 2014;114(10):5572-5610.
- [CrossRef] [Google Scholar]
- Surface plasmon resonance enhanced magneto-optics (SuPREMO): faraday rotation enhancement in gold-coated iron oxide nanocrystals. Nano Lett.. 2009;9(4):1644-1650.
- [CrossRef] [Google Scholar]
- “Environment Benevolent Biodegradable Polymers: Synthesis, Biodegradability, and Applications”, Cellul. Fibers Bio-. 2011. p. :425-451.
- [CrossRef]
- Effect of the residual water content in gels on solution combustion synthesis temperature. J. Sol-Gel Sci. Technol.. 2019;93:251-261.
- [CrossRef] [Google Scholar]
- Effective graded refractive-index anti-reflection coating for high refractive-index polymer ophthalmic lenses. Mater. Lett.. 2015;160:158-161.
- [CrossRef] [Google Scholar]
- Kinetics of crosslinking reaction of PVA membrane with glutaraldehyde. Korean J. Chem. Eng.. 1994;11(1):41-47.
- [CrossRef] [Google Scholar]
- Assessment of the antiproliferative and apoptotic roles of sulfonamide carbonic anhydrase IX inhibitors in HeLa cancer cell line. J. Enzyme Inhib. Med. Chem.. 2019;34(1):75-86.
- [CrossRef] [Google Scholar]
- Pyridazinone-substituted benzenesulfonamides display potent inhibition of membrane-bound human carbonic anhydrase IX and promising antiproliferative activity against cancer cell lines. Eur. J. Med. Chem.. 2019;168:301-314.
- [CrossRef] [Google Scholar]
- Electronically tuned sulfonamide-based probes with ultra-sensitivity for Ga3+ or Al3+ detection in aqueous solution. Anal. Chim. Acta. 2017;958:38-50.
- [CrossRef] [Google Scholar]
- Synthesis and characterization of methylcellulose/PVA based porous composite. Carbohydr. Polym.. 2012;88(4):1364-1372.
- [CrossRef] [Google Scholar]
- Synthesis, characterization and electroconducting study of isomeric polythiophene†. Soft Matter. 2021;2:9697-9707.
- [CrossRef] [Google Scholar]
- Polymer thin films for antireflection coatings. J. Mater. Chem. C. 2013;1(12):2266-2285.
- [CrossRef] [Google Scholar]
- Electrical conduction and dielectric relaxation in p-type PVA/CuI polymer composite. J. Adv. Res.. 2013;4(6):531-538.
- [CrossRef] [Google Scholar]
- Structural, thermal and electrical properties of PVA-LiCF3SO3 polymer electrolyte. J. Non. Cryst. Solids. 2010;356(43):2277-2281.
- [CrossRef] [Google Scholar]
- S. Mallakpour and S. Rashidimoghadam, Poly(vinyl alcohol)/Vitamin C-multi walled carbon nanotubes composites and their applications for removal of methylene blue: Advanced comparison between linear and nonlinear forms of adsorption isotherms and kinetics models, vol. 160. Elsevier B.V., 2019.
- Development, mechanical evaluation and surface characteristics of chitosan / polyvinyl alcohol based polymer composite coatings on titanium metal. J. Mech. Behav. Biomed. Mater.. 2014;40:314-324.
- [CrossRef] [Google Scholar]
- Fourier transform infrared (FTIR) spectroscopy of biological tissues. Appl. Spectrosc. Rev.. 2008;43(2):134-179.
- [CrossRef] [Google Scholar]
- Analytica Chimica Acta Novel determination of the total phenolic content in crude plant extracts by the use of 1 H NMR of the – OH spectral region. Anal. Chim. Acta. 2011;688(1):54-60.
- [CrossRef] [Google Scholar]
- Synthesis of porous proton ion conducting solid polymer blend electrolytes based on PVA: CS polymers: structural, morphological and electrochemical properties. Materials (Basel). 2020;13(21):1-21.
- [CrossRef] [Google Scholar]
- M. M. Nofal et al., “Polymer composites with 0.98 transparencies and small optical energy band gap using a promising green methodology: Structural and optical properties,” Polymers (Basel)., vol. 13, no. 10, 2021, doi: 10.3390/polym13101648.
- T. Norris, C. Bezze, S. Z. Franz, and M. Stivanello, “Heavy-Metal-Free Reduction Methodology for Large-Scale Synthesis Applicable to Heterocyclic and Arylhydrazines,” vol. 13, no. 2, pp. 354–357, 2020, doi: 10.1021/op8002163.
- Biochar based removal of antibiotic sulfonamides and tetracyclines in aquatic environments: a critical review. Bioresour. Technol.. 2017;246(May):150-159.
- [CrossRef] [Google Scholar]
- Interaction of nitrogen dioxide with sulfonamide-substituted phthalocyanines: towards NO 2 gas sensor. Sensors Actuators, B Chem.. 2012;169(2):1-9.
- [CrossRef] [Google Scholar]
- A multistep continuous flow synthesis machine for the preparation of pyrazoles: via a metal-free amine-redox process. React. Chem. Eng.. 2016;1(1):101-105.
- [CrossRef] [Google Scholar]
- Radical Truce-Smiles reactions on an isoxazole template : scope and limitations. Tetrahedron. 2019;75(16):2413-2430.
- [CrossRef] [Google Scholar]
- “Spectrochimica acta part A : molecular and biomolecular spectroscopy molecular structure and vibrational spectra of 2, 6-bis (benzylidene) cyclohexanone : a density functional theoretical study”. Spectrochim. Acta Part A Mol. Biomol. Spectrosc.. 2011;78(1):113-121.
- [CrossRef] [Google Scholar]
- Advances in patterning materials for 193 nm immersion lithography. Chem. Rev.. 2010;110(1):321-360.
- [CrossRef] [Google Scholar]
- Y. C. Shen, P. C. Upadhya, E. H. Linfield, and A. G. Davies, “Temperature-dependent low-frequency vibrational spectra of purine and adenine Temperature-dependent low-frequency vibrational spectra of purine and adenine,” vol. 2350, no. 2003, pp. 2001–2004, 2009, doi: 10.1063/1.1565680.
- Ascorbic acid metabolism and functions: a comparison of plants and mammals. Free Radic. Biol. Med.. 2018;122:116-129.
- [CrossRef] [Google Scholar]
- Application of sulfonamide derivative of calixarene for improvement of mechanical properties and thermal stability of polyurethane composite. J. Incl. Phenom. Macrocycl. Chem.. 2015;83(1–2):45-52.
- [CrossRef] [Google Scholar]
- Magnetic responsive polymer composite materials. Chem. Soc. Rev.. 2013;42(17):7099-7116.
- [CrossRef] [Google Scholar]
- Application of polyvinyl alcohol (PVA) in cement-based composite materials: a review of its engineering properties and microstructure behavior. Constr. Build. Mater.. 2016;107:172-180.
- [CrossRef] [Google Scholar]
- L-Ascorbic Acid in Organic Synthesis: An Overview. Curr. Org. Chem.. 2009;13(1):99-122.
- [CrossRef] [Google Scholar]
- Degradation of sulfonamides as a microbial resistance mechanism. Water Res.. 2017;115:309-317.
- [CrossRef] [Google Scholar]
- Kinetics of the reduction of chromium(VI) by vitamin C. Environ. Toxicol. Chem.. 2005;24(6):1310-1314.
- [CrossRef] [Google Scholar]
- Determination of thermo-optic coefficient, refractive index, optical dispersion and group velocity parameters of an organic thin film. Phys. B Condens. Matter. 2007;393(1–2):304-309.
- [CrossRef] [Google Scholar]
- Electrical transport and optical properties of an organic semiconductor based on phthalocyanine. Phys. B Condens. Matter. 2007;393(1–2):235-238.
- [CrossRef] [Google Scholar]
- A. K. Yetisen, Y. Montelongo, and H. Butt, “Rewritable three-dimensional holographic data storage via optical forces,” Appl. Phys. Lett., vol. 109, no. 6, 2016, doi: 10.1063/1.4960710.
- Synergistic effect of silane cross-linker (APTEOS) on PVA/gelatin blend films for packaging applications. High Perform. Polym.. 2021;33(7):815-824.
- [CrossRef] [Google Scholar]


