

Chitosan capped silver nanoparticles: Adsorption and photochemical activities
⁎Corresponding author. zkkhan@kau.edu.sa (Zaheer Khan)
-
Received: ,
Accepted: ,
This article was originally published by Elsevier and was migrated to Scientific Scholar after the change of Publisher.
Peer review under responsibility of King Saud University.
Abstract
Chitosan capped silver nanoparticles (Chi-Ag) were prepared using AgNO3 and sodium borohydride. Chitosan was detected by using ninhydrin test, thermal gravimetric analysis and measurement of relative viscosity. Chi-Ag was used for removal of cadmium (Cd2+) at room temperature. The maximum monolayer adsorption capacity, and sorption intensity were estimated to be 119.04 mg/g and 1.6, respectively, from Langmuir and Freundlich adsorption isotherm models. The kinetics of Cd2+ adsorption onto Chi-Ag was proceeds through the pseudo-second-order kinetic model. Boyd and Elovich models suggest the adsorption and/or coordination of Cd2+ with the —NH2 and —OH groups of chitosan along with AgNPs proceeds through the film diffusion and chemisorption process. The average viscosity molecular weight of chitosan and Chi-Ag decreased with increased potassium persulfate (K2S2O8) and hydrogen peroxide (H2O2) concentration. The presence of H2O2 and K2S2O8 promoted the hydrolysis of chitosan due to the cleavage of glycosidic bond by generated HO• and SO4−• radicals.
Keywords
Chi-Ag
Viscosity
Cd2+
Removal
Adsorption
Film diffusion

1 Introduction
Chitosan is a coordinating polysaccharide due to the presence of amino and hydroxyl groups in the suitable position of polymer chain (Guibal, 2004; Liu et al., 2012; Weng et al., 2013; Mat Zain et al., 2014; Khan, 2020), and acted as a capping agent during the preparation of transition metal nanoparticles, composites and/or nano-adsorbents. The hydroxyl (—OH), and amino (—NH2) group of chitosan are responsible for the strong coordination with metals in an acidic (pH ≤ 3.0) and alkaline (pH ≥ 9.0) experimental conditions (Kumar et al., 2004). The use of chitosan as a capping agent for the synthesis of metal nanoparticles have been the interest of researchers due to its excellent biocompatibility (Jayakumar et al., 2010), antimicrobial activity (Liu et al., 2004), high resistance to heat (Savitri et al., 2014), and potential applications in pharmaceuticals (Knill et al., 2004), cosmetics (Muzzarelli et al., 1994), photo-based therapies (Tuong et al., 2019), food industries (Koide, 1998), removal of toxic non-biodegradable dyes (Ramalingam et al., 2015), chemical- as well as bio-sensing (Zaheer, 2021; Sharma et al., 2018); Jiang et al., 2012).
Various chitosan based nanomaterials such as cross-linked chitosan/sepiolite composite, cross-linked beads of activated oil palm ash zeolite/chitosan composite, and mesoporous-activated carbon from chitosan flakes have been prepared by using different experimental conditions, and used as an adsorbents for the removal of methylene blue and reactive orange 16 (Marrakchi et al., 2016), methylene blue and acid blue 29 (Khanday et al., 2017), and methylene blue (Marrakchi et al., 2017) dyes. The activated carbon was also derived from a single-step pyrolysis of phosphoric acid activated chitin, and used for the removal of cephalexin antibiotic (Khanday et al., 2019). These investigators were used different adsorption isotherms and kinetic models to describe the adsorption processes. Silver nanoparticles incorporated into chitosan thin films were used for various purposes including photo-oxidation of organic pollutants, heavy metal removal (Cd, Pb, Cr, and Fe) and antibacterial activity (Al-Sherbini et al., 2019). Barrow discussed the phosphate sorption curves by using Langmuir and Freundlich isotherms and suggested that the Langmuir equation was not appropriate for reaction of ions with soil. Despite the some advantages, the Freundlich equation was the best simple equation (Barrow, 2008). Generally, different model for fitting calibration curves, correlation coefficient and linearization methods have been used to explains the scientific data in the literature, and bad results were obtained from good data due to the inadequate data selection methods (Badertscher and Pretsch, 2006). Egg by-products was also used as a tool to remove direct blue 78 dye from wastewater and kinetic, equilibrium modeling, thermodynamics and desorption properties were discussed (Murcia-Salvador et al., 2020).
Cadmium is a non-essential element for human life, and widely used in batteries, fertilizers, pigments, and coating of steel. It has been recognized as a highly toxic heavy metal ion at trace levels, which can easily accumulate in ecosystem and organisms via food chain (Templeton and Liu, 2010). The Cd 2+ ions was responsible for the various human health problems such as damage of kidney, disorder of bone and an increased certain forms of cancer (Dobson, 1992). The maximum limits of Cd2+ ions in drinking water are 5.0 and 3.0 μg/L according to the Environmental Protection Energy (EPA) and World Health organization (WHO, 1998). The various LSPR based optical adsorbents were developed for the removal of Cd2+ ions from the industrial wastewater by using large number of reducing, capping and functionalized agents with techniques such as atomic absorption spectrometry, fluorescence spectroscopy, inductively coupled plasma mass spectrometry, UV–visible spectroscopy, and adsorption (Kumar and Anthony, 2014; Sun et al., 2017).
Localized surface Plasmon resonance (LSPR) band in the visible region of the spectrum is one of the amazing characteristics of silver NPs (Vilela et al., 2012). Their sensing properties strongly depend on the composition, inter-particle distance, and position of LSPR band, well-defined color, and easy visualization of color change from yellow to brown for AgNPs. The functionalized and non-functionalized AgNPs with various types of stabilizing and capping agents have significant impact on the visual sensing applications of the organic molecules (Han and Li, 2010), pesticides (Rahim et al., 2018), and inorganic ions (Kumar and Anthony, 2014; Huang et al., 2016). For example, the functionalized AgNPs were prepared by using N-(2-hydroxybenzyl)-valine and N-(2-hydroxybenzyl)-isoleucine as reducing and functionalizing agents, respectively, for the colorimetric determination of toxic Cd2+, Hg2+, and Pb2+ from an aqueous solution (Kumar and Anthony, 2014). Sun and his coworkers reported the use lysine- perylene capped AgNPs as a sensor for the detection of Cr6+, Pb2+, and Cd2+ at different pH (Sun et al., 2017). The Ag-Co bimetallic NPs were prepared metal replacement galvanic cell reaction and used as a catalyst for the generation of hydrogen (Aazam and Zaheer, 2022). Chitosan capped functionalized and non-functionalized AgNPs exhibits excellent optical sensing activities for the removal and detection of heavy toxic metals and non-biodegradable dyes. Jawad et al. prepared chitosan functionalized Fe, and ZnO NPs and used as an adsorbents for the removal of dyes (Jawad et al., 2019). The literature is replete with the investigations of the use of AgNPs as an optical sensor for the purification of water (Vilela et al., 2012; Prosposito et al., 2020); but the use of chitosan capped AgNPs for the detection of Cd2+ ions have been neglected.
The main objective of this work is to remove the Cd2+ using chitosan capped AgNPs as an optical adsorbent. The NaBH4-Ag+ redox reaction was used for the preparation of AgNPs in presence of chitosan as a stabilizing agent. The stability of Chi-AgNPs was determined by recording the SPR intensity and viscosity with K2S2O8 and hydrogen peroxide at room temperature. The batch adsorption experimental were analyzed by using different adsorption isotherms and kinetic models to determine the adsorption capacity, and thermodynamic parameters of the Cd2+ removal with Chi-AgNPs. Due to the strong chelating and binding nature of —NH2 and —OH groups of chitosan towards metal NPs may make it possible to increase the removal of Cd2+ in an aqueous solution.
2 Experimental
2.1 Chemicals
Cadmium nitrate (Cd(NO3)3), silver nitrate (AgNO3), sodium borohydride (NaBH4), sodium hydroxide (NaOH), chitosan (average molecular weight = 180 kDa and degree of acetylation = ≥75- to 85 %), potassium persulfate (K2S2O8, ≥99.0 %), hydrogen peroxide (30 % solution (w/w) in water and inorganic electrolytes were used as received from Sigma Aldrich. The chitosan solution (4 wt%) was prepared in buffer solution of CH3COOH-CH3COONa of pH 5.6. The reagent solutions were prepared in double distilled and deionized water. AgNO3 solution was stored in brown color glass bottle to minimize the decomposition Ag+ ions by light irradiations.
2.2 Synthesis of Chi-Ag NPs
The Ag+-NaBH4 redox reaction was used with some modification for the synthesis of AgNPs in presence of chitosan as a capping agent (AL-Thabaiti et al., 2008). Briefly, a reaction mixture containing chitosan-Ag complex was prepared by adding the required amount of chitosan (5.0 mL of 4.0 wt%) and AgNO3 (5.0 mL of 0.01 mol/L) in a conical reaction flask. The resulting solution was heated with constant stirring at 303 K for 30 min. At the same time, NaBH4 solution was added into the reaction flask drop-wise with constant stirring, and incubated at the same temperature for some time. The resulting orange color solution was centrifuged with 1500 rpm for 20 min. The solid AgNPs were removed, washed with distilled water, and dried under vacuum at 303 K.
2.3 Characterization of NPs
The optical properties (position of SPR band) and morphology of Chi-Ag NPs were determined by recording the UV–visible spectra from 250 to 800 nm on a Shimadzu UV–vis multi Spec-1501 spectrophotometer. Surface morphology, shape, size, composition, the size distribution of the Chi-AgNPs were determined with transmission electron microscope equipped with energy dispersive X-ray and scanning electron microscope. Rigaku X-ray diffractometer with Cu Kα radiation was used to determine the purity and crystalline nature of the Chi-AgNPs. Thermal gravimetric analysis were performed by heating the samples of chitosan and Chi-Fe-Pd-Ir under nitrogen gas from 0.0 to 900 °C and weight loss was recorded with NETZSCH TGA 209 TG analyzer.
2.4 Determination of Cd2+
The sorption procedure for the determination of Cd2+ ions using Chi-AgNPs as a sensor at room temperature was as follows. The 0.02 g Chi-AgNPs was added into a 100 mL round bottom conical flask. The solution of Cd2+ with varying concentration from 0.0 to 5.0 × 10⁻⁴ mol/L was added and incubated for 1 h at 303 K. The concentration of remaining in the aqueous solution Cd2+ was estimated by Atomic Absorption Spectrophotometer (model: AAS 240 FS). The percentage removal of Cd2+ was calculated for each experiment using the following formula (Eq. (1)).
2.5 Reusability of Chi-Ag
The reusability of Chi-Ag was studied by carried out five adsorption–desorption experiments with the same amount of Cd2+ ions. The used Chi-Ag was regenerated with 0.5 M HCl with a constant temperature, while was under shaking for 30 min. After the regeneration process, the supernatants were collected, washed with distilled water and ethanol until pH (5–6) was achieved, and then another adsorption process was conducted at concentration of 118.2 mg/L Cd2+ ions.
2.6 Viscosity and viscosity molecular weight of chitosan and Chi-Ag
In order to determine the viscosity of pure chitosan and Chi-AgNPs, the required amount of chitosan solution (10 mL of 4 wt%) in acetic acid-sodium acetate buffer of pH 5.6 was added into the reaction vessel having the H2O2 solution. The resulting mixture was incubated in a thermostatic water bath at 303 K for designated time periods. Aliquots of the reaction mixture were periodically withdrawn from the reaction vessel and the viscosity was determined at different time intervals by a viscometric method using an Ostwald viscometer at 303 K. The viscometer was connected to a visco-clock to record the time of solution passing through the two marks. The every value recorded with in average of 3 measurements. The relative viscosity (ηrel), specific viscosity (ηsp), reduced viscosity (ηred), inherent viscosity (ηinh), and intrinsic viscosity [η] of degraded chitosan were calculated with the following relations (Eqs. (3)–(7)) (Wang et al., 1991).
3 Results and discussion
3.1 Role of chitosan and stability of Chi-AgNPs
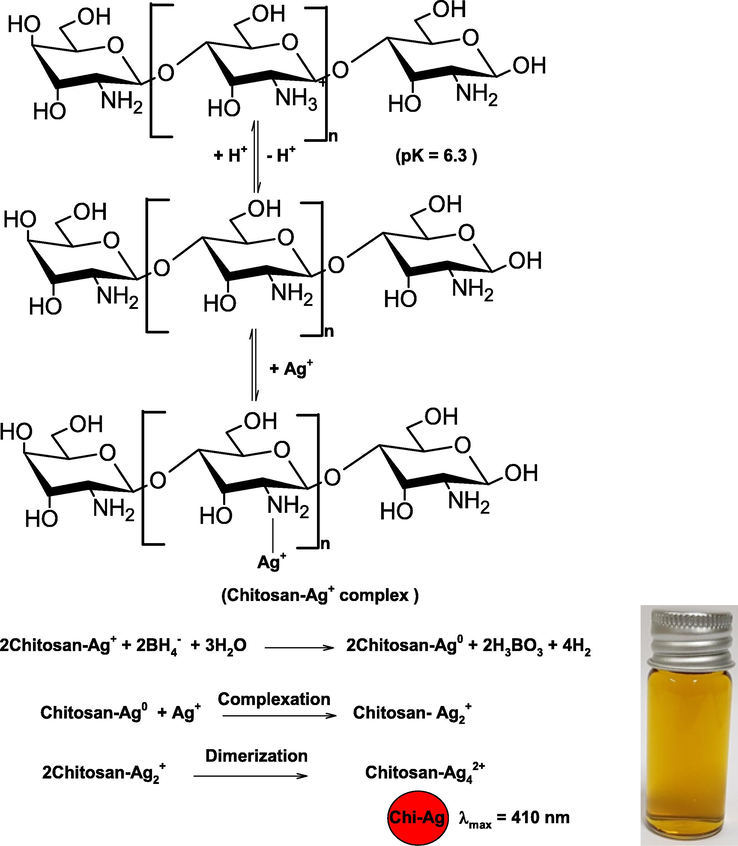
Chitosan possesses unique properties due to the presence of 2–amino-2-deoxyglucose units in a chitosan back bone. The presence of —NH2 group in the chitosan permits bringing the polymer into solution by salt formation due to the protonation and deprotonation of primary aliphatic amine by selected weak organic acids (Kumar et al., 2004). The pK of chitosan amine is ca. 6.3. The amine sites of chitosan was protonated in an acidic solution (pH ≤ 6.3). The each monomer of chitosan could be coordinated with the Ag+ ions through the —NH2 group, which leads to the formation of chitosan-silver complex. The reduction potential of silver ions (Ag+/Ag0 = 0.799 V) was reduced to certain extent due to the complex formation with chitosan (Goia and Matijevic, 1998). Therefore, the strong reducing agent (NaBH4) was used to the reduction of Ag+ ions coordinated with chitosan into the metallic silver. Fig. 1 shows the UV–visible spectra of Chi-AgNPs formation as a function of time. SPR peak intensity increases at 410 nm, indicating the reduction of Ag+ ions into metallic Ag (orange color silver sols) in presence of chitosan. The resulting orange color of AgNPs was stable for six months and no precipitates and turbidity were appeared. Chitosan acted as a coordinating as well as capping agent during the synthesis of stable AgNPs under our experimental conditions (Scheme 1).
![UV–visible spectra of Chi-Ag and their optical image. Reaction conditions: [chitosan] = 2.0 mM, [NaBH4] = 0.01 mol/L, Ag+ = 1.0 mM.](/content/184/2022/15/11/img/10.1016_j.arabjc.2022.104154-fig1.png)
- UV–visible spectra of Chi-Ag and their optical image. Reaction conditions: [chitosan] = 2.0 mM, [NaBH4] = 0.01 mol/L, Ag+ = 1.0 mM.
- Coordinating and capping behavior of chitosan for the synthesis of AgNPs.
In Scheme 1, chitosan-Ag+ complex was reduced by borohydride into chitosan-Ag0 (one-step oxidation–reduction mechanism as a rate determining step). The Ag0 was formed complex with Ag+ very rapidly (Ag2+), which undergoes dimerization and Ag42+ was generated as the stable colloidal silver (Henglein, 1993). The Ag42+ was stabilized by the chitosan.
Generally, ninhydrin was used for the quantitative analysis of amino acids and organic compounds containing primary amino group (Kabir-ud-Din et al., 1999). Ninhydrin reacts with —NH2 group, and purple colored reaction product, diketohydrindylidene- diketohydrinamine, also called Ruhemann’s purple was formed at pH 5.0–6.0. To detect the presence of chitosan onto the surface of AgNPs, ninhydrin solution was prepared in the CHCOOH-CH3COONa buffer solution of pH 5.5. Chitosan and Chi-AgNPs were added into the ninhydrin reagent seperately, heated at 363 K for 5 min. The purple color was appeared for both (chitosan and Chi-AgNPs) solutions, and their intensity were measured at 575 nm at different time intervals. Ninhydrin reacts with —NH2 group of chitosan, which leads to the formation of purple color (Prochazkova et al., 1999). Thus, we may state confidently that the chitosan stabilized and/or capped the AgNPs.
3.2 Removal of Cd2+
In order to determine the effect of contact time on Cd2+ removal, the adsorption studied were carried out at two different initial concentrations (23.4 and 118.2 mg/L) of Cd2+ keeping the other parameters constant (pH = 8.0, amount of adsorbent = 0.02 g/L, stirring speed = 200 rpm, and temperature = 303 K). Fig. 2A shows that the Cd2+ removal percentage recorded the highest value at ca. 50 min. The removal percentage became constant with increasing contact time and an equilibrium was established for Cd2+ removal on the Chi-Ag adsorbent. The pH of the solution is an important parameter for the pH sensitive adsorbent as well as metal ions. Chitosan has pH sensitive —NH2 and —OH groups. Therefore, the effect of pH on Cd2+ removal by Chi-Ag was studied at different pH (ranging from 4.0 to 10.0) with fixed concentrations of Cd2+ (23.4 and 118.2 mg/L), stirring speed = 200 rpm, contact time = 50 min, amount of adsorbent = 0.02 g/L at 303 K. The removal rate of Cd2+ increases with rising pH from 4.0 to 8.0, and then decreases at higher pH (Fig. 2B). The percentage removal was increased from 12.8 % to 90 % and 7.8 % to 75 %, respectively, for 23.4 and 118.2 mg/L Cd2+ when the pH increased from 4.0 to 8.0. The maximum removal percentage was observed at pH 8.0. These observations can be rationalized due to the protonation of —NH2 into —NH3+ group of chitosan at lower pH. As the pH increases, the percentage of nonprotonated amino group (—NH2) increases, which in turn, increases the percentage removal due to the adsorption of Cd2+ onto Chi-Ag. At higher pH, the solubility of chitosan decreases in an aqueous solution, the adsorption rate decreases. Cd2+ adsorbed onto the surface of Chi-Ag through the electrostatic interactions between the positive charge of cadmium ions and lone-pair electrons of chitosan —NH2 groups. On the other hand, the various species of Cd2+ are present in water at different pH (Eqs. (10)–(12)) (Garg et al., 2008).
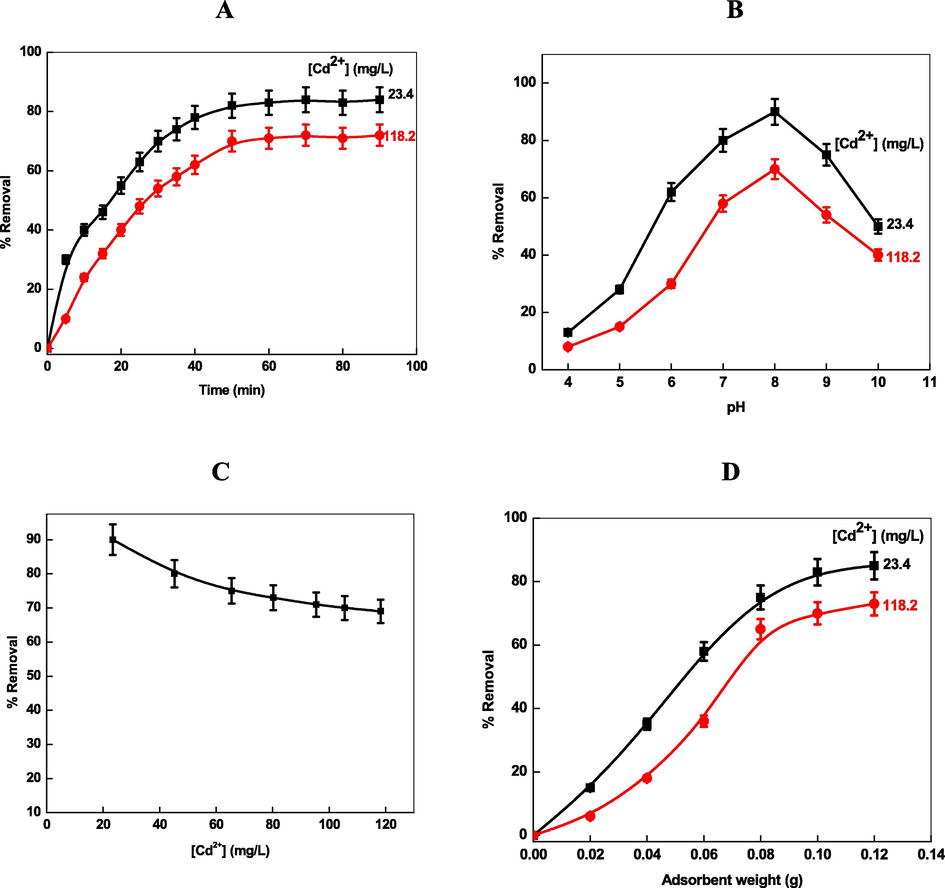
- Effect of contact time (A), pH (B), concentration of Cd2+, and amount of loaded adsorbent (D) for the removal of Cd2+ by Chi-Ag.
The percentage removal of metal ion is related to the surface functional groups of adsorbent and the metal chemistry in solution at different pH. The effects of Cd2+ concentration (from 23.4 to 118.2 mg/L) were also studied on the removal of Cd2+ at constant pH = 8.0, dose of adsorbent = 0.02 g/L, and contact time = 50 min at 303 K. The removal percentage decreases with increasing the concentration of Cd2+ ions (Fig. 2C). As the Cd2+ was increased from 23.4 to 118.2 mg/L, the removal rate was decreased from ca. 90 % to 70 %, respectively, which indicates that the removal efficiency and initial metal ion concentration play a significant role during the adsorption process. These results can be attributed to increased rate of mass transfer with the concentration of Cd 2+ ions (Ho, Chiang, & Hsu, 2001). At higher Cd2+ concentration, the adsorption sites of Chi-Ag decrease and therefore the percentage removal decreases (Ozacar and Sengil, 2005). The Cd2+ removal was investigated at different amount of loaded Chi-Ag (ranging from 0.02 to 0.12 g/L) with fixed concentrations of Cd2+ (=23.4 and 118.2 mg/L), pH = 8.0, and contact time = 50 min. The rate of removal increases with increasing the adsorbent amount till reach to stable level (Fig. 2D), which might be due to the higher adsorption sites and surface area at high dose of the Chi-Ag adsorbent.
3.3 Adsorption isotherms and kinetics
In order to relate the adsorbate concentration in the bulk and the adsorbed amount at the interface, the different adsorption isotherm model have been used (Foo and Hameed, 2010). Langmuir, and Freundlich isotherm are commonly used to explain the adsorption of dyes and heavy metals on the homogeneous monolayer surfaces and heterogeneous surfaces, respectively. Temkin and DRK isotherms are used to determine the nature of adsorption and free energy of adsorption. The results of Cd2+ removal were analyzed by using the Langmuir, Freundlich, Temkin and DRK isotherms. According to the Langmuir isotherm (Eq. (13)).
The linear plot of 1/qe against 1/Ce shows that the adsorption of Cd2+ onto the Chi-Ag obeys the Langmuir isotherm (Fig. 3A), proceeds through the formation of monolayer of Cd2+ on the surface of the adsorbent, and there is no interaction between Cd2+ ions adsorbed on adjacent binding sites (Garg et al., 2008). Langmuir adsorption parameters (Q0max and KL) were evaluated from the intercept and slope of the Fig. 3A. These values are summarized in Table 1 along with the value of linear regression coefficient (R2).
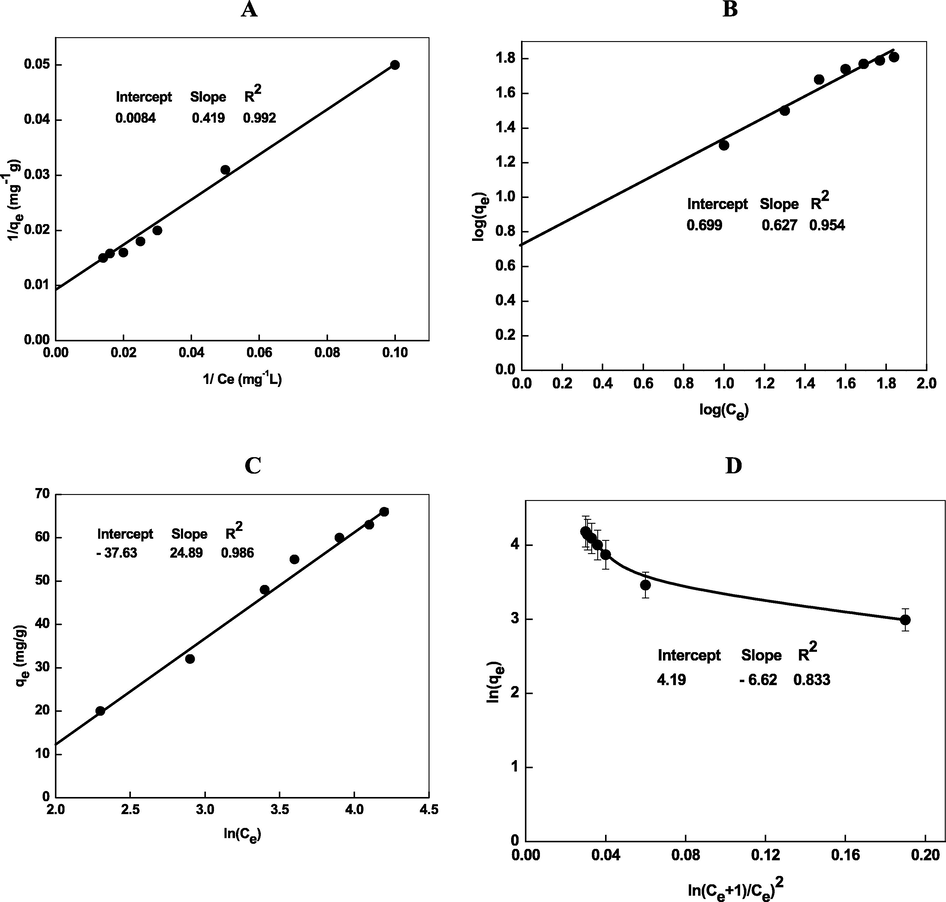
- Isotherm plots (Langmuir (A), Freundlich (B), Temkin (C), and Dubinin-Radushkevich (D)) for the removal of Cd2+ by Chi-Ag. Reaction conditions: pH = 8.0, amount of loaded Chi-Ag = 0.02 g/L.
| Adsorption isotherm | Parameter | Value |
|---|---|---|
| Langmuir | Q0max (mg/g) KL (L/mg) RL R2 |
119.2 0.018 0.99 0.992 |
| Freundlich | logKF (mg/g) 1/n n R2 |
0.69 0.62 1.6 0.954 |
| Temkin | bT (J/mol) KT (L/mg) R2 |
0.101 0.22 0.986 |
| Dubinin-Radushkevich | qDR(mg/g) KDR (mol2J−2) Efree (kJ/mol) R2 |
66.02 2.62 × 10⁻³ 0.072 0.833 |
The Freundlich isotherm was used to determine the surface heterogeneity of the Chi-AgNPs. The nonlinear and linear form of isotherm are given as:
A plot of log(qe) against log(Ce) gives a straight line with an intercept (=logKF) on the y-axis and slope (=1/n) from which Freundlich isotherm parameters (KF and 1/n) can be evaluated (Fig. 3B). The 1/n was found to be 0.62, which suggests that the adsorption of Cd2+ onto Chi-Ag was favorable. The R2 (=0.954) obtained from Freundlich isotherm is less than that obtained from Langmuir (R2 = 0.992). This result indicates that the removal of Cd2+ by Chi-Ag fitted well to Langmuir model.
Temkin and Pyzhev evaluated the heat of adsorption (ΔHads) of the interactions between the adsorbent and adsorbate at the surfaces (Zaheer et al., 2019a,b). The isotherm is given as:
Eq. (18) is linearized thus:
DRK isotherm was also employed to determine the nature of Cd2+ removal and to calculate the mean free energy (Efree) (Foo and Hameed, 2010). The linear form of isotherm is express as follows (Eq. (19)).
The DRK isotherm parameters, qDR and KDR are calculated from Fig. 3D and found to be 66.02 mg/g and 0.072 mol2/J2, respectively. The KDR value was used to the estimation of free energy of adsorption (Efree) with Eq. (20), which provides an information about the of adsorption per molecule of Cd2+.
The value of Efree was found to be 0.072 kJ/mol (Table 1), which indicates that the removal of Cd2+ by Chi-Ag proceed through the physicosorption by process. It is well known that the Efree should be 8–16 kJ/mol for chemisorption adsorption (Kim and Choi, 2017).
Various kinetic models have been proposed and modified to explain the removal kinetics and mechanism of metal ions by an adsorbent from aqueous solution. The pseudo-first order (Lagergren model), and pseudo-second order models were used to describe the mechanism of Cd2+ uptake by Chi-Ag (Foo and Hameed, 2010; Zaheer et al., 2019a,b). The pseudo-first order kinetic model is given as:
The values of qe, cal and k1 were calculated from the intercept = logqe, and slope = −k1/2.303 of the plot of log(qe − qt) against time (Fig. 4A). Eq. (22) was employed to the calculation of pseudo-second order rate constant (k2).
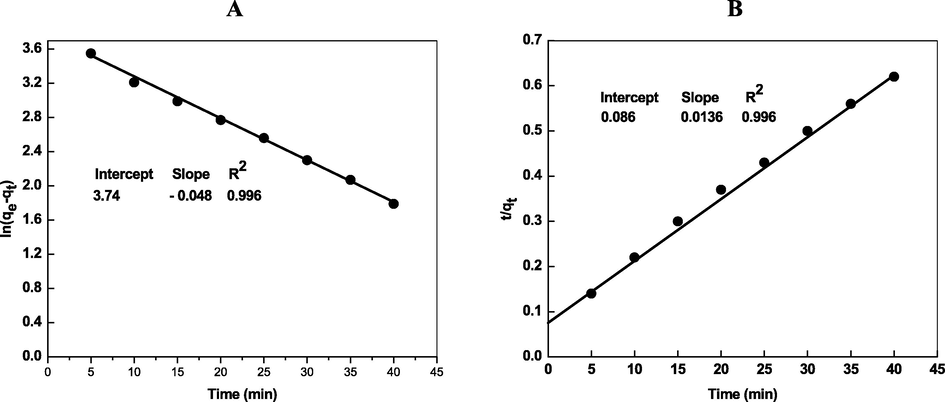
- Kinetic plots (Pseudo-first order (A), pseudo-second order (B), intraparticle diffusion (C) and Elovich (D)) for the removal of Cd2+ by Chi-Ag. Reaction conditions: pH = 8.0, amount of loaded Chi-Ag = 0.02 g/L.
The values of k2 and qe, cal were calculated from Fig. 4B. These values are summarized given in Table 2 with R2. The adsorption capacity (qe, cal = 73.52 mg/g) calculated by using Eq. (22) was very close to the experimental value (qe = 70 mg/g). These indicate that the pseudo second-order kinetic model can be used to describe chemisorption of Cd2+) onto Chi-Ag NPs. In addition, on the basis of Eq. (22), the activation energy (Ea) for Cd2+ adsorption onto Chi-Ag was calculated using the Arrhenius equation (lnk2 = lnA – Ea/RT) and found to be 23.0 kJ/mol, which indicates that the adsorption of Cd2+ was regarded as a chemically dominated adsorption since Ea is higher than 21 kJ/mol (Weng et al., 2013).
| Kinetic model | Parameter | Value |
|---|---|---|
| Pseudo-first order | k1 (min−1) qe (cal) (mg/g) R2 |
0.048 42.09 0.996 |
| Pseudo-second order | k2 (min−1) qe (cal) (mg/g) R2 |
0.002 73.52 0.996 |
| Weber - Morris | kdif (mg/g. min)I (mg/g) R2 |
6.86 22.13 0.976 |
| Elovich | β (mg/g)α (mg/g. min) R2 |
0.072 35.02 0.999 |
| Boyd | Boyd parameter R2 |
0.046 0.997 |
3.4 Intra-particle diffusion
For the estimation of thickness surface boundary (I) of the Chi-Ag adsorbent, the intra-particle diffusion (Weber and Morris, 1963) model was employed (Eq. (23)).
The plot of qt versus t1/2 should be straight line with positive intercept on the y-axis with Eq. (23). Fig. 5A shows that the plot is not passes through the origin, it has some value of intercept, indicating that adsorption of Cd2+ ions onto adsorbent does not proceed through the intraparticle diffusion mechanism as a sole rate-determining step. The plot of qt against t1/2 (Fig. 5A) was linear and the value of rate constant for intra-particle diffusion and thickness surface boundary were calculated from the slope and intercept of Fig. 5A and the values of kdif and I were found to be 6.86 mg/g min and 22.13 mg/g, respectively, with R3 = 0.979 (Table 2). To establish the Cd2+ adsorption onto Chi-AgNPs proceeds via intra-particle diffusion, the log Δq was plotted against log t, where Δq = percentage of solute (Cd2+) removal and t = contact time (Fig. 5B). In order to determine the intra-particle diffusion rate (Ki) and intra-particle diffusion coefficient (Di), the adsorption rates were analyzed by using Urano and Tachikawa model (Urano and Tachikawa, 1991). The linear relationship between –log(qe − qt/qe)2 versus time is shown in Fig. 5C. The value of Ki = 24.72 mg/g/s1/2 and Di = 5.87 × 10⁻¹³ cm2/s are calculated from the Fig. 5C. On the basis these results, we state confidently that the intra particle diffusion is not the only rate controlling factor.
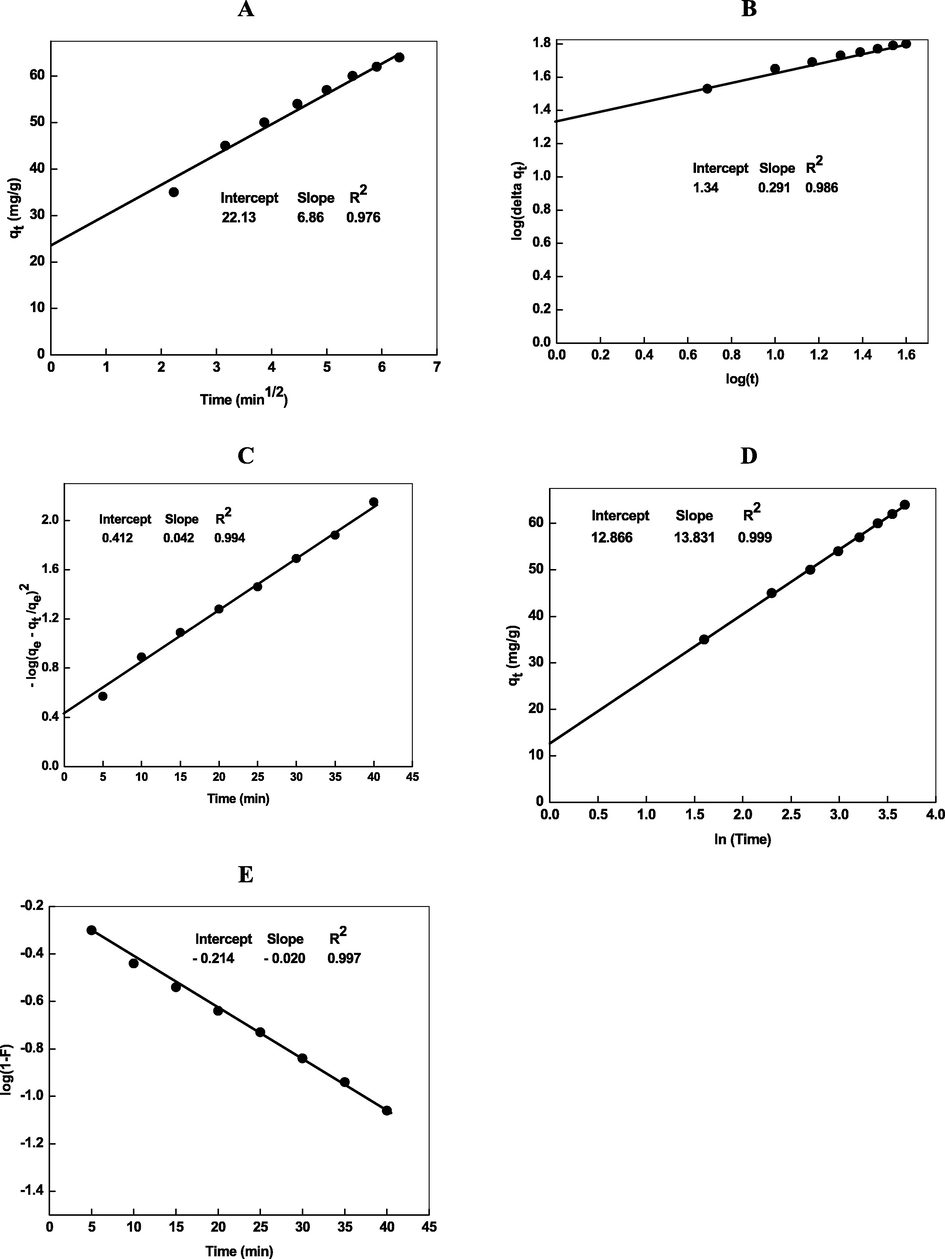
- Intraparticle diffusion (A, B), Urano and Tachikawa (C), and Elovich (D) plots for the removal of Cd2+ by Chi-Ag. Reaction conditions: pH = 8.0, amount of loaded Chi-Ag = 0.02 g/L.
Mass transfer plays an important role in sequestering heavy metal ion from aqueous solution by the adsorption process on the solid materials. In the present study, the mass transfer has been studied according to the Boyd model (Eq. (24)) (Boyd et al., 1947) assuming diffusion resistance within the particle to be negligible (Garg et al., 2008).
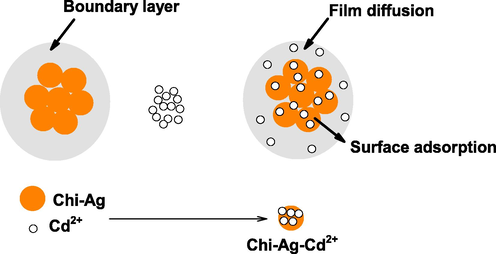
- Diffusion of Cd2+ on the boundary and surface of Chi-Ag NPs.
Elovich kinetic model was used to explain the nature of adsorption (Eq. (25)), which describes a multilayer adsorption.
Elovich kinetic plot (Fig. 5D) was linear with intercept (1/βln(αβ)) on the y-axis and a slope (1/β). The higher R2 (=0.999) shows the adsorption of more Cd2+ ions onto the adsorbent (Chi-Ag) via coordination with —OH and NH2 groups of chitosan. Thus we may safely concluded that removal of Cd2+ by Chi-Ag proceeds through the adsorption (physicosorption and chemisorption) via pseudo-second order kinetic model (Table 2). For the removal of metal ions and dyes through adsorption, both processes such as physical and chemical (physicosorption and chemisorption) operates simultaneously, which depends on the nature of adsorbent as well as adsorbate (Marrakchi et al., 2017; Zaheer et al., 2019a,b).
In order to determine the nature of Cd2+ removal, the batch sorption experiments were carried out at different temperature. The change in free energy of adsorption (ΔG0), enthalpy (ΔH0) and entropy (ΔS0) were calculated using the Eqs. (26), (27), and (28).
| Adsorbent | Q0max (mg/g) | Reference |
|---|---|---|
| Porous-magnetic chitosan beads | 188 | Rorrer et al., 1993 |
| Kraft lignin | 137.14 | Mohan et al., 2006 |
| Sugarcane bagasse | 189 | Ibrahim et al., 2006 |
| Agricultural waste biomass | 105.6 | Garg et al., 2008 |
| Iron ore slime | 34.75 | Mohapatra et al., 2009 |
| Thiocarbamoyl chitosan | 666.7 | Chauhan et al., 2012 |
| Silver nanoparticles | 0.845 | Al-Qahtani, 2017 |
| Chitosan-coated gasifier biochar | 85.8 | Burk et al., 2020 |
| Chitosan-Ag NPs | 119.2 | Present work |
| Time (min) | Chitosan [η] (mL/g) Mν (g/mol) |
Chi-Ag[η] (mL/g) Mν (g/mol) |
|---|---|---|
| 0 | 1.87 (1.87) 7.9 × 10⁴ (7.9 × 10⁴) | 0.9 (0.9) 3.0 × 10⁴ (3.0 × 10⁴) |
| 10 | 1.75 (1.87) 7.3 × 10⁴ (7.9 × 10⁴) | 0.7 (0.9) 2.1 × 10⁴ (3.0 × 10⁴) |
| 20 | 1.63 (1.87) 6.6 × 10⁴ (7.9 × 10⁴) | 0.5 (0.9) 1.4 × 10⁴ (3.0 × 10⁴) |
| 30 | 1.02 (1.87) 3.5 × 10⁴ (7.9 × 10⁴) | 0.3 (0.9) 0.7 × 10⁴ (3.0 × 10⁴) |
| 40 | 0.8 (1.21) 2.6 × 10⁴ (4.4 × 10⁴) | 0.2 (0.18) 0.4 × 10⁴ (0.36 × 10)4 |
| 50 | 0.6 (0.67) 1.4 × 10⁴ (2.0 × 10⁴) | 0.2 (0.16) 0.4 × 10⁴ (0.31 × 10⁴) |
| 60 | 0.5 (0.47) 1.1 × 10⁴ (1.2 × 10⁴) | 0.2 (0.15) 0.4 × 10⁴ (0.28 × 10⁴) |
3.5 Storage stability of chitosan and Chi-AgNPs
Glycoside bond of chitosan undergoes hydrolysis in presence of acid, enzyme, H2O2, K2S2O8 and ultraviolet light and lower molecular weight chitosan was formed (No et al., 2006; Wang et al., 2005; Hsu et al., 2002). Therefore, the rate of hydrolysis of pure chitosan and Chi-Ag were determined under three different experimental conditions (with K2S2O8, H2O2 and without oxidizing agent) at 303 K and was followed by viscometer to determine molecular weight. Fig. 6A shows the effect of storage time on the change of the relative viscosity of chitosan at 303 K in presence of acetic acid. The viscosity was decreased with storage time, which might be due to the hydrolysis of glycosidic linkage of chitosan under acidic conditions. The rate of hydrolysis was not observed at pH 6.5 in absence of acetic acid for ca. 10 h. The viscosity decreased exponentially initially and then decreased much more slowly with the increasing storage time. The relative viscosity decreased, as expected, with increasing acetic acid concentration (from 91, 80, 78, and 75 % with 10, 20, 40, and 60 % acetic acid (v/v), respectively), these results can be rationalized due to the acid catalyzed cleavage of chitosan glycosidic bond in acidic reaction media. No et al. reported the effect of acetic acid on the viscosity of chitosan as a function of time (No et al., 2006).
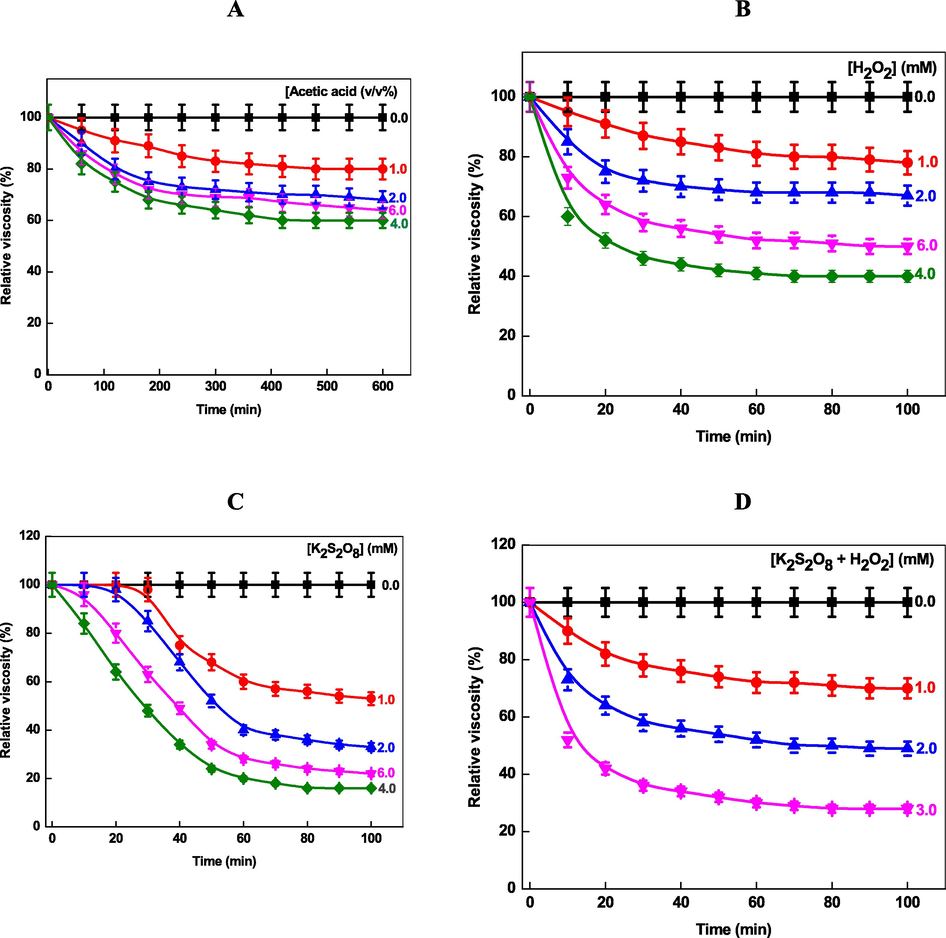
- Effect of acetic acid (A), H2O2 (B), K2S2O8 (C), and H2O2 + K2S2O8 on the hydrolysis of chitosan as a function of time at 303 K.
It has been reported that the H2O2 and K2S2O8 are the very effective reagents in the degrading the chitosan (Wang et al., 2005). The effects of H2O2 and K2S2O8 concentration were investigated on the degradation of chitosan. It was observed that solution viscosity decreased very fast in a short reaction time (Fig. 6B). Table 4 shows that the viscosity of chitosan depends on the nature of reducing agents·H2O2 showed the initial higher hydrolysis rates, reaching a viscosity decrease greater than 46 % in only 30 min at room temperature at 4.0 mM H2O2 concentration. For K2S2O8, the viscosity remains constant for ca. 30 min, and then decreases very fast with time at lower concentration (Fig. 6C). The chitosan hydrolysis proceeds through an induction period followed by an auto-acceleration, which might be due to the time required for the activation of K2S2O8 (generation of reactive oxygen species). At higher K2S2O8 concentration, the hydrolysis became very fast and viscosity decrease greater than 42 % within 30 min of the reaction time. Data from the Fig. 6B and 6C indicate that the viscosity of chitosan solution decreases by 40 % and 20 % of the initial value in presence of H2O2 and K2S2O8, respectively, after 100 min of storage under our experimental conditions.
The relative viscosity of chitosan was decreased to 95 %, 85 %, 60 %, 73 % and 87 %, 72 %, 46 %, 58 % at 10 and 30 min with increasing H2O2 concentration (Fig. 6B). Under the identical K2S2O8 (Fig. 6C), the relative viscosity of chitosan was decreased to 0.0 %, 0.0 %, 0.0 %, 84 %, 96 % and 98 %, 85 %, 48 %, 63 % at 10 and 30 min, respectively. It is interesting to note that in the reaction mixture combined with H2O2 and K2S2O8 hydrolysis (Fig. 6D), the relative viscosity was decreased to 90 %,73 %, 52 % and 78 %, 58 %, 36 % for 1.0, 2.0, 3.0 mM of reducing agent concentrations at 10 and 30 min, respectively. The reaction-time profiles changed entirely in presence of both reducing agents (no induction period was observed). Inspection of Fig. 6D clearly indicates that the synergistic effects are operative in the hydrolysis of chitosan with H2O2 and K2S2O8. On the other hand, it should be noted that the excess of H2O2 and/or K2S2O8 (Fig. 6 B and C) likely acts as the scavenger of hydroxyl (OH•) and sulfate (SO4•−) radicals respectively, which may reduce the efficiency of generated reactive oxygen species (Eqs. (29)–(33)) (Chen et al., 2004; Anipsitakisand and Dionysiou, 2004; Hussain, et al., 2014; Al-Shehri et al., 2021).
The viscosity decrease observed over time is probably due to the hydrolysis of glycoside bonds of chitosan in presence of H2O2 (reduction potential = 1.76 V) and/or K2S2O8 (reduction potential = 2.01 V) due to the generated HO• (reduction potential = 2.8 V) and SO4•− (reduction potential = 2.6 V) radicals. Chitosan was degraded into the smaller polymer chain, and its properties in solution may differ due to the formation of different functional groups (Eqs. (34) and (35)) (No et al., 2003).
The intrinsic viscosity of chitosan decreased very fast in presence of H2O2 and K2S2O8 for ca. 30 min and then already reached a plateau value (Table 4). The molecular weight of Chi-Ag was also decreases with time and reached a plateau in presence of both H2O2 and K2S2O8. These results suggest that the generated HO• by the cleavage of peroxide bond, promotes the hydrolysis of glycoside linkage of chitosan due to the formation of free radical.
3.6 Morphology of Chi-AgNPs
In order to determine the morphology of Chi-Ag, SEM and TEM images were recorded. Fig. 7A shows the size, shape and the size distribution of Chi-Ag. The resulting NPs are spherical (size ranging from 5 to 30 nm) and ploy-dispersed (Fig. 7B). The elemental composition of Chi-Ag was determine by EDX analysis (Fig. 7C). The presence of C and O along with Ag indicates the presence of chitosan on the surface of metallic Ag. TGA analysis was also measured to determine the path of chitosan degradation in presence of nitrogen. Fig. 7D shows that the initial weight loss was observed at 290 °C for chitosan. The 99 % to 50 % weight loss was observed at 350 °C. Chitosan was degraded at temperature ranging from 200 to 390 °C. On the other hand, Chi-Ag TGA curve shows the persistence of 60 % weight after heating at 500 °C.
![SEM (A), TEM (B), EDX (C) and TGA of Chi-Ag (D). Reaction conditions: [chitosan] = 2.0 mM, [NaBH4] = 0.01 mol/L and Ag+ ions = 1.0 mM.](/content/184/2022/15/11/img/10.1016_j.arabjc.2022.104154-fig9.png)
- SEM (A), TEM (B), EDX (C) and TGA of Chi-Ag (D). Reaction conditions: [chitosan] = 2.0 mM, [NaBH4] = 0.01 mol/L and Ag+ ions = 1.0 mM.
To determine the purity and crystallite size of Chi-AgNPs, the XRD spectrum was also recorded. The typical XRD patterns of Chi-Ag are depicted graphically in the form of intensity-2theta profile (Fig. 8). The four major peaks at 38.250, 44.490, 60.720, and 64.840 are corresponds to the (1 1 1), (2 0 0), (2 2 0), and (3 1 1) plans of face centered cubic (fcc) silver structure, respectively. The peaks were in agreement with the reference database in the joint committee on powder diffraction standards (file no 03-065-2871 JCPDS). The unit cell and density were calculated from the XRD data and found to be 4.08 Å, and 10.50 g/cm3, respectively. In Fig. 8, one peak is centered at 19.380, which indicate the presence of chitosan on the surface of AgNPs, so the metallic Ag could more easily penetrates through the —OH and NH2 groups of the chitosan (Wang, Du, & Liu, 2004). The crystallite size of Chi-Ag was evaluated by using the following Scherrer formula (Eq. (36)).
![XRD spectra of Chi-Ag. Reaction conditions: [chitosan] = 2.0 mM, [NaBH4] = 0.01 mol/L and Ag+ ions = 1.0 mM.](/content/184/2022/15/11/img/10.1016_j.arabjc.2022.104154-fig10.png)
- XRD spectra of Chi-Ag. Reaction conditions: [chitosan] = 2.0 mM, [NaBH4] = 0.01 mol/L and Ag+ ions = 1.0 mM.
FTIR spectra of chitosan was recorded to assess the role of functional groups in the stabilization of Chi-Ag. Fig. 9A shows a strong band in the region 3450–3315 cm−1 can be attributed N—H stretching overlapping of O—H stretch from the carbohydrate ring as well as intramolecular hydrogen bonds. The absorption band at 2874 cm−1 corresponds to the C—H symmetric stretching. The bands at 1650 cm−1 and 1325 cm−3 can be attributed to the characteristic of the amide I (C⚌O stretching) and amide III vibrations (C—N stretching), respectively, due to the presence of N-acetyl groups. In addition, the absorption bands at 1156 cm−1, and 1068 cm−1 can be attributed C—O—C bridge and C—O stretching of the carbohydrate ring (Jawad et al., 2019; Mubarak et al., 2021).
![FTIR spectra of chitosan (A), and pHzca of chitosan capped AgNPs (B). Reaction conditions: [chitosan] = 2.0 mM, [NaBH4] = 0.01 mol/L and Ag+ ions = 1.0 mM.](/content/184/2022/15/11/img/10.1016_j.arabjc.2022.104154-fig11.png)
- FTIR spectra of chitosan (A), and pHzca of chitosan capped AgNPs (B). Reaction conditions: [chitosan] = 2.0 mM, [NaBH4] = 0.01 mol/L and Ag+ ions = 1.0 mM.
To determine the net surface charge, the point of zero charge (pHpzc) test was performed and its corresponding results are presented in Fig. 9B. The pHpzc of Chi-Ag was specified to be 6.7. The adsorbent surface to be neutral in pHpzc (pH = 6.7, Fig. 9B), positive in 6.7 < pH, and negative in pH greater than 6.7. At solution pH lower than pHpzc, the removal of Cd2+ (%) by Chi-Ag decreased due to the protonation of —NH2 group of chitosan onto the surface of AgNPs (Fig. 2B).
The stability of Chi-Ag was determined by recording the zeta potential at pH = 5.6 and temperature = 30 °C at different time intervals by using the Smoluchowski relation (zeta potential (ζ) = 4ηπ/D × electrophoretic mobility, where π = 3.14, η = viscosity of the solvent and D = dielectric constant of water) (Melendrez et al., 2010). Fig. 10A shows that the zeta potential (=−30.5 V) remain constant for five days, which can be ascribed due to the strong coordination and/or capping action of chitosan around the surface of Ag. We did not observe the formation of any type of turbidity and/or precipitate during the measurement of zeta potential.
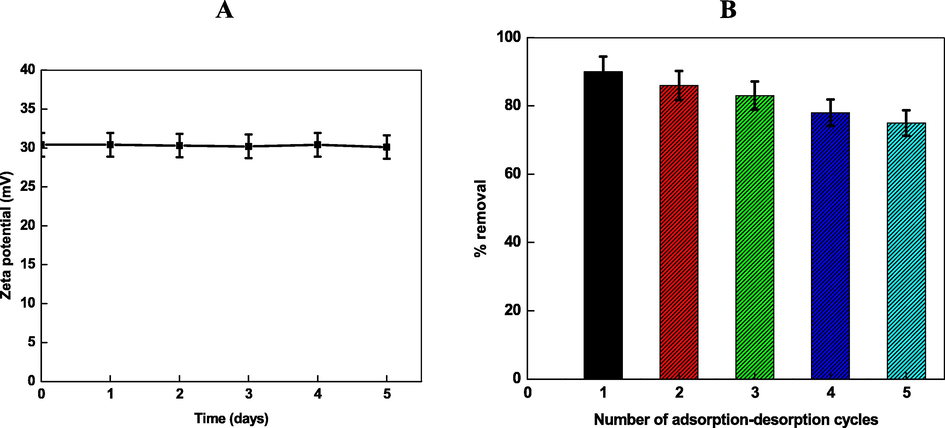
- Zeta potential (particle charge was negative) of Chi-Ag (A), and number of adsorption–desorption experiments for the removal of Cd2+ by Chi-Ag at 303 K (B).
3.7 Reusability of adsorbent
The regeneration of the adsorbent is a crucial problem for the removal of heavy metal to the industrial treatment of wastewater. Chitosan is insoluble in water and highly alkaline media. Therefore, 0.5 M HCl is used to remove the Cd2+ from the surface of the adsorbent (regeneration of Chi-Ag), and five adsorption–desorption experiments are repeated with the same amount of generated adsorbent (Lei et al., 2019). It was observed that their adsorption efficiency gradually decreases with adsorption–desorption consecutive cycles (Fig. 10B), which might be due to the acid catalyzed hydrolysis of chitosan glycoside bonds. The possibility of the dissolution of Ag+ from the surface of Ag0 cannot be ruled out completely. The percentage recovery of Cd2+ was 75 % after completion of 5th experiment, indicating that the Chi-Ag exhibits an excellent reusability, and provides a basis for the practical application of Chi-Ag to the removal of heavy metal ions from wastewater (Mubarak, et al., 2021).
3.8 Mechanism of Cd2+ removal
It is known that the pH of the reaction media plays in significant role during the removal of pH sensitive adsorbent as well as adsorbate. Chitosan free —NH2 groups exist in equilibrium with a —NH3+ group in presence of acidic aqueous solution (pH < 6.3). The —NH2 group are protophilic and become —NH3+ at low pH. On the other hand, Cd2+ also hydrolyzed in the aqueous solution, and various species are exists in the equilibrium (Cd(OH)+, Cd(OH)2 and Cd(OH)3−)). The percentage of these species depends on the pH of the working solution. Out of these, Cd2+ is the predominant species in the pH range from 4 to 8. Chitosan can coordinates with Cd2+ and form chitosan-Cd2+ chelate with the release of H+ ions. As a results, pH of the solution decreased during the adsorption of Cd2+ on to the adsorbent. The nonprotonated —NH2 group of chitosan interacts with cationic Cd2+, which facilitates the adsorption and/or chelate formation process between the adsorbent and adsorbate via various interactions such as chemicals, electrostatic, and Van der Waals. Probability to the adsorption of Cd2+ ions on adjacent binding sites of the adsorbent cannot be ruled out completely. Therefore, chitosan provides various coordination sites to the stabilization of AgNPs as well as for the removal of Cd2+ by Chi-Ag (Scheme 3).
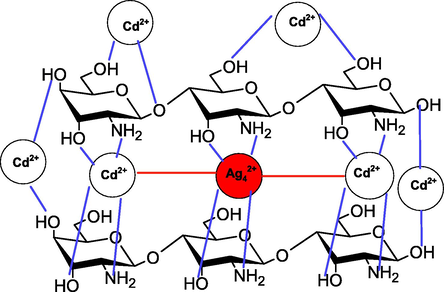
- Adsorption of Cd2+ with Chi-Ag.
In order to see insight into the complete removal of Cd2+ ions with Chi-Ag from an aqueous solution, qualitative estimation of Cd2+ ions was carried out. In a typical experiment, H2S gas was passed through the reaction mixture containing the required amount of Cd2+ ions and the adsorbent. The characteristic yellow precipitate of CdS was not appeared, which indicates that the Cd2+ ions adsorbed onto the surface of the adsorbent completely.
4 Conclusion
In conclusion, the simple, cost effective, and environmentally friendly chemical reduction method was used for the synthesis of hydrophilic functionalized Chi-AgNPs. The batch adsorption results revealed the removal of Cd2+ by Chi-Ag is dependent on the initial Cd2+ concentration, contact time, medium pH, and temperature. The adsorption of Cd2+ was consistent with the Langmuir isotherm. The maximum adsorption capacity (Q0max = 119.2 mg/g) was estimated at optimum operational conditions. The stability of Chi-Ag adsorbent was determined by calculating the average viscosity molecular weight of degraded chitosan with K2S2O8 and H2O2. The path of chitosan degradation was different at lower concentrations of K2S2O8 and H2O2. Chitosan also plays a significant role during the adsorption process due to the presence of strong coordinating —NH2 and —OH groups in the chain structure. Cd2+ was adsorbed on the Chi-Ag by electrostatic, film diffusion, chelation, and Van der Waals interactions.
Acknowledgment
This project was funded by the Deanship of Scientific Research (DSR) at King Abdulaziz University, Jeddah, under grant no. (D-061-130-1441). The author, therefore, acknowledges with thanks DSR for technical and financial support.
Declaration of Competing Interest
The authors declare that they have no known competing financial interests or personal relationships that could have appeared to influence the work reported in this paper.
References
- Silver-Cobalt bimetallic nanoparticles to the generation of hydrogen from formic acid decomposition. Arab. J. Chem.. 2022;15:103795.
- [Google Scholar]
- Removal of lead from aqueous solution using low cost abundantly available adsorbents. Int. J. Environ. Sci. Tech.. 2007;4:67-73.
- [Google Scholar]
- Cadmium removal from aqueous solution by green synthesis zero valent silver nanoparticles with benjamina leaves extract. Egyptian J. Aquatic Res.. 2017;43:269-274.
- [Google Scholar]
- Photo-oxidative decolorization of brilliant blue with AgNPs as an activator in the presence of K2S2O8 and NaBH4. ACS Omega. 2021;6:27510-27526.
- [Google Scholar]
- Utilization of chitosan/Ag bionanocomposites as eco-friendly photocatalytic reactor for bactericidal effect and heavy metals removal. Helyion. 2019;5:e01980.
- [Google Scholar]
- Formation and characterization of surfactant stabilized silver nanoparticles: a kinetic study. Colloids Surfs. B: Biointerfaces. 2008;67:230-237.
- [Google Scholar]
- Radical generation by the interaction of transition metals with common oxidants. Environ. Sci. Technol.. 2004;38:3705-3712.
- [Google Scholar]
- The exchange adsorption of ions from aqueous solutions by organic zeolites. II. Kinetics. J. Am. Chem. Soc.. 1947;69:2836-2848.
- [Google Scholar]
- Cadmium and copper removal from aqueous solutions using chitosan-coated gasifier biochar. Front. Environ. Sci.. 2020;8:541203.
- [Google Scholar]
- Removal of cadmium and hexavalent chromium from electroplating waste water using thiocarbamoyl chitosan. Carbohydr. Polym.. 2012;88:670-675.
- [Google Scholar]
- Photochemical degradation of 1,3-dinitrobenzene in aqueous solution in the presence of hydrogen peroxide. Chemosphere. 2004;55:339-344.
- [Google Scholar]
- Viscometric study of chitosan solutions in acetic acid/sodium acetateand acetic acid/sodium chloride. Carbohydr. Polym.. 2015;133:245-250.
- [Google Scholar]
- Cadmium Environmental Aspects. Geneva: World Health Organization; 1992.
- Insights into the modeling of adsorption isotherm systems. Chem. Eng. J.. 2010;156:2-10.
- [Google Scholar]
- Removal of cadmium (II) from aqueous solutions by adsorption on agricultural waste biomass. J. Hazard. Mater.. 2008;154:1149-1157.
- [Google Scholar]
- Interactions of metal ions with chitosan-based sorbents: a review. Sep. Purificat. Technol.. 2004;38:43-74.
- [Google Scholar]
- Removal and recovery of the hazardous azo dye acid orange 7 through adsorption over waste materials: Bottom ash and De-oiled soya. Ind. Eng. Chem. Res.. 2006;45:1446-1453.
- [Google Scholar]
- Visual detection of melamine in infant formula at 0.1 ppm level based on silver nanoparticles. Analyst. 2010;135:583-588.
- [Google Scholar]
- Physicochemical properties of small metal particles in solution: “microelectrode” reactions, chemisorption, composite metal particles, and the atom to metal transition. J. Phys. Chem.. 1993;97:5457-5471.
- [Google Scholar]
- Sorption kinetics for dye removal from aqueous solution using activated clay. Sep. Sci. Technol.. 2001;36:2473-2488.
- [Google Scholar]
- Free radical degradation of chitosan with potassium persulfate. Polym. Degrad. Stability. 2002;75:73-83.
- [Google Scholar]
- Colorimetric detection of Cd2+ using 1-amino-2-naphthol-4-sulfonic acid functionalized silver nanoparticles. J. Nanoparticle Res.. 2016;18:1-9.
- [Google Scholar]
- Removal of cadmium from aqueous solutions by adsorption onto sugarcane bagasse. Am.-Eurrasian J. Agric. Environ.. 2006;1:179-184.
- [Google Scholar]
- Chitosan-glyoxal film as a superior adsorbent for two structurally different reactive and acid dyes: adsorption and mechanism study. Int. J. Biol. Macromol.. 2019;135:569-581.
- [Google Scholar]
- Biomedical applications of chitin and chitosan based nanomaterials-A short review. Carbohydr. Polym.. 2010;82:227-232.
- [Google Scholar]
- Peroxidase-like activity of chitosan stabilized silver nanoparticles for visual and colorimetric detection of glucose. Analyst. 2012;137:5560-5564.
- [Google Scholar]
- Effect of cationic micelles on the kinetics of interaction of ninhydrin with L-leucine and L-phenylalanine. J. Colloid Interface Sci.. 1999;213:20-28.
- [Google Scholar]
- Chitosan capped Au@Pd@Ag trimetallic nanoparticles: synthesis, stability, capping action and adsorbing activities. Int. J. Biol. Macromol.. 2020;153:545-560.
- [Google Scholar]
- Cross-linked beads of activated oil palm ash zeolite/chitosan composite as a bio-adsorbent for the removal of methylene blue and acid blue 29 dyes. Int. J. Biol. Macromol.. 2017;93:1231-1239.
- [Google Scholar]
- Single-step pyrolysis of phosphoric acid-activated chitin for efficient adsorption of cephalexin antibiotic. Bioresour. Technol.. 2019;280:255-259.
- [Google Scholar]
- Enhanced Congo red dye removal from aqueous solutions using iron nanoparticles: adsorption, kinetics, and equilibrium studies. Dalton Trans.. 2017;46:15470-15479.
- [Google Scholar]
- Alginate fibers modified with unhydrolysed and hydrolysed chitosans for wound dressings. Carbohydr. Polym.. 2004;55:65-76.
- [Google Scholar]
- Silver nanoparticles based selective colorimetric sensor for Cd2+, Hg2+ and Pb2+ ions: Tuning sensitivity and selectivity using co-stabilizing agents. Sens. Actuators, B. 2014;191:31-36.
- [Google Scholar]
- Chitosan chemistry and pharmaceutical perspectives. Chem. Rev.. 2004;104:6017-6084.
- [Google Scholar]
- Adsorption of cadmium ions from an aqueous solution on a highly stable dopamine-modified magnetic nano- adsorbent. Nanoscale Res. Lett.. 2019;14:352.
- [Google Scholar]
- Chitosan kills bacteria through cell membrane damage. Int. J. Food Microbiol.. 2004;95:147-155.
- [Google Scholar]
- Enhanced chitosan/Fe0-nanoparticles beads for hexavalent chromium removal from wastewater. Chem. Eng. J.. 2012;189–190:196-202.
- [Google Scholar]
- Cross-linked chitosan/sepiolite composite for the adsorption of methylene blue and reactive orange 16. Int. J. Biol. Macromol.. 2016;93:1231-1239.
- [Google Scholar]
- Mesoporous-activated carbon prepared from chitosan flakes via single-step sodium hydroxide activation for the adsorption of methylene blue. Int. J. Biol. Macromol.. 2017;98:233-239.
- [Google Scholar]
- Green synthesis of silver and copper nanoparticles using ascorbic acid and chitosan for antimicrobial applications. Carbohydr. Polym.. 2014;112:195-202.
- [Google Scholar]
- Synthesis and characterization of gallium colloidal nanoparticles. J. Colloid Interface Sci.. 2010;346:279-287.
- [Google Scholar]
- Single, binary and multi-component adsorption of copper and cadmium from aqueous solutions on Kraft lignin—a bioadsorbent. J. Colloid Interface Sci.. 2006;297:489-504.
- [Google Scholar]
- Sorption behavior of Pb(II) and Cd(II) on iron ore slime and characterization of metal ion loaded sorbent. J. Hazard. Mater.. 2009;166:1506-1513.
- [Google Scholar]
- Immobilized Fe-loaded chitosan film for methyl orange dye removal: Competitive ions, reusability, and mechanism. J. Polym. Environ.. 2021;29:1050-1062.
- [Google Scholar]
- Egg by-products as a tool to remove direct blue 78 dye from wastewater: Kinetic, Equilibrium modeling, thermodynamics and desorption properties. Materials. 2020;13:1262.
- [Google Scholar]
- Solubility and structure of N-carboxymethyl chitosan. Int. J. Biol. Macromol.. 1994;16:177-180.
- [Google Scholar]
- Effect of time/temperature treatment parameters on depolymerization of chitosan. J. Appl. Polym. Sci.. 2003;87:1890-1894.
- [Google Scholar]
- Stability and antibacterial activity of chitosan solutions affected by storage temperature and time. Carbohydr. Polym.. 2006;65:174-178.
- [Google Scholar]
- Adsorption of metal complex dyes from aqueous solutions by pine sawdust. Bioresour. Technol.. 2005;96:791-795.
- [Google Scholar]
- Quantitative determination of chitosans by ninhydrin. Carbohydr. Polym.. 1999;38:115-122.
- [Google Scholar]
- Silver nanoparticles as colorimetric sensors for water pollutants. Chemosensors. 2020;8:26.
- [Google Scholar]
- Polystyrene-block-poly(2-vinylpyridine)-conjugated silver nanoparticles as colorimetric sensor for quantitative determination of Cartap in aqueous media and blood plasma. Sens. Actuators, B. 2018;259:878-887.
- [Google Scholar]
- Facile synthesis of silver nanoparticles decorated magnetic-chitosan microsphere for efficient removal of dyes and microbial contaminants. ACS Sustainable Chem. Eng.. 2015;3:2291-2302.
- [Google Scholar]
- Synthesis of porous-magnetic chitosan beads for removal of cadmium ions from waste water. Ind. Eng. Chem. Res.. 1993;32:2070-2078.
- [Google Scholar]
- Degradation of chitosan by sonication in very-low-concentration acetic acid. Polym. Degrada. Stability. 2014;110:344-352.
- [Google Scholar]
- Thiol terminated chitosan capped silver nanoparticles for sensitive and selective detection of mercury (II) ions in water. Sens. Actuators, B. 2018;268:310-318.
- [Google Scholar]
- Perylene dye-functionalized silver nanoparticles serving as pH-dependent metal sensor systems. RSC Adv.. 2017;7:24215-24220.
- [Google Scholar]
- Multiple roles of cadmium in cell death and survival. Chem. Biol. Interact.. 2010;188:267-275.
- [Google Scholar]
- Chitosan as a stabilizer and size-control agent for synthesis of porous flower shaped palladium nanoparticles and their applications on photo-based therapies. Carbohydr. Polym.. 2019;205:340-352.
- [Google Scholar]
- Process development for removal and recovery of phosphorus from wastewater by a new adsorbent. 2. Adsorption rates and breakthrough curves. Ind. Eng. Chem. Res.. 1991;30:1897-1899.
- [Google Scholar]
- Sensing colorimetric approaches based on gold and silver nanoparticles aggregation: Chemical creativity behind the assay. A review. Analytica Chimica Acta. 2012;751:24-43.
- [Google Scholar]
- Determination of the Mark-Houwink equation for chitosans with different degrees of deacetylation. Int. J. Biol. Macromol.. 1991;13:281-285.
- [Google Scholar]
- Preparation, characterization and antimicrobial activity of chitosan–Zn complex. Carbohydr. Polym.. 2004;56:21-26.
- [Google Scholar]
- Study on the synergetic degradation of chitosan with ultraviolet light and hydrogen peroxide. Carbohydr. Res.. 2005;340:1143-1147.
- [Google Scholar]
- Kinetics of adsorption on carbon from solution. J. Sanit. Eng. Div. Am. Soc. Civ. Eng.. 1963;89:31-60.
- [Google Scholar]
- Chitosan stabilized bimetallic Fe/Ni nanoparticles used to remove mixed contaminants-amoxicillin and Cd (II) from aqueous solutions. Chem. Eng. J.. 2013;229:27-34.
- [Google Scholar]
- World Health Organization (WHO), Guidelines for drinking water quality, Health criteria and other supporting information, World Health Organization, Geneva, second ed., 1998, vol. 2.
- Chitosan capped noble metal doped CeO2 nanomaterial: synthesis, and their enhanced catalytic activities. Int. J. Biol. Macromol.. 2021;166:1258-1271.
- [Google Scholar]
- Fabrication of zinc/silver binary nanoparticles, their enhanced microbial and adsorbing properties. Arab. J. Chem.. 2020;13:7921-7938.
- [Google Scholar]
- Adsorption of methyl red on biogenic Ag@Fe nanocomposities adsorbent: Isotherms, kinetics and mechanistic approach. J. Mol. Liq.. 2019;283:287-298.
- [Google Scholar]
- Adsorption, equilibrium isotherm, and thermodynamic studies to the removal of acid orange 7. Mater. Chem. Phys.. 2019;232:109-120.
- [Google Scholar]


