

Translate this page into:
Phase behavior of condensate gas and CO2 / CH4 re-injection performance on its retrograde condensation
⁎Corresponding author at: Department of Chemical and Biological Engineering, Korea University, Seoul, 02841, Republic of Korea (J. Kim).Department of Applied Chemistry, Kumoh National Institute of Technology, Daehak-ro 61, Gumi, Gyeongbuk 39177, Republic of Korea (E.-S. Jang). Email: jbkim3@korea.ac.kr (J. Kim); euesoon@kumoh.ac.kr (E.-S. Jang). wangjie@yangtzeu.edu.cn (Jie Wang)
-
Received: ,
Accepted: ,
This article was originally published by Elsevier and was migrated to Scientific Scholar after the change of Publisher.
Peer review under responsibility of King Saud University.
Abstract
Wenchang A Depression in Pearl River Mouth Basin is the largest hydrocarbon generating depression in the west of the area. After more than 30 years of exploitation, a large amount of gas condensate has been produced near the wellbore, which will cause gas condensate damage to the reservoir. It is planned to reinject the self-produced gas from Well WC9-2-X and the gas transported from the WC14-3 gas field to relieve the condensate damage in the near-wellbore area by means of retrograde condensation. In this article, the phase state change process of condensate gas in Well WC9-2-X with temperature and pressure was firstly investigated, and then the retrograde condensation effect of two types of gas on condensate was investigated. The research shows that when the reservoir temperature is 158.80 °C, the dew point pressure of condensate gas is 20.71 MPa, and the maximum amount of condensate is 1.28% (P = 9.01 MPa). Although Wenchang 9–2 is a low condensate reservoir, in the process of depressurization and production over the years, gas condensate has gradually accumulated, resulting in a large amount of gas condensate near the wellbore. With the increase of the gas re-injection amount, the two types of gas have a significant effect on the retrograde condensation of the gas condensate. From the variation trend of the gas and oil density released by the retrograde condensation, it can be seen that the re-injection gas preferentially dissolves the light components in the condensate, and then gradually dissolves the heavy components. The self-produced gas (gas No. 1) of Well WC9-2-X is dominated by CH4 (78.33 mol%), and the CO2 / CH4 contents in the input waste gas (gas No. 2) of the WC14-3 gas field are 42.50 mol% / 41.60 mol%, respectively. The retrograde condensation effect of gas No. 2 is better than gas No. 1, mainly because the content of CO2 in gas No. 2 is high, and it is easier to achieve the effect of miscible dissolution of condensate when mixed with condensate.
It is recommended that gas No.2 should be preferentially used in WC9-2-X well for reinjection of retrograde condensation to relieve condensate damage. This article provides theoretical support for gas re-injection to relieve condensate damage in Wenchang 9–2 gas field, and has important significance for long-term exploitation of condensate gas reservoir.
Keywords
Condensate gas
Visualization
Condensation phenomenon
Retrograde condensation
Gas reinjection

Nomenclature
- CCE
-
Constant component expansion;
- CVD
-
Constant volume depletion;
- P
-
Pressure, MPa;
- T
-
Temperature, ℃;
- Z
-
Gas phase deviation coefficient;
- Pm
-
Cricondenbar, MPa;
- Tm
-
Cricondentherm, ℃;
- Tc
-
Critical temperature, ℃;
- Pc
-
Critical pressure, MPa;
- Tf
-
Formation temperature, ℃;
- Pf
-
Formation pressure, MPa;
- LP, HT
-
Low pressure, High temperature;
- SG
-
Density Unit, g/cm3.
1 Introduction
Wenchang 9–2 low condensate gas field is located in the central uplift of Wenchang A depression in the Pearl River Mouth Basin of China. The Pearl River Mouth Basin is one of the four cenozoic basins in the South China Sea, which is divided into east and west parts. Wenchang A is the largest hydrocarbon generation depression in the west of the Pearl River Mouth Basin, with the characteristics of various types of oil and gas and complex distribution. (Zhu et al., 2021; Peng et al., 2017) In the actual exploitation, the temperature and pressure of the condensate gas have changed greatly in the transportation process from formation to the bottom hole, and then reach the ground. With the continuous decrease of temperature and pressure, the heavy hydrocarbon components dissolved in the condensate gas will slowly precipitate to form gas condensate. (Kamari et al., 2018; Salmani et al., 2020) Therefore, it has important significance to understand the phase change of well fluid when the temperature and pressure change for enhance recovery of Wenchang 9–2 low condensate gas field.
At present, experimental devices and methods commonly used to study phase state changes of condensate gas include visual PVT phase state meter, core displacement method, laser method, nuclear magnetic resonance method, etc.(Wang et al., 2019; Guo et al., 2020., Yang et al., 2020; Tang et al., 2021) Tang et al. studied the phase state changes during the multiple rounds of cyclic gas injection in the underground gas storage of condensate gas reservoirs. The cyclic gas injection has a significant effect on retrograde condensation and extraction of gas condensate. After multiple rounds of gas injection, the condensate saturation decreased to 0%, and the gas storage capacity increased by about 7.5%. (Tang et al., 2021a & 2021b, Jiao et al., 2012) Taheri et al. studied the enhanced oil recovery mechanism of gas injection in condensate gas reservoirs in the fracture model, and through the comparative injected gas CH4, N2 and CO2, they found that: (1) Under the miscible phase condition, gas-dissolved crude oil is mainly driven by miscible phase; (2) Under the condition that miscibility cannot be achieved, vaporization gas flooding is the main way to improve the recovery of gas condensate. (Taheri et al., 2013) Al-Abri et al. quantitatively studied the condensate recovery and relative permeability values when injecting supercritical carbon dioxide (SCCO2), CH4, and SCCO2 + CH4. The results shown that the injection of SCCO2 exhibits reduced capillary force instability, resulting in a better oil-gas flow ratio, which ultimately delays gas injection breakthrough time and improves condensate sweep efficiency (breakthrough occurs at injection of 0.62PV, with a recovery factor of 79%). %), and compared with the injection of SCCO2 + CH4, the breakthrough of methane injection occurred at 0.27PV, and the recovery factor was 45%. (Al-Abri et al., 2009). To sum up, it can be seen that gas re-injection has a good effect on retrograde condensation. For the Wenchang 9–2 gas field in a specific oil reservoir, in order to effectively relieve the damage of gas condensate near the wellbore, this article will systematically study the phase change law of condensate gas in Well WC9-2-X with temperature and pressure. Retrograde condensation effect of re-injection gas on condensate. The results will have reference value for systematically studying the phase change of condensate gas PVT and gas re-injection to retrograde condensation.
Based on the above research, this article will use a visual PVT device to study the condensate and retrograde condensation phenomena of condensate gas in well WC9-2-X with temperature / pressure variation, as well as the effects of reinjection gas No.1 and gas No.2 on the retrograde condensation capacity of gas condensate. The WC9-2-X well is in the main gas group ZH2I of Wenchang 9–2 gas field. The main lithology of WC9-2 reservoir is sandstone with a small amount of shale. The formation water belongs to the CaCl2 type. The matrix permeability of the reservoir is 0.31 mD ∼ 2.69 mD and porosity is 9.17% ∼ 10.30%, which belongs to the medium porosity and low permeability reservoir. At present, the depletion development method is used, the dew point pressure of condensate gas is close to the reservoir pressure, which is easy to cause gas condensate damage, the production decline rate is fast, and the expected recovery rate is low.
2 Experiment
2.1 Experimental material
Condensate gas used in the experiment was provided by Zhanjiang Branch of China Offshore Oil and Gas Company. It was taken from well depth of 3716.7 m, temperature gradient 4.272 °C/100 m, pressure gradient 0.659 MPa/100 m, current formation temperature is 158.80 °C, formation pressure is 24.50 MPa, gas-oil ratio is 7462.68 s.m3/s.m3, and well number is WC9-2-X. The gas composition data is shown in Table 2 of Appendix 1.
Pressure, MPa
20.71*
15.00
10.00
5.00
Z
0.9190
0.9080
0.9212
0.9567
Accumulative percentage produced, %
0.00
27.30
51.66
77.02
Components
Gas molar composition, mol %
Gas molar composition, mol %
Gas molar composition, mol %
Gas molar composition, mol %
CO2
7.30
7.29
7.36
7.47
N2
0.01
0.24
0.66
0.04
Methane
77.19
77.81
77.38
77.97
Ethane
9.60
9.56
9.69
9.75
Propane
2.23
2.23
2.28
2.34
Iso-butane
0.56
0.56
0.58
0.59
N-butane
0.53
0.54
0.57
0.58
Iso-pentane
0.35
0.31
0.32
0.33
N-pentane
0.36
0.32
0.30
0.27
Hexane
0.17
0.27
0.19
0.18
Heptane
0.67
0.25
0.13
0.13
Octane
0.16
0.17
0.17
0.13
Nonane
0.32
0.05
0.08
0.07
Decane
0.21
0.09
0.04
0.06
Undecane+
0.34
0.31
0.25
0.09
Sum
100.00
100.00
100.00
100.00
The experimental conditions included three temperature points: 138.80 °C, 158.80 °C and 178.80 °C. When the temperature changes, the changes of the condensate gas components are relatively complex. Therefore, the condensate gas obtained under the reservoir conditions to test the phase state changes at different temperature points, which is the deficiency of this article. In order to effectively relieve the gas condensate damage caused by the precipitation of gas condensate in the formation, the retrograde condensation of gas condensate is realized by gas re-injection. The re-injected gas includes two kinds: gas No.1 is taken from the natural gas after oil and gas separation at the wellhead of WC9-2-X well. The component data of gas No.1 is shown in Table 3 of Appendix 2, in which methane content is up to 78%, followed by ethane, propane and other gases. Gas No.2 is transported from WC14-3 gas field. The component data of gas No.2 are shown in Table 4 of Appendix 3. The content of methane and CO2 is as high as 41.6% and 42.5% respectively, which belong to the mixed dominant gas of the two types.
2.2 Experimental device and technical routes
The PVT phase experiment was carried out by using the visualized multi-functional HT and HP fluid PVT tester which was made by Sanchez Technology in France. The formation fluid bubble point and dew point pressure can be tested and observed, as well as expansion test, flash vaporization test, differential liberation test and constant volume depletion test. The device is mainly composed of a visual window, a monitoring system, a temperature control system and a compressible reactor, as shown in Fig. 1 and Fig. 2 PVT tester working pressure range 0 ∼ 100Mpa, working temperature range 0 ∼ 200 °C, the reactor volume is 240 mL and visualization, PVT reactor sapphire window can directly visual diameter is 60 mm, test accuracy is pressure ± 0.01 MPa, volume + / −0.0005 mL, temperature + / −0.1 °C.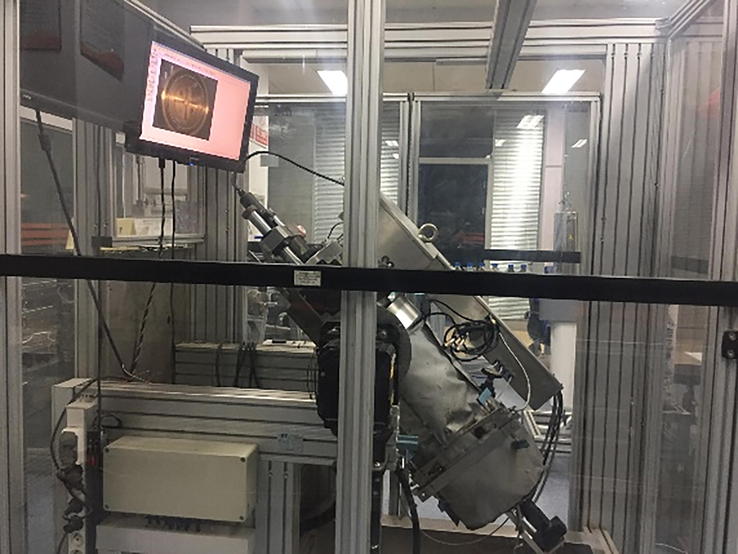
240/1500FV PVT device.
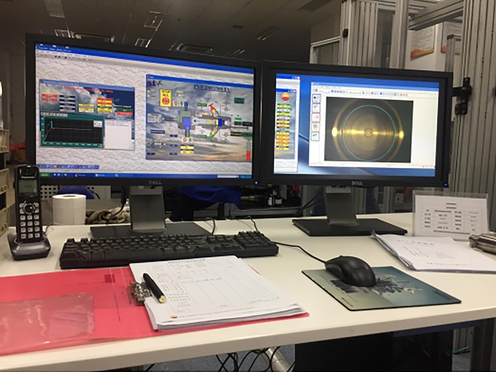
Display of 240/1500FV PVT device.
The experimental process is shown in Fig. 3. (1) The condensate gas obtained from well WC9-2-X is transferred to the reaction kettle of the PVT tester, heated and pressured to the formation temperature and pressure, and stirred for more than 24 h. After the fluid in the reaction kettle is in a single gas phase state, the PVT phase state experiment is conducted. (2) The experimental study of PVT phase state of condensate gas includes constant mass expansion experiment (CCE), constant volume depletion experiment (CVD) and numerical simulation of condensate gas phase state diagram.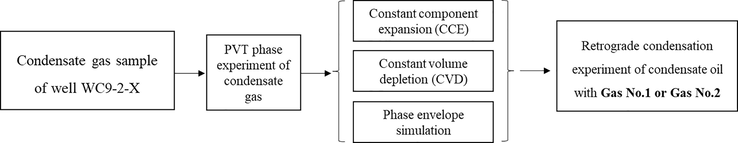
Experimental technology roadmap of well WC9-2-X.
Constant mass expansion experiment (CCE), also known as P-V relationship experiment, refers to measuring the relationship between pressure and volume of formation fluid with constant mass under formation temperature. For condensate gas reservoir fluid, parameters such as dew point pressure, Z-factor and relative volume of fluid under different pressures are obtained. (Boitsova and Strokin. 2020; Fanchi and Lake, 2006; Hou et al, 2016) The purpose of constant volume depletion test (CVD) is to simulate the change of condensate gas composition and oil recovery under different depletion pressure in the process of depletion production of condensate gas reservoir. In practice, the depletion exploiting is a continuous process of pressure reduction and output. Since the PVT tester cannot simulate the low temperature condition (-100 °C ∼ 0 °C), the phase change of the condensate gas at low temperature cannot be simulated. In this experiment, the model experiment simulation of four-stage depressurization was carried out at the gas reservoir temperature of 158.80 °C. (Hou et al, 2014; Cokuner, 1997).
Condensate retrograde condensation experiment. (Tang et al, 2021; Chen et al, 2012; Dmitrievskii et al, 2010; Rahimzadeh et al, 2016; Pederson and Christensen, 2007) Due to the step-down exploiting method in WC9-2-X well, the near-wellbore pressure is much lower than the dew point pressure of condensate gas, and a large number of condensate damage is produced near the wellbore. This experiment explored whether the gas condensate can be reverse evaporated by changing the temperature and pressure after the condensate gas produced in WC9-2-X well. In addition, self-produced gas No.1 in well WC9-2-X and transported gas No.2 in WC14-3 gas field can both be used as reinjection gas to remove condensate damage in well WC9-2-X formation. Therefore, it is necessary to study the retrograde condensation capacity of gas No.1 and gas No.2 to condensate.
3 Experimental results and discussion
3.1 PVT experiment of WC9-2-X condensate gas
3.1.1 Single flash experiment
Firstly, the basic physical parameters such as gas-oil ratio, deviation coefficient and fluid composition of condensate gas in well WC9-2-X under reservoir temperature and pressure were tested through a single flash test at the pressure and temperature in the constant reactor (T = 158.80 °C, P = 24.50 MPa). WC9-2-X condensate gas composition is shown in Table 2 of Appendix 1. According to the results, the current formation fluid is mainly C1 + N2 with the content of 77.20 mol%, followed by CO2 + C2 ∼ C10 and C11+ with the content of 22.46 mol% and 0.34 mol%, respectively. The content of C11+ is low, belonging to the characteristics of low carbon element condensate. The Condensate gas density is 300.05 g/m3, the relative molecular weight of C11+ is 169.30, the relative density of C11+ is 0.8056, and the gas-oil ratio is 7462.68 s.m3/s.m3.
3.1.2 Constant component expansion (CCE) experiment
When the temperature is not changed, the solubility of light hydrocarbon components in condensate gas decreases with the decrease of pressure. When the pressure is lower than the dew point pressure, the heavy hydrocarbon molecules in condensate gas will precipitate and form gas condensate. When the pressure is maintained in a certain range, the decrease of pressure will lead to the gradual weakening of the movement of light hydrocarbon molecules and the retrograde condensation of liquid heavy hydrocarbon. As the initial retrograde condensation rate is less than the precipitation rate, the liquid heavy hydrocarbon gradually increases in macroscopically. However, when the retrograde condensation rate is equal to the precipitation rate, the condensate volume reaches the maximum. Fig. 4 is the P-V relationship curve when the reservoir temperature T = 158.80 °C. Fig. 5 is the condensate volume percentage in the process of pressure change. Fig. 4 shows that the relative volume of fluid increases gradually with the decrease of pressure. When the relative volume is 1.0, condensate gas begins to produce the first batch of droplets, and the corresponding pressure is condensate gas dew point pressure, P = 20.71 MPa. The deviation factor Z = 0.9190 and volume coefficient = 6.5932 × 10⁻³ corresponding to dew point pressure. Fig. 5 shows that when T = 158.8 °C, the maximum condensate volume is 1.28%, and the corresponding pressure is 9.01 MPa, which is a condensate gas reservoir fluid with low liquid hydrocarbon content.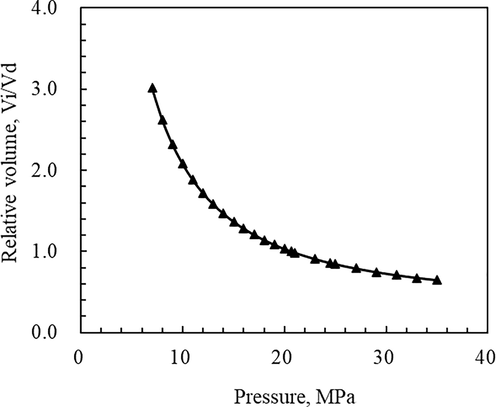
P-V curve during CCE (T = 158.80 °C).
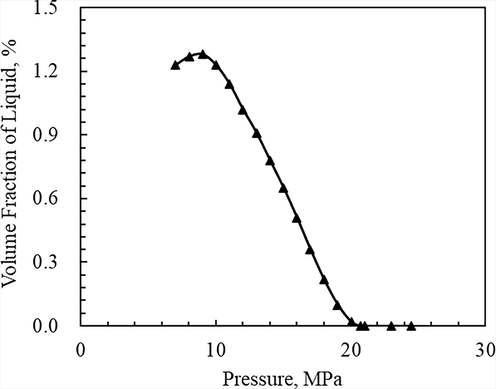
Curve of the amount of condensate during CCE (T = 158.80 °C).
3.1.3 Constant component expansion (CCE) experiment under different temperature
In gas reservoirs, there are differences in temperature in different areas. In order to further study the relationship between the relative volume of condensate gas and the cumulative condensate percentage with pressure and temperature changes, temperature points were selected as 138.80 °C, 158.80 °C and 178.80 °C in CCE experiment, among which 158.80 °C was the reservoir temperature. Fig. 6 shows the P-V relationship curve of condensate gas at three temperature points. At the three temperature points, the relative volume of condensate gas and the percentage of accumulated condensate liquid change with pressure are consistent. The dew point pressures corresponding to temperature 138.80 °C, 158.80 °C and 178.80 °C are 22.67 MPa, 20.71 MPa and 17.79 MPa, respectively. The lower the temperature is, the higher the dew point pressure of the condensate gas of the same component is, indicating that the condensate gas is more likely to precipitate condensate with the decrease of the pressure at low temperature. Fig. 7 shows the curve of the change of accumulated condensate number with pressure at three temperature points. At 138.80 °C, 158.80 °C and 178.80 °C, the maximum accumulative condensate volume percentage is 2.35%, 1.28% and 0.48%, and the pressure is 9.02 MPa, 9.01 MPa and 9.02 MPa. There are great differences in the maximum accumulative gas condensate volume at the three temperature points, but the corresponding pressure is similar. The lower the temperature is, the more the condensate is formed, indicating that the condensate damage is more likely to form in the near-wellbore area and the wellbore low-temperature environment.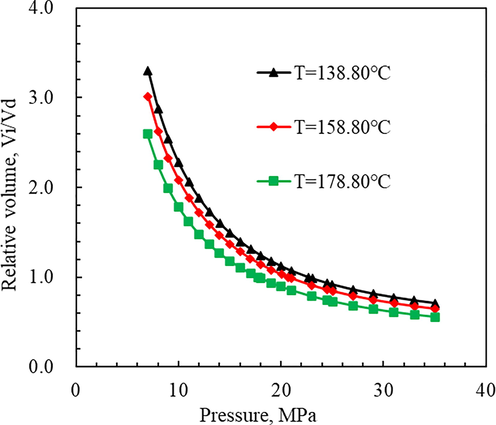
P-V curve during CCE (T = 138.80 °C, 158.80 °C, 178.80 °C).
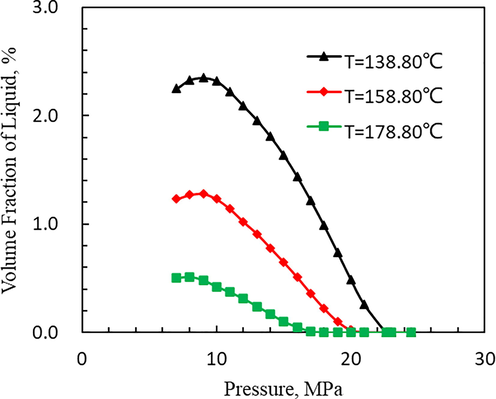
Curve of the amount of condensate during CCE (T = 138.80 °C, 158.80 °C, 178.80 °C).
3.1.4 Constant volume depletion (CVD) experiment
Constant volume depletion (CVD) experiment is designed to simulate the change of condensate gas composition and recovery under different depletion pressures during depletion production of condensate gas reservoir. In actual situations, depletion exploiting is a continuous depressurization and production process. In the lab, it is impossible to simulate the CVD process completely due to constraints. In this experiment, a four-stage step-down model experiment was performed at the gas reservoir temperature of 158.80 °C. Table 1 shows the test data of condensate gas constant volume failure components in well WC9-2-X at 158.80 °C.
When the dew point pressure is 20.71 MPa, all the single-phase gases are in the container. When the pressure was 20.71 MPa, 15.00 MPa, 10.00 MPa and 5.00 MPa, the gas deviation factors were 0.9190, 0.9080, 0.9212 and 0.9567, respectively. The percentages of cumulative recovery were 0.00%, 27.30%, 51.66% and 77.02%, respectively. The contents of C1 + N2 were 77.20 mol%, 78.05 mol%, 78.04 mol% and 78.01 mol%, and the contents of CO2 + C2 ∼ C10 were 16.90 mol%, 16.85 mol%, 17.05 mol% and 17.22 mol%, respectively. The contents of C11+ were 0.34 mol%, 0.31 mol%, 0.25 mol% and 0.09 mol%, respectively. The results show that the heavy hydrocarbon components are preferred to be recovered when the pressure is high, and the content of C11+ in the output decreases from 0.34 mol% to 0.09 mol%, indicating that the heavy hydrocarbon components in the remaining condensate are difficult to be recovered under low pressure.
Fig. 8 shows the relationship between gas condensate volume percentage and pressure in the process of condensate gas pressure depletion in well WC9-2-X. When the pressure is 20.71 MPa, 15.00 MPa, 10.00 MPa, 5.00 MPa and 0.10 MPa, the percentage of retrograde condensate in pore volume is 0.00%, 0.66%, 1.04%, 1.01% and 0.68%, respectively. When the pressure is 10.00 MPa, the percentage of remaining oil in pore volume is the largest. As the pressure decreases further, the condensate is continuously extracted. At atmospheric pressure, the percentage of remaining oil in the container pore volume is 0.68%, and this part of condensate is non-recoverable residual condensate.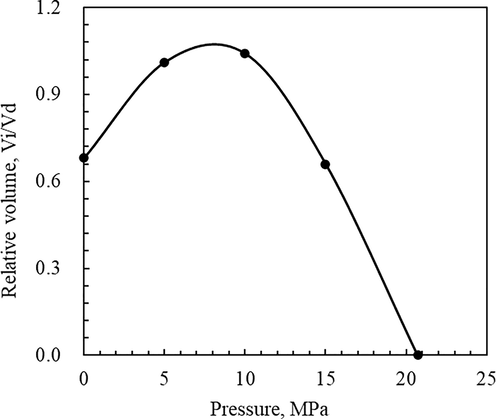
Relationship between condensate volume percentage and pressure in the process of condensate gas pressure depletion in Well WC9-2-X (T = 158.80 °C).
Fig. 9 shows the change curve of fluid recovery degree in the process of condensate gas pressure depletion in well WC9-2-X. When the depletion exploiting pressure is 20.71 MPa, 15.00 MPa, 10.00 MPa and 5.00 MPa, the condensate recovery degree is 0.00%, 27.30%, 51.66% and 77.02%, respectively. The cumulative recovery degree of separated gas is 0.00%, 30.00%, 57.25% and 85.16%, respectively. The accumulative recovery degree of gas condensate was 0.00%, 3.42%, 4.64% and 6.05%, respectively. The cumulative recovery of the three fluids increases with decreasing pressure.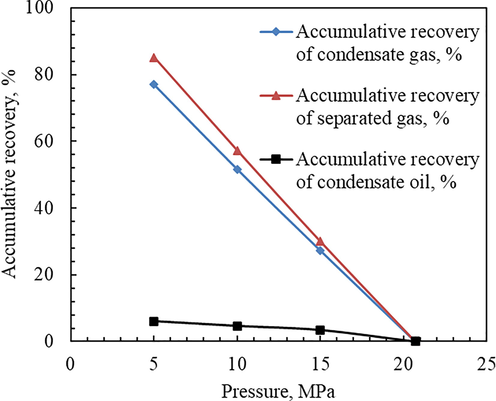
Change curve of fluid recovery degree during condensate gas pressure depletion in Well WC9-2-X (T = 158.80 °C).
3.2 Numerical simulation of condensate gas phase envelope diagram of well WC9-2-X
According to the experimental data of condensate gas composition, CCE and CVD in 3.1, phase state software package was used to fit and calculate the experimental results, and on this basis, P-T phase diagram of fluid in this well layer was calculated. The fluid analysis results of WC9-2-X well (the contents of C1 + N2、CO2 + C2 ∼ C10 and C11+ are 77.20 mol%, 22.46 mol% and 0.34 mol%, respectively) were placed in the triangular phase diagram to determine whether this type of gas belongs to the condensate gas. The results are shown in Fig. 10 in five-pointed star and the fluid from well WC9-2-X belongs to a typical condensate gas reservoir.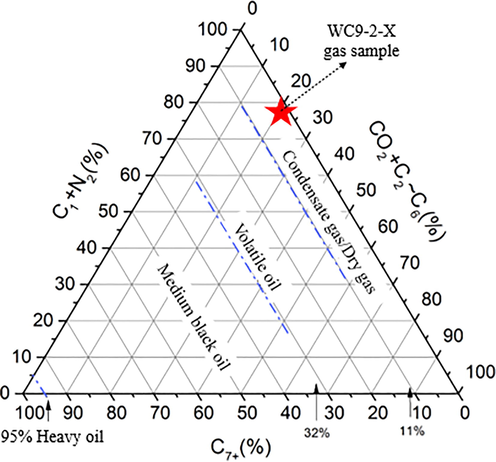
Triangular phase diagram of condensate in well WC9-2-X.
PVTsim software was used to calculate and simulate the phase envelope of fluid in well WC9-2-X at the temperature tested, and the results included dew point envelope, condensate volume 0.5% envelope, condensate volume 1.0% envelope and condensate volume 2.0% envelope respectively. The experimental results are shown in Fig. 11. With the gradual increase of condensate volume, the condensate pressure and temperature under corresponding conditions gradually decrease, the critical condensate pressure Pm = 26.23 MPa and the critical condensate temperature Tm = 228.33 °C of the original condensate gas. PVTsim simulates the P-T relationship curve under different amounts of condensate oil, which reflects the change process of condensate gas pressure in the process of temperature change. The PVT tester measured the result as a P-V relationship curve, which reflects the amount of gas condensate produced in the process of pressure change. Therefore, comparison of simulation results between the two is not possible.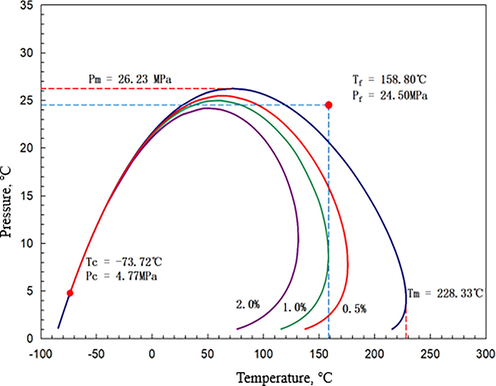
P-T phase diagram of condensate gas in well WC9-2-X (T = 158.80 °C).
3.3 Retrograde condensation experiment of gas condensate
Due to the change of temperature and pressure near wellbore, gas condensate damage occurs in the reservoir near wellbore of condensate gas, which can be relieved by gas reinjection and retrograde condensation. In this paper, self-produced gas No.1 from well WC9-2-X and gas No.2 from gas field WC14-3 are used as injection gas, and the retrograde condensation capacity of gas No.1 and No.2 on condensate produced by well WC9-2-X is studied through PVT phase experiment. During depletion production of gas reservoir, the formation temperature remains unchanged at 158.80℃ or changes slightly, and the main variation parameter is formation pressure. The selection principle of constant pressure in retrograde condensation experiment is based on the following three points:(1) the current gas reservoir pressure is 24.50 MPa; (2) The abandonment pressure of WC9-2 condensate gas reservoir is about 10 MPa; (3) PVT phase study results of condensate gas in well WC9-2-X show that the current dew point pressure of formation fluid is 20.71 MPa, the corresponding pressure is 9.01 MPa when the maximum condensate volume is 1.28%, and 15.02 MPa when the intermediate condensate volume is 0.65%. Therefore, the abandoned pressure above 10.00 MPa, the current formation pressure below 24.50 MPa and dew point pressure below 20.71 MPa, and the corresponding pressure 15.02 MPa when the median value of accumulated condensate volume is 0.65% are selected as the constant pressure point of the retrograde condensation experiment.
3.3.1 Results of two gases on the retrograde condensation of gas condensate from well WC9-2-X
By injecting gas No.1 and gas No.2 with different molar contents of 0.99 mol%, 2.91 mol%, 4.76 mol%, 6.54 mol%, 8.26 mol%, 9.09 mol%, 16.67 mol% and 23.08 mol%, the gas was released at 15.02 MPa after full mixing, and the gas condensate was extracted from the PVT container. The experimental results are shown in Figure 12 and Fig. 13. With the increase of gas injection mole content, the percentage of gas condensate volume extracted by retrograde condensation gradually decreases. When the gas injection mole content is 0.99 mol%, the maximum amount of gas condensate volume extracted from the remaining oil is obtained. When the gas injection mole content is 23.08 mol%, 60.19% of gas No.1 can be extracted from the remaining oil and gas No.2 can be extracted from remaining oil by 69.69%. By comparing the volume change of gas condensate injected with gas No.1 and gas No.2, it can be seen that gas No.2 has a better retrograde condensation effect than gas NO.1. In gas field operation, injected gas No.2 can be preferred for production.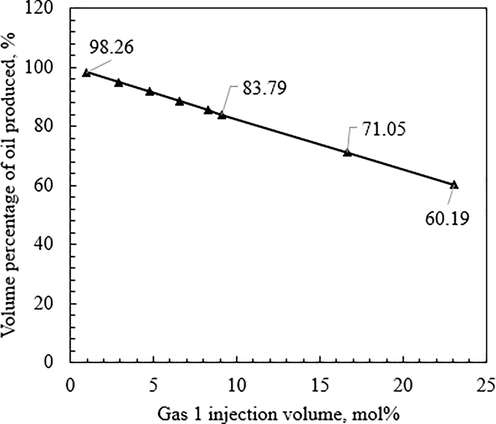
Relationship between evaporative condensate volume percentage and gas No.1 injection volume.
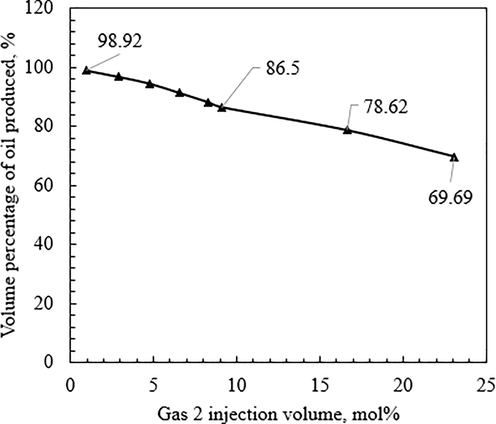
Relationship between evaporative condensate volume percentage and gas No.2 injection volume.
3.3.2 Results of physical parameters of produced fluid
In the extraction process of gas No.1 and No.2 injected in multiple rounds, gas chromatograph was used to test the components of produced gas condensate and gas and calculate the density of produced products. The experimental results are shown in Figs. 14 to 17. According to the experimental results in Fig. 14 and Fig. 15, as the injected gas volume increases, the produced gas density keeps increasing, while the produced condensate density keeps decreasing. When the gas injection exceeds 10.00 mol%, the produced gas density changes obviously and the growth rate becomes slow. Meanwhile, the density of gas and condensate produced by gas No.2 is greater than that of gas No.1. In addition, the methane gas density is 0.7163 × 10⁻³ g/cm3, and the gas density produced by retrograde condensation of injected gas No.1 and gas No.2 is both higher than 0.1300 g/cm3, indicating that there is more condensate component in the produced gas and its density is much higher than that of methane gas. The original condensate density was 0.7552 g/cm3, and the condensate density precipitated during gas release was all lower than 0.5200 g/cm3, mainly because the produced condensate contained a large amount of dissolved gas which could not be released quickly. Meanwhile, the produced condensate density was calculated by converting the gas chromatograph component test results, which was slightly smaller than the actual.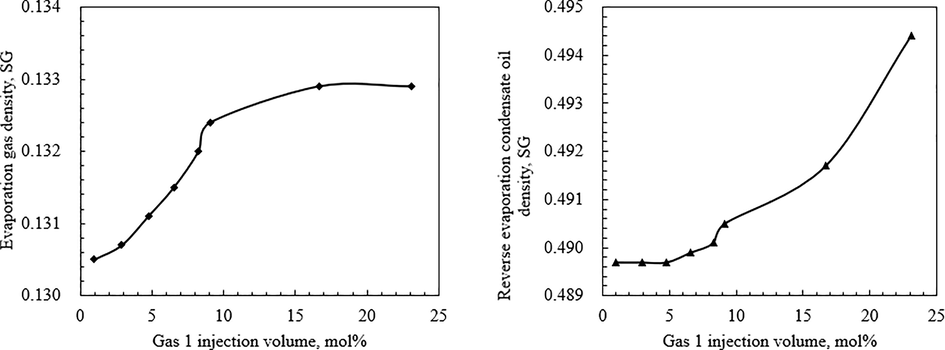
Density curves of produced gas and gas condensate by retrograde condensation when gas No.1 is injected.
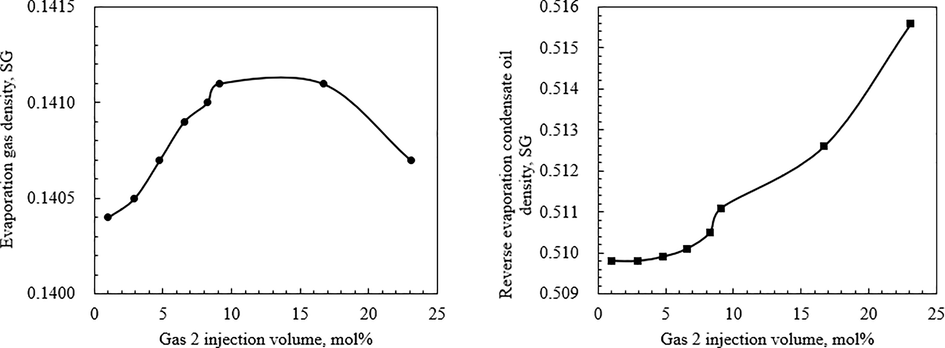
Density curves of produced gas and gas condensate by retrograde condensation when gas No.2 is injected.
Composition curves of produced gas and gas condensate by retrograde condensation when gas No.1 is injected.
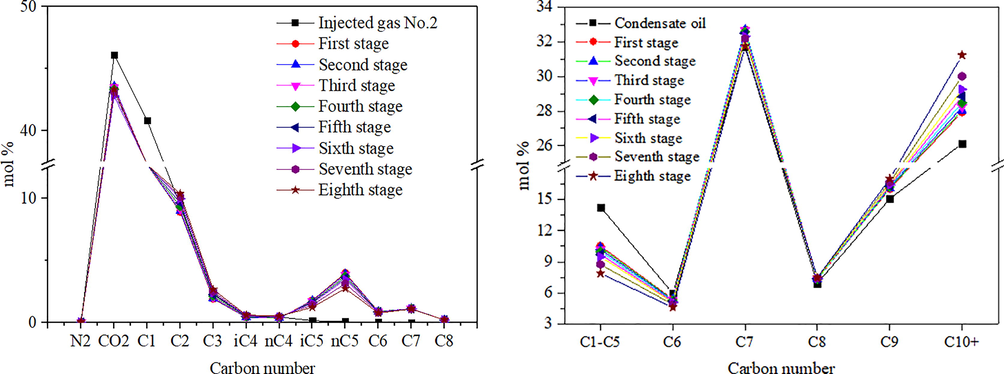
Composition curves of produced gas and gas condensate by retrograde condensation when gas No.2 is injected.
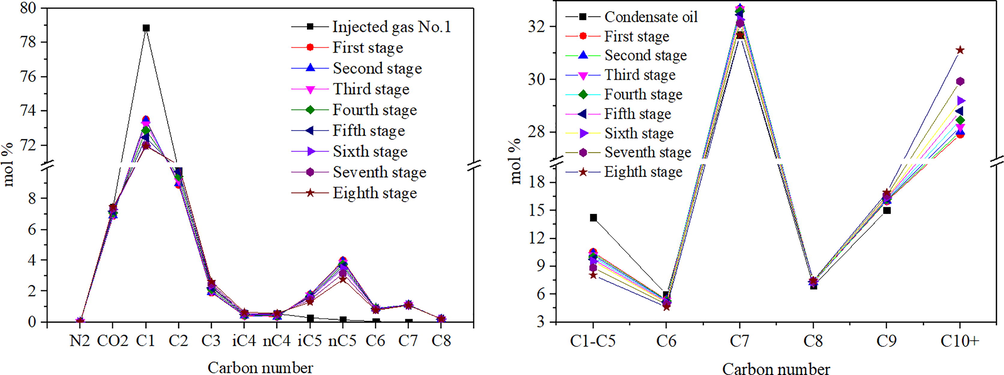
According to the experimental results in Fig. 16 and Fig. 17, in the process of 8 rounds of retrograde condensation and extraction of injected gas No.1, the content of reconstituted hydrocarbons in the gas produced by retrograde condensation and gas condensate gradually increases, but the content of heavy hydrocarbon components in the gas produced by injected gas No.2 shows a downward trend. The main reason is that the CO2 content in gas No.2 is as high as 42.5%, and the effect of CO2 on retrograde condensation is obvious in the early stage, then gradually decreases. This phenomenon is different from that of injected gas No.1. When injected gas No.1 reversely evaporates, the content of recombined hydrocarbons in the produced gas condensate increases gradually. Therefore, the gas condensate remaining in the PVT container is the material with higher hydrocarbon content of heavy components. In gas field application, it is not conducive to multiple rounds of gas injection retrograde condensation to remove condensate damage. The detailed data of the produced gas and gas condensate components are shown in Tables 5 to 8 in Appendix 4. In the high temperature condition, the re-injection gas can quickly dissolve the condensate and achieve the effect of retrograde condensation. There is a strong mutual solubility effect between CO2 and condensate in the re-injection gas. Therefore, the retrograde condensation effect of gas No. 2 is better than that of gas No. 1.
4 Conclusions
The condensate gas in WC9-2-X well in Wenchang 9–2 area is taken as the research object. The PVT phase state of condensate gas in WC9-2-X well and the retrograde condensation extraction of gas condensate by gas No.1 and gas No.2 are studied by visual multi-function HT and HP fluid PVT tester. The phase state study of condensate gas PVT includes single flash experiment, CCE experiment, CVD experiment and phase state envelope diagram simulation calculation. The retrograde condensation and extraction experiments of gas condensate by gas No.1 and gas No.2 includes the volume change rate of gas condensate, the physical properties of produced gas and gas gas condensate in the process of retrograde condensation. The main conclusions and recommendations are as follows:
CCE / CVD simulation experiment shows that when the reservoir temperature is 158.80 °C, the dew point pressure of condensate gas in well WC9-2-X is 20.71 MPa. The maximum volume of condensate produced by condensate gas is 1.28%, and the corresponding pressure is 9.01 MPa, which belongs to condensate gas reservoir fluid with low liquid hydrocarbon content. The gas condensate damage is more likely to occur in the near-wellbore area and wellbore low-temperature environment. The remaining gas condensate are not easy to be extracted under low pressure conditions. Therefore, in the actual production process, the heavy components in the retained reservoir pores increase and deepen the reservoir damage.
The self-produced gas (gas No. 1) of Well WC9-2-X is dominated by CH4 (78.33 mol%), and the CO2 / CH4 contents in the input waste gas (gas No. 2) of the WC14-3 gas field are 42.50 mol% / 41.60 mol%, respectively. The retrograde condensation effect of gas No. 2 is better than gas No. 1, mainly because the content of CO2 in gas No. 2 is high, and it is easier to achieve the effect of miscible dissolution of condensate when mixed with condensate. And the injection gas has a better extraction effect on the condensate oil, and the anti-evaporation effect is obvious.
Acknowledgements
This work was supported by the National Research Foundation of Korea (NRF) grant funded by the Korea government (MSIT) (NRF-2020R1A2C3009649). This research was supported by the BK21 FOUR Program (4199990414461) funded by the Ministry of Education (MOE, Korea) and the National Research Foundation of Korea (NRF). Prof. Eue-Soon Jang is especially thankful for research grants from the Korean Ministry of Education, Science & Technology (2016R1D1A3B0201175615) and the Grand Information Technology Research Center Program (IITP-2022-2020-0-01612) through the Institute of Information & Communications Technology Planning & Evaluation (IITP) funded by the Ministry of Science and ICT (MSIT), Republic of Korea. This research was supported by Basic Science Research Program through the National Research Foundation of Korea (NRF) funded by the Ministry of Education (NRF-2022R1I1A1A01068693).
Credit author statement
All data in the article comes from the author, without plagiarism and copyright issues.
Declaration of Competing Interest
The authors declare that they have no known competing financial interests or personal relationships that could have appeared to influence the work reported in this paper.
References
- Geology and geochemistry of large gas fields in the deepwater areas, continental margin basins of northern South China Sea. Mar. Petrol. Geol.. 2021;126:104901
- [Google Scholar]
- Peng. Jun, Pang. X, Peng. H, et al. 2017. Geochemistry, origin, and accumulation of petroleum in the Eocene Wenchang Formation reservoirs in Pearl River Mouth Basin, South China Sea: A case study of HZ25-7 oil field. Mar Petrol Geol, 80. pp. 154-170.
- Effects of rock pore sizes on the PVT properties of oil and gas-condensates in shale and tight reservoirs. Petroleum. 2018;4(2):148-157.
- [Google Scholar]
- On the liquid condensate vertical migration near the production wells of gas-condensate reservoirs. Eng. Sci. Technol.. 2020;23(4):715-722.
- [Google Scholar]
- Experimental study of wax deposition pattern concerning deep condensate gas in Bozi block of Tarim Oilfield and its application. Thermochim. Acta. 2019;671:1-9.
- [Google Scholar]
- The determination of phase behavior properties of high-temperature high-pressure and rich condensate gases. Fuel. 2020;280:118568
- [Google Scholar]
- Non-equilibrium phase behavior in gas condensate depletion experiments. Fluid Phase Equilib.. 2020;506:112410
- [Google Scholar]
- Change of phase state during multi-cycle injection and production process of condensate gas reservoir based underground gas storage. Petrol. Explor. Dev.. 2021;48(2):395-406.
- [Google Scholar]
- Taheri. A, Hoier. L, Torsaeter. O. 2013. Miscible and Immiscible Gas Injection for Enhancing of Condensate Recovery in Fractured Gas Condensate Reservoirs. Paper presented at the EAGE Annual Conference & Exhibition incorporating SPE Europec, London, UK.
- Tang. K, Liao. X, Min. Z, et al. 2021b. Experimental Investigation of Phase Behavior of Condensate Gas and Crude Oil System in Underground Gas Storage. Lithosphere, Special 4, 4366803
- Jiao. Y, Xie. W, Di. B, et al. Gas condensate phase behavior in process of cyclic gas injection. China: Xinjiang Petroleum Geology, 33(6), pp. 704-707.
- Al-Abri. A, Sidiq. H, Amin. R. 2009. Enhanced Natural Gas and Condensate Recovery by Injection of Pure SCCO2, Pure CH4 and Their Mixtures: Experimental Investigation. Paper presented at the SPE Annual Technical Conference and Exhibition, New Orleans, Louisiana.
- Evaluation of structural and mechanical properties and phase transitions of gas condensate. J. Eng. Phys. Thermophy.. 2020;93:1303-1309.
- [Google Scholar]
- Fanchi. John, Lake. L. 2006. Petroleum Engineering Handbook, Volume I: General Engineering. Society of Petroleum Engineers.
- Hou D, Xiao. Y, Pan. Yi, et al. 2016. Experiment and Simulation Study on the Special Phase Behavior of Huachang Near-Critical Condensate Gas Reservoir Fluid. J Chem-Ny, 2016, pp. 1-10.
- Study on nonequilibrium effect of condensate gas reservoir with gaseous water under HT and HP condition. J. Chem.-Ny.. 2014;2014(1):1-8.
- [Google Scholar]
- Microvisual study of multiphase gas condensate flow in porous media. Transport Porous Med.. 1997;28(1):1-18.
- [Google Scholar]
- Control factors and diversities of phase state of oil and gas pools in the Kuqa petroleum system. Acta Geol. Sin. - English Ed.. 2012;86:484-496.
- [Google Scholar]
- Composition and properties of the natural high-molecular-weight components of gas condensate and oil-gas condensate fields. Solid Fuel Chem.. 2010;44:203-212.
- [Google Scholar]
- Rahimzadeh. A, Bazargan. Mohammad, Darvishi. Rouhollah, et al. 2016. Condensate blockage study in gas condensate reservoir. J Nat Gas Sci Eng, 33, pp. 634-643.
- Pederson. K S, Christensen. P L. 2007. Phase Behavior of Petroleum Reservoir Fluids. Taylor & Francis Group, LLC.
Appendix A
Appendix 1
Note: C1 = Methane, C2 = Ethane……, C11 = Undecane.
Components
Condensate gas molar composition, mol %
Flashing oil molar composition, mol %
Flashing gas molar composition, mol %
N2
0.01
0.00
0.01
CO2
7.30
0.00
7.46
Methane
77.19
0.00
78.86
Ethane
9.60
0.00
9.80
Propane
2.23
0.00
2.28
Iso-butane
0.56
0.00
0.57
N-butane
0.53
0.00
0.54
Iso-pentane
0.35
3.74
0.28
N-pentane
0.36
10.54
0.14
Hexane
0.17
5.94
0.05
Heptane
0.67
31.69
0.00
Octane
0.16
6.92
0.02
Nonane
0.32
15.05
0.00
Decane
0.21
9.89
0.00
Undecane+
0.34
16.22
0.00
Sum
100.00
100.00
100.00
Appendix 2
Components
N2
CO2
Methane
Ethane
Propane
Iso-butane
Molar composition, mol %
6.28
0.60
78.33
9.44
2.88
0.63
Components
N-butane
Iso-pentane
N-pentane
Hexane+
Sum
Molar composition, mol %
0.63
0.29
0.14
0.79
100.00
Appendix 3
Components
N2
CO2
Methane
Ethane
Propane
Iso-butane
Molar composition, mol %
1.60
42.50
41.60
8.30
3.60
0.70
Components
N-butane
Iso-pentane
N-pentane
Hexane+
Sum
Molar composition, mol %
0.70
0.30
0.20
0.50
100.00
Appendix 4
Component
Dry gas injection
First stage
Second stage
Third stage
Fourth stage
Fifth stage
Sixth stage
Seventh stage
Eighth stage
N2
0.006
0.006
0.006
0.005
0.005
0.005
0.005
0.005
0.005
CO2
7.459
6.888
6.917
6.984
7.077
7.186
7.303
7.371
7.463
C1
78.857
73.497
73.442
73.222
72.879
72.461
71.960
72.009
71.947
C2
9.805
8.912
8.988
9.171
9.436
9.756
10.117
10.319
10.625
C3
2.281
1.914
1.944
2.011
2.109
2.230
2.369
2.470
2.623
iC4
0.568
0.411
0.421
0.441
0.468
0.503
0.543
0.580
0.635
nC4
0.539
0.352
0.361
0.380
0.406
0.439
0.477
0.518
0.576
iC5
0.282
1.798
1.768
1.731
1.686
1.634
1.588
1.450
1.297
nC5
0.142
4.001
3.935
3.847
3.737
3.607
3.480
3.156
2.767
C6
0.045
0.902
0.897
0.889
0.879
0.865
0.850
0.818
0.770
C7
0.002
1.123
1.123
1.122
1.119
1.115
1.109
1.104
1.088
C8
0.015
0.196
0.197
0.197
0.198
0.199
0.200
0.202
0.204
Component
Dead oil
First stage
Second stage
Third stage
Fourth stage
Fifth stage
Sixth stage
Seventh stage
Eighth stage
C1-C5
14.286
10.530
10.391
10.218
10.009
9.767
9.545
8.852
8.055
C6
5.942
5.409
5.379
5.332
5.268
5.187
5.098
4.904
4.621
C7
31.688
32.693
32.697
32.664
32.587
32.463
32.278
32.132
31.685
C8
6.920
7.314
7.327
7.340
7.354
7.367
7.372
7.428
7.470
C9
15.051
16.033
16.075
16.134
16.210
16.301
16.392
16.634
16.942
C10+
26.114
27.916
28.025
28.205
28.463
28.804
29.201
29.935
31.114
Component
Dry gas injection
First stage
Second stage
Third stage
Fourth stage
Fifth stage
Sixth stage
Seventh stage
Eighth stage
N2
0.050
0.006
0.009
0.012
0.016
0.020
0.023
0.029
0.033
CO2
46.112
43.530
43.570
43.491
43.325
43.103
42.792
43.129
43.360
C1
40.820
36.863
36.820
36.779
36.737
36.696
36.670
36.536
36.430
C2
9.446
8.905
8.963
9.119
9.352
9.635
9.962
10.108
10.359
C3
2.316
1.915
1.947
2.017
2.120
2.246
2.393
2.500
2.662
iC4
0.535
0.412
0.420
0.437
0.462
0.494
0.530
0.563
0.612
nC4
0.450
0.351
0.357
0.370
0.390
0.414
0.444
0.471
0.512
iC5
0.160
1.797
1.764
1.722
1.671
1.612
1.557
1.404
1.230
nC5
0.077
4.000
3.934
3.844
3.733
3.600
3.471
3.139
2.740
C6
0.022
0.902
0.897
0.889
0.878
0.864
0.849
0.815
0.766
C7
0.001
1.123
1.123
1.122
1.120
1.116
1.110
1.105
1.090
C8
0.011
0.196
0.197
0.197
0.196
0.200
0.199
0.202
0.206
Component
Dead oil
First stage
Second stage
Third stage
Fourth stage
Fifth stage
Sixth stage
Seventh stage
Eighth stage
C1-C5
14.286
10.528
10.381
10.196
9.974
9.712
9.471
8.738
7.885
C6
5.942
5.408
5.378
5.330
5.264
5.181
5.090
4.889
4.596
C7
31.688
32.690
32.702
32.672
32.600
32.483
32.304
32.172
31.741
C8
6.920
7.313
7.327
7.342
7.356
7.370
7.376
7.435
7.478
C9
15.051
16.032
16.077
16.140
16.219
16.315
16.411
16.663
16.985
C10+
26.114
27.922
28.030
28.216
28.483
28.836
29.245
30.002
31.214


