

Translate this page into:
Development of GC–MS/MS method for environmental monitoring of 49 pesticide residues in food commodities in Al-Rass, Al-Qassim region, Saudi Arabia
⁎Corresponding author. mohamed.ahmed_ali@buc.edu.eg (Mohamed A. Ali)
-
Received: ,
Accepted: ,
This article was originally published by Elsevier and was migrated to Scientific Scholar after the change of Publisher.
Peer review under responsibility of King Saud University.
Abstract
The harmful effects of pesticide residues are a threat to our health. Therefore, the current study aimed to validate a simple method for the determination of pesticide residues in commonly consumed fruits and vegetables from Al-Rass, Al-Qassim region, Saudi Arabia. A total of 1430 samples were collected from a local market and then analyzed for monitoring of 49 pesticide residues. A quick, easy, cheap, effective, rugged, and safe (QuEChERS) multi-residue extraction method followed by gas chromatography equipped with triple-quadrupole mass spectrometry (GC–MS/MS) was successfully implemented. This 17-min-run analytical method detects and quantifies pesticide residues with acceptable validation performance parameters in terms of sensitivity, selectivity, linearity, the limit of quantification, accuracy, and precision. The linear range of the calibration curves ranged from 10 to 300 µg/L, all the pesticide LODs ranged from 0.0005 to 0.0024 mg/kg, and the pesticide LOQs ranged from 0.0011 to 0.0047 mg/kg. The recovery values at the three fortification levels ranged from 78 % to 107 %, and the precision values (expressed as RSD%) were less than 20 % for all of the investigated analytes. The results showed that 138 (9.65 %) of the analyzed samples were contaminated with pesticide residues, 40 (2.80 %) of the analyzed samples exceeded the maximum residue limit (MRL) of the European Commission regulations (EC) for pesticides residues, 98 (6.85 %) of the analyzed samples were contaminated with residues below the MRL, and 1292 (90.35 %) of the analyzed samples were pesticide residue-free. Coriander contained the highest percentage (46.88 %) of pesticide residues, particularly tetradifon that representing 18.75 % noncompliance with the MRL, followed by parsley, with 20.59 % pesticide residues (10.29 % non-compliance). Multiple pesticide residues were observed most frequently in tomatoes and dates which were contaminated with buprofezin and ethion respectively.
Keywords
Food commodities
GC–MS/MS
Maximum residue limits, Method validation
Pesticide residues
QuEChERS

1 Introduction
The rapidly increasing world population requires large-scale and frequent production of food commodities that are free of contaminants, such as pesticide residues, heavy metals, and detergents.
Pesticide residues have toxic effects on humans that may lead to acute and chronic adverse health effects, depending on the concentration and method of exposure. Global pesticide usage had increased to 3.5 million tonnes (Sharma et al., 2019); hence, the agricultural products contaminated with pesticide residues are considered the most common pathway for chemical contaminants to reach humans (Abdalla et al., 2018).
Pesticides are generally applied in different ways during the production of fruits and vegetables to prevent the growth of agricultural pests, to extend storage periods, and to improve crop quality post-harvest (Abdalla et al., 2018). Significant attention has been paid to pesticides because of their use in agricultural activities worldwide for different crops and for their neurological effects on humans as a consequence of excess exposure (Rawn et al., 2008). Identifying and detecting potentially adverse health outcomes associated with these residues is the focus of ongoing research.
Maximum residue limits (MRLs) for pesticides in food and feed have been established by the European Union (EU) (Regulation European Commission (EC) No 396/2005) (EC, 2006) and the Food and Agriculture Organization of the United Nations (CAC, 2016) to reduce the environmental and health issues. Ensuring the concentration of pesticides in the consumed food commodities will create no harm, with a high degree of certainty. Continuous monitoring is essential for identifying pesticide residues for many reasons, such as the quality and safety of food and for the research purpose (FDA Monitoring Program, 1993; Koesukwiwat et al., 2010; Okihashi et al., 2005).
The evolution of sample preparation methods for analyzing pesticide residues started in 1963 with the analysis of organochlorine insecticides using acetonitrile with petroleum ether. Later, acetone was employed to avoid the partial loss of polar pesticides, and salt was used to improve the recovery of the pesticides.
In the 1990 s, the Luke extraction method triggered solid-phase extraction to satisfy the need for a lower limit of quantification (LOQ) (Shendy et al., 2016). Following this, many methods were developed, including gel-permeation chromatography, microwave-assisted extraction, accelerated solvent extraction, and supercritical fluid extraction until the introduction of the revolutionary quick, easy, cheap, effective, rugged, and safe (QuEChERS) method, which is suitable for most official analysis methods.
This procedure requires only small quantities of solvent and is capable of generating recoveries of 70–120 % with RSDs less than 5 % for a wide range of compounds. It has two steps: the first one is the solvent extraction which is designed to achieve the maximum yield of analytes from the base matrix where the analytes are extracted from the matrix with acetonitrile and salts/buffers. The second step is the sample cleanup which is necessary to reduce any interferences that can damage the analytical instrumentation and complicate the analyte identification and quantification (Zaidon et al., 2019).
The current study used the AOAC Official Method 2007.01 Pesticide Residues in Foods, which uses acetonitrile extraction and partitioning with magnesium sulfate (Bidari et al., 2011). This method was developed by various laboratories as a replacement method for conventional sample preparation. The QuEChERS method saves time, uses less solvents compared to other methods and delivers reliable results (Anastassiades et al., 2003; Lehotay et al., 2010; Shendy et al., 2019, 2016) The analysis of multi-pesticide residues based on liquid chromatography (LC-MS) and gas chromatography (GC–MS) techniques is widely used (Facco et al., 2015; Molina-Ruiz et al., 2015)., including the AOAC Official Method 2007.01 and the EN 15662:2018 and PD CEN/TR 15641:2007 standards (Lehotay, 2007; Recommendation, 2007; Standardization, 2018). Analytical methods can be validated by investigating different parameters such as: the limit of detection (LOD), limit of quantification (LOQ), linearity, matrix effect, precision, trueness, specificity, and robustness. Moreover, the obtained results can be compared to the results of standard methods by ensuring that they fall within the accepted range of them.
Countries pay much attention to keeping their citizens healthy thus, Saudi Arabia addresses the importance of this issue by managing pesticide residues. This study was conducted in Al-Rass city, which lies in the approximate center of the Arabian Peninsula and is considered a province of the Al-Qassim region (Mohieldein et al., 2011). A total of 23 pesticides from different chemical groups in 160 different domestic vegetables collected from supermarkets located in Al-Qassim region, Saudi Arabia, were identified by (K.A. Osman et al., 2010). Residues were found in 89 of the 160 samples and 53 samples were above the maximum residue levels (MRLs). The most frequently found pesticides were carbaryl followed by biphenyl and then carbofuran. Cabbage was the most positive and violated MLRs, followed by carrot and green pepper, cucumber, egg-plant, squash, lettuce and tomato. The highest concentrations were found in lettuce (ethiofencarb, 7.648), followed by tomato (tolclofos-methyl, 7.312 mg/kg), cabbage (chlropyrifos, 6.207 g/kg), carrot (heptanophos, 3.267 mg/kg), green pepper (carbaryl, 2.228 mg/kg) and egg-plant (carbaryl, 1.917 mg/ kg). the evaluation of Pesticide Residues in Vegetables from the Asir Region, Saudi Arabia by (Mohamed F. A. Ramadan et al.,2020) showed that lettuce, cauliflower, and carrot samples were found to be free from pesticide residues. A total of 145 samples (68.7 %) contained detectable pesticide residues at or lower than MRLs, and 44 samples (20.9 %) contained detectable pesticide residues above MRLs. MRL values were exceeded most often in chili pepper (14 samples) and cucumber (10 samples). Methomyl, imidacloprid, metalaxyl, and cyproconazole were the most frequently detected pesticides. Few reports on the contamination of fruits and vegetables by various pesticides in this region hence, this study aims to develop and to validate a simple method for monitoring 49 pesticide residues in fruits and vegetables commonly consumed in Al-Rass city for quality control and food safety concerns.
2 Materials and methods
2.1 Materials
All the materials were of analytical grade (Fisher Chemical Scientific, UK) and used without additional purification. All reagents were HPLC grade (Fisher Chemical Scientific, UK). Ultrapure water was produced by a water purification system (Elga, Germany) with a specific resistivity of 18.2 mΩ.cm.
2.2 Instrument and instrumental conditions
2.2.1 GC–MS/MS method and triple-quadrupole MS settings
A triple-quadrupole mass spectrometer (Thermo Scientific, USA) was used in timed-selection reaction monitoring (t-SRM) acquisition mode for the mass spectrometric detection using the TSQ 8000 Pesticide Analyzer system technique to create all the analytical methods and SRM settings described as follows.
Gas chromatography and a mass detector triple-quadrupole GC–MS/MS (TRACE GC 1300 and TSQ 8000 Evo; Thermo Scientific, USA) equipped with an autosampler (AL 1310) were used. The GC system was equipped with a capillary column (TG-5MS; Thermo Scientific), which was 30 m long, had an internal diameter of 0.25 mm, and the film thickness was 0.25 μm. The temperature of the injector and ion source was 220 °C. The detector voltage was 70 eV, and the MS spectra were scanned in the mass range of 50–600 m/z, as recommended by the GC–MS/MS manufacturer (Kim et al., 2006). The carrier gas flow rate in the column was 1.0 mL/min, and grade 5 helium (99.999) was used as the carrier gas. 1.0 µl of the sample was injected for each run via splitless mode and the surge pressure was 200.0 kPa (Abdalla et al., 2018). The oven heating started at 100 °C with a holding time of 1 min then it was raised to 180 °C at a ramp rate of 30 °C/min. Finally, the temperature was raised to 280 °C with a holding time of 4 min.
The TSQ 8000 system automatically optimized the acquisition windows and the instrument duty cycle using timed-selection reaction monitoring (t-SRM) for maximum sensitivity. Xcalibur™ 2.2 SP1.48 software was used for data acquisition (Michely et al., 2017). Three replicates and their means were used for the reported results. The instrumental SRM conditions are shown in Table 1.
#
Name
RT
M.wt
M/z 1
M/z 2
M/z 3
Mass
PM
CE
Mass
PM
CE
Mass
PM
CE
1
diclorovos
3.688
220
109
79
6
185
93
12
146.1
128
8
2
carbofuran
4.024
221.25
149.1
103
16
149.1
121
8
164.1
131
16
3
propamocarb
4.541
188.2
58
42
20
58
43
14
4
trifluralin
6.222
335.28
163.1
133
10
264
160
14
306.1
206
12
5
benfluralin
6.259
335.28
163.1
133
8
264
188
8
292.1
206
10
6
dimethoate
6.793
229.26
87
50
16
93
53
14
125
47
12
7
atrazin
6.926
215
58.1
42
24
200.1
122
8
215.1
138
10
8
cyanophos
7.144
243
109
79
8
125
47
12
243
109
10
9
diazinon
7.188
304
172.9
145
14
175
147
14
179.1
122
22
10
pirimicarb
7.596
238.29
72
56
12
238.1
166
10
166.1
96
12
11
desmetryn
7.882
213
171.1
114
12
171.1
156
8
198.1
82
20
12
chlorpyrifos-methyl
7.99
322.5
198.1
82
16
285.9
93
20
287.9
93
22
13
vinclozolin
8.038
286.11
178
115
20
178
143
16
212
122
10
14
tolcophos-methyl
8.116
301.13
125
47
12
125
79
8
265
250
10
15
ametrine
8.212
227.33
170.1
102
10
212.1
122
10
227.1
58
12
16
pirimiphos-methyl
8.416
305
276.1
125
16
290.1
125
20
305.1
180
8
17
ethofumesate
8.501
286.34
137
81
10
161
105
10
207.1
137
10
18
malathion
8.593
330
127.1
99
6
173.1
99
12
207
137
10
19
diethofencarb
8.712
267.32
207.1
191
14
225.1
96
24
267.2
225
8
20
chlorpyrifos
8.749
350.59
97
47
30
196.9
169
12
198.9
171
12
21
aldrin
8.909
364.896
66.1
65
12
260.9
191
32
262.8
228
20
22
pirimiphos-ethyl
9.069
333.39
168.1
69
22
168.1
100
16
318.1
166
12
23
bromophos-methyl
9.147
363
125
47
12
328.9
314
12
125
79
8
24
pendimethalin
9.317
281.31
162.1
147
10
191.1
133
12
191.1
161
8
25
penconazole
9.443
284.2
159
89
30
159
123
18
161
89
30
26
procymidone
9.671
284.138
67.1
41
12
67.1
65
8
96.1
67
10
27
triadimenol
9.8
295.76
112.1
58
8
168.1
70
10
207
191
14
28
prothiofos
10.354
345.2
83.1
82
6
267
205
18
267
221
18
29
oxadiazon
10.47
344
174.9
112
14
174.9
140
10
174.9
147
8
30
kresoxim-methyl
10.593
313.3
116
89
14
131.1
90
14
206.1
116
8
31
buprofezin
10.627
305
105.1
77
18
105.1
104
8
106.1
77
18
32
dieldrin
10.671
380.91
79.1
77
12
143
43
16
235
143
10
33
chlorfenapyr
10.766
407.6
59
29
10
59
31
6
207
191
14
34
diafenthiuron
11.031
384.6
207
191
14
296.1
262
10
311.2
254
14
35
chlorbenzilate
11.082
325.19
139
111
12
207.1
191
14
251
139
12
36
ethion
11.222
383
96.9
47
28
153
97
10
231
129
22
37
chlorthiophos
11.273
361.2
96.9
47
28
268.9
205
14
325
269
12
38
trifloxystrobin
11.678
408.37
116
89
14
131.1
90
14
207.1
191
14
39
carbophenothion
11.722
342.9
96.9
47
28
121
65
10
157
45
12
40
propiconazol (i)
11.79
342.2
173
145
14
207
191
14
259
69
10
41
propiconazol (ii)
11.902
342.2
69.1
39
16
173
109
18
207
191
16
42
diclofob-methyl
12.161
341.2
253
162
16
255
147
24
340
253
10
43
resmethrin (i)
12.198
338.44
123.1
81
8
207
191
14
281.1
91
26
44
resmethrin (ii)
12.314
338.44
123.1
81
8
171.1
128
14
207
191
14
45
bifenithrin
12.746
422
165.1
164
20
166.1
165
12
181.1
165
24
46
tetradifon
13.317
356.05
159
131
10
207
191
16
226.9
199
12
47
cis-permethrin
14.586
391.28
183.1
153
10
207
191
14
281
249
18
48
trans-permethrin
14.742
391.28
183.1
165
10
281.1
249
18
281.1
265
10
49
etofenprox
16.202
376.5
163.1
107
18
163.1
135
10
281.1
249
18
2.3 Standard solutions
The reference standards for all of the investigated groups of pesticides were purchased from Fluka (Sigma-Aldrich Corp., St. Louis, MO, USA) with certified purities ranging from 95 to 99 %. An Elga Integral system produced the ultrapure water. Stock standard solutions were individually prepared in acetonitrile for each pesticide (1000.0 mg/L). Working standard solutions with a concentration of 10.0 mg/L were used for the preparation of matrix-matched calibration standards with seven calibration levels: 10.0, 20.0, 50.0, 100.0, 200.0, and 300.0 µg/L. Acetonitrile was used for the preparation and further dilution of the standard solutions. They were stored at − 20 °C until required, except for the matrix-matched calibration standards, which were prepared using pesticide residue-free green pepper and used immediately after preparation.
2.4 Sample preparation
2.4.1 Sample collection and storage
Fifteen fresh fruits and vegetables (i.e. tomato, cucumber, zucchini, eggplant, okra, green pepper, grape, coriander, parsley, bean, rocca, leek, peppermint, dates, and lettuce) were collected from different local markets in Al-Rass city between February 2019 and June 2020 according to the Codex’s recommended sampling methods (Hovind et al., 2012). The samples were kept in clean polyethylene bags inside an icebox before transportation to the laboratory. The samples were homogenized using an electrical grinder (Kenwood, China) and prepared according to the published guidelines (CAC, 2016) then stored at 4 °C to avoid the degradation of any pesticide during storage.
2.4.2 Sample preparation and spiking procedures
15.0 g (±0.1 g) of the homogenized sample was transferred into a 50-mL centrifuge tube (blue cap, sterile polypropylene; Capp, Denmark). A mixture of 49 pesticide standard solutions (10.0 mg/l) was used for spiking the 15.0 g weighted green pepper samples to yield final concentrations of 10.0, 100.0, and 300.0 µg/l.
2.4.3 Extraction procedures
15 mL of 1 % glacial acetic acid in acetonitrile was added to each sample using an analog adjustable bottle-top dispenser (Dispensator; Brand, Germany), and a 50-mL ceramic homogenizer (Agilent Technology, USA) was used to ensure the homogeneity of the samples. The 50-mL tubes were then shaken by vortex (Select; Bioproducts, USA) for 0.5 min. To each tube, 6.0 g of MgSO4 and 1.50 g of sodium acetate (Chromabond, Germany) were added directly using an analytical balance (ABJ-NM/ABS-N; Kern, Germany). The sample tubes were tightly capped and vigorously hand-shaken for 1 min and then shaken by a vortex for 1 min. The tubes were then cool-centrifuged in a standard centrifuge (Pro-Research K241R; Centurion Scientific, UK) at 5000 rpm for 5 min at 6 °C.
2.4.4 Cleanup procedures
An aliquot of 4 mL (the top layer) of the acetonitrile extracts was transferred by a single-channel micropipette (CAPP, Denmark) into a 15-mL centrifuge tube (United Chem.), which contained 150 mg of primary–secondary amine (PSA), 45 mg of graphitized carbon black (GCB), and 855 mg of anhydrous MgSO4. The samples were tightly capped and vortexed for 1 min and then cool-centrifuged at 5000 rpm for 5 min at 5 °C.
An amount (1 mL) of the slightly colored supernatant was transferred into a glass syringe with a hollow handle and metal record cone (Jena-Glass, Germany) fitted with a nylon syringe filter with a pore size of 0.22 μm (ChromTech, UK) and then filtered into a capped 1.5 mL amber glass vial (Machery-Nagel, Germany). The samples were then thoroughly vortexed before being analyzed by GC–MS/MS whereas Xcalibur software was used for data acquisition.
2.5 Method validation parameters
2.5.1 Specificity
It can be attained by injecting a reagent blank (i.e., deionized water instead of a sample) then with a duplicate blank control sample.
2.5.2 Linearity, working range, and sensitivity
The instrument was calibrated by measuring a blank matrix sample and seven matrix-matched calibration points (10.0–300.0 µg/l) across the range of interest three times on three different days. Each calibration curve was visually examined, and the r2 and slope were determined.
2.5.3 Limit of detection and limit of quantification
The LOD and the LOQ were calculated from three independent runs on three different days by analyzing 10 replicates of the method blank per run. The standard deviation (sigma) of the instrument response and the slope of the calibration curve for each pesticide per run were calculated.
The LOD and LOQ (µg/L) were then calculated for each run using the following equations adapted from ICH Q2 (R1) (Borman and Elder, 2017):
2.5.4 Precision and recovery
For the recovery experiment, we used spiked samples at three levels (i.e., 10.0, 100.0 and 300.0 µg/l) for eight independent runs. The average recovery for each spiked level was between 70 % and 120 %. Precision was assessed by evaluating the in-laboratory repeatability and reproducibility (intermediate precision) by calculating the relative standard deviation of the duplicated measurements for three months using two operators on different days with independent calibration curves and different batches of reagents.
The repeatability relative standard deviation (RSDr) and within-laboratory reproducibility relative standard deviation (RSDRw) should be no more than 20 %.
3 Results and discussion
3.1 Method validation
The quick, sensitive, and robust QuEChERS method was used to extract multiresidue pesticides from the vegetable samples. We used green pepper as the representative matrix for spiking of our validation study of the high water content commodity group except for grapes, as per the SANTE 2019 guidelines (European Commission, 2019).
The accuracy, precision, and detection limitations of the approach were investigated under optimal conditions. The recovery values at the three fortification levels ranged from 78 % to 107 %, and the precision values (expressed as RSD%) were less than 20 % for all of the investigated analytes (Table 2), which satisfied the criteria for quantitative methods for pesticide residues in food (European Commission, 2019).
#
Pesticide
Linear range (ug/L)
r2
LOD
(mg/kg)
LOQ
(mg/kg)
Spiked level 0.01 mg/kg
Spiked level 0.1 mg/kg
Spiked level 0.3 mg/kg
Precisi-on
Reco-very%
Rec.%
RSDr %n = 5
Rec.%
RSDr %n = 5
Rec.%
RSDr %n = 5
RSDR%
1
diclorovos
10–300
0.9957
0.0008
0.0016
102
10.7
104
6.8
106
8.9
8.8
104
2
carbofuran
50–300
0.9938
0.0024
0.0046
89
8.3
96
11.4
93
10.4
10.1
93
3
propamocarb
10–300
0.9969
0.0009
0.0019
100
8.7
100
9
90
13.3
10.3
97
4
trifluralin
0.9983
0.0007
0.0015
103
13.9
103
8.2
101
15.2
12.4
102
5
benfluralin
0.9956
0.0012
0.0024
99
7
100
8.3
96
16.8
10.7
98
6
dimethoate
0.9978
0.0008
0.0017
99
9.6
96
6.8
88
7.9
8.1
94
7
atrazin
0.9981
0.0006
0.0012
84
5.2
84
10.9
82
6.8
7.6
83
8
cyanophos
0.9972
0.0009
0.0018
103
5.8
95
9.6
93
7.4
7.6
97
9
diazinon
0.9994
0.0024
0.0045
86
12.6
85
12.8
93
5.4
10.3
88
10
pirimicarb
0.9997
0.0005
0.0011
107
5
101
9.1
97
8.7
7.6
102
11
desmetryn
0.9997
0.0021
0.0042
99
6.2
94
9.8
96
7.2
7.7
96
12
chlorpyrifos-methyl
0.9959
0.0012
0.0023
93
11.6
97
9.5
88
12.5
11.2
93
13
vinclozolin
0.9999
0.0009
0.0018
100
11.2
106
8.1
106
7.1
8.8
104
14
tolcophos-methyl
0.9994
0.0018
0.0037
105
3
99
7.2
94
5.1
5.2
99
15
ametrine
0.9996
0.002
0.004
105
9.5
104
9.3
98
10.4
9.7
102
16
pirimiphos-methyl
0.9971
0.0005
0.0009
104
3.1
96
6.7
90
4.4
4.8
97
17
ethofumesate
0.9989
0.0006
0.0012
96
10.3
93
8.3
89
5.5
8
93
18
malathion
0.9934
0.0021
0.0043
96
8.6
90
6.9
90
11
8.8
92
19
diethofencarb
0.9995
0.0008
0.0016
94
7.3
95
6.6
92
7.1
7
94
20
chlorpyrifos
0.9996
0.0023
0.0046
106
8.6
104
6.4
101
6.8
7.2
104
21
aldrin
0.9987
0.0021
0.0042
111
5.1
108
7.5
103
10.6
7.7
107
22
pirimiphos-ethyl
0.9998
0.0008
0.0016
97
7
88
8.9
88
5.7
7.2
91
23
bromophos-methyl
0.9925
0.002
0.004
99
5.2
100
9.6
101
4.5
6.4
100
24
pendimethalin
0.9982
0.0005
0.0011
91
6.5
88
6.9
86
6.7
6.7
88
25
penconazole
0.9992
0.0009
0.0018
102
8
102
4.2
104
5.5
5.9
103
26
procymidone
0.9961
0.0012
0.0023
102
6.7
96
9.9
91
6.3
7.6
96
27
triadimenol
50–300
0.9968
0.0011
0.0023
105
3
99
5.6
91
6.1
4.9
98
28
prothiofos
10–300
0.9987
0.0006
0.0012
97
9.6
97
9.4
96
14.1
11.1
97
29
oxadiazon
0.9998
0.0023
0.0045
107
4.2
106
5
96
10.8
6.7
103
30
kresoxim-methyl
0.9945
0.0012
0.0023
98
6.2
94
6.5
91
4.8
5.8
94
31
buprofezin
0.9979
0.0006
0.0012
106
4.9
96
8.3
90
6.9
6.7
97
32
dieldrin
0.9984
0.0023
0.0045
95
7.3
97
12.9
99
6.4
8.9
97
33
chlorfenapyr
0.9965
0.0023
0.0047
97
8.1
100
8.9
100
10.1
9.1
99
34
diafenthiuron
0.9981
0.002
0.0039
98
3.8
88
10.4
85
7
7.1
90
35
chlorbenzilate
10–300
0.9968
0.0006
0.0012
112
2.6
108
5.2
104
8.4
5.4
108
36
ethion
0.9939
0.0021
0.0042
105
13.9
101
8.3
89
14.9
12.4
98
37
chlorthiophos
0.9965
0.0019
0.0037
99
10.8
101
9.2
100
6.5
8.8
100
38
trifloxystrobin
0.9979
0.0023
0.0046
87
9.9
86
10.1
94
16.1
12
89
39
carbophenothion
0.9867
0.0023
0.0047
96
5.4
98
9
95
3.8
6.1
96
40
propiconazol (i)
0.9935
0.0012
0.0024
82
6.5
109
5.9
98
5.2
5.9
96
41
propiconazol (ii)
0.9979
0.0012
0.0024
102
3.2
105
5.8
103
11.3
6.8
103
42
diclofob-methyl
0.9954
0.0006
0.0012
99
4.3
99
8.5
95
6.1
6.3
98
43
resmethrin (i)
0.9981
0.0022
0.0046
111
4.7
100
7.5
95
5.9
6.1
102
44
resmethrin (ii)
0.9939
0.0022
0.0046
116
3.2
98
15.3
82
7.1
8.5
99
45
bifenithrin
0.9955
0.0005
0.0012
109
7.9
109
5.7
104
9
7.5
107
46
tetradifon
0.9957
0.0011
0.0022
75
3.9
81
8.7
79
6.5
6.4
78
47
cis-permethrin
0.9981
0.0012
0.0023
84
9.1
79
7.6
78
8.5
8.4
80
48
trans-permethrin
0.9901
0.0018
0.0037
80
5.4
84
8.3
89
9.6
7.8
84
49
etofenprox
0.9956
0.002
0.0039
107
6.2
101
10.5
98
8.9
8.5
102
The instrument responses for the reagent blank and blank control samples were less than 30 % of the LOQ. Linearity was evaluated by calibration curves in different ranges for different pesticide residues (Table 3). The linear range of the calibration curves ranged from 10.0 to 300.0 µg/L. All the pesticide LODs ranged from 0.0005 to 0.0024 mg/kg, and the pesticide LOQs ranged from 0.0011 to 0.0047 mg/kg, which met the EU regulation requirement for pesticide MRL (10.0 µg/kg).
Food commodity
No. of samples
Pesticide residue-free samples
Samples contaminated with pesticide residues
Percentage of contaminated samples
(%)
Samples with
Residue < MRL
% < MRL
Samples with
Residue > MRL
% > MRL
Tomato
327
280
47
14.37
32
9.79
15
4.59
Cucumber
186
167
19
10.22
18
9.68
1
0.54
Zucchini
114
110
4
3.50
4
3.51
0
0.00
Eggplant
93
92
1
1.08
1
1.08
0
0.00
Green pepper
149
131
18
12.08
16
10.74
2
1.34
Okra
30
30
0
0.0
0
0.00
0
0.00
Grape
24
20
4
16.67
3
12.50
1
4.17
Coriander
32
17
15
46.88
9
28.13
6
18.75
Parsley
68
54
14
20.59
7
10.29
7
10.29
Bean
18
18
0
0.0
0
0.00
0
0.00
Rocca
43
43
0
0.0
0
0.00
0
0.00
Leek
41
39
2
4.88
2
4.88
0
0.00
Peppermint
14
13
1
7.14
1
7.14
0
0.00
Dates
267
255
12
4.49
4
1.50
8
3.00
Lettuce
24
23
1
4.17
1
4.17
0
0.00
Total
1430
1292
138
9.65 %
98
6.85 %
40
2.80 %
The determination coefficient varied between 0.9867 and 0.9999, indicating the suitability of the method for pesticide quantification. The linearity, LOD, LOQ, precision (RSDr and RSDRw), and accuracy (determined by recovery studies) for the different pesticide residues are shown in Table 2. The recovery of the analyzed pesticides ranged from 78 % for tetradifon to 107.5 % for bifenthrin, as determined at three spiking levels (i.e., 10.0, 100.0, and 300.0 µg/kg). The recoveries were all within the appropriate range of the SANTE/12682/2019 guidelines (European Commission, 2019). The matrix-matched calibration method was proposed to minimize the matrix effect.
The repeatability of the method was evaluated by calculating Relative Standard Deviation (RSDr) which ranged from 3 % to 13.9 % at 10.0 µg/kg, 4.2 % to 15.3 % at 100.0 µg/kg, and 3.8 % to 16.8 % at 300.0 µg/kg. The reproducibility of the method, evaluated by calculating Relative Standard Deviation (the RSDRW on three different days of analysis for different concentration levels and with different operators and values, varied from 4.80 % to 12.4 %, which was considered acceptable (Melo et al., 2020).
3.2 Monitoring pesticide residues in food commodities
The concentrations of the pesticide residues found in 1430 samples of fruits and vegetables from Al-Rass city indicated that 138 samples (9.65 %) were contaminated with pesticide residues, of which 40 samples (2.8 %) exceeded the MRL of the European Commission regulations, 98 samples (6.85 %) were contaminated with pesticide residues below the MRL, and 1292 samples (90.35 %) were found to be pesticide residue-free.
Coriander, parsley, grapes, and tomato commodities had the highest contamination percentages, with pesticide residues of 46.88 %, 20.59 %, 16.67 %, and 14.37 %, respectively. The highest percentage of non-compliance with European commission regulations (CAC, 2016) MRLs was with 18.75 %, 10.29 %, 4.17 %, and 4.59 %, respectively. Okra, rocca, and bean commodities were found to be pesticide residue-free. Table 3 presents the details of all the commodities and the sample statistics.
The most frequently detected pesticides were buprofezin in tomato (34.04 %), trifloxystrobin in cucumber (36.84 %), bifenthrin in green pepper (38.89 %), tetradifon in coriander (93.33 %), buprofezin in parsley (42.86 %), and ethion in dates (83.33 %). Table 4 presents the frequency and ranges of the detectable pesticide residues in the tested commodities.
Food commodity
No. of contaminated samples with pesticides residues
Detected pesticides
Frequency of detection (%)
No. of Samples with residues < MRL
(%)
No. of Samples with residues > MRL
(%)
Tomato
47
trifloxystrobin
3 (6.38 %)
3 (6.38 %)
0 (0.0 %)
ethion
3 (6.38 %)
2 (4.26 %)
1 (2.13 %)
tolcophos-methyle
1 (2.13 %)
0 (0.0 %)
1 (2.13 %)
propiconazole
3 (6.38 %)
3 (6.38 %)
0 (0.0 %)
malathion
6 (12.77 %)
1 (2.13 %)
5 (10.64 %)
bifenthrin
4 (8.51 %)
4 (8.51 %)
0 (0.0 %)
buprofezin
16 (34.04 %)
11 (23.40 %)
5 (10.64 %)
propamocarb
3 (6.38 %)
3 (6.38 %)
0 (0.0 %)
diafenthiuron
1 (2.13 %)
0 (0.0 %)
1 (2.13 %)
chlorpyrifos
4 (8.51 %)
4 (8.51 %)
0 (0.0 %)
carbofuran
2 (4.26 %)
0 (0.0 %)
2 (4.26 %)
procymidone
1 (2.13 %)
1 (2.13 %)
0 (0.0 %)
Cucumber
19
metalaxyl
1 (5.26 %)
1 (5.26 %)
0 (0.0 %)
malathion
1 (5.26 %)
1 (5.26 %)
0 (0.0 %)
bifenthrin
3 (15.79 %)
2 (10.53 %)
1 (5.26 %)
propiconazole
3 (15.79 %)
3 (15.79 %)
0 (0.0 %)
propamocarb
4 (21.05 %)
4 (21.05 %)
0 (0.0 %)
trifloxystrobin
7 (36.84 %)
7 (36.84 %)
0 (0.0 %)
Zucchini
4
trifloxystrobin
2 (50 %)
2 (50 %)
0 (0.0 %)
buprofezin
1 (25 %)
1 (25 %)
0 (0.0 %)
chlorpyrifos
1 (25 %)
1 (25 %)
0 (0.0 %)
Eggplant
1
bifenthrin
1 (100 %)
1 (100 %)
0 (0.0 %)
Green pepper
18
chlorfenapyr
2 (11.11 %)
0 (0.0 %)
2 (11.11 %)
triadimenol
1 (5.56 %)
1 (5.56 %)
0 (0.0 %)
buprofezin
3 (16.67 %)
3 (16.67 %)
0 (0.0 %)
trifloxystrobin
2 (11.11 %)
2 (11.11 %)
0 (0.0 %)
bifenthrin
7 (38.89 %)
7 (38.89 %)
0 (0.0 %)
propiconazole
3 (16.67 %)
3 (16.67 %)
0 (0.0 %)
Okra
0
na
NA
NA
NA
Grape
4
propiconazol
1 (25 %)
0 (0.0 %)
1 (25 %)
buprofezin
3 (75 %)
3 (75 %)
0 (0.0 %)
Coriander
15
tetradifon
14 (93.33 %)
8 (53.33 %)
6 (40.0 %)
oxadiazon
1 (6.67 %)
1 (6.67 %)
0 (0.0 %)
Parsley
14
propiconazole
3 (21.43 %)
0 (0.0 %)
3 (21.43 %)
tetradifon
2 (14.29 %)
0 (0.0 %)
2 (14.29 %)
buprofezin
6 (42.86 %)
6 (42.86 %)
0 (0.0 %)
penconazole
3 (21.43 %)
1 (7.14 %)
2 (14.29 %)
Bean
0
na
NA
NA
NA
Rocca
0
na
NA
NA
NA
Leek
2
oxadiazon
2 (100 %)
2 (100 %)
0 (0.0 %)
Peppermint
1
tetradifon
1 (100 %)
1 (100 %)
0 (0.0 %)
Dates
12
ethion
10 (83.33 %)
2 (16.67 %)
8 (66.67 %)
bifenthrin
2 (16.67 %)
2 (16.67 %)
0 (0.0 %)
Lettuce
1
resmethrin
1 (100 %)
1 (100 %)
0 (0.0 %)
In this study, the concentrations of 49 different pesticides were determined in 15 different fruit and vegetable commodities. Of those pesticides, 19 were detected in the tested samples. Buprofezin, bifenthrin, and tetradifon were found most often. The detection frequency of the pesticide residues in the analyzed samples is shown in Fig. 1. Multiple pesticide residues were most frequently observed in tomato, cucumber, green pepper, parsley, coriander, and date. A comparison between the commodities in terms of the number of residue-free samples, samples with residue < MRL, and samples with residue > MRL is shown in Fig. 2.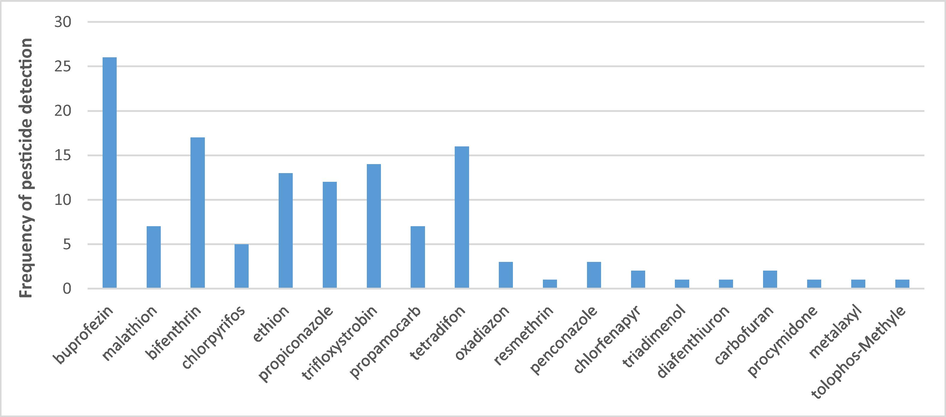
Frequency of the most often detected pesticides in the analyzed samples.
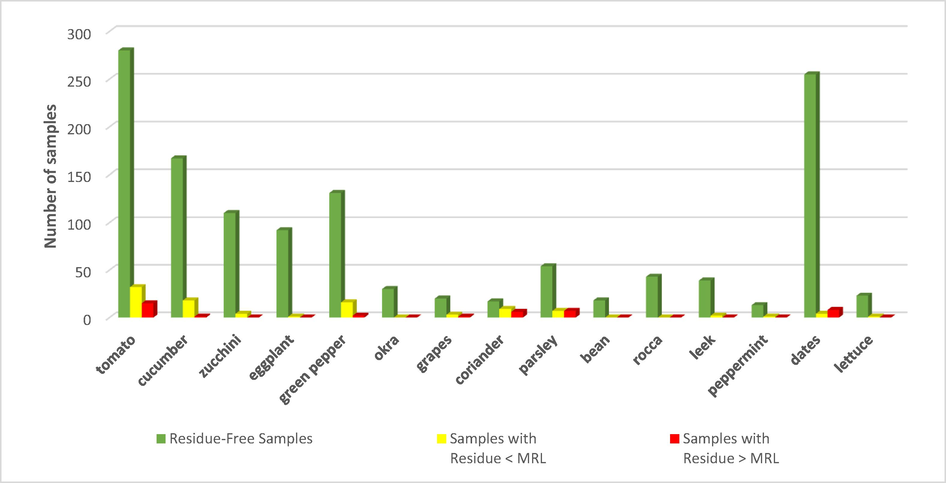
The occurrence of multiple pesticide residues < MRL, > MRL and free residues in different food commodities.
4 Conclusion
This research determined the prevalence of pesticide residues in fruit and vegetable commodities in Al-Rass, Al-Qassim region, Saudi Arabia. Coriander and parsley had the highest levels of contamination of pesticide residues. The most common pesticides residues were detected as follows: buprofezin in tomato (34.04 %), trifloxystrobin in cucumber (36.84 %), bifenthrin in green pepper (38.89 %), tetradifon in coriander (93.33 %), buprofezin in parsley (42.86 %), and ethion in dates (83.33 %). We established a multi-residue method for the rapid and simultaneous determination of 49 pesticides in fruits and vegetables using the QuEChERS procedure and GC–MS/MS analysis. In-house method validation was developed for the routine analysis of 49 pesticide residues according to the European Union SANTE/12682/2019 guidelines (European Union, 2019). This simple and quantitative method for the detection of pesticide residues was shown to have acceptable validation test parameters, including linearity, detection limits, LOQ, accuracy, and precision. We intend to extend our survey to other pesticides and for different regions.
Funding
The authors acknowledge financial support from the Researchers Supporting Project number (RSP-2021/103), King Saud University, Riyadh, Saudi Arabia. In addition, the authors would like to thank the Deanship of Scientific Research at Umm Al-Qura University for supporting this work by Grant Code: (22UQU4290565DSR58), maabourehab@uqu.edu.sa.
Acknowledgements
The authors are grateful to Al-Rass municipality, Saudi Arabia, in which the work was conducted. S. A. I. is grateful for Mohamed, while A. S. A. is grateful to Habiba and Hajer for their support. The authors acknowledge financial support from the Researchers Supporting Project number (RSP-2021/103), King Saud University, Riyadh, Saudi Arabia. In addition, the authors would like to thank the Deanship of Scientific Research at Umm Al-Qura University for supporting this work by Grant Code: (22UQU4290565DSR58), maabourehab@uqu.edu.sa.
Declaration of Competing Interest
The authors declare that they have no known competing financial interests or personal relationships that could have appeared to influence the work reported in this paper.
References
- Studying the Effect of Household-Type Treatment and Processing on the Residues of Ethion and Profenofos Pesticides and on the Contents of Capsaicinoids in Green Chili Pepper Using GC-MS/MS and HPLC. Food Anal. Methods. 2018;11:382-393.
- [CrossRef] [Google Scholar]
- Alimentarius, C., 2016. Recommended Methods of Sampling for the Determination of Pesticide Residues for Compliance with MRLs (CAC/GL 33-1999).
- Fast and easy multiresidue method employing acetonitrile extraction/partitioning and “dispersive solid-phase extraction” for the determination of pesticide residues in produce. J. AOAC Int.. 2003;86:412-431.
- [Google Scholar]
- Sample preparation method for the analysis of some organophosphorus pesticides residues in tomato by ultrasound-assisted solvent extraction followed by dispersive liquid–liquid microextraction. Food Chem.. 2011;126:1840-1844.
- [CrossRef] [Google Scholar]
- (EC), C.R., 2006. Commision Regulation (EC) 396/2005 1881, 1–5.
- European Commission, 2019. Analytical Quality Control and Method Validation for Pesticide Residues Analysis in Food and Feed (SANTE/12682/2019). Sante/12682/2019 1–48.
- Optimization and validation of a multiresidue method for pesticide determination in maize using gas chromatography coupled to tandem mass spectrometry. Anal. Methods. 2015;7:359-365.
- [CrossRef] [Google Scholar]
- J. AOAC Int.. 1993;76:127A-148A.
- [CrossRef]
- Internal quality control-handbook for chemical laboratories. Tr: Nord. Rep; 2012. p. :569.
- Effect of Methyl Jasmonate on Phenolics, Isothiocyanate, and Metabolic Enzymes in Radish Sprout (Raphanus sativus L.) J. Agric. Food Chem.. 2006;54:7263-7269.
- [CrossRef] [Google Scholar]
- Extension of the QuEChERS method for pesticide residues in cereals to flaxseeds, peanuts, and doughs. J. Agric. Food Chem.. 2010;58:5950-5958.
- [CrossRef] [Google Scholar]
- AOAC official method 2007.01 pesticide residues in foods by acetonitrile extraction and partitioning with Magnesium Sulfate. J. AOAC Int.. 2007;90:485-520.
- [Google Scholar]
- Multi-analyst, multi-matrix performance of the QuEChERS approach for pesticide residues in foods and feeds using HPLC/MS/MS analysis with different calibration techniques. J. AOAC Int.. 2010;93:355-367.
- [Google Scholar]
- Melo, M.G., Carqueijo, A., Freitas, A., Barbosa, J., Silva, A.S., 2020. Modified QuEChERS extraction and HPLC-MS/MS for simultaneous determination of 155 pesticide residues in rice (Oryza sativa L.). Foods 9. https://doi.org/10.3390/foods9010018.
- Biotransformation and detectability of the new psychoactive substances N, N-diallyltryptamine (DALT) derivatives 5-fluoro-DALT, 7-methyl-DALT, and 5,6-methylenedioxy-DALT in urine using GC-MS, LC-MSn, and LC-HR-MS/MS. Anal. Bioanal. Chem.. 2017;409:1681-1695.
- [CrossRef] [Google Scholar]
- Awareness of diabetes mellitus among Saudi non- diabetic population in Al-Qassim region. Saudi Arabia. J. Diabetes Endocrinol.. 2011;2:14-19. https://doi.org/https://doi.org/10.5897/JDE.9000005
- [Google Scholar]
- Determination of pesticide residues in fish tissues by modified QuEChERS method and dual-d-SPE clean-up coupled to gas chromatography-mass spectrometry. Environ. Sci. Pollut. Res. Int.. 2015;22:369-378.
- [CrossRef] [Google Scholar]
- Rapid Method for the Determination of 180 Pesticide Residues in Foods by Gas Chromatography/Mass Spectrometry and Flame Photometric Detection. J. Pestic. Sci.. 2005;30:368-377.
- [Google Scholar]
- Monitoring of pesticide residues in vegetables marketed in Al-Qassim region, Saudi Arabia. Ecotoxicol. Environ. Saf.. 2010;73(6):1433-1439.
- [CrossRef] [Google Scholar]
- Ramadan, M. F. A., Abdel-Hamid, M. M. A., Altorgoman, M. M. F., AlGaramah, H. A., Alawi, M. A., Shati, A. A., Shweeta, H. A., Awwad, N. S. Evaluation of Pesticide Residues in Vegetables from the Asir Region, Saudi Arabia, 2020. Molecules, 25(1), 205.
- Effects of postharvest preparation on organophosphate insecticide residues in apples. J. Agric. Food Chem.. 2008;56:916-921.
- [CrossRef] [Google Scholar]
- Recommendation, S., 2007. CEN / TR 15641 Food analysis - Determination of pesticide residues by LCMS / MS - Tandem mass spectrometric parameters. Cen 26.
- Worldwide pesticide usage and its impacts on ecosystem. SN Appl. Sci.. 2019;1:1-16.
- [CrossRef] [Google Scholar]
- Simultaneous determination of 200 pesticide residues in honey using gas chromatography–tandem mass spectrometry in conjunction with streamlined quantification approach. J. Chromatogr. A. 2016;1427:142-160.
- [Google Scholar]
- Coupling of GC-MS/MS to Principal Component Analysis for Assessment of Matrix Effect: Efficient Determination of Ultra-Low Levels of Pesticide Residues in Some Functional Foods. Food Anal. Methods. 2019;12:2870-2885.
- [Google Scholar]
- Standardization, E.C. for, 2018. Foods of Plant Origin–Multimethod for the Determination of Pesticide Residues using GC–and LC–Based Analysis following Acetonitrile Extraction/Partitioning and Clean-up by Dispersive SPE–Modular QuEChERS–Method.
- Improved QuEChERS and solid phase extraction for multi-residue analysis of pesticides in paddy soil and water using ultra-high performance liquid chromatography tandem mass spectrometry. Microchem. J.. 2019;145:614-621.
- [CrossRef] [Google Scholar]


