

Translate this page into:
Effect of sodium dodecyl sulfate on CO2 and H2S absorption enhancement of functionalized multiwall carbon nanotubes in water: Experimental study and empirical model
⁎Corresponding author. ameri@iaush.ac.ir (Elham Ameri)
-
Received: ,
Accepted: ,
This article was originally published by Elsevier and was migrated to Scientific Scholar after the change of Publisher.
Peer review under responsibility of King Saud University.
Abstract
A single bubble absorption column was used to examine the effect of hydrodynamic on carbon dioxide (CO2) and hydrogen sulfide (H2S) absorption in pure water and water-based nanofluids dispersed with neat, and OH and NH2 functionalized multiwall carbon nanotubes (MWCNTs). Sodium dodecyl sulfate (SDS) was used as a surfactant and stabilizer. The maximum absorption of CO2 and H2S were found to be 0.0038 mmol/m2·s and 0.056 mmol/m2·s using NH2-MWCNTs /nanofluid with 0.5 wt% content, respectively. The diffusion coefficients of gases into the nanofluids were computed by using an equation attained based on Dankwert’s theory. A last, an empirical correlation was proposed to determine the Sherwood number for the absorption of the aforementioned gases into the nanofluids.
Keywords
Nanofluid
Multi-wall carbon nanotubes
Absorption
Correlation
CO2

Nomenclature
-
Average molar flux (mol/m2·s)
-
Gas concentration at liquid bulk (mol/m3)
-
Average gas concentration at liquid bulk (mol/m3)
-
Gas concentration at gas–liquid interface (mol/m3)
-
Volume of nanofluid in the single bubble absorber (m3)
-
Number of bubbles
-
Average rising time for one bubble through the column (s)
-
Average radius of bubbles (m)
-
Mass transfer coefficient in liquid phase (m/s)
-
Diffusion coefficient (m2/s)
-
Diffusion layer thickness (mm)
-
Renewal surface factor (1/s)
- Re
-
Reynolds number
- Sc
-
Schmidt number
- Sh
-
Sherwood number
-
Diameter of bubbles raising through nanofluid
-
Volume fraction (%)
- w
-
Mass fraction (%)
-
Density (kg/m3)
-
Kinematic viscosity (m2/s)
-
HCl molarity (mol/lit)
-
Volume difference of standard acid in points (ml)
-
Volume of injected gas at standard condition (ml)
-
Gas flow rate (ml/s)
-
Total contact time (s)
-
Average speed of rising bubbles (m/s)
-
Nanoparticles’ diameter (nm)
-
Basefluid’s molecular diameter (nm)
-
Nanofluid
-
Basefluid
-
Nanoparticles
Subscripts
1 Introduction
The application of nanofluids for mass transfer improvement was proposed more than 100 years ago (Wang and Mujumdar, 2007). In this regard, it has been reported that the introduction of nanoparticle to base fluids may intensify the mass transfer rate in the absorption process of gaseous pollutants from the environment (Ashrafmansouri and Nasr Esfahany, 2016; Khafari-Nezhad et al., 2022; Darvanjooghi et al., 2017). Among these systems, the bubble absorption system is maybe one of the initial systems and is extensively being used to determine whether mass transfer enhancement could be attained using nanofluids. For instance, Darvanjooghi et al. (2017) applied a bubble column absorption system to investigate the influences of silica nanoparticle mean diameter on CO2 absorption in water-based nanofluid (Darvanjooghi et al., 2017). Other research integrated TiO2 and γ-alumina nanoparticles into an electrolyte solution to prepare electrolyte nanofluids (Beiki et al., 2013). Esmaeili Faraj et al. (2014) revealed that the rate of hydrogen sulfide absorption in a bubble column was diminished in the presence of silica nanoparticles whereas that of graphene nanofluid was enlarged (Esmaeili Faraj et al., 2014). MWCNT was used as a suitable adsorbent in heavy metal, dyes, and acid gases removal processes (Menghwar et al., 2019; Duran et al., 2015). Ma et al. (2007, 2009) were used MWCNT into a base fluid to enhance the absorption rate (Ma et al., 2007; Ma et al., 2009). The effect of MWCNT and Al2O3 nanoparticles on the ammonia/water absorption performance was considered by Lee et al. (2010). Kang et al. (2007) showed that the integration of CNTs in water led to an improvement in absorption rate (Kang et al., 2007). The maximum value for CO2 removal was also found to be 8.3 % at the Al2O3 nanoparticles volume fraction of 0.01 vol% (Yang et al., 2011).
Remarkably, some researchers examined the chemical and physical treatments on the dispersion and thermal conductivity of nanofluids (Ghozatloo et al., 2014; Sundar et al., 2015). For example, the CNT nanofluids can generally be treated by two chemical and physical techniques. The physical techniques are usually performed by applying an ultrasonicator and high-pressure homogenizer to achieve a homogenous suspension. However, the physical techniques are simple but this technique is not sufficient to achieve long-term colloid stability (Derakhshan and Akhavan-Behabadi, 2016). Hence, integration of chemical and physical techniques was employed, in this work. The main chemical treatment techniques are covalent (chemical treatment using acids or alkalines on CNT) and non-covalent functionalization (add surfactant into CNT nanofluids). In this regard, sodium dodecyl sulfate (SDS), is the generally utilized surfactant (Borode et al., 2019). Despite the challenging issues for covalent functionalization, this method is effective respected for non-covalent functionalization (Nasiri et al., 2011; Esmaeili Faraj and Nasr Esfahany, 2016). Interested readers are referred to our work that studies this issue in the mass transfer area and for the H2S and CO2 adsorption process. The addition of surfactant into the nanofluids can affect the absorption rate. In this regard, the effect of the addition of substance 2-ethylene-1-hexanol into a nanofluid led to an enhancement in the adsorption rate (Kim et al., 2014). Moreover, Azimikia et al. (Azimikia et al., 2021) extracted carbon dioxide from the air stream, using nanofluid contained nanotubes in the presence of surfactants SDS and CTAB (Azimikia et al., 2021).
In the present study, the effects of the OH and NH2 functionalization on MWCNT and the addition of sodium dodecyl sulfate (SDS), as surfactant/stabilizer into MWCNT nanofluids were first investigated. Then the effect of hydrodynamic on carbon dioxide and hydrogen sulfide absorption was investigated in a single bubble absorption column through the prepared nanofluids. Moreover, a new empirical correlation incorporating Re and Sc was reported for different nanofluids during the absorption of the aforementioned gaseous pollutants.
2 Materials and methods
2.1 Experimental section
2.1.1 Materials
Raw MWCNTs (NT0), OH functionalized MWCNTs (NT1), and NH2 functionalized MWCNTs (NT2) were purchased from U.S. Research Nanomaterials, Inc (United States). The physical properties of the three types of MWCNTs were presented in Table 1. Also, in order to increase the NT0 stability during the preparation of nanofluid, a certain amount of SDS (Merck) with a density of 1.01 g/cm3 was added to the stock nanofluid. High purity NaOH solid pellets and HCl (37 vol%) (Merck) were utilized to measure the amount of absorbed CO2 and H2S through reverse titration. Deionized water and detergent were utilized for cleaning the laboratories glassware and double distilled water was used for the preparation of stock nanofluid and dilution.
MWCNT name
Functional group and content (wt.%)
Inner diameter (nm)
Outer diameter (nm)
Length (µ)
Specific area (m2/g)
NT0
none
5–10
10–20
10–30
200
NT1
OH, 3.06
5–10
10–20
10–30
200
NT2
NH2, 0.45 wt%
2–4
7–13
∼55
233
2.1.2 Nanofluid preparation
A precise electric balance (TR 120, SNOWREX, Taiwan) was used to weigh the nanotubes and the SDS during the preparation of the main nanofluid. The NT0, NT1, and NT2 in different weight fractions of 0.005, 0.01, 0.05, 0.1, 0.5, 1, and 5 wt% were separately dispersed in deionized water and then exposed to a sonication device (ultrasonic bath, Parsonic 30S-400 W, 28 kHz) (Esmaeili Faraj et al., 2014). The ultrasound waves were transmitted into the nanofluid with a cycle of 0.5 s and 60 % of its maximum amplitude for 1 h.
Also to investigate the effect of surfactant on the absorption process about 0.25 g of the surfactant, with a SDS to nanotubes mass ratio of 1:20 was added to the initial stock nanofluid and then dilution was made to achieve nanofluid samples with lower concentrations.
2.1.3 Characterization
Zeta potential analysis, (Malvern, ZetaSizer Nano ZS, United Kingdom) was used to determine the stability of the NT0, NT1, and NT2 into the nanofluid. The images of the NT0, NT1, and NT2 were achieved by using Transmission Electron Microscope (TEM, Hitachi, 9000NA, Japan).
2.1.4 Experimental procedure
A single-bubble column was used to study the absorption of carbon dioxide and hydrogen sulfide contact gases into the nanofluids. The column was made of transparent glass-type polymethyl methacrylate with a height of 100 cm, and an inner diameter of 162 mm. The schematic of the experimental setup is displayed in Fig. 1. In the absorption process of carbon dioxide or hydrogen sulfide into the nanofluid, several important parameters such as the fluid height in the column, the weight fraction of the nanotubes in the nanofluid, and the diameter of the diffuser directly affects the diameter of the rising gas bubbles, the inlet gas flow rate, the velocity of rising bubble, and the number of injected bubbles must be considered. In the follow the values and the method for calculating each of the parameters are described (Terraglio and Manganelli, 1967). Rising bubble time (tb); the time needed that bubbles rise from bottom to the top of the column; was.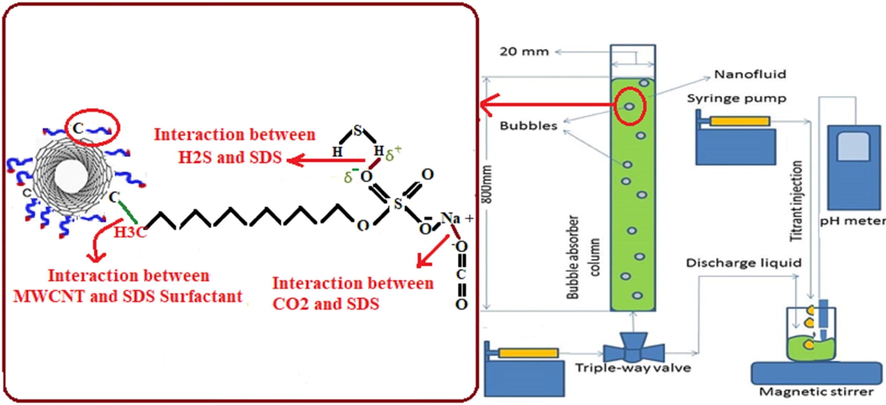
Schematic of experimental set-up, and the interaction between SDS and MWCNTs, and CO2 or H2S and SDS on the absorption process.
measured using a digital chronometer with maximum accuracy of ± 0.01 sec. It is related to the bubble diameter and the height of the fluid in the column. The height of the nanofluid in the column was 48.5 cm. Also, different sizes of diffusers were utilized to generate gas bubbles with different diameters in the experiments. So that, three different bubble sizes of 5, 9, and 13 mm were produced, and different size values of tb were consequently found to be 3.75, 3.62, and 3.54 sec, respectively.
In order to inject bubbles into the nanofluids with uniform sizes, a syringe pump (Viltechmeda Plus SEP21S, Germany) was used. The value of gas flow rate (Qg) was 3.3 ml/min.
The number of injected bubbles in the absorption process, (
), is calculated from the following equation (Esmaeili Faraj et al., 2014; Esmaeili Faraj and Nasr Esfahany, 2016):
The total contact time, (
), is determined as follow (Esmaeili Faraj et al., 2014; Esmaeili Faraj and Nasr Esfahany, 2016):
The value of average molar flux, (
), could be calculated by using the following equation (Esmaeili Faraj et al., 2014; Esmaeili Faraj and Nasr Esfahany, 2016):
In order to determine the mass transfer coefficient (
, different volumes of gas (10, 15, 20, 25, 30, 35, 40, 45, 50, 55, and 60 ml under standard conditions) were separately injected into the absorption column, and then it was determined as follow (Esmaeili Faraj et al., 2014; Esmaeili Faraj and Nasr Esfahany, 2016):
2.2 Mathematical modeling
In this work, besides the empirical measurements, an empirical correlation was first presented and then used to determine the Sherwood number. In this regard, in order to predict the required parameters, some equations were utilized as follow:
Dankwert’s theory was applied to compute the values of diffusion coefficient (D) for gas absorption through the prepared nanofluids, as follows (Zhao et al., 2003).
Also, the mass transfer coefficient of gas (
) into the nanofluids can be computed by using Eq.7 (Zhao et al., 2003):
Based on the reported results, the values of s,
, and D were considerably related to the size of the nanoparticle. Moreover, for the absorption process using nanoparticles with sizes in the range from 20 to 50 nm, the values of s and
could be assumed constant and equal to 6.85 1/s and 0.201 mm, respectively (Darvanjooghi et al., 2017). So, based on the average nanotubes’ diameter ranging from 20 to 50 nm used in this work, the values of the aforementioned parameters were substituted to Eq.7, and the simplified following relation was used to compute the
in the absorption process (Zhao et al., 2003).
Newton-Raphson was finally applied to solve Eq. (8) by considering the value of diffusion coefficient as a variable.
The dimensionless numbers needed to obtain the empirical correlation were also determined by using Eqs. (9)–(11).
The value of base fluid density, ( ), was 1000 Kg/m3.
Finally, the value of the Sherwood number was correlated as a function of nanofluids’ Re and Sc numbers by using multivariable regression analysis.
3 Results and discussion
3.1 Nanofluid characterization
The Zeta-potential analysis could be categorized as a parameter to estimate the stability of the nanoparticles in a base fluid (O' Brien et al., 1990). The higher magnitude of Zeta potential (more than 45 mV) refers to a key factor for high nanoparticles stability whereas lower magnitude (lower than 45 mV) denotes the tendency of nanoparticles for clusters formation (Hanaor et al., 2012). Due to the results presented in Fig. 2, the magnitude of Zeta potential for NT0, NT1, and NT2 were 8.4 mV, 37.7 mV, and 16.7 mV, respectively. But, the utilization of SDS in the nanofluid led to intense Zeta potential magnitude for all nano-scale samples. After the SDS addition in the nanofluid, the magnitude of Zeta potential of NT0, NT1, and NT2 was found to be 83.7 mV, 100 mV, and 70.5 mV, respectively. The reason for this observation can be explained by the following fact.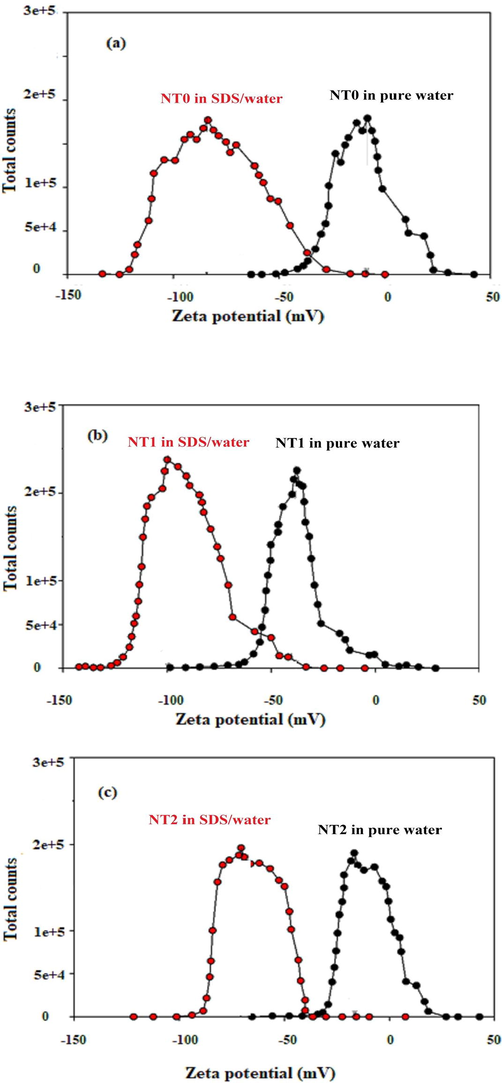
Zeta potential diagram for (a) NT0, (b) NT1, and (c) NT2 dispersed in deionized water in the presence and absence of SDS.
Carbon nanotubes are very hydrophobic. When the surface of the nanotubes is covered with the surfactant, the hydrophilic part of SDS oriented to the outside in the direction of the base fluid, enhances the electrical charges of the nanotubes’ surface, rises the polarity of their surface, and consequently increase the magnitude of Zeta potential (Darvanjooghi et al., 2018).
In conclusion, Fig. 2 shows that the addition of a small amount of SDS to nanofluid caused an increase in the nanotubes’ surface charge, and subsequently enhanced the magnitude of repulsive forces (Kim et al., 2008); which, in turn, favored the stability of the nanotubes in the nanofluid. It is worth to mention that although increasing the added amount of SDS to nanofluid improved the stability of the nanotubes in the nanofluid, but the variation of the viscosity of nanofluid limited the magnitude of SDS added to the nanofluid. So that, in order to determine the optimum SDS concentration added to the nanofluid, the viscosity of nanofluid containing 1 %wt nanotubes with different content of SDS added to the nanofluid were measured. Fig. 3 shows the value of the experimental nanofluid’s dynamic viscosity in terms of the SDS content for the nanofluid containing 1 %wt nanotubes. From Fig. 3, it could be concluded that the dynamic viscosity of the nanolfuid was first decreased with increasing the SDS content of the nanofluids. After that, with increasing the SDS content from 0.05 to 0.1 wt%, the dynamic viscosity of the nanolfuid was considerably increased and consequently diminished the mass transfer coefficient and the absorption rate of gas component in nanofluids.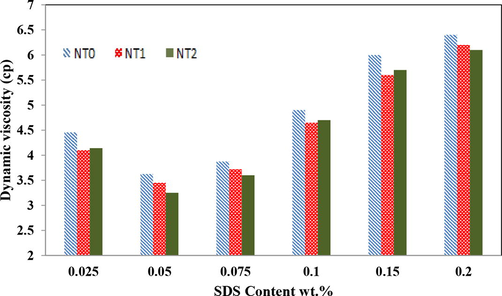
Dynamic viscosity of nanofluids with 1 wt% of NT0, NT1, and NT2 in presence of SDS at various concentrations.
So that, one can conclude that the change and enhancement of the viscosity of nanofluid containing 0.05 wt% SDS were at the least, and it was considered as the optimum value of the SDS content of the nanofluids.
3.2 Absorption experiments
3.2.1 Effect of the nano tubes content on average molar flux
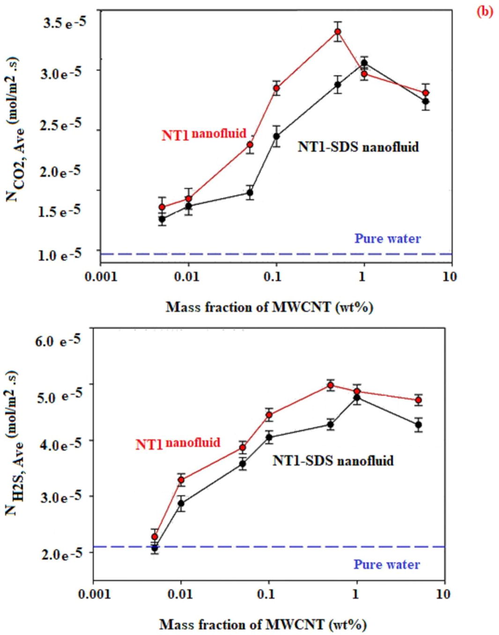
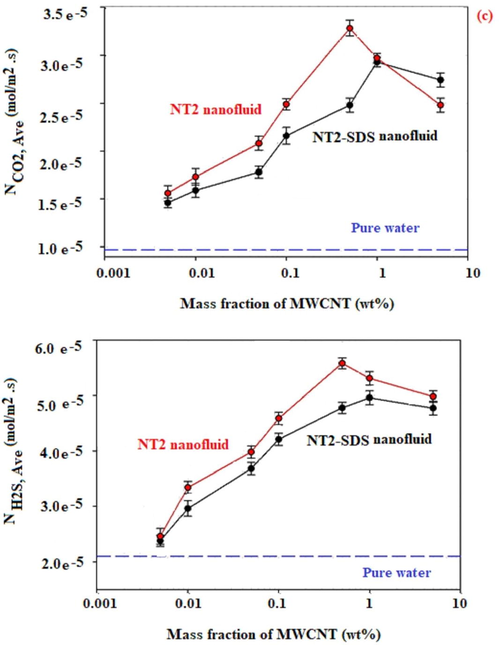
The effect of the nanotubes content on average molar flux, using a gas bubble with 9 mm in diameter is given in Fig. 4.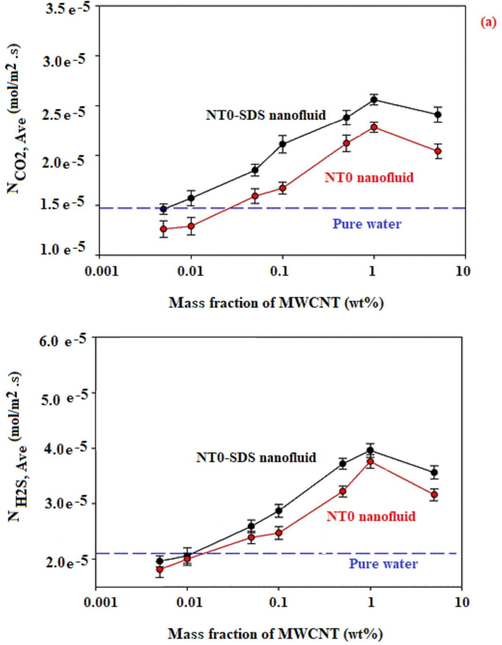
(a). Average molar flux of CO2 and, H2S vs mass fractions of NT0, NT1, and NT2 in the presence and absence of SDS.
(a). Average molar flux of CO2 and, H2S vs mass fractions of NT0, NT1, and NT2 in the presence and absence of SDS.
(a). Average molar flux of CO2 and, H2S vs mass fractions of NT0, NT1, and NT2 in the presence and absence of SDS.
Each experiment was repeated three times in order to omit the experimental errors. It can be seen from Fig. 4 that the average molar flux for absorption of CO2 and H2S was improved with an increase in the nanotubes (NT0, NT1, or NT2) content of the nanofluid up to 0.5 and 1 wt%, with and without using SDS. For example, Fig. 4 shows that the maximum average molar flux of H2S absorption by using NT1 with the content of 0.5, 0.005, and 0 wt% in nanofluids was found to be 0.050, 0.023, and 0.021 mmol/m2·s, respectively. Also, these corresponded values of CO2 absorption by using NT1 with the content of 0.5, 0.005, and 0 wt% were found to be 0.033, 0.018, and 0.015 mmol/m2·s, respectively.
There are several possible explanations for this result. Firstly, this was according to the micro-convective movement from Brownian motion which increased the absorption enhancement of the nanofluids (Lu et al., 2015). In this regard, Lu et al. (2015) investigated CO2 absorption by Al2O3 nanofluids with deionized water as base fluid. They found that the combination of nanoparticles improves the absorption of CO2 (Lu et al., 2015). On the other hand, incorporating nanotubes into the base fluid was causing a significant advantage which is mainly due to enhance the gas–liquid interface area, which, in turn, improves the gas absorption, resulting in an average molar.
flux of the mentioned gases into the nanofluids. In this regard, Ghaedi et al. (2011) reported that enhancement in the adsorption efficiency with increasing nanotubes can be attributed to a greater surface area and the availability of more adsorption sites (Ghaedi et al., 2011). However, rising nanotubes content of more than nearly 1 wt% could agglomerate the nanotubes in the nanofluid. It is worth mentioning that the raw nanotubes tend to agglomerate due to van der Waals forces between them (Park et al., 2005). Hence, increasing nanotubes content to 5 wt% enhanced probable agglomeration of them. Many studies have indicated that nanofluids could improve the gas–liquid mass transfer, but some researchers have come to the contrary conclusion (Jung et al., 2012). In the second category of the aforementioned studies, the presence of nanoparticles in the base fluid declines the mass transfer between gas and liquid. The possible mechanisms for this phenomenon can be explained by the following fact. The agglomeration of nanoparticles lessens the mass transfer; intensifies the viscosity of the base liquid, which, in turn, increased the thickness of the diffusion boundary layer, and subsequently decreasing the mass-transfer coefficient of the liquid phase and resulting in a blocked contact between gas molecules and fluid by the nanoparticles.
Fig. 5 shows the value of the experimental nanofluid’s dynamic viscosity in terms of the nanotubes content and confirms this effect. From Fig. 5, it could be concluded that the dynamic viscosity of nanolfuid was considerably enhanced with increasing the nanotube content of the nanofluids; therefore, this phenomenon diminished the mass transfer coefficient and the absorption rate of gas component in nanofluids (Darvanjooghi and Nasr Esfahany, 2016).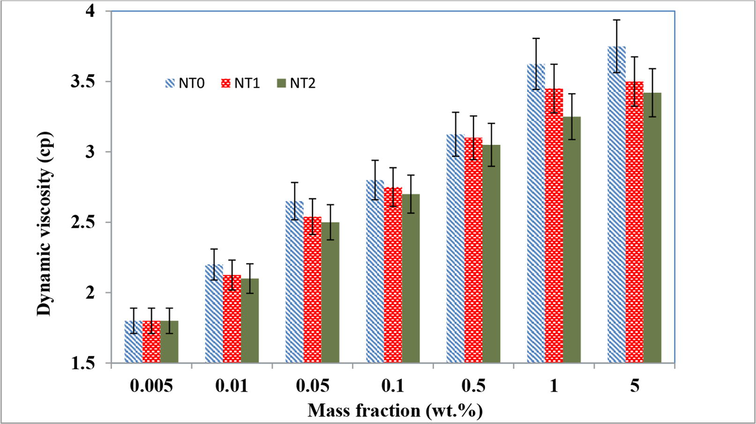
Dynamic viscosity of nanofluids loaded with NT0, NT1, and NT2 in presence of SDS at various nanotubes concentrations.
3.2.2 Effect of the SDS on average molar flux
As shown in Fig. 4, in the experiments using NT0, the absorption of CO2, as well as those of H2S, improved in the presence of SDS.
Fig. 4 displays that the maximum average molar flux of CO2 absorption by using 1 wt% of NT0 in nanofluid and SDS loaded nanofluid were respectively obtained 0.023, and 0.026 mmol/m2·s.
The maximum average molar flux of H2S absorption by using 1 wt% of NT0 in nanofluid and SDS loaded nanofluid were found to be 0.037, and 0.040 mmol/m2·s, respectively. This can be elucidated by the following fact. Carbon nanotubes are greatly hydrophobic and with the integration of SDS the surfaces of the nanotubes are covered with the surfactant molecules and the hydrophilic section of surfactants’ molecules is directed to the external part of the base fluid. This occurrence enhances the electrical charges of the surface and raises the polarity of the surface of the nanotubes to absorb CO2 and H2S gases. Therefore, based on their highly polar nature, CO2 and H2S gases are absorbed on the surface of nanotubes coated with SDS molecules, and this occurrence rises the adsorption rate and the gas absorption efficiency into the nanofluid (Azimikia et al., 2021). So that, the combination of surfactant onto a nanoparticle makes a thin layer on it, and subsequently causes a change in the original properties of the particle surface. Therefore, the particles have a great affinity with the base fluid and a strong repulsive force between the nanoparticles (Yang et al., 2011).
However, a decrease could be seen in CO2 and H2S molar flux using NT1 and NT2 in the presence of SDS. The addition of SDS to the functionalized nanotubes led to cover the OH and NH2 active functional groups on the NT1 and NT2, and subsequently declined the positive effect of these groups on the nano tubes. There is a possible explanation for this result. Researchers showed that the complexes of SDS with carbon are mainly determined by van der Waals interactions. In these complexes, Na+ ions of SDS are mostly oriented in the direction out of the carbon nanotube sheets with a preferable contact with the aqueous solution. The nonpolar hydrocarbon radicals along all the lengths of SDS form a maximum possible number of contacts with the nanotubes. It could be also suggested the micellar adsorption of the SDS molecules on the carbon surface. The SDS molecules interact with the hydrophobic surface of the nanotubes by their hydrophobic hydrocarbon radicals and are shielded from contact with water. The hydrophilic head groups of SDS are turned to the aqueous phase and this position promotes solubilization of CNTs. The adsorbed SDS molecules form a monolayer, similar to close-packed Langmuir monolayer, and they contact the nanotube surface only by tail radicals (Zueva et al., 2016). However, by functionalization of nanotubes with polar groups such as OH, and NH2, the orientation of the SDS molecules is changed. For example, by using low amounts of the SDS in the NT1/nanofluid, Na+ ions of SDS are mostly oriented toward the hydroxyl group on the nanotube, and the nonpolar hydrocarbon radicals along all the length of SDS are mostly oriented toward the water solution. Charge redistribution causes a change in the electrical double layer, which is reflected in the absorption changes. In this situation, the complexes of NT1/SDS surface were changed to the nonpolar surface, which in turn, decreases the absorption of the polar molecules gases, resulting in a reduced molar flux. Also, it can be stated that the addition of surfactant in the NT1/fluid led to a decrease in the molar flux due to make the interfacial mass resistance. So that, one can conclude that in the experiments using NT1 and NT2, the absorption of CO2 and H2S declined in the presence of SDS.
3.2.3 Effect of the MWCNTs OH and NH2/functionalization on average molar flux
The essential aim of the OH and NH2/functionalization of nanotubes was to enhance their hydrophilicity and intensify the stability of the nanofluids. However, the integration of OH and NH2 groups on the surface of nanotubes led to a change in the structure of those and caused an increase in the absorption performance of nanofluids with and without nanofluids. As shown in Fig. 4, in the experiments using functionalized nanotubes, the absorption of CO2, as well as that of H2S, improved respected to those by using raw nanotubes (NT0). Fig. 4 displays that the maximum average molar flux of CO2 absorption by using NT0, NT1, and NT2 in nanofluid were obtained 0.023, 0.033, and 0.038 mmol/m2·s, respectively. Also, these corresponded values of H2S absorption by using NT0, NT1, and NT2 in nanofluid were found to be 0.037, 0.050, and 0.056 mmol/m2·s%, respectively. There is a possible explanation for this result. This was according to the increased hydrophilicity and polarity of the nanotubes owing to the presence of OH or NH2 groups on those. On the other hand, since the NT1 and NT2 have polar nature and have an affinity towards the mentioned molecules gases, cause an increase in the solubility of carbon dioxide (has two polar C⚌O bonds) or H2S in nanofluids due to the existence of polar groups, and improve the molar flux of the hydrogen sulfide and carbon dioxide gases due to grazing effect. In the grazing effect, nanotubes could enhance the amount of liquid mobility close to the fluid-gas surface and, nanotubes transfer right through the concentration film layer and pick adsorbate up. In addition, the reason of this finding may be due to the fact that the viscosity of NT1/ NT2 nanofluid with SDS was small compared to that of NT0 nanofluid with SDS at the same condition. It educates the thickness of the diffusion boundary layer, and therefore reducing the mass-transfer coefficient of the liquid phase.
3.3 Mathematical modeling
3.3.1 Mass transfer coefficient
In order to determine the mass transfer coefficient and gas concentration at the gas–liquid interface, linear regression with 11 independent variables was done by using the data points in a graph of average molar flux vs CO2 or H2S average bulk concentrations (Fig. 6). The results of linear regression analysis shown in Table 2 indicated that the regression analysis was performed with high accuracy, with the linear regression correlation coefficient value (R2) found to be 0.99. The finding shown in Table 2 indicated that the mass transfer coefficient was decreased with the rising in gas bubble size. Moreover, these results indicate that the minimum value of the mass transfer coefficient was related to pure water. In other word, Table 2 shows that the mass transfer coefficient value for the H2S and CO2 absorption process was improved with MWCNTs.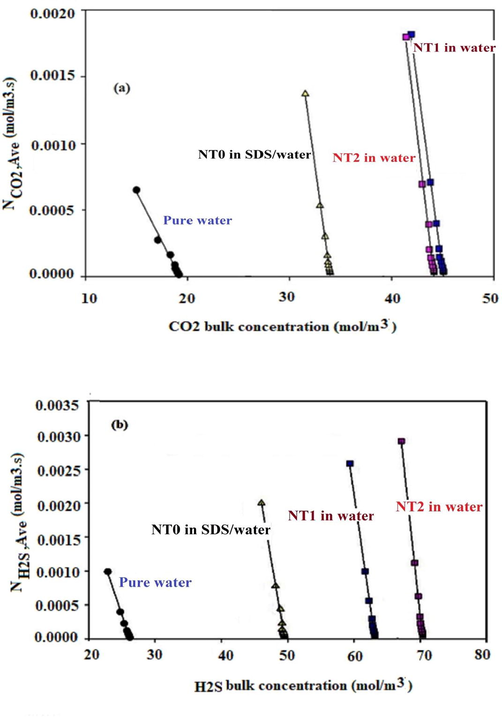
Average molar flux versus (a) CO2 and, (b) H2S bulk concentration for pure water and, NT0, NT1, and NT2 /nanofluid in presence of SDS.
Gas Ttype
CO2
H2S
Fluid
Gas bubble diameter of 5 mm
Pure water
26.2
6.68 × 10⁻⁵
0.999
19.3
4.33 × 10⁻⁵
0.994
W/NT0-S
49.6
1.47 × 10⁻⁴
0.998
39.2
1.61 × 10⁻⁴
0.998
W/NT1
63.2
2.44 × 10⁻⁴
0.995
44.2
2.30 × 10⁻⁴
0.992
W/NT2
70.4
1.70 × 10⁻⁴
0.996
45.1
1.75 × 10⁻⁴
0.998
Gas bubble diameter of 9 mm
Pure water
26.2
5.75 × 10⁻⁴
0.996
19.3
2.97 × 10⁻⁴
0.990
W/NT0-S
49.6
1.14 × 10⁻³
0.999
39.2
9.37 × 10⁻⁴
0.998
W/NT1
70.4
1.97 × 10⁻³
0.998
45.1
1.13 × 10⁻³
0.992
W/NT2
63.2
1.34 × 10⁻³
0.998
44.2
1.29 × 10⁻³
0.996
Gas bubble diameter of 13 mm
Pure water
26.2
1.88 × 10⁻³
0.996
19.3
1.12 × 10⁻³
0.990
W/NT0-S
49.6
2.89 × 10⁻³
0.997
39.2
2.02 × 10⁻³
0.997
W/NT1
63.2
3.46 × 10⁻³
0.997
44.2
2.62 × 10⁻³
0.999
W/NT2
70.4
3.10 × 10⁻³
0.996
45.1
2.12 × 10⁻³
0.995
In the H2S and CO2 absorption process for gas bubble diameter of 13 mm and using pure water, the mass transfer coefficient values were 1.88 × 10⁻³ m/s and 1.12 × 10⁻³ m/s, respectively; while the corresponding values using NT1, were 3.46 × 10⁻³ m/s and 2.62 × 10⁻³ m/s, respectively. It refers to the interaction between atoms that existed on functionalized groups on the surface of NT1 or NT2 and gas molecules which intensified the mass transfer coefficients.
Fig. 7 clarifies the interaction between the oxygen group functionalized on the surface of NT1 and gas molecules (CO2 and H2S). It is shown that the oxygen atom on NT1 attracted H2S molecules; while the hydrogen atom on NT1 attracted both CO2 and H2S molecules (see Fig. 7a). In other word, the OH groups on the outer surface of NT1 could form hydrogen bonding with CO2 and H2S molecules. Also, CO2 and H2S molecules were attracted by the hydrogen atom on NT2 as it is clearly displayed in Fig. 7b. However, the nitrogen atom on NT2 attracted only H2S molecules.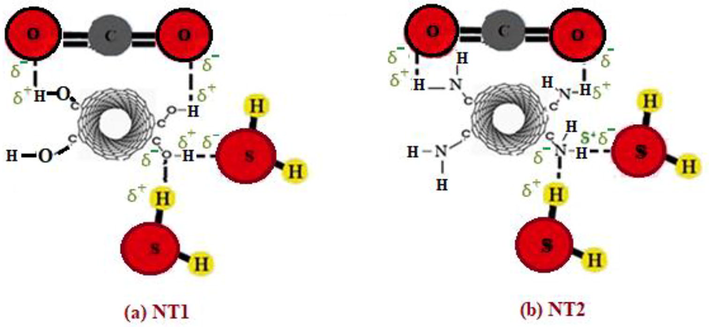
Schematic of interaction between carbon dioxide and hydrogen sulfide with NT1 and NT2.
The surface renewal rate (s), diffusion layer thickness (δ), and diffusion coefficient (D) were determined using multivariable nonlinear regression analysis on Eq. (8). The results of diffusion coefficient were shown in Table 3. In the H2S and CO2 absorption process using pure water, the diffusion coefficient values were 1.65 × 10⁻⁹ m/s and 2.12 × 10⁻⁹ m/s, respectively; while the corresponding value using NT0, was 2.85 × 10⁻⁹ m/s. As presented in Table 3, the diffusion coefficient was increased with the integration of MWCNTs into the pure fluid. It is worth mentioning that the presence of MWCNTs in the interface adsorb CO2 and H2S molecules led to increasing mass transfer in the interface region, which in turn, favors the diffusion of the penetrants, resulting in an enlarged diffusion coefficient. This result is in agreement with those stated elsewhere (Ghozatloo et al., 2014). The obtained values of diffusion coefficient for CO2 and H2S molecules into nanofluids were in the order of NT0 (with presence of SDS in nanofluid) < NT2 < NT1. This means that the covalent functionalization of MWCNTs had a more great effect on the gas adsorption process than the addition of SDS into the nanofluid, in this work.
Fluid
S(s−1)
S(s−1)
(m)δ
Pure water
0.988
2.12 × 10⁻⁹
4−10 × 7.431
0.989
1.65 × 10⁻⁹
7.557 × 10⁻⁴
2.21 × 10⁻⁵
SDS water /NT0
0.992
2.85 × 10⁻⁹
4−10 × 8.954
0.991
2.85 × 10⁻⁹
8.776 × 10⁻⁴
2.76 × 10⁻⁵
Water
/NT1
0.999
3.97 × 10⁻⁹
4−10 × 9.231
0.997
3.67 × 10⁻⁹
9.132 × 10⁻⁴
3.01 × 10⁻⁵
Water/NT2
0.998
3.42 × 10⁻⁹
4−10 × 9.561
0.995
3.02 × 10⁻⁹
9.867 × 10⁻⁴
3.12 × 10⁻⁵
In order to compare the obtained results of this work with other experimental data, Table 4 was presented. Table 4 shows the performance of various types of nanoparticles in the absorption of CO2, and SO2 gaseous pollutants (Darvanjooghi et al., 2017; Darvanjooghi et al., 2018; Karamian et al., 2019). It is worth mentioning that in all mentioned works, the value of the mass transfer coefficient was much higher for absorption of SO2 compared to that of CO2. In addition, Table 4 clearly showed that for the absorption system with a high gas bubble size the value of mass transfer coefficient was more than that of other studies.
Type of nanofluid
Gaseous pollutant
Mass transfer coefficient (m/s)
Remark
Reference
Fe3O4/water
CO2
5.0 × 10⁻⁵
–
(Darvanjooghi et al., 2017)
SiO2/water
CO2
3.3 × 10⁻⁶
Nanoparticles diameter of 10.6 nm
(Darvanjooghi et al., 2018)
SiO2/water
CO2
4.3 × 10⁻⁶
Nanoparticles diameter of 20.0 nm
(Darvanjooghi et al., 2018)
SiO2/water
CO2
5.4 × 10⁻⁶
Nanoparticles diameter of 38.6 nm
(Darvanjooghi et al., 2018)
SiO2/water
CO2
5.7 × 10⁻⁶
Nanoparticles diameter of 62.0 nm
(Darvanjooghi et al., 2018)
Fe2O3/water
CO2
2.3 × 10⁻⁵
–
(Karamian et al., 2019)
Al2O3/water
CO2
2.1 × 10⁻⁵
–
(Karamian et al., 2019)
Exfoliated graphene oxide/water
H2S
1.9 × 10⁻⁵
–
(Esmaeili Faraj and Nasr Esfahany, 2016)
Synthesized-SiO2/water
H2S
8.5 × 10⁻⁵
–
(Esmaeili Faraj and Nasr Esfahany, 2016)
MWCNT with presence SDS
H2S
2.98 × 10⁻³
Bubble size of 13 mm
This study
MWCNT-OH
H2S
3.46 × 10⁻³
Bubble size of 13 mm
This study
MWCNT-NH2
H2S
3.10 × 10⁻³
Bubble size of 13 mm
This study
MWCNT with presence SDS
CO2
2.02 × 10⁻³
Bubble size of 13 mm
This study
MWCNT-OH
CO2
2.62 × 10⁻³
Bubble size of 13 mm
This study
MWCNT-NH2
CO2
2.12 × 10⁻³
Bubble size of 13 mm
This study
MWCNT with presence SDS
H2S
1.14 × 10⁻³
Bubble size of 9 mm
This study
MWCNT-OH
H2S
1.97 × 10⁻³
Bubble size of 9 mm
This study
MWCNT-NH2
H2S
1.34 × 10⁻³
Bubble size of 9 mm
This study
MWCNT with presence SDS
CO2
9.37 × 10⁻⁴
Bubble size of 9 mm
This study
MWCNT-OH
CO2
1.13 × 10⁻³
Bubble size of 9 mm
This study
MWCNT-NH2
CO2
1.29 × 10⁻³
Bubble size of 9 mm
This study
3.3.2 Mass transfer empirical model
The Sherwood number was correlated as a function of nanofluids’ Re number and Sc numbers by using multivariable regression analysis by using Matlab software. The regression correlation coefficient value (R2) was found to be 0.964. The following empirical correlation (Eq. (14)) was obtained for the cases where carbon dioxide and hydrogen sulfide gases were separately absorbed by using NT0 in water base fluid loaded with SDS, and NT1, and NT2 in water base fluid.
The calculated results of the Sherwood number obtained from Eq.14 and the empirical results of that are presented in Fig. 8.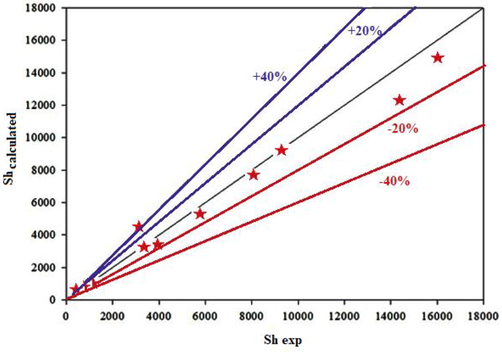
Comparison between the values of experimental Sh and those obtained by Eq8.
As shown in Fig. 8, the data deviation for the experimental Sherwood number for NT0 in water base fluid with additive SDS, and NT1, and NT2 in water base fluid from the calculated data was approximately less than 20 %. Therefore, this points out that the proposed empirical correlation could be evaluated the Sherwood number, correctly.
4 Conclusion
The influence of OH and NH2 functionalization in MWCNTs, and their content in nanofluids as well as the presence of SDS surfactant were studied on the absorption of carbon dioxide and hydrogen sulfide within a single-rising bubble column. Different sizes of diffusers were utilized to generate gas bubbles with different diameters of 5, 9, and 13 mm in the experiments. The finding showed that the mass transfer coefficient was decreased with the rising in gas bubble size. The nanotubes in different weight fractions of 0.005, 0.01, 0.05, 0.1, 0.5, 1 and 5 wt% were separately dispersed in deionized water. The dynamic viscosity of nanofluid was considerably enhanced with increasing the nanotube content of the nanofluids. In order to increase the NTs stability, a certain amount of SDS was added to the stock nanofluid. Results showed that the addition of a small amount of SDS to nanofluid caused an enhanced magnitude of repulsive forces, which, in turn, favored the stability of the nanotubes in the nanofluid. Also, the integration of SDS improved the mass transfer performance of the MWCNTs and enhanced its hydrophilicity that decreased the formation of nanotubes agglomeration in the nanofluid. The results also showed that the absorption of both CO2 and H2S molecules was enlarged by the functionalization of the MWCNTs with NH2 and OH groups with increasing the surface electric charges, leading to an increase in the absorption of gas molecules due to their polar molecular structures. However, a decrease was observed in CO2 and H2S molar flux using NT1 and NT2 in the presence of SDS which covered the active functional groups and consequently diminished the positive effect of functional groups on the MWCNTs. The mass transfer coefficients and diffusion coefficients were also determined using multivariable nonlinear regression analysis. The estimated diffusion coefficient for CO2 and H2S molecules into nanofluids were in the order of NT0 (with the presence of SDS in nanofluid) < NT2 < NT1. The maximum values of diffusion coefficient for CO2 (3.97 × 10⁻⁹ m2/s), and H2S (3.67 × 10⁻⁹ m2/s), was found using NT1 in the nanofluid.
Results also showed that the average molar flux of CO2 and H2S was improved with an increase in the nanotubes (NT0, NT1, or NT2) content of the nanofluid up to 0.5 and 1 wt%; however, rising nanotubes content more than nearly 1 wt% might agglomerate the nanotubes in the nanofluid, and lessened the mass transfer.
At last, an empirical correlation was obtained by using multivariable regression analysis for the prediction of Shnf in gas absorption into the nanofluids. The deviation of the experimental Shnf from the calculated data was found to be approximately less than 20 %.
Declaration of Competing Interest
The authors declare that they have no known competing financial interests or personal relationships that could have appeared to influence the work reported in this paper.
References
- Mass transfer into/from nanofluid drops in a spray liquid-liquid extraction column. AIChE J.. 2016;62(3):852-860.
- [Google Scholar]
- An experimental study of acid gas absorption by method hybrid nanofluid spraying in the presence of continuous and alternating magnetic fields. J. Mater. Res. Tech.. 2021;13:919-932.
- [Google Scholar]
- Turbulent mass transfer of Al2O3 and TiO2 electrolyte nanofluids in circular tube. Microfluid. Nanofluid.. 2013;15:501-508.
- [Google Scholar]
- Surfactant-aided dispersion of carbon nanomaterials in aqueous solution. Phys. Fluids. 2019;31:1-24.
- [Google Scholar]
- Experimental investigation of the effect of nanoparticle size on thermal conductivity of in-situ prepared silica–ethanol nanofluid. Int. Commun. Heat. Mass.. 2016;77:148-154.
- [Google Scholar]
- Investigation of the effects of nanoparticle size on CO2 absorption by silica-water nanofluid. Sep. Purif. Technol.. 2017;195:208-215.
- [Google Scholar]
- Investigation of the effects of nanoparticle size on CO2 absorption by silica-water nanofluid. Sep. Purif. Technol.. 2018;195:208-215.
- [Google Scholar]
- Mixed convection of MWCNT-heat transfer oil nanofluid inside inclined plain and microfin tubes under laminar assisted flow. Int. J. Therm. Sci.. 2016;99:1-8.
- [Google Scholar]
- Separation and enrichment of gold in water, geological and environmental samples by solid phase extraction on multiwalled carbon nanotubes prior to its determination by flame atomic absorption spectrometry. J. AOAC Int.. 2015;98:1733-1738.
- [Google Scholar]
- Hydrogen sulfide bubble absorption enhancement in water-based nanofluids. I&EC research. 2014;53:16851-16858.
- [Google Scholar]
- Absorption of hydrogen sulfide and carbon dioxide in water based nanofluids. I & EC Res.. 2016;55:4682-4690.
- [Google Scholar]
- Activated carbon and multiwalled carbon nanotubes as efficient adsorbents for removal of arsenazo(III) and methyl red from waste water, Toxic. Environ. Chem.. 2011;93:438-449.
- [Google Scholar]
- Effects of surface modification on the dispersion and thermal conductivity of CNT/water nanofluids. Int. Commun. Heat. Mass. Transf.. 2014;54:1-7.
- [Google Scholar]
- The effects of carboxylic acids on the aqueous dispersion and electrophoretic deposition of ZrO2. J. Eru. Ceram. Soc.. 2012;32:235-244.
- [Google Scholar]
- CO2 absorption characteristics of nanoparticle suspensions in methanol. J. Mech. Sci. Technol.. 2012;26:2285-2290.
- [Google Scholar]
- Absorption heat transfer enhancement in binary nanofluids. Int. J. Refrig.. 2007;31:850-856.
- [Google Scholar]
- The effect of various nanofluids on absorption intensification of CO2/SO2 in a single-bubble column. Processes. 2019;7:393.
- [Google Scholar]
- Experimental study and modeling of simultaneous absorption of H2S/ CO2 mixture by silica water -nanofluid in a packed bed column. J. Sep. Sci. Eng.. 2022;13(2):39-51.
- [Google Scholar]
- Synthesis of silica nanofluid and application to CO2 absorption. Sep. Sci. Tech.. 2008;43:3036-3055.
- [Google Scholar]
- Experimental study on the enhancement of particle removal efficiency in spray tower scrubber using electrospray. Asian. J. Atmos. Environ. (AJAE). 2014;8:89-95.
- [Google Scholar]
- The effects of nanoparticles on absorption heat and mass transfer performance in NH3/H2O binary nanofluids. Int. J. Refrig.. 2010;33:269-275.
- [Google Scholar]
- Q He Improvement of CO2 absorption using AL2O3 nanofluids in a stirred thermostatic reactor. Can. J. Chem. Eng.. 2015;93:935-941.
- [Google Scholar]
- Heat and mass transfer enhancement of the bubble absorption for a binary nanofluid. J. Mech. Sci. Technol.. 2007;21:1813-1818.
- [Google Scholar]
- Enhancement of bubble absorption process using a CNTs-ammonia binary nanofluid. Int. Commun. Heat. Mass. Transf.. 2009;36:657-660.
- [Google Scholar]
- A hybrid material composed of multiwalled carbon nanotubes and MoSe2 nanorods as a sorbent for ultrasound-assisted solid-phase extraction of lead(II) and copper(II) Microchim. Acta. 2019;186:666.
- [Google Scholar]
- A Panda A brief review on viscosity of nanofluids. Int. Nano. Lett.. 2014;4:109-120.
- [Google Scholar]
- Effect of dispersion method on thermal conductivity and stability of nanofluid. Exp. Therm Fluid Sci.. 2011;35:717-723.
- [Google Scholar]
- Effective in situ preparation and characteristics of polystyrene–grafted carbon nanotube composites, Korea. Australia. Rheol. J.. 2005;17:41-45.
- [Google Scholar]
- Electroacoustic studies of moderately concentrated colloidal suspensions. Faraday Discuss. Chem. Soc.. 1990;90:301-312.
- [Google Scholar]
- Heat transfer enhancement of low volume concentration of carbon nanotube-Fe3O4/water hybrid nanofluids in a tube with twisted tape inserts under turbulent flow. J. Therm. Sci. Eng. Appl.. 2015;7:021015.
- [Google Scholar]
- The absorption of atmospheric sulfur dioxide by water solutions. J. Air. Pollut. Control. Assoc.. 1967;6:403-406.
- [Google Scholar]
- Heat transfer characteristics of nanofluids: a review. Int. J. Therm. Sci.. 2007;46:1-19.
- [Google Scholar]
- Experimental study on enhancement of ammonia–water falling film absorption by adding nano-particles. Int. J. Refrig.. 2011;34:640-647.
- [Google Scholar]
- An experimental and theoretical study of the influence of surfactant on the preparation and stability of ammonia-water nanofluids. Int. J. Refrig.. 2011;34:1741-11174.
- [Google Scholar]
- Gas–liquid mass transfer in slurry bubble systems: I Mathematical modeling based on a single bubble mechanism. Chem. Eng. J.. 2003;96:23-27.
- [Google Scholar]
- Structure and properties of aqueous dispersions of sodium dodecyl sulfate with carbon nanotubes, Russian. Chem. Bullet. Int. Edit.. 2016;65:1208-1215.
- [Google Scholar]


