

Translate this page into:
Conversion of teak wood waste into microwave-irradiated activated carbon for cationic methylene blue dye removal: Optimization and batch studies
⁎Corresponding author. chazmier@usm.my (Mohd Azmier Ahmad)
-
Received: ,
Accepted: ,
This article was originally published by Elsevier and was migrated to Scientific Scholar after the change of Publisher.
Peer review under responsibility of King Saud University.
Abstract
The objective of this study is to find optimum preparation conditions in converting teak wood waste into activated carbon (TWAC) and to evaluate its performance in adsorbing cationic dye of methylene blue (MB). TWAC was produced via physiochemical activation (potassium hydroxide, KOH chemical treatment, and carbon dioxide, CO2 gasification) and heated through microwave irradiation technique. With the aid of response surface methodology (RSM), optimized TWAC was successfully synthesized at radiation power, radiation time, and impregnation ratio (IR) of 366 W, 5.30 min, and 1.15 g/g, respectively. These preparation conditions produced TWAC with MB adsorption uptakes of 66.69 mg/g and a yield of 38.23%. Characteristics of TWAC in terms of BET surface area, mesopores surface area, total pore volume, and average pore diameter were determined to be 1345.25 m2/g, 878.63 m2/g, 0.6140 cm3/g, and 2.85 nm, respectively. Isotherm studies divulged that the MB-TWAC adsorption system followed the Langmuir model with a maximum monolayer adsorption capacity of 567.52 mg/g. In terms of kinetic studies, this adsorption system fit pseudo-second order model the best whereas Boyd plot confirmed that the adsorption process was controlled by the film diffusion mechanism. Thermodynamic parameters of enthalpy change, ΔH°, entropy change, ΔS°, Gibbs free energy, ΔG° and Arrhenius activation energy, Ea were calculated to be −4.06 kJ/mol, 0.06 kJ/mol.K, –22.69 kJ/mol and 16.03 kJ/mol, respectively. The activation and microwave heating methods employed succeeded to produce TWAC with excellent adsorption performance in removing MB dye. TWAC was also successfully regenerated for 5 cycles via microwave heating technique.
Keywords
Activated carbon
Adsorption
Physicochemical activation
Microwave heating
Optimization
Methylene blue
Teak wood

1 Introduction
Over the recent years, the adsorption process has been showing a prominent role in removing pollutants by using activated carbon (AC) as an adsorbent. As compared to other methods, the adsorption process using AC is more desirable due to its simple operation, achieving high pollutant removal, flexibility in the process (batch or continuous), inert towards toxic substances, and regeneration of used AC is possible. But most importantly, AC is popular due to its versatility in adsorbing various types of contaminants ranging from dyes (Yusop et al., 2021a, Yusop et al., 2021b, Yusop et al., 2017), heavy metals (Peláez-Cid et al., 2020, Abbas, 2020, Yusop et al., 2022), phenolic compound (Zhang et al., 2021, Iheanacho et al., 2021), antibiotics (Yang et al., 2020, Wang et al., 2021), medicines (Conde-Rivera et al., 2021, Omorogie et al., 2021), hydrogen sulphide, H2S gas (Wang et al., 2020, Habeeb et al., 2020), carbon dioxide, CO2 gas (García-Díez et al., 2021, Serafin et al., 2021) and others. Researchers nowadays are actively utilizing agricultural wastes as AC’s precursors such as durian peel (Yusop et al., 2021a), acacia wood (Yusop et al., 2021b), pomegranate peel waste (Ahmad et al., 2021a), peanut shell (Ahmad et al., 2021b), glycidia sepium woodchip (Ahmad et al., 2020) and others. Therefore, in this study, teak wood (Tectona grandis Linn. F.), a waste from the furniture industry was chosen to be converted into AC by subjecting it to microwave-irradiation technique coupled with potassium hydroxide, KOH chemical treatment, and CO2 gasification. The teak tree is native to South Asia countries including Bangladesh, India, Indonesia, Malaysia, Myanmar, Thailand, and Sri Lanka, and according to (Veridiano et al., 2020), many tropical countries have begun to reinstate their deforested lands with teak tree since its wood is admired for its durability.
The growing number of synthetic dyes produced annually is a manifestation of the great demand for colour by the world’s society which led up to the expansion of the textile industry. Considered one of the most water-polluted industries, the textile industry is comprised of integrated activities of pre-treatment, spinning, polymerization, printing, texturizing, and dyeing processes (Yusop et al., 2021a). According to Yusop et al. (2021a), the dyeing operation yields a huge amount of wastewater that comes primarily from the wash water, followed by the spent dye bath. Not only in the textile industry but dyes are also utilized in papers, foods, magazines, leather, and cosmetics industries too (Mahapatra et al., 2021). Therefore, it was not surprising when the annual production of synthetic dyes had reached one million tons around the globe and in terms of the type of dyes, almost 10,000 dyes variations are found in the literature (Daoud et al., 2017). Even though synthetic dyes are contributing to the development of industries and the blooming of the economy, extensive use of synthetic dyes is jeopardizing the safety of the environment and ecosystem. Synthetic dyes can be classified into two groups: ionic dyes and non-ionic dyes. Ionic dyes can be further grouped into the cationic dye and anionic dye where these dyes dissolved in water and produce positive ions and negative ions, respectively. These ions are attracted toward the polar side of water molecules, making them more reluctant to be removed (Yusop et al., 2021b). Methylene blue (MB) dye which falls in the cationic group is one of the most utilized dyes in the textile industry. This dye is exceptionally stable towards degradation, chemically and biologically owing to the existence of the azo group in its molecular structure (Ahmad et al., 2021b). Because of that, once MB dye is escaped from industries and enters the environment, it can impart toxicity for a very long time. According to Moosavi et al. (2020), as high as 15% of dyes are lost in the environment. MB dye is known to be linked with health issues like enhancement of heart rate and leptomeninges inflammation in humans (Hassan et al., 2014). Due to these hazardous effects, it is important to develop an optimized AC from teak wood to treat MB dye wastewater. To the best of authors’ knowledge, this study is the first one to employ the microwave-irradiation technique to activate teak wood and convert it into teak wood-based AC (TWAC). Furthermore, optimum preparation conditions of TWAC were determined with the aid of response surface methodology (RSM). Besides being abundantly discarded and having good physical strength, producing TWAC, will solve the disposal problem of teak wood waste generated in furniture industries and add some value to this waste.
2 Materials and methods
2.1 Materials
Methylene blue, MB dye (C16H18ClN3S), in a powder form was obtained from Sigma-Aldrich (M) Sdn. Bhd., Malaysia. Potassium hydroxide, KOH in powder form was supplied by Riedel-el Haen, Germany, which was used as chemical activating agent during chemical activation step. Gases of nitrogen, N2 and carbon dioxide, CO2 which were utilized during carbonization and physical activation steps respectively, were provided by MOX Gases Berhad, Malaysia. The precursor used in this study, teak wood chip in the size between 5 and 10 mm was obtained from furniture factory located in Sungai Petani, Kedah, Malaysia.
2.1.1 Preparation of TWAC
Teak wood chip was cleaned properly using water and then, was let to dry in an oven for 72 h. Once dried, 50 g of teak wood chip was packed inside vertical tubular furnace. The furnace was heated for carbonization process to take place at 550 °C for 1 h, while N2 gas was allowed to purge through the furnace at the flow rate of 150 cm3/min, to create pyrolysis atmosphere. The resulted sample from carbonization process was called char. Char was then impregnated with KOH at different impregnation ratio (IR) of 0.00, 0.50, 1.25, 2.00 and 2.51 g/g, which determined as follows:
KOH was dissolved in 250 mL of deionized water in a beaker. The beaker was left in an oven overnight at the temperature of 110 °C to allow chemical activation and drying processes to occur. In the next step, an improvised microwave oven (EMM2001W, Sweden) was used to provide microwave radiation to the samples. Samples was radiated at various radiation power (144, 264, 440, 616 and 736 W) and various radiation time (2.60, 4.00, 6.00, 8.00 and 9.40 min). During the entire radiation process, CO2 gas at the flowrate of 150 cm3/min was let to purge through the microwave to provide physical activation effect on the sample. Once the radiation process was done, sample was unloaded from microwave oven and washed with hot deionized water several times to recover excess KOH. Then, 0.1 M HCl was used to wash the sample until the pH of washing solution becomes 7. In the final step, wet sample was dried in an over for 24 h at temperature of 110 °C. Dried sample which is known as TWAC was weighted to determine its yield, according to the following equation:
2.1.2 Characterization methods
TWAC was subjected to several characterization tests to determine its characteristics which include: the surface area of Brunauer-Emmet-Teller (BET), mesopores surface area, total pore volume, and average pore diameter of the sample by employing Micromeritics volumetric adsorption analyser (ASAP 2010), proximate analysis obtained from simultaneous thermal analyzer (Perkin Elmer STA 6000, USA), elemental analysis gathered from elemental analyzer (Perkin Elmer Series II 2400, USA), surface morphology and surface chemistry acquired from scanning electron microscopy (SEM) (LEO SUPRA 55VP, Germany) and Fourier transforms infrared spectroscopy (FTIR) (Shidmazu Prestige 21, Japan), respectively.
2.2 Experimental design
This study aimed to determine the optimum preparation conditions for producing TWAC. This task was aided by using a standard response surface methodology (RSM) design called central composite design (CCD). To analyze the experimental data, the software known as Design Expert (STAT-EASE Inc. Minneapolis, USA) version 6.0.6 was utilized. The variables chosen in this study were radiation power, radiation time, and IR, which were denoted as X1, X2, and X3, respectively, whereas the responses were set to be MB removal percentage and TWAC’s yield, which were denoted as Y1 and Y2, respectively. Table 1 shows the variables, variables’ experimental range, and levels together with responses. CCD had generated 20 experiments since 3 variables were studied. These experiments consisted of factorial points (8), axial points (6), and replicates (6). The corresponding model developed is a quadratic model, which is conveyed by the following equation:
Unit
Notation
Coded values
−1.682
−1
0
+ 1
+ 1.682
Variables
Radiation power
Watt (W)
X1
144.00
264.00
440.00
616.00
736.00
Radiation time
Minutes (min)
X2
2.60
4.00
6.00
8.00
9.40
IR
g/g
X3
0.00
0.50
1.25
2.00
2.51
Responses
MB dye removal
mg/g
Y1
–
AWAC’s yield
%
Y2
–
2.3 Equilibrium and isotherm study
An equilibrium study was conducted to evaluate the MB adsorption uptakes under the effects of (i) dissimilar MB dye initial concentration, (ii) dissimilar MB dye solution temperature, and (iii) dissimilar MB dye solution pH. To understand the effect of MB dye initial concentration, six MB dye solutions with a volume of 200 mL each, were prepared inside Erlenmeyer flasks at different concentrations of 25, 50, 100, 200, 250, and 300 mg/L. These Erlenmeyer flasks were organized inside a water bath shaker and 0.2 g of TWAC was added to each one of these flasks. The water bath shaker was switched on for 24 h with an agitation speed of 60 rpm, a temperature of 30 °C, and original pH condition. To evaluate the impact of solution temperature, adsorption experiments were carried out at three different solution temperatures of 30, 45, and 60 °C with no alteration on solution pH being made. On contrary, the impact of solution pH was verified by performing experiments at six different pH of 2, 4, 6, 8, 10, and 12 while the solution temperature remained constant at 30 °C. For both solution temperature and pH studies, other conditions such as solution concentration, solution volume, adsorbent weight, and agitation speed were fixed at 100 mg/L, 200 mL, 0.2 g, and 60 rpm, respectively. UV–Vis spectrophotometry (Agilent Cary 60, USA) was utilized to measure the concentration of MB dye solution at a wavelength of 668 nm. The following equations were used to determine MB adsorption uptakes and MB percentage removal, respectively:
In the isotherm study, the equilibrium data was applied to four models namely Langmuir, Freundlich, Temkin, and Koble-Corrigan (KC). A non-linear method was employed to solve isotherm models with the aid of Microsoft Excel Solver. The non-linearized formulas of these models are as follows, respectively:
Langmuir (Langmuir, 1918):
Freundlich (Freundlich, 1906):
Temkin (Tempkin and Pyzhev, 1940):
Koble-Corrigan (Koble and Corrigan, 1952):
2.4 Kinetic study
Unlike the isotherm study, the kinetic study was conducted by measuring MB’s concentration at a few points between 0 and 180 min. Six different concentrations of MB dye (25 to 300 mg/L) were utilized, and other adsorption conditions were fixed to be 0.2 g for TWAC’s dosage, 200 mL for solution volume, 30 °C for solution temperature, and 80 rpm for shaking speed of water bath shaker. The pH of the MB solution was not altered for this study. The kinetic data obtained were applied to kinetic models namely pseudo-first order (PFO), pseudo-second order (PSO), and Boyd plot. The kinetic models were solved using the linear method. These models in linearized form were described in formulas as follows:
Pseudo-first order (PFO) (Lagergren, 1898):
Pseudo-second order (PSO) (Ho and McKay, 1998):
Boyd plot (Islam et al., 2017):
2.5 Thermodynamic study
The affinity of adsorbate onto adsorbent is highly influenced by the temperature of the adsorption solution, thus the thermodynamic study was executed. Thermodynamic parameters of change of enthalpy and change of entropy which are denoted by ΔH° (kJ/mol) and ΔS° (kJ/mol.K), respectively, can be computed using Van’t Hoff equation as follows:
where R, T, and Kc refer to gas constant (8.314 J/mol.K), solution temperature (K), and dimensionless constant of equilibrium. According to Lima et al. (2019), the Kc value can be calculated using the following formula:
2.6 Regeneration study
The regeneration study was performed by subjecting saturated TWAC to microwave irradiation technique at optimum radiation power and radiation time, under the flow of CO2 gas, for gasification effect, at a flow rate of 150 cm3/min. This study was conducted by using MB solution with an initial concentration of 100 mg/L, solution volume of 200 mL, and the weight of the regenerated TWAC, TWACn of 0.2 g. The weight reduction of TWACn was calculated from the following formula:
3 Results and discussions
3.1 Optimization study
3.1.1 Regression model development
A complete design matrix for preparing TWAC is shown in Table 2. Both responses studied (MB dye removal and TWAC’s yield) were best fitted by the quadratic model, as suggested by the software. The highest values obtained were 95.11 mg/g and 53.52% whilst the lowest values obtained were 19.25 mg/g and 17.96% for MB removal response and TWAC’s yield responses, respectively. The relationship between variables and responses in terms of the empirical model (coded factors) is presented as follows:
Run
TWAC’s preparation variables
Responses
Radiation power, X1 (watt)
Radiation time, X2 (min)
IR, X3
MB removal, Y1 (mg/g)
TWAC’s yield, Y2 (%)
1
440 (0)
6 (0)
2.51 (+1.68)
63.58
17.96
2
440 (0)
6 (0)
0 (-1.68)
39.69
32.44
3
440 (0)
6 (0)
1.25 (0)
79.85
32.19
4
616 (+1)
8 (+1)
2 (+1)
83.51
23.54
5
440 (0)
6 (0)
1.25 (0)
82.96
33.75
6
440 (0)
6 (0)
1.25 (0)
73.88
30.85
7
264 (-1)
8 (+1)
0.5 (-1)
41.08
42.79
8
616 (+1)
4 (-1)
2 (+1)
79.85
26.11
9
616 (+1)
8 (+1)
0.5 (-1)
63.15
29.43
10
264 (-1)
4 (-1)
0.5 (-1)
30.25
48.22
11
440 (0)
9.36 (+1.68)
1.25 (0)
67.85
30.44
12
144 (-1.68)
6 (0)
1.25 (0)
19.25
53.52
13
440 (0)
2.64 (-1.68)
1.25 (0)
50.11
39.64
14
736 (+1.68)
6 (0)
1.25 (0)
95.11
23.33
15
440 (0)
6 (0)
1.25 (0)
85.14
33.11
16
440 (0)
6 (0)
1.25 (0)
75.48
35.26
17
616 (+1)
4 (-1)
0.5 (-1)
45.85
28.24
18
264 (-1)
4 (-1)
2 (+1)
37.58
41.55
19
264 (-1)
8 (+1)
2 (+1)
40.55
25.11
20
440 (0)
6 (0)
1.25 (0)
77.52
31.52
MB dye removal, Y1:
TWAC’s yield, Y2:
Fig. 1(a) and (b) provide the regression plots (predicted versus actual) for the responses of MB removal and TWAC’s yield, respectively. These plots were validated by four parameters namely R2, adjusted R2 (adj. R2), standard deviation (S.D.), and adequate precision (A.P.) The plots of Eq. (18) and (19) produced high R2 and adj. R2 values of (0.9686 and 0.9404) and (0.9696 and 0.9423), respectively, therefore assuring the quality of the models developed. Relatively low S.D. and relatively high A.P. of (5.31 and 16.69) and (2.09 and 22.10) for MB removal and TWAC’s yield responses, respectively, were obtained which reflected the data was lowlily dispersed from the mean value and the data formed an adequate signal which enabled the navigation of design space, respectively.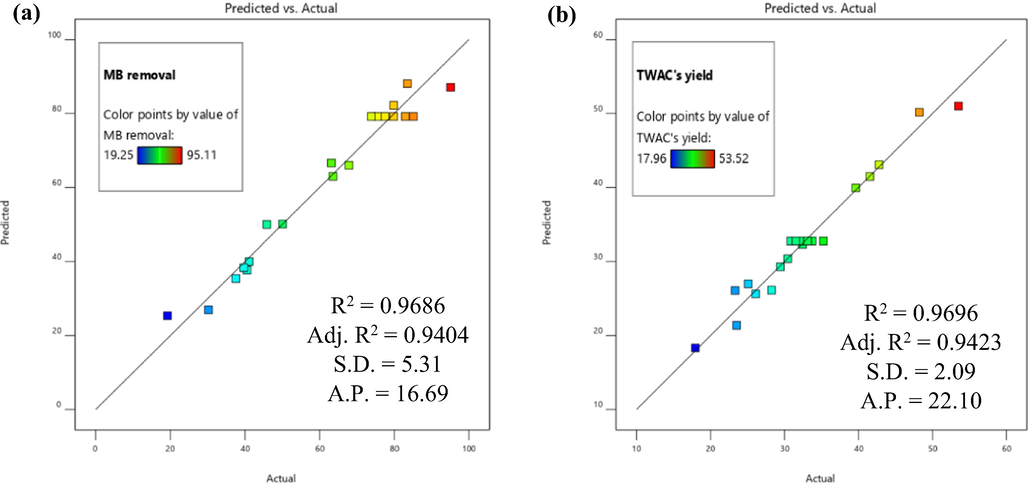
Regression plot of predicted versus actual for (a) MB removal and (b) TWAC’s yield responses.
Table 3 provides the optimum preparation conditions generated by the Design Expert software. In doing so, all variables and responses studied were set to be minimum and maximum, respectively. The desirability for this model was 0.597 which is considered acceptable. The optimum preparation conditions of TWAC were revealed to be 366 W, 5.30 min, and 1.15 g/g for radiation power, radiation time, and IR, respectively, which are associated with MB removal of 66.69 mg/g and TWAC’s yield of 38.23%. A low error percentage for both responses (<10%) signified that the models developed were competently accurate in predicting the experimental data.
Variables
Responses
MB removal, Y1 (mg/g)
TWAC’s yield, Y2 (%)
Radiation power, X1 (Watt)
Radiation time, X2 (min)
IR, X3 (g/g)
Predicted
Actual
Error
Predicted
Actual
Error
366
5.30
1.15
66.69
63.89
4.20
38.23
34.85
8.84
3.1.2 Analysis of variance (ANOVA)
Further analysis in understanding the models developed by RSM can be done by inspecting the analysis of variance (ANOVA). If the Prob > F value in ANOVA is below 0.05 and the F value is high, then the model term is significant towards the response and the data is not random (Liew et al., 2018). Table 4(a) and (b) show the ANOVA results for MB removal response and TWAC’s yield response, respectively, where their Prob > F values were revealed to be < 0.0001 and < 0.0001, respectively, hence assuring the significance of these models. In terms of the lack of fit test, both responses produced Prob > F values of 0.2357 and 0.1792, respectively, thus reflecting insignificant results. It is desired to have an insignificant result for the test of lack of fit as it signifies the notable effects of variables on the studied responses and the developed models described the experimental data competently (Melliti et al., 2021). Based on Table 4(a), radiation power (X1), radiation time (X2), IR (X3), the interaction between radiation power and impregnation ratio (X1X3), quadratic of radiation power (X12), quadratic of radiation time (X22) and quadratic of IR (X32) were the significant terms whilst other terms not stated were the insignificant terms for MB removal response. Among the three variables studied, X1 imposed the greatest effect on MB removal response, followed by X3 and X2 due to their high F values of 162.65, 27.04, and 10.82, respectively. Table 4(b) revealed that radiation power (X1), radiation time (X2), IR (X3), the interaction between radiation power and radiation time (X1X2), the interaction between radiation power and impregnation ratio (X1X3), the interaction between radiation time and impregnation ratio (X2X3), quadratic of radiation power (X12) and quadratic of IR (X32) were the significant terms whereas other terms not announced were insignificant for TWAC’s yield response. This response was majorly affected by X1, followed by X3 and X2 due to their high F-value of 171.18, 53.48, and 25.10, respectively.
Source
Sum of Squares
DF
Mean Square
F Value
Prob > F
Model
8716.92
9
968.55
34.29
< 0.0001
significant
X1
4594.09
1
4594.09
162.65
< 0.0001
X2
305.49
1
305.49
10.82
0.0082
X3
763.61
1
763.61
27.04
0.0004
X1X2
6.41
1
6.41
0.2269
0.6441
X1X3
282.74
1
282.74
10.01
0.0101
X2X3
57.78
1
57.78
2.05
0.1831
X12
949.38
1
949.38
33.61
0.0002
X32
807.12
1
807.12
28.58
0.0003
X32
1475.69
1
1475.69
52.25
< 0.0001
Residual
282.45
10
28.24
Lack of fit
187.66
5
37.53
1.98
0.2357
not significant
Pure error
94.78
5
18.96
Cor Total
8999.37
19
Source
Sum of Squares
DF
Mean Square
F Value
Prob > F
Model
1396.31
9
155.15
35.47
< 0.0001
significant
X1
748.78
1
748.78
171.18
< 0.0001
X2
109.80
1
109.80
25.10
0.0005
X3
233.92
1
233.92
53.48
< 0.0001
X1X2
52.48
1
52.48
12.00
0.0061
X1X3
33.33
1
33.33
7.62
0.0201
X2X3
27.27
1
27.27
6.23
0.0316
X12
60.43
1
60.43
13.82
0.0040
X32
10.44
1
10.44
2.39
0.1534
X32
99.28
1
99.28
22.70
0.0008
Residual
43.74
10
4.37
Lack of fit
30.88
5
6.18
2.40
0.1792
not significant
Pure error
12.86
5
2.57
Cor Total
1440.05
19
3.1.3 Three-dimensional (3D) plots
Investigating the effect of variables on responses studied can be done in a better way using three-dimensional (3D) plots. Since both responses were majorly influenced by radiation power, therefore Fig. 2(a) and (b) provide 3D plots for radiation power versus IR and radiation power versus radiation time, respectively for MB removal response whereas the same 3D plots for TWAC’s yield response are given in Fig. 3(a) and (b), respectively. Based on Fig. 2(a), the highest MB removal was achieved when radiation power and radiation time were at the highest value and vice versa. A similar trend was also observed in Fig. 2(b) where maximum MB removal occurred at the highest value of radiation power and IR, and vice versa. However, MB removal was noticed to drop more significantly at a lower value of IR (Fig. 2(b)) as compared to a lower value of radiation time (Fig. 2(a)). Hence, it verified the greater effect of IR on MB removal than radiation time as obtained in Section 3.1.2. At a higher radiation power, the more volatile matter was condensed from the sample, thus leaving the samples with vacant sites which eventually became pores. At higher IR value, mobile metallic potassium existed in a higher quantity and enabled to penetrate more space of samples, thus creating more pores. Increasing the radiation time allowed the pores formation process to be developed properly. Based on Fig. 3(a) and (b), TWAC’s yield was found to be at the highest point when radiation power together with radiation time and IR, respectively were at the lowest values. It was observed that TWAC’s yield decreased more significantly when IR decreased (Fig. 3(b)) as compared to when radiation time decreased (Fig. 3(a)). Hence, it verified the results obtained in Section 3.1.2. where IR imposed a greater effect on this response as compared to radiation time. At the lowest radiation power, the volatilization process occurred at minimal intensity, thus preserving more volatile matter inside the samples, hence causing the weight of the sample to be higher. At the lowest IR, penetration of samples’ surface was at minimum strength due to lack of mobile potassium ions, therefore the samples retained their weight. When radiation time was reduced, the pores formation process on samples was incomplete, thus producing samples with a higher yield.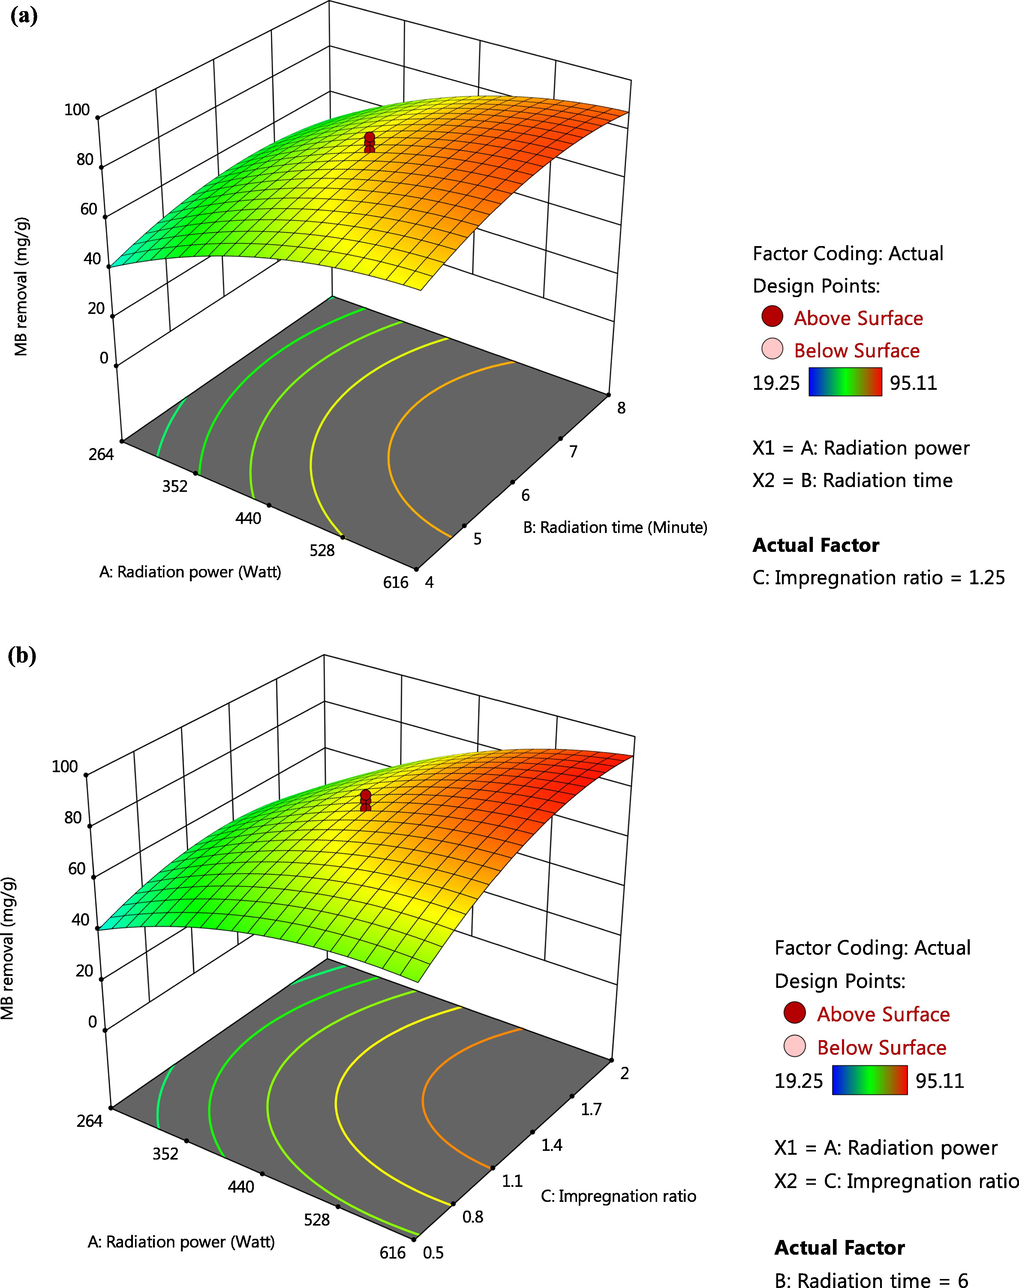
3D plots for MB removal response (a) radiation power versus radiation time and (b) radiation power versus IR.
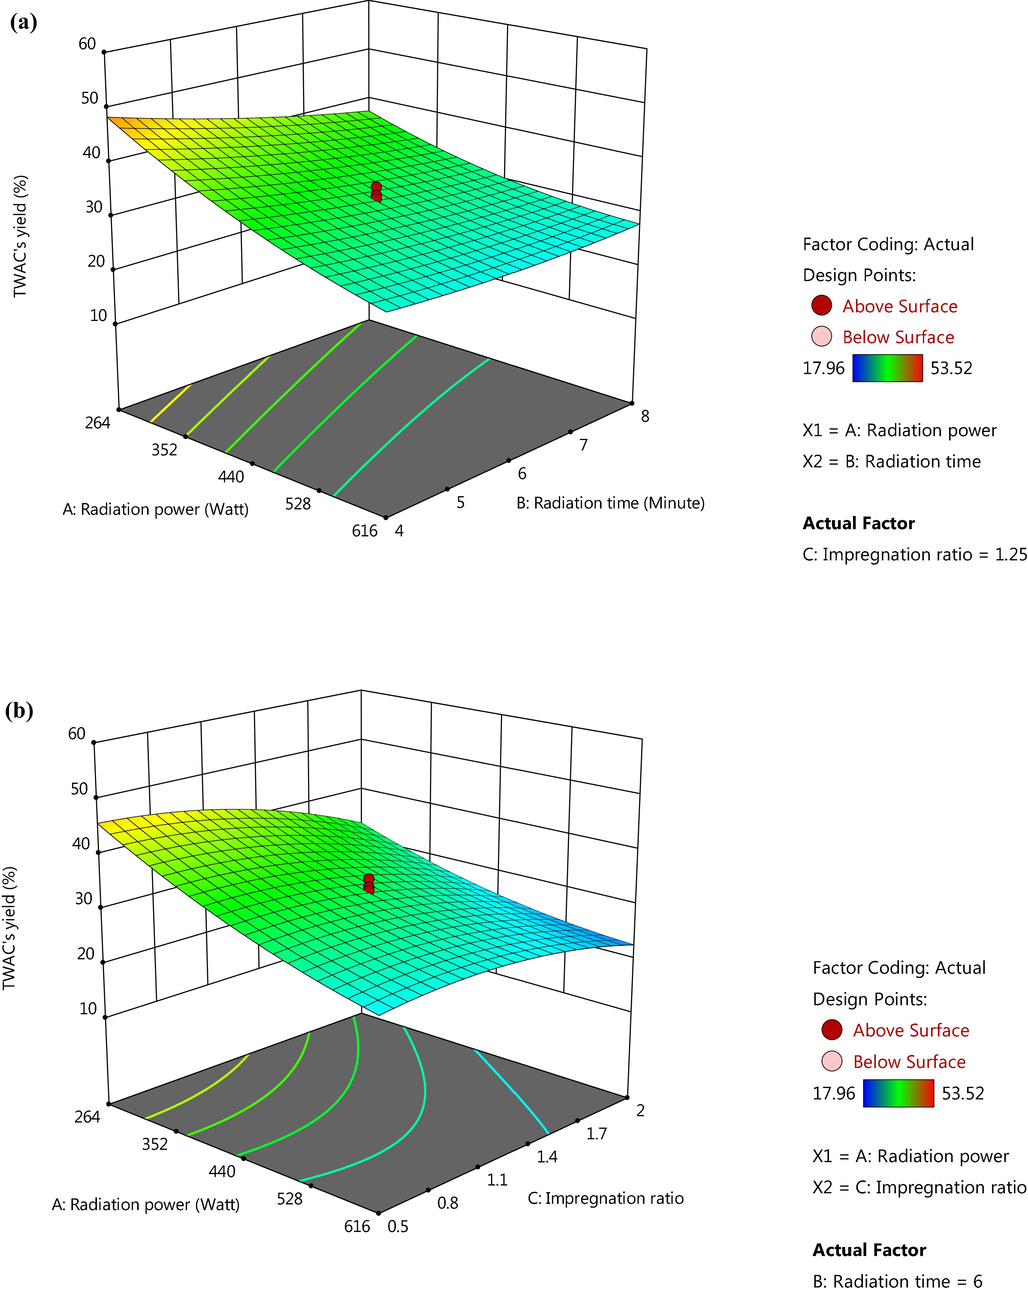
3D plots for TWAC’s yield response (a) radiation power versus radiation time and (b) radiation power versus IR.
3.2 Characteristics of samples
The values of surface area and pore characteristics of precursor, char, and TWAC are presented in Table 5. It was found that BET and mesopores surface area of TWAC were 1345.25 and 878.63 m2/g, respectively. A study conducted by Yusop et al. (2021b) was noticed to produce acacia wood-based AC, AWAC via KOH/CO2 activation and the resulted AWAC posed lower BET and mesopores surface area of 1045.56 and 689.77 m2/g, respectively. This was caused by the fact that TWAC was produced at higher radiation power, radiation time, and IR of 366 W, 5.30 min, and 1.15, respectively, as compared to AWAC’s preparation conditions of 360 W, 4.50 min, and 0.90 g/g, respectively. Besides these preparation conditions, the type of heating process involved in the AC’s production also plays an important role in the pores’ development. For instance, lower BET and mesopores surface area for durian peel-based AC (DPAC) of 886.31 and 547.85 m2/g, respectively, were obtained, due to the heat treatment of using a conventional furnace, despite the same KOH/CO2 activation being applied (Yusop et al., 2021a). Conventional heating took a longer time to heat the sample, thus the pores development is formed primarily on the outer layer of the samples first. On contrary, microwave energy can be absorbed by the volatile matter inside the samples at every layer simultaneously, thus promoting a more uniform and effective volatilization process, which makes way for higher surface area formation. The total pore volume of TWAC was 0.61 cm3/g and the average pore diameter of TWAC were 2.85 nm which concluded that the pores in TWAC was in a mesopores region. AC with mesopores type of pores is the most suitable one to be used to treat pollutants in the water phase. This was supported by the fact that the accessibility of water pollutants in the micropores region of AC is greatly reduced due to the molecular sieve effect (Pelekani and Snoeyink, 2000, Bhatnagar and Sillanpää, 2017). On the other hand, the existence of macropores in AC reduced the contact points between the AC’s surface and adsorbate molecules (Newcombe et al., 1997, Li et al., 2002).
Sample
BET surface area (m2/g)
Mesopores surface area (m2/g)
Total pore volume (cm3/g)
Average pore diameter (nm)
precursor
1.33
–
0.0001
2.53
char
461.25
293.57
0.3880
2.64
TWAC
1345.25
878.63
0.6140
2.85
The precursor of teak wood was found to have a relatively high fixed carbon percentage of 31.22% as compared to other wood types of waste such as wood chips of 20.00% (Pedicini et al., 2020) and acacia wood of 24.75% (Yusop et al., 2021b). The higher the percentage of fixed carbon, the better the precursor is since the fixed carbon will make up the matrix skeleton of the AC. This value was observed to increase tremendously to 86.22% in TWAC whilst both moisture and volatile matter reduced significantly from 11.25 and 55.52% in the precursor to 4.34 and 7.71% in TWAC, respectively, which proved the effectiveness of microwave heating employed in this study. In terms of elemental analysis, TWAC posed 83.61% of C, 2.14% of H, 0.03% of S, and 14.22% of combination between N and O. Relatively high accumulated percentage of S, N, and O gave a good indication that TWAC’s surface was filled with a variety of functional groups.
SEM images for precursor, char, and TWAC are displayed in Fig. 4(a), (b), and (c) respectively. Based on Fig. 4(a), very minimal pores can be seen on the surface of the precursor, and after the carbonization process was performed, higher numbers of pores can be seen in Fig. 4(b) which resulted mostly from the evaporation of moisture. After KOH/CO2 activation coupled with microwave irradiation technique was executed, TWAC was noticed to form numerous pores scattered randomly on its surface as can be seen in Fig. 4(c). The formation of these pores in TWAC was contributed by: (i) the diminishing of cellulose and lignin compounds that absorb microwave energy effectively and got evaporated and (ii) penetration of mobile potassium ions deep into the skeleton matrix of TWAC.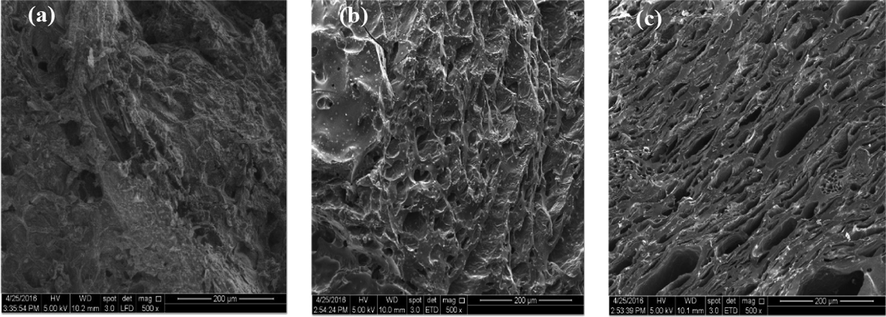
SEM images of (a) TW, (b) TW char and (c) TWAC (magnification of 500x).
Fig. 5 presents the FTIR spectrums for samples whilst Table 6 summarizes all peaks in samples. All samples of precursor, char, and TWAC were observed to pose similar functional groups of polysulfide, S-S stretch (500 cm−1), cyclohexane ring vibrations (1000 cm−1), and nonbonded hydroxy group, OH (3600, 3630 and 3640 cm−1, respectively). Other functional groups that existed in the precursor were secondary amine, CN stretch (1172 cm−1), carbonate ions (1477 cm−1), aldehyde (1732 cm−1), methoxy, O-CH3, C-H stretch (2850 cm−1) and methylene C-H asymmetric stretch (2927 cm−1). Some of these functional groups diminished by heat treatment during the carbonization process, thus cannot be detected in char’s FTIR spectrum whilst some of them were transformed into other functional groups. For instance, carbonate ions and nonbonded hydroxy group, OH in precursor were changed to alkyl carbonate (1743 cm−1) and hydroxy group, H-bonded OH stretch (3300 cm−1) in char, respectively. Several new functional groups were formed in char after the carbonization process took place such as aliphatic nitro compounds, C≡C terminal alkyne (monosubstituted), and C≡C medial alkyne (disubstituted) which can be found at the peaks of 1215 cm−1, 1986 cm−1, and 2190 cm−1, respectively. Both C≡C terminal alkyne (monosubstituted) and C≡C medial alkyne (disubstituted) were noticed to survive KOH/CO2 activation coupled with microwave heating, though their respective peaks were shifted a bit in TWAC’s FTIR spectrum to 2100 cm−1 and 2193 cm−1, respectively. However, aliphatic nitro compounds disappeared in TWAC and a new functional group of phenol, C-O stretch was manifested at a peak of 1215 cm−1. Adsorption of MB onto TWAC was aided by the dipole–dipole interaction between polar functional groups (phenol and hydroxy group) and MB molecules. The potential mechanisms of MB interactions with functional groups in TWAC’s surface is given in Fig. 6.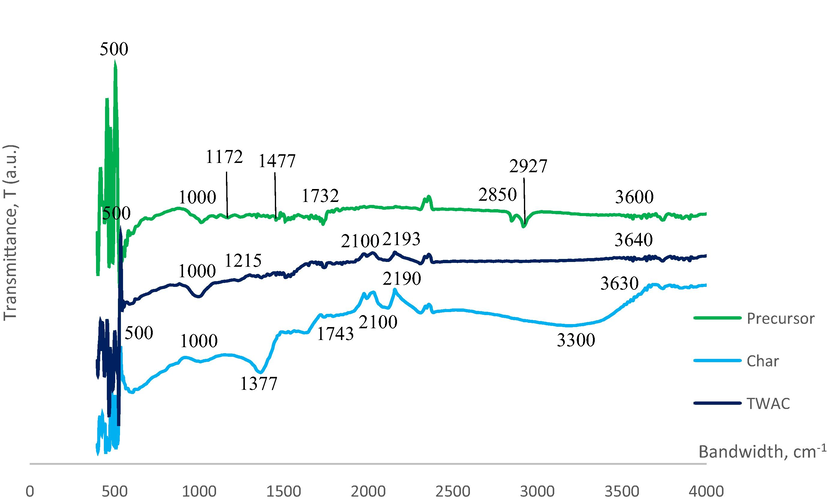
FTIR spectrums for (a) precursor, (b) char and (c) TWAC.
Precursor
Char
TWAC
Peaks (cm−1)
Functional groups
Peaks (cm−1)
Functional groups
Peaks (cm−1)
Functional groups
500
polysulfides (S-S stretch)
500
polysulfides (S-S stretch)
500
polysulfides (S-S stretch)
1000
Cyclohexane ring vibrations
1000
Cyclohexane ring vibrations
1000
Cyclohexane ring vibrations
1172
Secondary amine, CN stretch
1377
Aliphatic nitro compounds
1215
Phenol, C-O stretch
1477
Carbonate ions
1743
Alkyl carbonate
2100
C≡C Terminal alkyne (monosubstituted)
1732
Aldehyde
1986
C≡C Terminal alkyne (monosubstituted)
2193
C≡C Medial alkyne (disubstituted)
2850
Methoxy, O-CH3, C-H stretch
2190
C≡C Medial alkyne (disubstituted)
3640
Nonbonded hydroxy group, OH
2927
Methylene C-H asymmetric stretch
3300 (broad)
Hydroxy group, H-bonded OH stretch
3600
Nonbonded hydroxy group, OH
3630
Nonbonded hydroxy group, OH
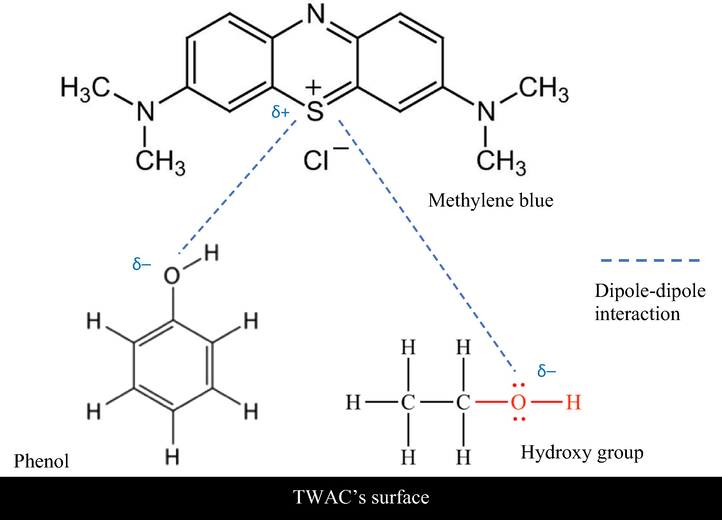
The potential mechanisms of MB interactions with functional groups in TWAC’s surface.
3.3 Adsorption equilibrium
3.3.1 Effect of contact time and different MB initial concentration
Fig. 7(a) and (b) provide the plots of MB adsorption uptakes and MB percentage removal by TWAC, respectively, versus adsorption time for six different initial concentrations. Based on Fig. 7(a), the adsorption capacity of MB was found to increase from 24.39 to 265.95 mg/g as the MB initial concentration increased from 25 to 300 mg/L. Such findings were supported by the fact that by increasing the initial concentration of adsorbate, the driving force of mass transfer becomes greater which enables them to triumph mass transfer resistance between adsorbate molecules in the solid phase and adsorbate molecules in the bulk phase (Yusop et al., 2021b). In terms of reaching an equilibrium state, lower initial concentrations of 25 and 50 mg/L achieved this state at a shorter time of 3 to 4 h whilst higher initial concentrations between 100 and 300 mg/L took longer hours to reach this state of 6 to 7 h. At higher initial concentration, the number of adsorption processes to take place was higher due to the existence of a higher number of adsorbate molecules, therefore longer hours were needed for the adsorption process to complete. Based on Fig. 7(b), MB percentage removal was noticed to drop from 97.55 to 88.65% as the MB initial concentration increased from 25 to 300 mg/L. At higher initial concentration, the ratio of MB molecules to available adsorption sites was high, so a bigger percentage of MB molecules was unable to be adsorbed, thus explaining the drop of MB percentage removal at higher initial concentration.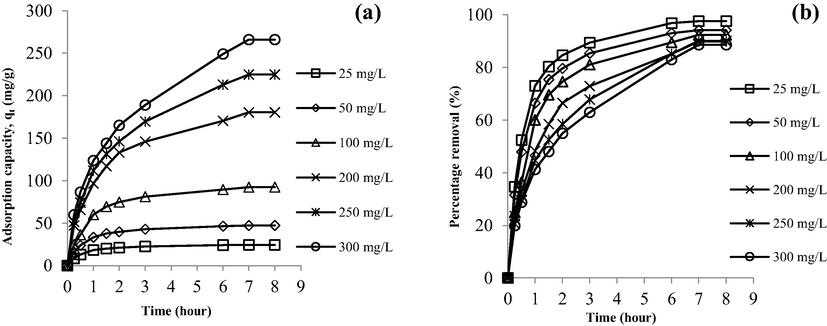
Plots of (a) adsorption capacity versus time and (b) percentage removal versus time for different initial concentrations.
3.3.2 Effect of solution pH
The plot of adsorption capacity versus different solution pH is given in Fig. 8. It was found that the lowest removal of MB dye occurred at pH 2 of 67.22 mg/g. At this acidic condition, MB solution was filled excessively with H+ ions that compete with cationic MB dye to be adsorbed by TWAC. Besides that, these H+ ions induced TWAC’s surface to be positively charged, therefore creating a repulsion force between TWAC’s surface and MB dye ions. As the solution pH increased to 4 and 6, the adsorption capacity of MB increased to 78.22 and 85.22 mg/g, respectively, due to the weakening effect of H+ ions in inducing the charge of TWAC’s surface to be positive. At alkaline pH of 8, MB adsorption capacity achieved 91.44 mg/g because, at this state, the solution was filled with extra OH– ions that induced the TWAC’s surface to be negatively charged, thus creating a pulling force towards MB ions. At pH 10, the adsorption capacity kept increasing to 98.20 mg/g since the OH–-induced effect on TWAC’s surface occurred at a higher intensity. By further increasing the solution pH to 12, an only small increment of 98.77 mg/g was noticed, which signified that the OH–-induced effect had reached its maximum potential.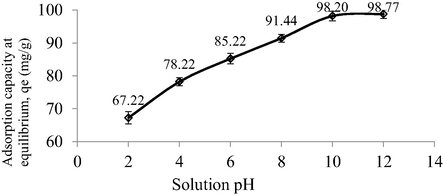
Plot of adsorption capacity at different solution pH.
3.4 Adsorption isotherm
The plots of isotherm models and the isotherm parameters obtained are provided in Fig. 9 and Table 7, respectively. In this study, the parameters of isotherms were solved using a Microsoft Excel solver since the classic method of linearization generates propagated errors, thus causing inaccuracy in the estimation of isotherm’ parameters (Guo and Wang, 2019). All four isotherm models utilized in this study produced high R2 values (>0.99). However, MB adsorption onto TWAC can be concluded to follow Freundlich isotherm the best due to the low RMSE value produced of 4.80. Therefore, it signified that multilayer coverage of MB occurred onto the heterogeneous surface of TWAC. The value of nF was 1.44 which indicated a good adsorption process since its value is between 1 and 10 (McKay et al., 1980, Isiuku et al., 2021). Furthermore, the value of the 1/nF was 0.69 which signified that TWAC was a good adsorbent since 1/nF value is between 0.2 and 0.8 (Sathasivam and Mas Haris, 2010). Besides that, as the 1/nF value approaches 0, the more heterogeneous the adsorbent is (Sulaymon et al., 2012). The Langmuir monolayer adsorption capacity, Qm was found to be 567.52 mg/g and this value is relatively higher as compared to MB removal by various adsorbents such as peanut shell-based AC (555.60 mg/g) (Ahmad et al., 2021b), acacia wood-based AC (338.29 mg/g) (Yusop et al., 2021b) and biomass sludge-based adsorbent (45.68 mg/g) (Ahmad et al., 2021c). According to (Isiuku and Nwabueze, 2019), an adsorption process would be governed by physisorption if BT is below 8 kJ and chemisorption if BT is above 8 kJ. Therefore, the MB-TWAC adsorption system was controlled by chemisorption due to a high BT value of 59.71. However, this result is not credible since the Temkin isotherm did not fit the adsorption data with good accuracy due to the high RMSE value of 32.94. Therefore, the thermodynamic study was conducted in section 3.5 to conclude this matter.
Plot of isotherm models for MB-TWAC adsorption system at 30 °C.
Isotherms
Parameters
Langmuir
Qm (mg/g)
567.52
KL (L/mg)
0.025
R2
0.9994
RMSE
8.41
Freundlich
nF
1/nF
1.44
0.69
KF (mg/g)(L/mg)1/n
23.27
R2
0.9982
RMSE
4.80
Temkin
BT (kJ)
59.71
AT (L/mg)
1.31
R2
0.9913
RMSE
32.94
Koble-Corrigan
AKC
42.41
BKC
0.09
nKC
R2
0.69
0.9989
RMSE
22.06
3.5 Adsorption kinetic
Fig. 10(a) and (b) present the kinetic plots of PFO and PSO, respectively, whilst the kinetic parameters are summarized in Table 8. It was revealed that the adsorption process of MB onto TWAC was kinetically best described by PSO due to high R2 values (>0.9927) for all six different initial concentrations studied and relatively low RMSE of 13.26, which signified that there is a possibility that chemisorption is the major force involves in this adsorption process. However, as mentioned in the previous section, confirmation of this matter can only be done by executing the thermodynamic study which is provided in the next section. Chemisorption involved the ionic or covalent bonding between MB ions with functional groups that existed on TWAC’s surface as disclosed in section 3.2. In terms of rate constant for PSO, k2, this value was noticed to reduce from 0.001350 to 0.000080 g/mg h as the initial concentration increased from 25 to 300 mg/L. At low initial concentration, a smaller number of MB ions were available in the solution which led to less competition for the adsorption process to occur. Therefore, the adsorption process can proceed at a faster time, yielding a higher reaction rate and vice versa. Further investigation was made by constructing the Boyd plot as provided in Fig. 11. It was found that all lines did not pass through the origin point, hence implying that the film diffusion mechanism was the rate-limiting step in the adsorption process.
Kinetic plots of (a) PFO and (b) PSO for MB-TWAC adsorption system at 30 °C.
Parameters
MB dye initial concentrations
25
50
100
200
250
300
qe, exp (mg/g)
24.39
47.11
92.35
180.22
224.75
265.95
Pseudo-first order (PFO)
k1 (1/h)
0.0123
0.0118
0.0110
0.0084
0.0069
0.0059
qe, cal (mg/g)
15.37
31.73
70.88
142.64
181.51
213.11
R2
0.9498
0.9655
0.9959
0.9803
0.987
0.9853
RMSE
33.80
Pseudo-second order (PSO)
k2 (g/mg h)
0.001350
0.000610
0.000200
0.000100
0.000083
0.000080
qe, cal (mg/g)
26.11
50.51
104.17
188.68
217.39
238.10
R2
0.9991
0.9997
0.9949
0.9947
0.9947
0.9927
RMSE
13.26
Boyd plot for MB-TWAC adsorption system at 30 °C.
3.6 Adsorption thermodynamic
The plot of adsorption capacity under different solution temperature and thermodynamic parameters are presented in Fig. 12 and Table 9, respectively. Fig. 12 revealed that the adsorption capacity of MB decreased from 92.35 to 85.41 mg/g as solution temperature increased from 30 to 60 °C. The favourability of MB adsorption at lower solution temperature signalled an exothermic type of process. This was in agreement with the negative value obtained for ΔH° of −4.06 kJ/mol. The exothermic nature of the adsorption process occurred because MB molecules gained more kinetic energy at higher solution temperature, thus enabling them to escape from the solid phase into the bulk phase, thus, enhancing the desorption process. The neegative value of ΔG° (–22.69 kJ/mol) and the positive value of ΔS° (0.06 kJ/mol.K) signified that the adsorption process was naturally spontaneous and the randomness degree rise higher at the liquid–solid interface, respectively. Last but not least, the Ea value was found to be 16.03 kJ/mol which implied the adsorption process of MB onto TWAC was indeed controlled by physisorption (Preeti et al., 2021).
Plot of adsorption capacity versus different solution temperature.
Parameters
Values
ΔH° (kJ/mol)
−4.06
ΔS° (kJ/mol K)
0.06
ΔG° (kJ/mol)
–22.69
Ea (kJ/mol)
16.03
3.7 Regeneration study
A regeneration study is vital to explore the potential of AC to promote sustainability and save resources. Fig. 13 shows the regeneration plot for the MB-TWAC adsorption system. It was revealed that after 5 regeneration cycles, TWAC’s yield dropped from 100 to 27.14% whilst MB adsorption uptakes decreased from 92.32 to 11.87 mg/g. Microwave heating employed during each regeneration cycle caused the volatile matter to escape from TWACn, thus explaining the reduction in its yield. Besides that, microwave heating also caused the pores structure inside TWACn to be destroyed, hence reducing its adsorption capacity.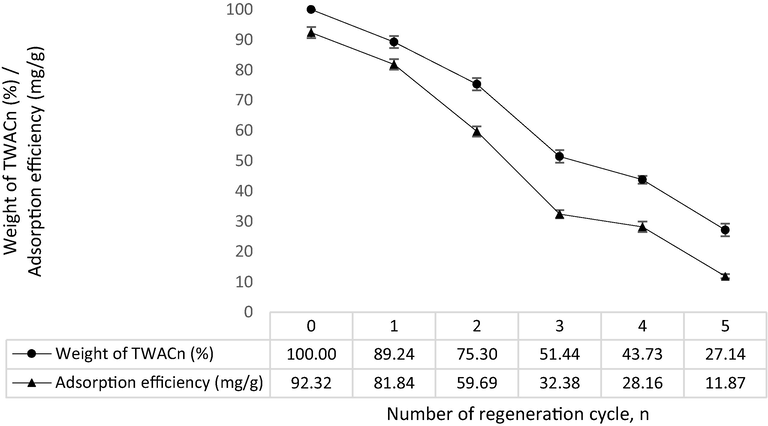
Regeneration plot for MB-TWACn system.
4 Conclusion
TWAC derived from teak wood waste was efficient in removing MB dye with maximum monolayer adsorption capacity, Qm of 567.52 mg/g. KOH/CO2 activation coupled with microwave heating was responsible for creating TWAC with mesopores surface area of 878.63 m2/g and average pore diameter of 2.85 nm which implied mesopores type of porosity. TWAC’s surface was filled with functional groups of polysulfides (S-S stretch), cyclohexane ring vibrations, phenol, C-O stretch, C≡C terminal alkyne (monosubstituted), C≡C medial alkyne (disubstituted) and nonbonded hydroxy group, OH. RSM produced the quadratic type of models for both responses of MB removal and TWAC’s yield with high R2 values and low SD values of (0.9686 and 5.31) and (0.9696 and 2.09), respectively. Optimum preparation conditions were computed to be 366 W for radiation power, 5.30 min for radiation time and 1.15 g/g for impregnation ratio which corresponds to MB removal and TWAC’s yield of 66.69 mg/g and 38.23%, respectively. When the initial concentration of MB increased from 25 to 300 mg/L, adsorption capacity and percentage removal were observed to increase from 24.39 to 265.95 mg/g and to decrease from 97.55 to 88.65%, respectively. In terms of pH effect, the highest removal of MB occurred at pH 12 of 98.77 mg/g. Adsorption data were found to fit the Freundlich model and PSO model for isotherm and kinetic study, respectively. Boyd plot disclosed that the slowest step in the adsorption process was contributed by the film diffusion mechanism. Thermodynamic parameters of ΔH°, ΔS°, ΔG°, and Ea were determined to be −4.06 kJ/mol, 0.06 kJ/mol.K, –22.69 kJ/mol, and 16.03 kJ/mol which signified the adsorption process to be exothermic, increased randomness at the solid-liquid interface, spontaneous and governed by physisorption, respectively. A regeneration study revealed that TWAC’s yield, and MB adsorption uptakes dropped from 100 to 27.14% and from 92.32 to 11.87 mg/g, respectively, after 5 regeneration cycles.
Acknowledgments
This research is supported by Ministry of Higher Education Malaysia under the Fundamental Research Grant Scheme (project code: FRGS/1/2021/TK0/USM/01/3).
Declaration of Competing Interest
The authors declare that they have no known competing financial interests or personal relationships that could have appeared to influence the work reported in this paper.
References
- ABBAS, M. 2020. Modeling of adsorption isotherms of heavy metals onto Apricot stone activated carbon: Two-parameter models and equations allowing determination of thermodynamic parameters. Materials Today: Proceedings.
- Adsorption of basic green 4 onto gasified Glyricidia sepium woodchip based activated carbon: Optimization, characterization, batch and column study. Arabian J. Chem.. 2020;13:6887-6903.
- [Google Scholar]
- Optimization and batch studies on adsorption of Methylene blue dye using pomegranate fruit peel based adsorbent. Chem. Data Collections 2021:100676.
- [Google Scholar]
- AHMAD, M. A., MOHAMAD YUSOP, M. F., ZAKARIA, R., KARIM, J., YAHAYA, N. K. E. M., MOHAMED YUSOFF, M. A., HASHIM, N. H. F. & ABDULLAH, N. S. 2021b. Adsorption of methylene blue from aqueous solution by peanut shell based activated carbon. Materials Today: Proceedings, 47, 1246-1251.
- Carbonization of sludge biomass of water treatment plant using continuous screw type conveyer pyrolyzer for methylene blue removal. IOP Conf. Series: Earth Environ. Sci.. 2021;765:012112
- [Google Scholar]
- Removal of natural organic matter (NOM) and its constituents from water by adsorption – a review. Chemosphere. 2017;166:497-510.
- [Google Scholar]
- TiO2 supported on activated carbon from tire waste for ibuprofen removal. Mater. Lett.. 2021;291:129590
- [Google Scholar]
- Removal of reactive dye (BEZAKTIV Red S-MAX) from aqueous solution by adsorption onto activated carbons prepared from date palm rachis and jujube stones. J. Mol. Liq.. 2017;243:799-809.
- [Google Scholar]
- CO2 capture by novel hierarchical activated ordered micro-mesoporous carbons derived from low value coal tar products. Micropor. Mesopor. Mater.. 2021;318:110986
- [Google Scholar]
- Comparison of linearization methods for modeling the Langmuir adsorption isotherm. J. Mol. Liq.. 2019;296:111850
- [Google Scholar]
- Characterization of agriculture wastes based activated carbon for removal of hydrogen sulfide from petroleum refinery waste water. Mater. Today:. Proc.. 2020;20:588-594.
- [Google Scholar]
- Comparative study of calcium alginate, activated carbon, and their composite beads on methylene blue adsorption. Carbohydr. Polym.. 2014;102:192-198.
- [Google Scholar]
- Packed bed column adsorption of phenol onto corn cob activated carbon: linear and nonlinear kinetics modeling. S. Afr. J. Chem. Eng.. 2021;36:80-93.
- [Google Scholar]
- Aqueous phase adsorption of metanil yellow on phosphoric acid-activated carbon prepared from GMELINA ARBOREA bark. J. Chem. Soc. Nigeria. 2019;44
- [Google Scholar]
- Batch adsorption isotherm models applied in single and multicomponent adsorption systems – a review. J. Dispers. Sci. Technol.. 2021;42:1879-1897.
- [Google Scholar]
- Nanoporous activated carbon prepared from karanj (Pongamia pinnata) fruit hulls for methylene blue adsorption. J. Taiwan Inst. Chem. Eng.. 2017;74:96-104.
- [Google Scholar]
- About the theory of so-called adsorption of soluble substances. Sven. Vetenskapsakad. Handingarl. 1898;24:1-39.
- [Google Scholar]
- LANGMUIR, I. 1918. THE ADSORPTION OF GASES ON PLANE SURFACES OF GLASS, MICA AND PLATINUM. Journal of the American Chemical Society, 40, 1361-1403.
- Effects of activated carbon surface chemistry and pore structure on the adsorption of organic contaminants from aqueous solution. Carbon. 2002;40:2085-2100.
- [Google Scholar]
- Microwave pyrolysis with KOH/NaOH mixture activation: A new approach to produce micro-mesoporous activated carbon for textile dye adsorption. Bioresour. Technol.. 2018;266:1-10.
- [Google Scholar]
- A critical review of the estimation of the thermodynamic parameters on adsorption equilibria. Wrong use of equilibrium constant in the Van't Hoof equation for calculation of thermodynamic parameters of adsorption. J. Mol. Liq.. 2019;273:425-434.
- [Google Scholar]
- Adsorptive removal of hexavalent chromium and methylene blue from simulated solution by activated carbon synthesized from natural rubber industry biosludge. Environ. Technol. Innovation 2021101427
- [Google Scholar]
- Mesoporous and high-surface-area activated carbon from defatted olive cake by-products of olive mills for the adsorption kinetics and isotherm of methylene blue and acid blue 29. J. Environ. Chem. Eng.. 2020;8:104199
- [Google Scholar]
- The removal of colour from effluent using various adsorbents—III. silica: rate processes. Water Res.. 1980;14:15-20.
- [Google Scholar]
- Date palm fiber as a novel precursor for porous activated carbon: optimization, characterization and its application as Tylosin antibiotic scavenger from aqueous solution. Surf. Interfaces. 2021;24:101047
- [Google Scholar]
- MOOSAVI, S., LAI, C. W., GAN, S., ZAMIRI, G., AKBARZADEH PIVEHZHANI, O. & JOHAN, M. R. 2020. Application of Efficient Magnetic Particles and Activated Carbon for Dye Removal from Wastewater. ACS Omega, 5, 20684-20697.
- How to read and interpret FTIR spectroscope of organic material. Indonesian J. Sci. Technol.. 2019;4:97-118.
- [Google Scholar]
- Influence of characterised natural organic material on activated carbon adsorption: II. effect on pore volume distribution and adsorption of 2-methylisoborneol. Water Res.. 1997;31:1065-1073.
- [Google Scholar]
- Activated carbon from Nauclea diderrichii agricultural waste–a promising adsorbent for ibuprofen, methylene blue and CO2. Adv. Powder Technol.. 2021;32:866-874.
- [Google Scholar]
- Posidonia Oceanica and Wood chips activated carbon as interesting materials for hydrogen storage. Int. J. Hydrogen Energy. 2020;45:14038-14047.
- [Google Scholar]
- Synthesis of activated carbons from black sapote seeds, characterization and application in the elimination of heavy metals and textile dyes. Chin. J. Chem. Eng.. 2020;28:613-623.
- [Google Scholar]
- Competitive adsorption between atrazine and methylene blue on activated carbon: the importance of pore size distribution. Carbon. 2000;38:1423-1436.
- [Google Scholar]
- PREETI, BANERJEE, S., DEBNATH, A. & SINGH, V. 2021. Gum ghatti-alginate hybrid bead derived titania spheres for deep removal of toxic dye Remazol Brilliant Violet from aqueous solutions. Environmental Nanotechnology, Monitoring & Management, 15, 100459.
- SATHASIVAM, K. & MAS HARIS, M. R. H. 2010. Adsorption Kinetics and Capacity of Fatty Acid-Modified Banana Trunk Fibers for Oil in Water. Water, Air, & Soil Pollution, 213, 413-423.
- SERAFIN, J., OUZZINE, M., CRUZ JUNIOR, O. F. & SREŃSCEK-NAZZAL, J. 2021. Preparation of low-cost activated carbons from amazonian nutshells for CO2 storage. Biomass and Bioenergy, 144, 105925.
- Equilibrium and kinetics studies of adsorption of heavy metals onto activated carbon. Canad. J. Chem. Eng. Technol.. 2012;3:86.
- [Google Scholar]
- Kinetics of ammonia synthesis on promoted iron catalyst. Acta Physicochim. URSS. 1940;12:327.
- [Google Scholar]
- Towards forest landscape restoration programs in the philippines: evidence from logged forests and mixed-species plantations. Environments. 2020;7
- [Google Scholar]
- Preparation of activated carbon from peanut shell with KOH activation and its application for H2S adsorption in confined space. J. Environ. Chem. Eng.. 2020;8:103683
- [Google Scholar]
- Loofah activated carbon with hierarchical structures for high-efficiency adsorption of multi-level antibiotic pollutants. Appl. Surf. Sci.. 2021;550:149313
- [Google Scholar]
- High-yield and high-performance porous biochar produced from pyrolysis of peanut shell with low-dose ammonium polyphosphate for chloramphenicol adsorption. J. Clean. Prod.. 2020;264:121516
- [Google Scholar]
- Scavenging malachite green dye from aqueous solution using durian peel based activated carbon. Malays. J. Fund. Appl. Sci.. 2021;17:95-103.
- [Google Scholar]
- Adsorption of cationic methylene blue dye using microwave-assisted activated carbon derived from acacia wood: optimization and batch studies. Arabian J. Chem.. 2021;14:103122
- [Google Scholar]
- Scavenging remazol brilliant blue R dye using microwave-assisted activated carbon from acacia sawdust: equilibrium and kinetics studies. AIP Conf. Proc.. 2017;1892:1-8.
- [Google Scholar]
- YUSOP, M. F. M., MOHD JOHAN JAYA, E., MOHD DIN, A. T., BELLO, O. S. & AHMAD, M. A. 2022. Single-Stage Optimized Microwave-Induced Activated Carbon from Coconut Shell for Cadmium Adsorption. Chemical Engineering and Technology.
- Utilization of bark waste of Acacia mangium: the preparation of activated carbon and adsorption of phenolic wastewater. Ind. Crops Prod.. 2021;160:113157
- [Google Scholar]


