

Translate this page into:
Study on the synthesis and properties of an environmentally friendly water treatment agent
⁎Corresponding author.
-
Received: ,
Accepted: ,
This article was originally published by Elsevier and was migrated to Scientific Scholar after the change of Publisher.
Peer review under responsibility of King Saud University.
Abstract
An environment-friendly and effective polymer IA/SMAS was synthesized via a green method, the IA/SMAS as an effective scale inhibitor. In addition, explained its possible scale inhibition mechanism.

Abstract
The long-term application of phosphorus-containing or nitrogen-containing water treatment agents can easily lead to the eutrophication of water bodies. Here, a random copolymer IA/SMAS was synthesized by itaconic acid (IA) and sodium methacrylate sulfonate (SMAS) monomer by the aqueous polymerization method. The optimal synthesis conditions were as follows: a raw material mass ratio (IA:SMAS) of 2:1, a temperature of 95 °C and a reaction time of 6 h. In addition, ammonium persulfate and isopropanol were both added at 5 % of the total raw material mass. The copolymer IA/SMAS was characterized by infrared spectroscopy (IR), elemental analysis, nuclear magnetic resonance (NMR), field emission scanning electron microscopy (FESEM), and EDS. Its molecular weight and distribution were analyzed by gel chromatography (GPC). Static methods were used to evaluate copolymers and their performance in synergy with electrostatic fields. The scale inhibition mechanism of the copolymer and its synergistic effect with electrostatic field were also studied by a scanning electron microscope (SEM) and X-ray diffraction (XRD). The results show that the copolymer had excellent scale inhibition performance for calcium carbonate and good dispersion effect on iron oxide. The addition of the electrostatic field improved the scale inhibition performance of IA/SMAS copolymer by 16 %. Thus, the copolymer is a phosphorus-free and nitrogen-free water treatment agent that achieves excellent performance and can significantly disrupt the surface morphology and crystalline structures of crystals.
Keywords
IA
Copolymer
Scale inhibition
Dispersion
Biodegradability
Electrostatic interactions

1 Introduction
Water scarcity is a global problem (Aryal et al. 2022; El-Monaem et al. 2022.), and industrial water is a major contributor to water consumption (Zabihi et al. 2021; Omer et al. 2022.). Recycling industrial water is an important means of saving water, but the repeated use of circulating cooling water causes the scaling ions in the water to form scale on the heat exchanger and pipe walls in the form of precipitation, resulting in a decrease in the heat exchange efficiency of the equipment (Basha et al. 2022; Zareia et al. 2019.).Water treatment agents are currently added to alleviate the scaling of circulating water treatment systems (Zeng et al., 2015; Chen et al., 2018; Ji et al. 2017), as they offer certain advantages including simple operation (Jensen and Kelland, 2012; Klement and Bichs, 2013), excellent effectiveness, and low cost (Guo et al., 2020; Amjad and Koutsoukos, 2014). The most commonly used agents include inorganic salts, organic phosphine compounds, natural macromolecules, and synthetic macromolecules (Al-Roomi and Hussain, 2015; Liu et al., 2015.). Among these scale inhibitors, inorganic salts and organic phosphine compounds have limited applications because they can easily promote the growth of bacteria and algae in the system, which can cause water eutrophication and environmental damage (Wang et al., 2001; Vladimir et al., 2012; Wallace et al. 2013). Natural polymers are cheap and easy to obtain, but they have disadvantages; for example, they are needed in large amounts and are unstable at high temperatures in the process of application (Soltani et al., 2020; Dowlatshah et al., 2021). Thus, phosphorus-free synthetic macromolecule scale inhibitors have received extensive attention (Jimenez et al., 2015; Devatha et al., 2016; Nayunigari et al., 2016). These copolymers mostly contain carboxyl, hydroxyl, sulfonic acid, amino, and other anti-scaling functional groups(Upadhyay et al., 2015; Wang et al., 2016; Bilousova et al., 2020), and a combination of different groups that can effectively prevent the weak hydrophilic groups from forming insoluble calcium gels. This process can also help to dissolve calcium gels, to effectively prevent scaling (Suharso et al., 2017; Mady et al., 2018; Yadav et al., 2016). IA is an unsaturated dicarboxylic acid, which contains the carbon double bond functional groups required for free-radical polymerization, as well as carboxylic acid groups on both sides of the double bond. The latter endows IA copolymers with excellent negative dispersion properties and the ability to complex with other ions (Rafael et al., 2021; Cui and Zhang, 2019a, 2019b). Moreover, IA molecules do not contain phosphorus or nitrogen. As a result, they do not cause eutrophication of water bodies through enrichment, and are environmentally friendly. While polymers can be obtained from IA monomers through homopolymerization, and this particular polymer offers certain scale inhibition effects for calcium carbonate, its dispersion performance still needs to be improved (Gao et al., 2022.). Sulfonic acid groups are strong acid groups with strong hydrophilicity, and they can enhance the solubility of a copolymer, effectively preventing the weak acid group from generating insoluble calcium sol gels (Gao et al., 2017.). Electrostatic water treatment technology has additional advantageous characteristics including low energy consumption, near-zero pollution, and high efficiency, with excellent application prospects that urgently need to be researched and developed (Liu et al., 2009.).
In this study, SMAS, which contains sulfonic acid groups, was copolymerized with IA to obtain a scale inhibitor (IA/SMAS) with good scale inhibition and dispersion properties. The resulting product was free of phosphorus and nitrogen and environmentally friendly. The IA/SMAS polymers were characterized by various means. Afterward, the synergistic scale inhibition performance of the physical water treatment technology (electrostatic field water treatment technology) and the agent was also studied. Finally, this study also evaluated the IA/SMAS copolymer alone and its synergistic scale inhibition mechanism with electrostatic fields.
2 Experimental
2.1 Materials and instruments
IA and SMAS were produced by Shanghai Aladdin Biochemical Technology Co., ltd., and the purity was 99 %. Ammonium persulfate, potassium dihydrogen phosphate, and sodium bisulfite were purchased from Tianjin Fuchen Chemical Reagent Factory, with a purity of 99.5 %. Hydrogen peroxide (mass fraction 30 %) was purchased from Tianjin Yongda Chemical Reagent Co., ltd., and its purity was 99.5 %. Sodium bicarbonate and anhydrous calcium chloride were obtained from Tianjin Yongsheng Fine Chemical Co., ltd., with a purity of 99.5 %. Anhydrous ethanol and ferrous ammonium sulfate were purchased from Tianjin Zhiyuan Chemical Reagent Co., ltd., with a purity of not less than 99.7 %. Sodium hydroxide and sodium tetraborate were purchased from Chengdu Kelong Chemical Co., ltd., with a purity of 99.5 %.
The following instruments were used for experimentation: an SP100 Fourier transform infrared spectrometer (FTIR, Perkin Elmer, USA), a CAVANCE II nuclear magnetic resonance spectrometer (NMR, Bruker, Germany, 500 MHz), an Inspect S50 scanning electron microscope (SEM, American FEI Company), an Ultima IV X-ray diffractometer (XRD, Japan Rigaku Company), a Vario MICRO cube element analyzer (Elemental Analysis Systems Germany, Inc.), a TU-1900 type double-beam UV spectrophotometer (Beijing Purse General Instrument Co., ltd.), a Waters high-performance gel permeation chromatograph (GPC, Shanghai Waters Technology Co., ltd.), a TGA Q50 thermogravimetric analyzer (TA Instruments, USA), a ZEISS sigma500 field emission scanning electron microscope (FESEM, Germany), a Thermo SCIENTIFIC ESCALAB 250Xi X-ray photoelectron spectroscopy (XPS, USA), and an SH-type high-voltage electrostatic water processor (Jiangsu Nuclear Industry Green Water Treatment Co., ltd.).
2.2 Synthesis of IA/SMAS copolymer
About 60 g of IA, and either 60, 30, 20, 15, or 12 g of SMAS were added to deionized water, and then they were magnetically stirred at 95 °C until the solids were completely dissolved. After ammonium persulfate (2 %–10 % of the total mass of raw materials) and isopropyl alcohol (5 %–12.5 % of the total mass of raw materials) were added to the solution, two pumps were used to add sodium bisulfite solution and hydrogen peroxide to the system within 0.5 h. The solution was maintained at 95 °C for 6 h to sustain the polymerization reaction. Afterward, the solution was cooled to room temperature to obtain a transparent light yellow liquid, which was the aqueous solution of the IA/SMAS copolymer.
The polymer solution was washed repeatedly with absolute ethanol. After stirring and precipitation, a milky white precipitate was obtained on the bottom. The precipitate was removed and dried in a blast drying oven at 95 °C to obtain a solid milky-yellow product (purified IA/SMAS). The simplified polymerization scheme for the copolymer is shown below.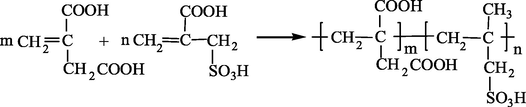
2.3 Characterization of the IA/SMAS copolymer
2.3.1 Infrared spectral characterization
The purified and dried product was characterized by FTIR at 500–4000 cm−1 to determine the functional group structures.
It had been expected that the characteristic absorption bands of the two monomers, such as –COOH, -SO3H, or others, and no -C⚌C-, would exist in the infrared spectrum, indicating that the two raw materials were fully polymerized.
2.3.2 NMR characterization
The 13C and 1H spectra of the polymer were obtained using NMR with D2O as the solvent.
2.3.3 Elemental analysis and characterization
The mass fractions of C, H, and S in the polymer were determined using an element analyzer.
2.3.4 Molecular weight characterization
GPC is a method of separating macromolecules by size using a solvent as a mobile phase through a column filled with microporous gel. It is mainly used for the detection of the molecular weight and molecular weight distribution of water-based and oil-based polymers.
In this study, the copolymer was tested by GPC, where 0.1 mol•L−1 of potassium nitrate solution was used as the mobile phase and polyethylene glycol was used as the standard to obtain the relative molecular mass size and distribution.
2.3.5 TGA characterization
Under nitrogen protection, the thermal stability of the IA, SMAS, and IA/SMAS was analyzed using a TGA as the temperature was increased at a heating rate of 5 °C • min−1, from room temperature to 600 °C.
The results of a TGA measurement were represented as a TGA curve of mass versus temperature or time. The TGA signal was the first derivative with respect to temperature or time, representing the rate of change of mass, called the DTG curve, which was an important complementary representation to the TGA signal.
2.3.6 FESEM and EDS characterization
The appearance, morphology, and elemental distribution of IA/SMAS were investigated using a FESEM with EDS.
2.3.7 XPS characterization
The bond formation mechanism and chemical bonds involved in IA/SMAS were explored by XPS.
2.4 Method for determining monomer conversion
The copolymer was obtained through the polymerization of two monomers, IA and SMAS, both of which contained double bonds. Monomer conversion was expressed in terms of double bonds, as the free monomers were based on acrylic acid. Thus, more double bonds indicated a lower conversion rate. The reaction principles are given by Eqs. (1)–(4):
Next, 1 g•mL−1 of NaOH solution (concentration of 100 g•L−1) was added to the purified polymer solid (2–5 g, accurately weighing 0.2 mg). Then, the distilled water was added to the solution for a total volume of 100 mL and the entire mixture was shaken.
Fifteen milliliters of bromine standard solution were added to a 500 mL iodine measuring flask, where the concentration of 1/6 KBrO3 was about 5.6 g • L−1. After adding 10 mL of copolymer solution, 5 mL of hydrochloric acid solution (1 + 1) was added immediately, and the bottle was quickly capped and sealed with water. Then the mixture was fully shaken and placed in the dark for 30 min. At the end of 30 min, 10 mL of potassium iodide solution (100 g•L−1) was immediately added and sealed with water before, being the mixture was placed in the dark for 10 min. Then, 150 mL of distilled water was added to the iodine measuring bottle, and the solution (0.1 mol•L−1) was titrated until it was light yellow using sodium thiosulfate standard solution. After adding starch solution as an indicator, the solution was titrated from a blue color until it was colorless. A blank comparison test was also conducted.
The free monomer content (as acrylic acid) was calculated according to Eq. (5):
2.5 Copolymer performance measurements
2.5.1 Evaluating scale inhibition performance on CaCO3
Experimentation was conducted following the Chinese national standard GB/T16632-2008 (Standardization administration, 2008). A certain amount of scale inhibitor was added to an conical flask with a capacity of 500 mL, which contained 500 mL of prepared water (Ca2+=600 mg/L, HCO3−=1200 mg•L−1, calculated as CaCO3). The resulting solution was placed in a water bath at 80 °C for 10 h, and then cooled to room temperature after removal. The Ca2+ concentration in the supernatant was titrated with EDTA solution to calculate the scale inhibition rate η1, according to:
2.5.2 Dispersion properties of IA/SMAS
Different concentrations of IA/SMAS along with 500 mL of prepared water (Ca2+=150 mg•L−1, calculated as CaCO3, Fe2+=10 mg•L−1) were added to a 500 mL flask and placed in a water bath at 50 °C for 5 h under strong stirring. The light transmission of the upper transparent layer was measured (cuvette 3 cm, wavelength 450 nm) after the solution was cooled to room temperature. The transmittance of distilled water was 100 %, therefore, the smaller the transmittance, the better the dispersion effect. All the experiments were conducted in three parallel groups to insure the accuracy of the results.
2.5.3 Biodegradability measurements
Inhibitor biodegradability was studied using a shaking-bottle incubating test. First, 500 mL of solution containing a certain amount of inhibitor and 0.5 mL of inoculum was added to a conical flask, and the flask mouth was sealed with a stopper. The conical flask was then placed into a shaking device at 20 °C, and the COD was obtained on days 1, 7, 14, 21, and 28. The biodegradation rate was calculated according to Eq. (8):
2.6 Characterization of CaCO3 scale samples
2.6.1 SEM analysis
SEM was used to characterize the dried calcium carbonate scale samples and observe the macroscopic morphology of the scale samples at 3000 times so as to study the effect of water treatment agents on CaCO3 crystals.
2.6.2 XRD analysis
The dried CaCO3 scale samples were characterized by XRD. The measurements were obtained using Cu Kα radiation at 40 mA and 40 kV, operating at a scan rate of 2° per minute with a range of 2θ from 20°–60°.
3 Results and discussion
3.1 Characterization of the IA/SMAS copolymer
3.1.1 FTIR analysis
Fig. 1 shows the IR spectra for IA, SMAS, and IA/SMAS copolymer. The absorption bands for -C⚌C- and –COOH were found in the spectrum of IA. Also, the absorption bands for -SO3H and -C⚌C- existed in SMAS. In the IA/SMAS copolymer, the broad absorption band at 3369 cm−1 was indicative of O—H stretching vibrations in –COOH, while the absorption bands for C⚌O in –COOH were located at 1714 cm−1 and 1638 cm−1, and the absorption band for C-OH in –COOH was located at 1260 cm−1. The simultaneous appearance of these absorption bands verified the contribution of IA to the reaction. The presence of symmetrical stretching vibration absorption bands for -SO3H at 1185 and 1043 cm−1 also indicated that SMAS contained -SO3H in the polymer. The characteristic absorption band for -C⚌C- at 1635–1620 cm−1 disappeared, also indicating that IA and SMAS were fully copolymerized (Kavitha et al., 2011; Balasubramanian et al., 2011; Schwetlick et al., 2010). The characteristic groups from IA and SMAS appeared in the FTIR spectrum of the copolymer, indicating that the copolymerization of IA and SMAS was successful.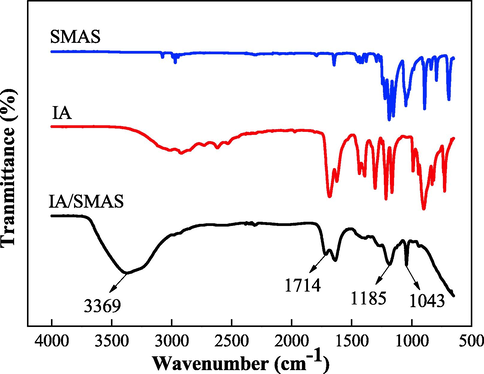
FTIR spectra of the samples.
3.1.2 NMR analysis
In the 1H spectrum (Fig. 2), the characteristic peak of the solvent was at a shift of 4.79. The two broad characteristic peaks appearing between 2 and 3 were b1 and b2 at the aggregation of H in –CH2-. Owing to the linkage to –COOH, the H in –CH2- appeared at a shift of 4.09, while the H at c, d was located at 1.2–1.4. In Fig. 3, the peak between 170 and 180 in the spectrum of 13C was the characteristic peak of –COOH, while the characteristic peak of C⚌C was not found between 110 and 130, indicating that IA and SMAS fully reacted.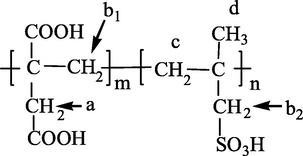
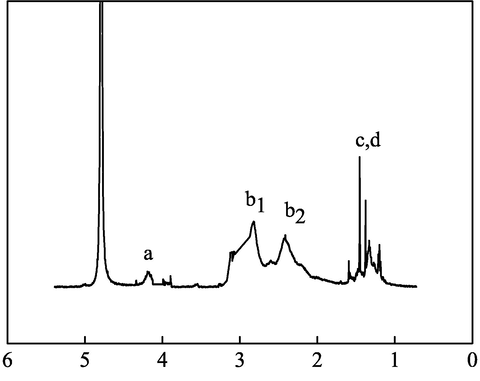
1H NMR spectrum of IA/SMAS.
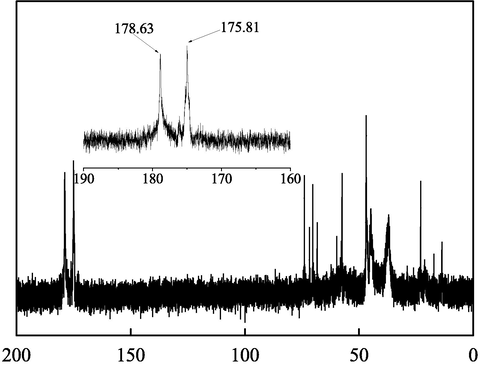
13C NMR spectrum of IA/SMAS.
3.1.3 Elemental analysis
Elemental mass fractions of C, H, and S in the polymer were determined using an elemental analyzer and the results were listed in Table 1.
Element
C
H
S
theoretical value
40.9
4.55
6.74
estimate value
40.9
4.43
6.69
As shown in Table 1, the analytical results of elements C, H, and S in the polymer IA/SMAS were in general agreement with the theoretical values, which further indicated that the synthesized product was the desired IA/SMAS copolymer.
3.1.4 GPC analysis
The copolymer was subjected to GPC analysis to determine the relative molecular mass of the polymer and its distribution, as shown in Fig. 2. The molecular weight of the IA/SMAS copolymer followed a normal narrow distribution. The values for Mn and MW were 1410 g•mol−1 and 1587 g•mol−1, respectively, resulting in a transition zone molecular weight polymer with the dispersity of Mw/Mn = 1.13, which was approximately equal to 1. This indicates that the IA/SMAS polymer had a narrow molecular weight distribution, and the polymer had better “purity”; that is, the chain length was more concentrated (Kavitha et al., 2011; Balasubramanian et al., 2011).
3.1.5 Thermal stability analysis
IA, SMAS, and IA/SMAS were characterized by TGA, and Fig. 5a, b, and c shows the heat loss curves. It can be seen from Fig. 5a that the weight of IA started to decrease sharply from 180 °C, and the final weight loss reached almost 100 % at 210 °C. As can be seen from Fig. 5b, the weight of SMAS began to drop sharply from 300 °C; that is, rapid decomposition occurred at this time, the decomposition rate reached the highest at 330 °C, and the final weight loss was about 50 %. Fig. 5c shows the heat loss curve. The weight loss between 0 and 100 °C was the result of moisture loss (Shen et al., 2017), at which time the copolymer did not undergo chemical changes, mainly about a 3 % water loss. Mass loss was greater between 100 and 400 °C, at about 15 %. At this stage, the copolymer underwent a cracking reaction owing to high temperature, resulting in the cleavage of chemical bonds in the copolymer and the decomposition of the carboxylic acid and sulfonic acid groups in the molecule, producing small molecular substances such as water, carbon dioxide, and sulfur dioxide (Cui and Zhang, 2019a, 2019b). The multiple peaks in the DTG curve indicated that decomposition of the IA/SMAS copolymer was a complex process (Schwetlick et al., 2010), with the maximum degradation rate occurring at 378.88 °C. This is attributed to the breakage of the main chain and the carbon–carbon single bond of the polymer at 378.88 °C. After 400 °C, the TG curve flattened out and the weight almost stopped changing. The final weight loss was approximately 20 %, indicating that the thermal stability of the IA/SMAS copolymer was far from two monomers, and the polymer had good temperature resistance and could be used in hot water circulation systems (Shi et al., 2017).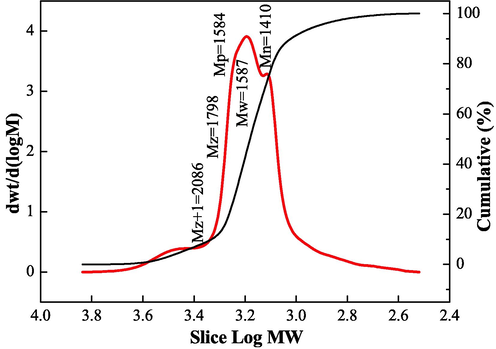
Relative molecular mass and distribution of the IA/SMAS polymer.
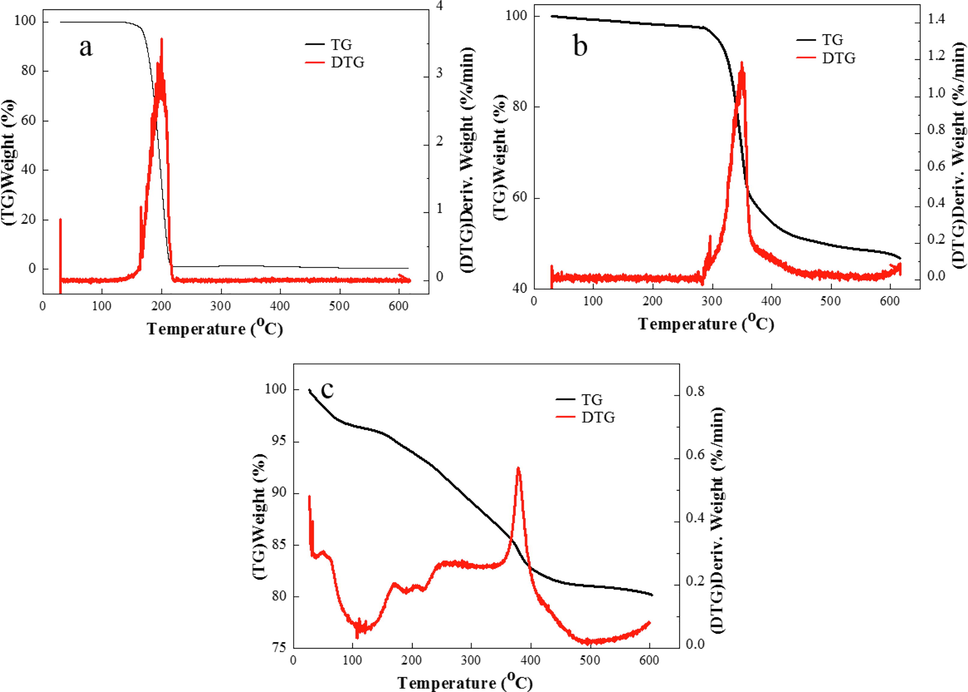
a) Thermal stability curve of IA, b) Thermal stability curve of SMAS, c) distribution of O in IA/SMAS, d) Thermal stability curve of IA/SMAS.
3.1.6 FESEM and EDS analysis
Fig. 6 shows the FESEM and EDS images of IA/SMAS. It can be seen from Fig. 6a that the polymer had a loose structure and many pores. This was conducive to its dissolution, making its molecules easy to combine with scale-forming ions in water so as to play a role in scale inhibition. Fig. 6b, c, d shows that the IA/SMAS polymer contains C, O, and S, elements and the three elements were uniformly distributed in the polymer.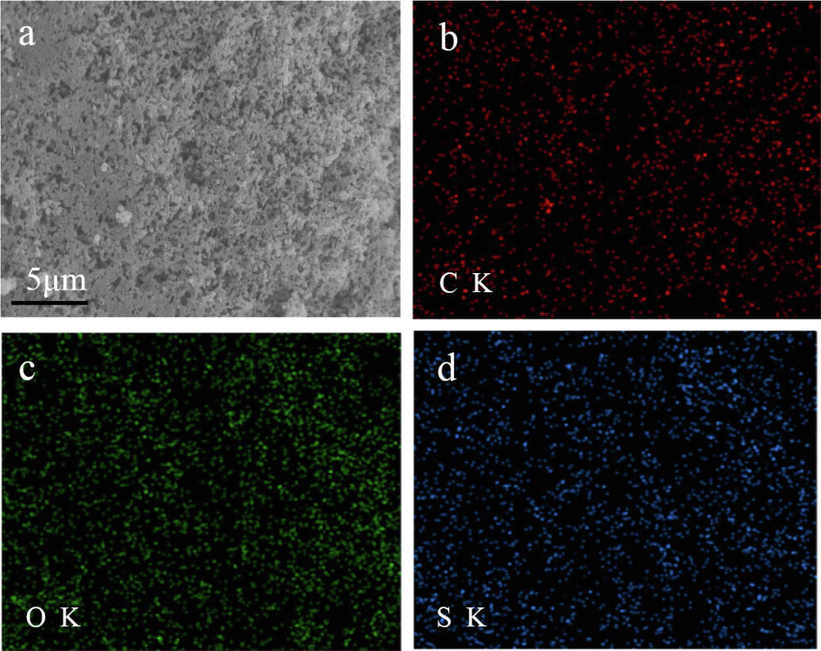
FESEM and EDS images of IA/SMAS: a) FESEM image of IA/SMAS, b) distribution of C in IA/SMAS, c) distribution of O in IA/SMAS, d) distribution of S in IA/SMAS.
3.1.7 XPS analysis
Fig. 7 shows the XPS survey of IA/SMAS. As shown in Fig. 7b, after the energy spectrum was divided, the three peak bands displayed by C1s were 284.75 eV, 285.7 eV, and 288.85 eV, respectively, and the corresponding three groups were C—C, HO-C⚌O, and C—S, respectively. Fig. 7c shows that the energy spectrum of O, that is, 531.9 eV, 533.2 eV, and 536.1 eV, represents groups C⚌O, C-OH, and S—O, respectively. The XPS spectrum of S is shown in Fig. 5d. The three peaks at 167.89 eV, 168.2 eV, and 169.37 eV were assigned to S—H, S—C, and S—O, respectively.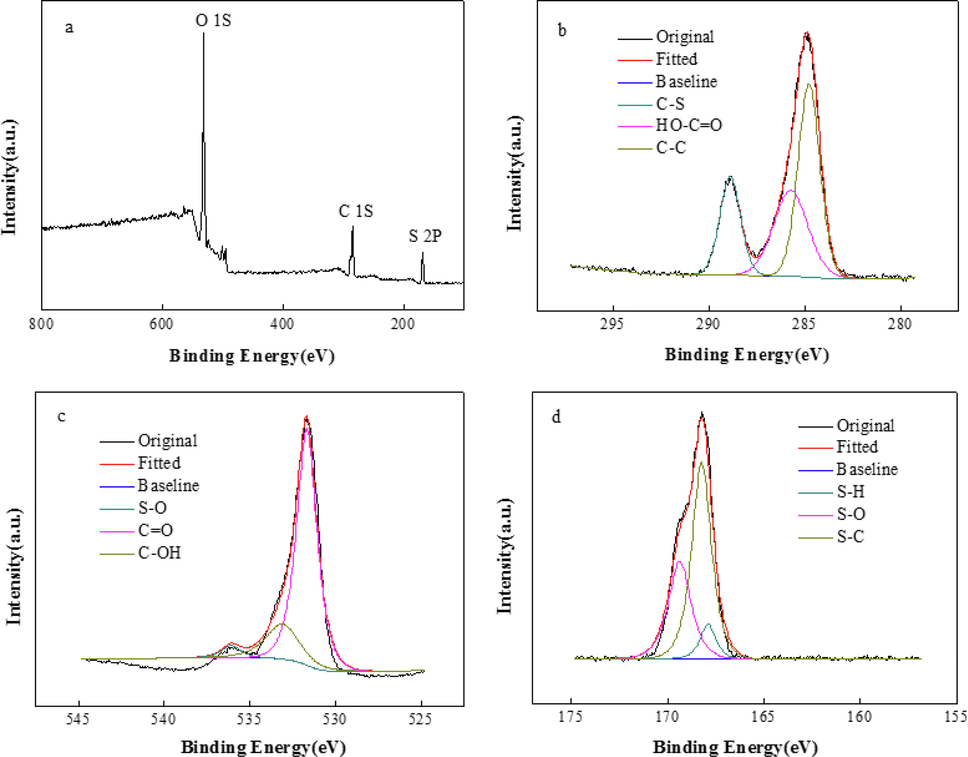
a) XPS survey of IA/SMAS, b) XPS high-resolution spectra of C 1 s, c) XPS high-resolution spectra of O 1 s, d) XPS high-resolution spectra of S 2p.
3.2 Optimization of synthesis conditions of IA/SMAS copolymer
3.2.1 Effect of the mass ratio
Fig. 8 and Fig. 9 show the relationship between the mass ratio (IA:SMAS) and the properties of IA/SMAS at a polymerization temperature of 95 °C, a polymerization time of 6 h, and an ammonium persulfate and isopropyl alcohol dosage (as a percentage of the total mass of the raw material) of 5 %. Polymer performance was subsequently investigated. According to the performance test results of the synthetic agents in each ratio, the product with the best scale inhibition effect was IA:SMAS = 2:1, and the dispersion performance of this product was second only to the polymer with IA:SMAS = 1:1. Therefore, combining scale inhibition and dispersion performance, IA:SMAS = 2:1 was selected as the ideal ratio. This was attributed to –COOH (provided by IA), which was the main group that affect scale inhibition (Mattila and Zevenhoven, 2014), and could chelate with Ca2+ in the aqueous solution, preventing Ca2+ from scaling. Strongly hydrophilic -SO3H (provided by SMAS) was the main group that played a role in dispersion, as it had a certain chelating ability with ferric ions. As the proportion of SMAS increased, the dispersion effect increased. Therefore, the optimal ratio was chosen to obtain the best scale inhibition and dispersion performance of the final polymerized product.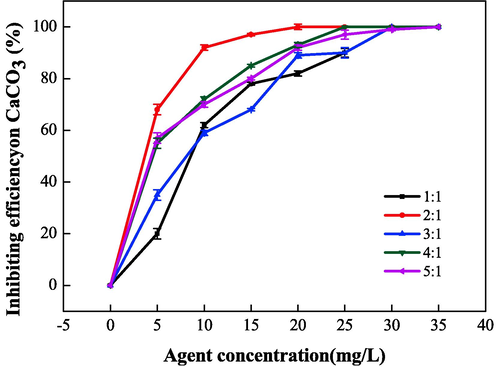
Effect of mass ratio (IA:SMAS) on the scale inhibition performance of CaCO3.
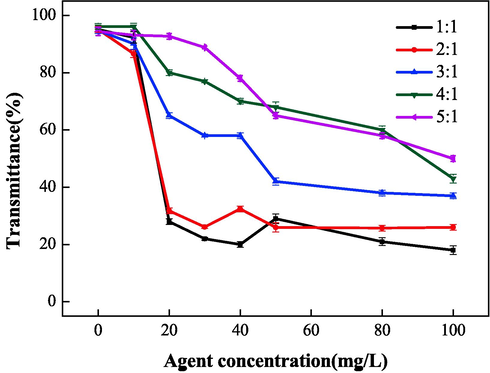
Effect of raw material mass ratio on dispersion performance.
3.2.2 Effect of polymerization time
The effects of polymerization time on scale inhibition and dispersion performance were systematically studied and were found to have a reaction temperature of 95 °C, a mass ratio (IA:SMAS) of 2:1, and ammonium persulfate and isopropyl alcohol content of 5 %. As shown in Fig. 10 and Fig. 11, with increasing polymerization time, the performance of IA/SMAS improved at 2 h, 4 h, and 6 h. After 6 h, with the extension of polymerization time, the scale inhibition on CaCO3 decreased, and the dispersion on Fe2O3 no longer improved. Therefore, we concluded that a polymerization time of 6 h was ideal, at which time the transmittance of the upper clear layer was only 26 %. In addition, the degree of raw material reaction was influenced by the polymerization time, and when the polymerization time was short, the material reaction was incomplete, and the monomer conversion rate was low. After calculation, the total conversion of IA and SMAS was determined to be 89.6 %, at a reaction time of 2 h. When the reaction time was extended to 4 h, the conversion was 93.3 %, while it reached 97.9 % at polymerization times of 6 h and 8 h, respectively. The above experimental results show that the polymer that obtained a reaction time of 6 h reflected a high degree of polymerization and the best performance. Finally, 6 h was selected as the optimal polymerization time.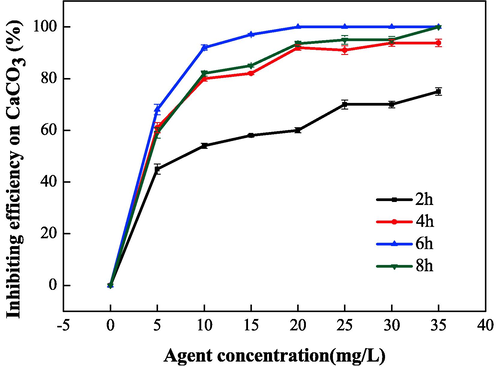
Effect of polymerization time on the scale inhibition performance of CaCO3.
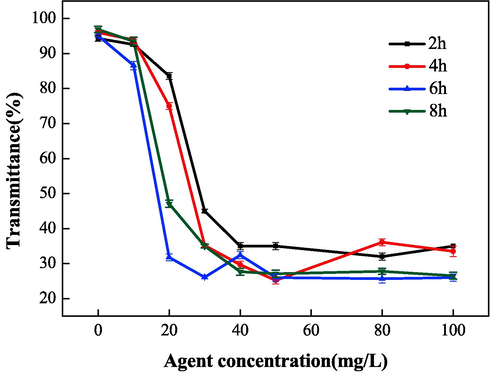
Effect of polymerization time on dispersion performance.
3.2.3 Effect of initiator dosage
Initiator dosage (ammonium persulfate) would significantly affect polymer properties (Cui and Zhang, 2019a, 2019b), therefore, experiments with different initiator dosage were performed. As shown in Fig. 12 and Fig. 13, the polymerization product had the best scale inhibition effects when the initiator addition amount was 5 % of the total raw materials, and the scale inhibition rate for CaCO3 reached 100 % when the dosage was 20 mg•L−1. Furthermore, the product exhibited good dispersion performance on iron oxide, therefore, 5 % was chosen as the ideal initiator dosage. The IA/SMAS copolymer was obtained by free radical polymerization of IA and SMAS monomers in the aqueous solution, and the initiator dosage affected the number of free radicals. When the initiator dosage was low, there were few active radicals, resulting in a slow and incomplete polymerization reaction and a large amount of residual raw monomer and a low conversion rate. This ultimately affected the properties of the final product. Ideal polymer scale inhibition and dispersion performance were achieved when initiator content was 5 %. With increasing initiator dosage, the reaction produced a rapid increase in the active center, resulting in burst polymerization that was prone to multi-head polymerization. This resulted in a small polymer molecular weight with reduced performance.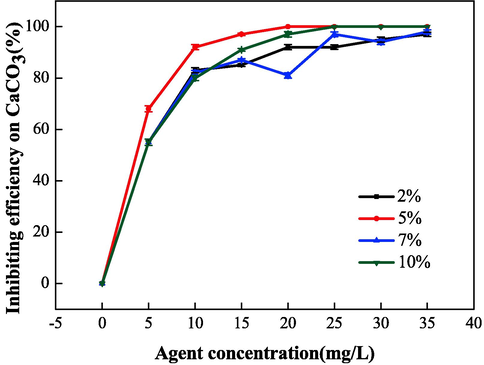
Effect of the initiator dosage on the scale inhibition performance of CaCO3.
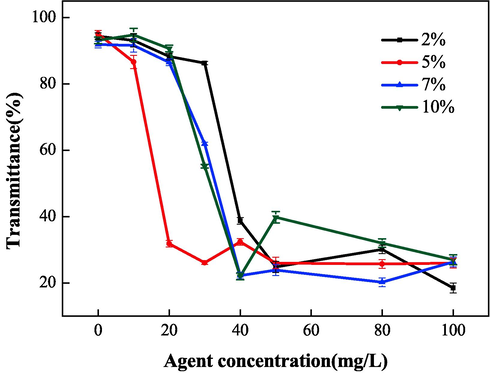
Effect of the initiator dosage on dispersion performance.
3.2.4 Effect of chain transfer agent dosage
To study the relationship between the chain transfer agent (isopropyl alcohol) dosage and the properties of the IA/SMAS polymer, the performance of different polymers was investigated by varying isopropanol dosage. As shown in Fig. 14 and Fig. 15, the polymer scale inhibition effect was optimal when the isopropyl alcohol dosage was 5 % of the total mass of raw materials. At this dosage, the final product exhibited good dispersion performance with iron oxide, therefore, the most suitable chain transfer agent addition amount was 5 %. The chain transfer agent also affected the length of the polymer molecular chain and the molecular mass in the reaction, which affected its performance.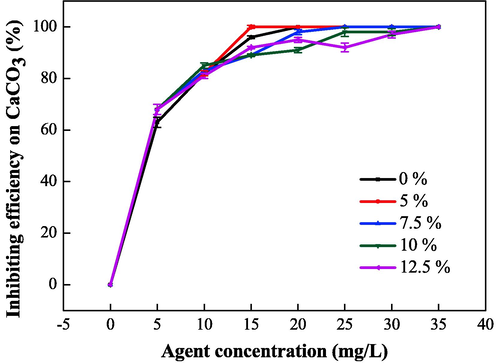
Effect of chain transfer agent dosage on the scale inhibition performance of CaCO3.
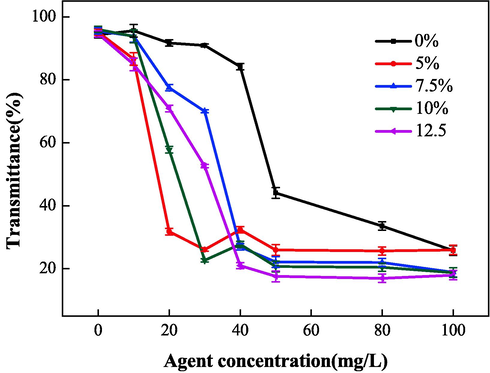
Effects of chain transfer agent dosage on dispersion properties.
3.2.5 Effect of polymerization temperature
Polymerization temperature was another important factor that affected the properties of IA/SMAS. Therefore, the properties of IA/SMAS were studied at the polymerization time of 6 h, where the raw material mass ratio (IA:SMAS) was 2:1, and ammonium persulfate and isopropyl alcohol dosage was 5 %. Fig. 16 and Fig. 17 show that the scale inhibition performance of the polymers obtained at 95 °C and 100 °C was comparable, and the scale inhibition rate for CaCO3 reached 100 % when the dosage was 20 mg•L−1. The dispersion effect was better at 95 °C, therefore 95 °C was chosen as the ideal polymerization temperature. The process of initiator decomposition into free radicals is a heat-absorbing reaction, low temperatures will affect decomposition. However, the polymerization of free radicals is exothermic, therefore high temperatures will adversely affect polymerization reactions. As a result, an appropriate temperature should be used to help the initiator fully decompose into free radicals, and ensure the smooth progression of the polymerization reaction.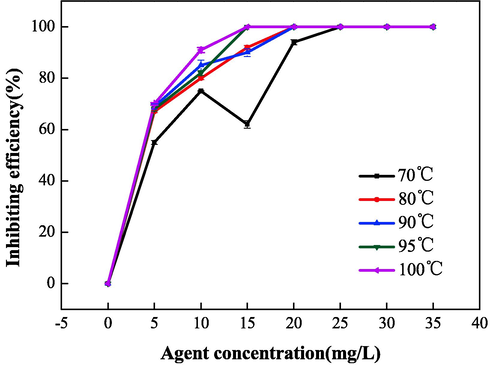
Effect of polymerization temperature on the scale inhibition performance of CaCO3.
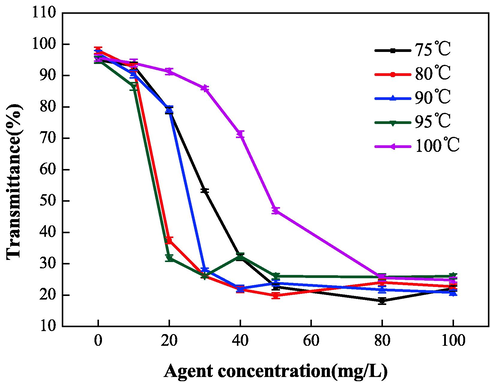
Effect of polymerization temperature on dispersion properties.
To improve the scale inhibition and dispersion performance of the polymerized products, various synthesis conditions of IA/SMAS were optimized, and finally, the ideal synthesis process conditions were obtained. The conditions that offered the best synthesized product performance were: a raw material mass ratio (IA:SMAS) of 2:1, a polymerization temperature of 95 °C, a polymerization time of 6 h, and ammonium persulfate and isopropanol addition amount of 5 % (total mass of the raw materials). At this time, the total monomer conversion rate of IA and SMAS was 98.9 %. In addition, the polymer obtained with a dosage of 20 mg•L−1 had a scale inhibition effect on CaCO3 reaching 100 %. With a dosage of 50 mg•L−1, the translucency of the upper clear layer after Fe2O3 dispersion was 26 %. The biodegradability of the polymer was also tested. As shown in Fig. 18, the biodegradation rate gradually increased with prolonged time, and the degradation rate of the copolymer reached 68 % on the 28th day. Therefore, this indicated that IA/SMAS was easily biodegradable, avoiding the eutrophication of water bodies and environmental water pollution.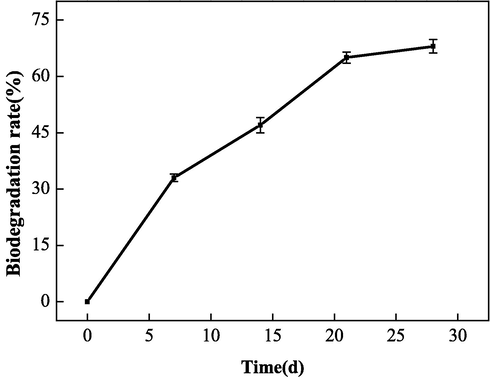
Biodegradability of the polymer.
3.3 Study on the synergistic performance of IA/SMAS with an electrostatic field
To study the synergistic scale inhibition effect of IA/SMAS and an electrostatic field, the experimental water was electrostatically treated with an SH-type high-pressure electrostatic water processor. During the experiment, the experimental water flowed in the electrostatic device, and the water quality was selected as Ca2+=500 mg•L−1 and HCO3–=500 mg•L−1 (calculated as CaCO3). The solution obtained after electrostatic treatment was placed in a water bath at 80 °C for 10 h and then cooled to room temperature after being taken out. The concentration of Ca2+ in the supernatant was titrated with the EDTA solution, and the synergistic scale inhibition performance on CaCO3 was calculated as shown in Eq. (5).
3.3.1 Effect of electrostatic treatment time
The scale inhibition performance of IA/SMAS was studied at different electrostatic times of 20, 40, 60 min at an electrostatic voltage of 7 kV and a water flow rate of 60 L•h−1 through the electrostatic apparatus. A blank comparison experiment was also conducted.
Fig. 19 presents the experimental results, showing that the single electrostatic treatment had some scale inhibition performance on CaCO3, but the effect was negligible, and only 5 % at most. When the polymer and electrostatic field were jointly used, the electrostatic effect on the polymer scale inhibition rate was more noticeable. At an electrostatic time of 40 min and IA/SMAS dosage of 0.4 mg•L−1, the best scale inhibition effect was obtained by the synergistic effect of electrostatic field and copolymer, and this effect was 12 % higher than that of a single copolymer. This is because when the electrostatic field is used for scale inhibition treatment, it affects the process of forming crystal forms when scale forming ions (e.g., Ca2+, HCO3–) are precipitated. By inducing changes in the crystalline form of scale, the crystalline precipitation of scale on the vessel wall is reduced, or the scale that has been produced gradually falls off, thus achieving the scale inhibition effect. When the electrostatic field and the agent were applied to the solution at the same time, they showed a good scale inhibition effect, indicating that the two have a synergistic effect, and the presence of the electrostatic field effectively improves the scale inhibition effect of the copolymer on CaCO3.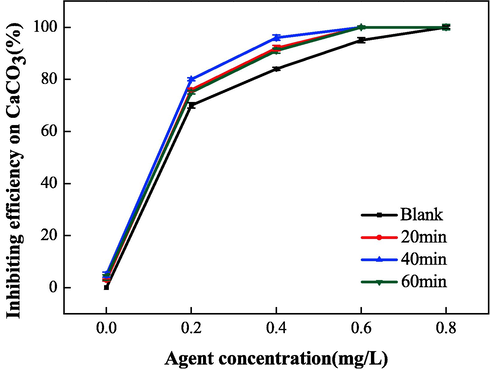
Effect of electrostatic time on scale inhibition performance of CaCO3.
3.3.2 Effect of electrostatic voltage
The scale inhibition performance of IA/SMAS was measured at the electrostatic voltages of 3, 5, and 7 kV at an electrostatic time of 40 min and water flow rate of 60 L•h−1 through the electrostatic apparatus. A blank comparison experiment was also conducted.
As shown in Fig. 20, the synergistic effect of electrostatic treatment and the IA/SMAS copolymer resulted in an ideal electrostatic voltage of 5 kV, which increased the scale inhibition rate by 16 % compared to the polymer alone. The scale inhibition rate at 5 kV and 0.2 mg•L−1 dosage were comparable to a single dosage of 0.4 mg•L−1, indicating that the addition of the electrostatic field effectively reduced the dosage by up to 50 %.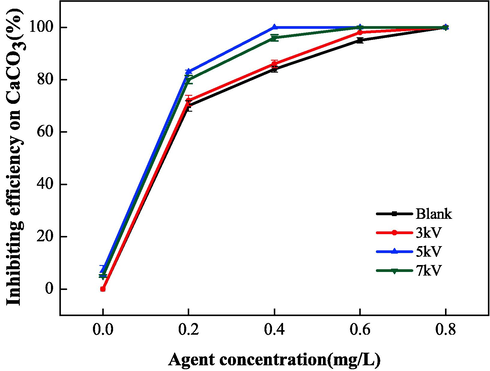
Effect of electrostatic voltage on scale inhibition performance of CaCO3.
3.3.3 Effect of water flow rate
The scale inhibition performance of IA/SMAS was measured at an electrostatic time of 40 min, an electrostatic voltage of 5 kV, and water flow rates of 40, 60, 80 L•h−1 through the electrostatic apparatus. A blank comparison experiment was also conducted.
As shown in Fig. 21, the synergistic scale inhibition effect of the electrostatic field and copolymer differed when the water flow through the electrostatic apparatus was varied. The synergistic scale inhibition was not obvious at a water flow rate of 40 L•h−1. When the water flow rate was 60 L•h−1, the electrostatic field had the best effect on the scale inhibition rate of the copolymer, and this rate was 16 % higher than the copolymer alone. However, the addition of an electrostatic field greatly reduced the scale inhibitor dosage, at a comparable scale inhibition effect.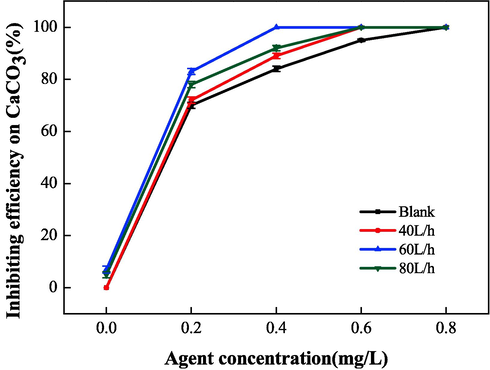
Effect of electrostatic water flow on the scale inhibition performance of CaCO3.
From the above experiments, it was concluded that the electrostatic field and IA/SMAS copolymer had a synergistic scale inhibition effect. The electrostatic treatment of water is a low energy consumption, safe, and non-pollution method, and is more environmentally friendly than chemical dosing. Therefore, an SH-type electrostatic water processor was used to study the synergistic electrostatic field and IA/SMAS effect, and the best experimental conditions were an electrostatic time of 40 min, electrostatic voltage of 5 kV, and a water flow rate of 60 L•h−1. At that time, the synergistic scale inhibition rate of electrostatic and IA/AMPS was up to 16 % higher compared to IA/AMPS alone. The addition of an electrostatic field effectively reduced the IA/AMPS dosage by up to 50 %.
3.4 Scale inhibition mechanism
3.4.1 SEM analysis of CaCO3 crystals
While studying the scale inhibition performance on CaCO3, the CaCO3 crystals were also prepared. For the preparation process, a small slide was placed at the bottom of the conical flask, which was removed at the end of the test. The crystals were dried in an oven at 80 °C, and then the crystals were scanned with an SEM at 3000x magnification after gold sputtering.
Fig. 22 shows the CaCO3 crystals as observed with an SEM. The blank crystals shown in Fig. 22a were calcite, with a regular shape, sharp angles, and a tight structure (Ling et al., 2012). As shown in Fig. 22b, the shapes of the scale crystals that formed after the addition of the copolymer changed significantly. The crystals became irregularly shaped and distorted, and the structure became loose, dispersed, and had a larger crystal volume (Liu et al., 2012; Shi et al., 2017). The electrostatically treated CaCO3 crystals were then scanned, as shown in Fig. 22c. Some of the crystals had transformed from calcite to aragonite, and the remaining calcite angles disappeared. Fig. 22d shows the scale sample obtained after the synergy of an electrostatic field and the IA/SMAS copolymer. The scale sample crystals were stacked together in a spindle shape and the crystals were looser than calcite, and they were less likely to adhere to the device wall.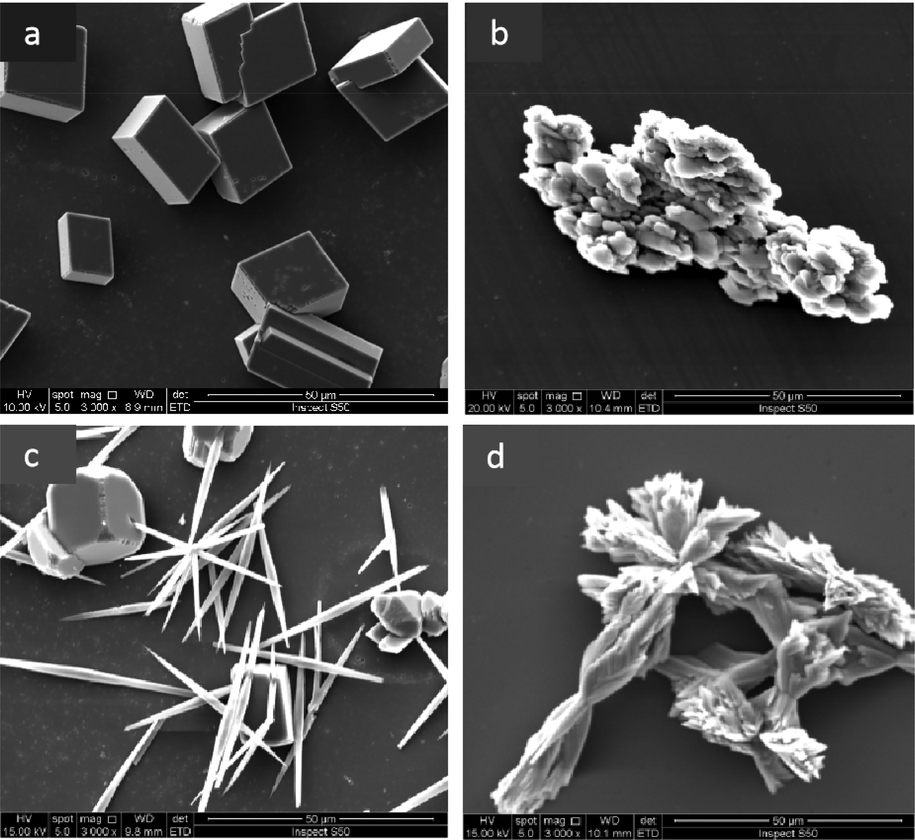
SEM images of CaCO3 under different conditions: a) the blank scale sample, b) the scale sample with IA/SMAS, c) scale sample under an electrostatic field, and d) scale sample exposed to an electrostatic field and IA/SMAS.
3.4.2 XRD analysis of CaCO3 crystal
The XRD spectra of the CaCO3 crystals are shown in Fig. 19, where the phase mass fraction was calculated using Eq. (9):
XRD was used to analyze the blank scale sample, the scale sample obtained after IA/SMAS was added, the scale sample obtained under the electrostatic alone, and the scale sample obtained by electrostatic was in synergy with IA/SMAS.
Fig. 23 shows that only the diffraction peak of calcite was found in the blank sample (Fig. 23a). After the addition of IA/AMPS (Fig. 23b), the calcite peaks at 22.9° (0 1 2) and 39.3° (1 1 3) disappeared, and the intensity of the calcite diffraction peaks at 29.3° (1 0 4) and 35.9° (1 1 0) decreased significantly (Liu et al., 2017). However, the diffraction peaks for vaterite appeared at 21.0° (0 0 4) and 31.7° (1 1 4), with 83 % of vaterite (Chen et al., 2015). The scale sample obtained after electrostatic treatment (Fig. 23c) consisted of calcite and aragonite, with aragonite accounting for 72 % and calcite for 28 %. The scale sample (Fig. 23d) contained calcite, vaterite, and aragonite after IA/AMPS synergy with the electrostatic field. The peak intensities of the diffraction peaks for calcite at 29.96° (1 0 4) and 43.22° (2 0 2) were significantly reduced, and the peaks for calcite at 22.9° (0 1 2), 35.9° (1 1 0), and 39.3° (1 1 3) disappeared. In addition, the diffraction peaks for aragonite appeared at 26.3° (0 0 4) and 33.12° (0 1 2), and the characteristic peaks for vaterite appeared at 32.28° (1 1 4) and 21.54° (0 0 4), with calcite accounting for 9 %, aragonite for 17 %, and vaterite for 74 %. This indicated that the addition of IA/AMPS resulted in less calcite, less crystallinity, and loosely structured vaterite in the scale sample. Thus, electrostatic energy resulted in a large amount of calcium carbonate scale sample, in the form of aragonite. The results were consistent with the SEM analysis results.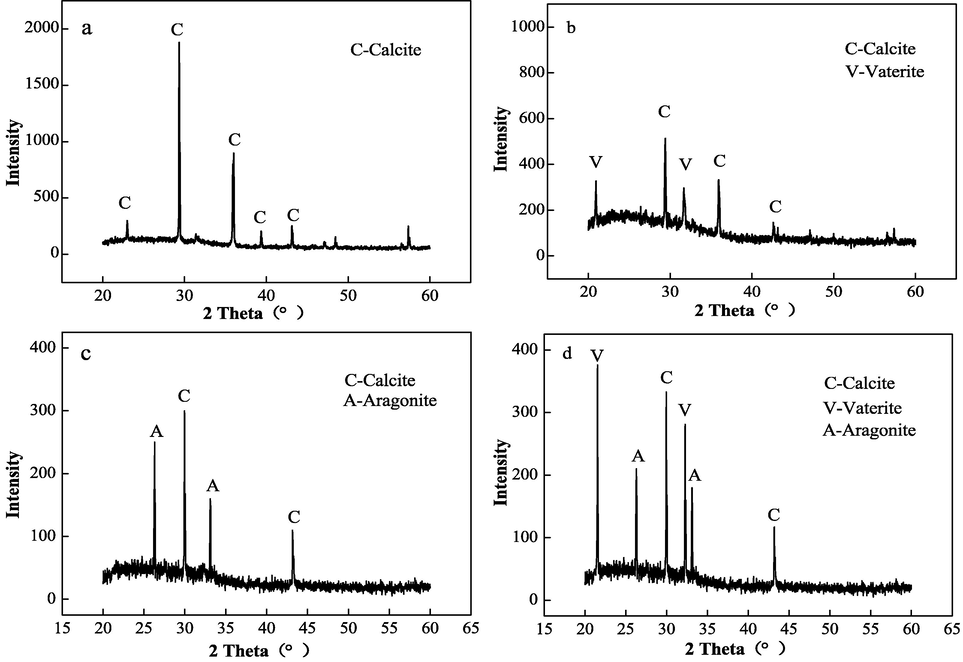
XRD patterns for CaCO3 under different conditions: a) blank scale sample, b) scale sample with IA/SMAS, c) scale sample with electrostatic treatment, d) scale sample exposed to an electrostatic field and IA/SMAS.
3.4.3 Mechanism analysis
By analyzing the SEM and XRD patterns of the CaCO3 scale samples, it could be found that the IA/SMAS copolymer had good scale inhibition and dispersion properties, which led to lattice distortions (Wang et al., 2014). This was due to the ionization of the IA/SMAS copolymer when it dissolved in water, producing negatively charged molecular chains. These chains chelated with Ca2+ to produce a structurally stable chelate, which increased the solubility of the scale forming ions in the water and acted as scale inhibitors. There were carboxylic acid and sulfonic acid groups in the IA/SMAS copolymer, which could occupy the scale growth active sites. Thus, the crystals did not grow strictly into an inorganic scale, according to the crystal growth law. This caused crystal lattice distortions, and the scale became loose in texture, generating vaterite. As a result, the crystals did not easily adhere to the vessel wall and were easily carried away by water. The electrostatic field changed the crystal form significantly, and its addition provided that the energy resulted in a stable aragonite scale. The aragonite scale had a loose structure and did not easily stick to the wall. In the presence of an electrostatic field and the IA/SMAS copolymer, aragonite and vaterite scale were dispersed, which were easily washed away by the water flow, and this did not affect the heat exchange process of the heat exchanger.
4 Conclusions
In this study, a phosphorus-free, nitrogen-free, and environmentally friendly water treatment agent, the IA/SMAS copolymer, was successfully synthesized with IA and SMAS. The optimal synthesis conditions were as follows: a raw material mass ratio (IA:SMAS) of 2:1, a temperature of 95 °C, and a reaction time of 6 h. In addition, ammonium persulfate and isopropanol were both added at 5 % of the total raw material mass. Static experiments showed that the IA/SMAS copolymer had good scale inhibition and dispersion properties, and the synergistic scale inhibition rate of the electrostatic field and IA/SMAS on CaCO3 was 16 % higher than that of IA/SMAS alone. The addition of the electrostatic field effectively reduced the dosage of chemicals by up to 50 %. The characterization results of scale CaCO3 crystals by SEM and XRD show that IA/SMAS had a certain lattice distortion effect. Moreover, the synergistic effect of IA/SMAS and the electrostatic field resulted in the presence of a large number of aragonite and vaterite scales, which did not easily adhere to the vessel walls. In summary, the synthesized IA/SMAS has no phosphorus and nitrogen, is environmentally friendly, and has a synergistic effect with the electrostatic field, which provides theoretical guidance for the development of new physicochemical circulating cooling water treatment technologies.
CRediT authorship contribution statement
Zhan Liu: Conceptualization, Methodology, Investigation, Visualization, Writing – original draft. Meifang Yan: Methodology, Supervision, Conceptualization, Writing – review & editing. Yuxuan Zheng: Supervision, Investigation, Writing – review & editing. Yuhua Gao: Conceptualization, Writing – review & editing. Haihua Li:: Methodology, Supervision, Investigation. Zhenfa Liu: Conceptualization, Supervision, Project administration, Writing – review & editing, Funding acquisition.
Acknowledgments
This work was supported by the Natural Science Foundation of Hebei Province, the Key Basic Research Project (18964005D), and the science and technology projects of Hebei Academy of Sciences (21712).
Declaration of Competing Interest
The authors declare that they have no known competing financial interests or personal relationships that could have appeared to influence the work reported in this paper.
References
- Application and evaluation of novel acrylic based CaSO4 inhibitors for pipes. Desalination. 2015;355:33-44.
- [Google Scholar]
- Evaluation of maleic acid based polymers as scale inhibitors and dispersants for industrial water applications. Desalination. 2014;335:55-63.
- [Google Scholar]
- Effective biosorption of arsenic from water using La (III) loaded carboxyl functionalized watermelon rind. Arab J Chem.. 2022;15:10364.
- [Google Scholar]
- High Prformancemaleie acid baed oil well scale inibtiors-Devlopmen and comparative evalution. J. Ind. Eng. Chem.. 2011;17:415-420.
- [Google Scholar]
- Sulfonated graphene oxide impregnated cellulose acetate floated beads for adsorption of methylene blue dye: optimization using response surface methodology. Nature. 2022;12:9339.
- [Google Scholar]
- Inhibitor Protection of Steel Against Corrosion and Scaling Under the Influence of Ultrasound. Mater. Sci.. 2020;55:831-839.
- [Google Scholar]
- Synthesis of modified polyaspartic acid and evaluation of its scale inhibition and dispersion capacity. Desalination. 2015;358:42-48.
- [Google Scholar]
- Study of Polyaspartic Acid and Chitosan Complex Corrosion Inhibition and Mechanisms. Pol. J. Environ. Stud.. 2018;27:1441-1448.
- [Google Scholar]
- Synhesis, characterization and performance evaluation of an environmentally benign scale inhibitor IA/AMPS co-polymer. New J. Chem.. 2019;43:9472-9482.
- [Google Scholar]
- Synthesis, scale inhibition and dispersion performance evaluation of the environmentally benign additive IA-AMPS-APEG copolymer. Environ. Sci-Wat. Res.. 2019;5:1736-1747.
- [Google Scholar]
- Green synthesis of iron nanoparticles using different leaf extracts for treatment of domestic waste water. J. Clean. Prod.. 2016;139(24):1425-1435.
- [Google Scholar]
- A novel nanocomposite based on covalent organic polymer and nanocellulose for thin-film microextraction of imipramine from biological samples. J. Sep. Sci.. 2021;2021(44):2972-2981.
- [Google Scholar]
- Floatable cellulose acetate beads embedded with flower-like zwitterionic binary MOF/PDA for efficient removal of tetracycline. J. Colloid Interface Sci.. 2022;620:333-345.
- [Google Scholar]
- Synthesis of Itaconic Acid Terpolymer and Its Application In Scale Inhibition and Dispersion. Acta Petrolei Sinica.. 2022;2(38):340-347.
- [Google Scholar]
- Study on Synthesis. Scale Inhibition and Mechanism of ESA/IA/AMPS Copolymer, Speciality Petrochemicals.. 2017;1(34):42-47.
- [Google Scholar]
- Preparation and performance of ternary scale inhibitor IA/AA/HEMA. Journal of Functional Materials.. 2020;51(06):6177-6185.
- [Google Scholar]
- A new class of hyperbranched polymeric scale inhibitors. J. Petrol. Sci. Eng.. 2012;94–95:66-72.
- [Google Scholar]
- Highly effective scale inhibition performance of amino trimethylenephosphonic acid on calcium carbonate. Desalination. 2017;422:165-173.
- [Google Scholar]
- Theoretical and experimental insights into the control of calcium sulfate scales by using random copolymers based on itaconic acid. Fuel. 2015;14(9):66-77.
- [Google Scholar]
- Evaluation of Synthesized antiscalants for cooling water system application[J] Desalina.. 2011;268(3):38-45.
- [Google Scholar]
- Itaconic acid biotechnological process in change. Bioresource Technol.. 2013;135:422-431.
- [Google Scholar]
- Carboxylate-terminated double-hydrophilic block copolymer as an effective and environmental inhibitor in cooling water systems. Desalination. 2012;304:33-40.
- [Google Scholar]
- Comparative performance of polyepoxysuccinic acid and polyaspartic acid on scaling inhibition by static and rapid controlled precipitation methods. Desalination. 2012;304:1-10.
- [Google Scholar]
- Inhibition of scaling of water by the electrostatic treatment. Water Resour. Manage.. 2009;23:1291-1300.
- [Google Scholar]
- Acrylic acid-allylpolyethoxy carboxylate copolymer as an effective inhibitor for calcium phosphate and iron(III) scales in cooling water systems. Clean-Soil. Air. Water.. 2015;43:989-994.
- [Google Scholar]
- Polyether copolymer as an environmentally friendly scale and corrosion inhibitor in seawater. Desalination. 2017;419:133-140.
- [Google Scholar]
- Synthesis and characterization of modified aliphatic polycarbonates as environmentally friendly oilfield scale inhibitors. Energy Fuels. 2018;32:6746-6755.
- [Google Scholar]
- Production of Precipitated Calcium Carbonate from Steel Converter Slag and Other Calcium-Containing Industrial Wastes and Residues. Adv. Inorg. Chem.. 2014;66(2):347-384.
- [Google Scholar]
- Curcumin-malic acid based green copolymers for control of scale and microbiological growth applications in industrial cooling water treatment. J. Mol. Liq.. 2016;21(4):400-410.
- [Google Scholar]
- Novel reusable amine-functionalized cellulose acetate beads impregnated aminated graphene oxide for adsorptive removal of hexavalent chromium ions. Int. J. Biol. Macromol.. 2022;208:925-934.
- [Google Scholar]
- Application of water-soluble polymers as calcium carbonate scale inhibitors in petroleum wells: A uni- and multivariate approach. Desalination. 2021;515:115201
- [Google Scholar]
- Organic Synthesis Laboratory Handbook.. 2010;5:110-114.
- Preparation of fluorescent polyaspartic acid and evaluation of its scale inhibition for CaCO3 and CaSO4:[J]Polym. Advan. Technol.. 2017;28:367-372.
- [Google Scholar]
- Synthesis and characterization of a biodegradable polyaspartic acid/2-amino-2-methyl-1-propanol graft copolymer and evaluation of its scale and corrosion inhibition performance [J] RSC Adv.. 2017;7:36714-36721.
- [Google Scholar]
- Preparation of COOH-KCC-1/polyamide 6 composite by in situ ring-opening polymerization: synthesis, characterization, and Cd(II) adsorption study. J. Environ. Chem. Eng.. 2020;9:104683
- [Google Scholar]
- Standardization administration. Determination of scale inhibition performance of water treatment agents-calcium carbonate precipitation method. GB/T 16632-2008.
- Kemenyan (styrax benzoin dryand) extract as green inhibitor of calcium carbonate(CaCO3) crystallization. Desalin. Water Treat.. 2017;92:38-45.
- [Google Scholar]
- Grape extract assisted green synthesis of reduced graphene oxide for water treatment application. Mater. Lett.. 2015;160:355-358.
- [Google Scholar]
- Crystal nucleation and the solid-liquid interfacial freeenergy. J. Chem. Phys.. 2012;136(7):074510-074518.
- [Google Scholar]
- Microscopic evidence for liquid-liquid separation in supersaturated CaCO3 solutions. Science. 2013;341(6145):885-889.
- [Google Scholar]
- 3-(diethylamino)-1-phenylpropan-1-one as a Corrosion Inhibitorfor N80 Steel in Acidization of Petroleum Exploitation. Int. J. Electrochem. Sci.. 2016;11:4943-4956.
- [Google Scholar]
- Investigation of influence of low phosphorous co-polymer antiscalant on calcium sulfate dihydrate crystal morphologies. Desalination. 2014;348:89-93.
- [Google Scholar]
- Survey of Researches on Scale Inhibition Mechanism of Scale Inhibitor. Chemical industry and Engineering.. 2001;18(2):79-92.
- [Google Scholar]
- Nontoxic corrosion inhibitors for N80 steel in hydrochloric acid. Arab. J. Chem.. 2016;9:S1487-S1495.
- [Google Scholar]
- In Situ Polymerized FDU-12/Poly (methyl methacrylate. Chem. Eng. Technol.. 2021;44(3):431-440.
- [Google Scholar]
- Novel and green nanocomposite-based adsorbents from functionalised mesoporous KCC-1 and chitosan-oleic acid for adsorption of Pb(II) Euo Polym J.. 2019;119:400-409.
- [Google Scholar]
- Synthesis of Polyaspartic Acid/Chitosan Graft Copolymer and Evaluation of Its Scale Inhibition and Corrosion Inhibition Performance. Int. J. Electrochem. Sci.. 2015;10(11):9513-9527.
- [Google Scholar]


