

Translate this page into:
Insight into the adsorption of dyes onto chitin in aqueous solution: An experimental and computational study
⁎Corresponding author. kikiadikurnia@itb.ac.id (Kiki Adi Kurnia) kurnia.kikiadi@gmail.com (Kiki Adi Kurnia)
-
Received: ,
Accepted: ,
This article was originally published by Elsevier and was migrated to Scientific Scholar after the change of Publisher.
Peer review under responsibility of King Saud University.
Abstract
This study aimed to get an insight into the adsorption of three synthetic dyes onto chitin using experimental and computational approaches. The successful preparation of α-chitin was confirmed using the Fourier Transform Infrared (FTIR) and X-ray Diffraction (XRD). In addition, the presence of porous and fiber on the surface of the extracted chitin was revealed by the Scanning Electron Microscopy (SEM) analysis. The extracted α-chitin was then used as an adsorbent to remove synthetic dyes, namely Malachite green, Basic red 18, and Alizarin yellow R. The kinetic study showed that the adsorption of dyes was well-described using a pseudo-second-order model, whereas the isotherm adsorption obeyed the Freundlich model. The Frontier Molecular Orbital (FMO) revealed several locations of dyes and chitin molecules that are potentially active sites for adsorption. The adsorption trend could be related to the Highest Occupied Molecular Orbital (HOMO) – Lowest Unoccupied Molecular Orbital (LUMO) energy gap and electrophilicity index of the dyes. The Conductor-like Model for Real Solvent (COSMO-RS) model demonstrated, for the first time, that several interactions occurred during the adsorption of dyes onto α-chitin. For the Malachite green and Basic Red 18, the Van der Waals forces of the dyes controlled its adsorption behavior. In contrast, the hydrogen bonding interaction governed the adsorption behavior of Alizarin yellow R dye onto α-chitin. The gathered insight from this work might guide us better to understand the molecular level of dyes–chitin interactions and, ultimately, to design adsorbents to remove synthetic dyes from wastewater.
Keywords
Adsorption
Malachite green
Basic red 18
Alizarin yellow R
Chitin
FMO
COSMO-RS

1 Introduction
A significant amount of synthetic dyestuff used in the industries is lost to the waste streams. Eventually, it ends up in the aqueous environment (Chowdhury et al., 2020, Tkaczyk et al., 2020). Unfortunately, synthetic dyes are carcinogenic for aquatic organisms and can ultimately threaten ecological systems (Krishna Moorthy et al., 2021, Mani et al., 2019, Manjunath et al., 2020). Therefore, treating wastewater containing hazardous dyes is imperative before discharging it into the environment. In this vein, several methods have been reported to remove dyes from wastewater, such as biological methods (McMullan et al., 2001, Saratale et al., 2011), advanced oxidation processes (Bilińska et al., 2017, Oturan and Aaron, 2014), electrocoagulation (Bassyouni et al., 2017, He et al., 2016), membrane (Gunawan et al., 2019, Lin et al., 2015), and adsorption technology (Ahmad et al., 2015, Samsami et al., 2020). Among those methods, adsorption technology has been considered the best due to its high efficiency, simple design, and operation (Panic and Velickovic, 2014, Zhou et al., 2019).
In recent years, due to their abundance and non-toxic nature, natural and renewable materials have been studied as adsorbents in adsorption technology (Meng et al., 2020, Tran et al., 2015). Natural polymer biosorbents, such as chitin, chitosan, and their derivatives, have been widely studied (Sarode et al., 2019). Chitin is abundant in nature, mainly in crab and shrimp shells (González et al., 2015). Since shrimp is one of the protein sources, a large amount of shrimp consumption worldwide, including in Indonesia, produces an enormous number of shrimp waste. Thus, utilizing shrimp shells waste as the source of chitin could provide a low-cost and sustainable raw material for the preparation of biosorbents (El Knidri et al., 2018, Huang et al., 2017, Iqbal et al., 2011). Chemically, chitin ((1 → 4)-2-acetamido-2-deoxy-β-d-glucan) possesses functional groups, such as amide and hydroxyl, that can form efficient hydrogen bonds. These features make chitin and its derivatives an exciting candidate as a potential adsorbent for removing dyes from an aqueous solution (Annadurai et al., 1999, Dotto et al., 2012, El Knidri et al., 2018, Figueiredo et al., 2005, González et al., 2015, Liu et al., 2018, Tan et al., 2021). For example, Figueredo et al. (Figueiredo et al., 2005) utilized chitin as an adsorbent for textile dyestuff, namely Reactive Green 12 and Direct Green 26, which are commonly used in cellulosic fibers dyeing. González et al. (González et al., 2015) studied the removal of Remazol Black and Neutral Red from aqueous solution using chitin and chitin/graphene oxide hybrid. The authors reported that the maximum adsorption capacity for Remazol Black and Neutral Red was 92 and 17 mg/g, respectively. While all those works contributed to applying chitin as a cost-effective adsorbent to eliminate dyes from wastewater, most of the reported works focused on the kinetic and isotherm adsorption of dyes. The fundamental knowledge of the adsorption behavior of dyes – adsorbent at the molecular level is still far behind.
Computational methods are a valuable tool to provide insight into the adsorption process, such as adsorbate – adsorbent interactions, on the molecular level. Frontier Molecular Orbital (FMO) and Molecular Dynamic (MD) simulation are two of the most widely used computational method to understand the adsorption behavior of solute–adsorbents at the molecular level (Chung et al., 2015, Huang et al., 2019, Khnifira et al., 2021a, 2021b, Shaikh et al., 2021, Yeh et al., 2015). For example, Khnifira et al. (Khnifira et al., 2021a, 2021b) combined the MD simulation, FMO, and experimental study of the adsorption of eriochrome black T (EBT) onto chitosan in an aqueous solution. The author used FMO to describe the impact of the pH on the adsorption of EBT onto chitosan due to different speciation of dye in an aqueous solution. The authors also explained the strength of adsorption capacity due to the interaction energy of different dye speciation with the adsorbent. While the MD simulation could provide the binding energies of the EB-chitosan complexes, the model could not identify the specific type of interaction that occurs during the adsorption process.
Recently, some of us reported the experimental and computational study on the adsorption of ionic liquids onto ZSM-5 in an aqueous solution (Kurnia et al., 2019). The computational study using COnductor-like Screening MOdel for Real Solvents (COSMO-RS) could demonstrate the presence of several molecular forces that rule the adsorption process. Therefore, following the previous work, this study aimed to get better insight into the adsorption process of several commonly used dyes in the textile industry from aqueous solution onto chitin using both experimental and computational tools. Herein, we report the experimental and computational approaches for the adsorption of Malachite green, Basic red 18, and Alizarin yellow R onto the surface of chitin. These dyes were chosen to represent the different impacts of the chemical structure on their adsorption behavior. The first part of this study focused on the preparation and characterization of chitin from shrimp shells waste. The obtained chitin was then subjected to adsorption studies. The adsorption kinetics and isotherms were explained using a set of known models. Finally, two computational approaches, FMO and COSMO-RS, were used to get better insight into the adsorption process at the molecular level. As shown, the computational approaches could support the experimental adsorption data and enable insight into molecular interactions that rule the adsorption dyes onto chitin.
2 Materials and methods
2.1 Materials
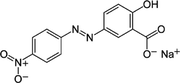
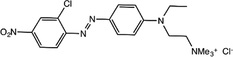
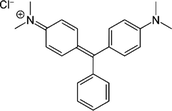
Alizarin yellow R (CAS Number 2243-76-7, Merck), Basic Red 18 (CAS Number: 25198-22-5, DyStar), and Malachite green chloride (CAS Number: 569-64-2, Merck) were used as synthetic dyes. The chemical structures and properties of the studied dyes are shown in Table 1. NaOH (>97.0 wt%, CAS Number 1310-73-2) and HCl (37 wt%, CAS Number: 7647-01-0) were purchased from Merck, Sigma-Aldrich. All chemicals were used as received. Otherwise stated, distilled water was used throughout the experiment.
Dye
Type of dye
Mw (g/mol)
λmax (nm)
Chemical Structure
Alizarin yellow R
Azo
309.21
365
Basic Red 18
Azo
426.34
480
Malachite green
Triarylmethane
364.91
617
Shrimp shells waste from white shrimp (Litopenaeus vannamei) was collected from local home-industry processing in Surabaya, Indonesia. After collection, the shells were immediately washed with running water to remove blood, remaining meat, and any impurities. Subsequently, the shrimp shells were dried in the laboratory without direct exposure to sunlight. The clean and dried shrimp shells were ground into powder using an electric lab mill. Afterward, it was stored in the refrigerator using an air-tight bag.
2.2 Extraction and characterization of chitin from shrimp shell waste
The extraction of chitin from shrimp shell waste was performed according to our previous work (Rahayu et al., 2022). It consists of two major steps, namely deproteination and demineralization. In the deproteination, approximately 50 g of dried powder shrimp shell was treated using 1 M of NaOH solutions (1:10 w/v) at 90 °C for 3 h. After reaching the pre-set time, the mixture was filtered, and the solid sample was thoroughly washed using distilled water until the pH was neutral. The sample was then dried in the oven at 60 °C for 24 h. In the next step, the dried sample undergoes demineralization using 1 M acid solution at 60 °C for 3 h. The mixture was then filtered, and the resulting chitin was then washed with distilled water until it achieved neutral pH. The wet chitin was dried in the oven at 60 °C for 24 h. The final extracted and dried chitin was stored in the refrigerator using an air-tight bag until further use.
The chemical analysis of chitin, such as protein, mineral, and water content, were performed according to the methods reported in the literature (Black and Schwartz, 1950, Borić et al., 2020, Kirk, 1950). Furthermore, the obtained chitin was further characterized using Fourier transform infrared (FTIR), X-ray diffraction (XRD), and scanning electron microscopy (SEM). The FTIR spectra were obtained on the Nicolet Avatar 360 FTIR spectrometer in the spectral range between 4000 and 500 cm−1 at a spectral resolution of 5 cm−1 and 200 scans. The XRD patterns of chitin were determined by Bruker D2 Phaser using Cu-Kα radiation (λ = 1.5406) (40 kV, 30 mA). The 2θ angle was scanned between 5° and 55°. The SEM of the extracted chitin was examined using Phenom Desktop ProXL (ThermoFisher Scientific) with energy dispersive spectrometry (EDS).
2.3 Adsorption studies
The aqueous stock of dyes with a concentration of 1000 mg/L was prepared by weighing the proper amount of dye and dissolving it in distilled water using 1 L of volumetric flask. The required concentrations of (50–400) mg/L for the adsorption study were prepared by diluting the stock solution with distilled water. The adsorption studies were performed via a batch mode. In brief, circa 0.1 g of chitin was added to a series of 50 ml of stoppered Erlenmeyer flask containing 25 ml of aqueous solution with different initial dye concentrations of (50–400) mg/L. The flasks were placed on an orbital shaker and agitated at 200 rpm. The concentration of dyes remaining in the aqueous solution were ascertained by monitoring the absorbance on a UV–vis Spectrophotometer (UV-1800 Shimadzu, Japan) at a pre-determined time (10–150 min with an interval time of 10 min).
The adsorption capacity (qe) and removal efficiency (%Removal) were calculated using the following equations:
In addition, blank experiments were conducted to verify the absence of dye adsorption to the flask walls. All adsorption experiments were carried out in triplicate to confirm the replicability of the results. The average of these measurements was used to analyze the adsorption behavior of dyes onto chitin.
2.4 Computational studies
The geometry of the studied dyes and chitin were optimized on the density functional theory (DFT) level utilizing the BP functional B88-P86 with the triple-ζ valence polarized (TZVP) basis set and the resolution of identity standard (RI) approximation using the TURBOMOLE program package (Ahlrichs et al., 1989). The estimation of the interaction energy between dyes and chitin was performed with the COSMOthermX18 program using the parameter file BP_TZVP_C30_1801 (COSMOlogic, Leverkusen, Germany) (Eckert and Klamt, 2018). The detail on the calculation of interaction energy estimated using COSMO-RS is given in the literature (Kurnia and Coutinho, 2013).
3 Results and discussions
While this study aimed to get better insight into the molecular mechanism that controls the adsorption of dyes onto adsorbent in an aqueous solution, it is essential to characterize the studied adsorbent. Therefore, the characterization of chitin from shrimp shell waste is given in the first part of this section. It is followed by the discussion on the kinetic and isotherm adsorption of the dyes onto chitin. Finally, the last part of this section discusses the DFT-based computational results on the adsorption of dyes onto chitin in an aqueous solution. The emphasis is given to understanding the adsorption behavior of dyes onto chitin at the molecular level.
3.1 Characterization of chitin
Shrimp shells waste contains valuable components, that as chitin (24.23 %), a significant amount of protein (50.55 %), and minerals (20.34 %), as shown in Table 2. Therefore, to extract chitin from shrimp shells waste, the waste was treated with an aqueous solution of 1.M NaOH followed by 1 M HCl to eliminate the protein and mineral content. Those treatments significantly reduced protein and mineral content, leaving the adsorbent composed mainly of 95 % of chitin. The chitin yield obtained from the shrimp shell was approximately 10 g out of 50 g of dried shrimp shell waste, circa 20 %. The lower amount of chitin produced than the estimated (24 %) could be addressed due to loss during washing processes. Thus, care must be taken when washing the solid to avoid the loss of chitin.
Sample
Composition (%)
Protein
Mineral
Chitin
Moisture
Shrimp shell waste
50.55 ± 1.24
20.34 ± 0.86
24.23 ± 0.56
5.89 ± 0.12
Adsorbent
0.68 ± 0.05
1.30 ± 0.05
95 ± 3
0.11 ± 0.01
The obtained chitin was further characterized using several methods, such as FTIR, XRD, and SEM. The FTIR examination offers qualitative data on the functional groups present on chitin, such as hydroxyl (–OH) and amide (H—N—C⚌O). The FTIR spectra of chitin is shown in Fig. 1. Three peaks in the regions of 3480 and 3000 cm−1 were due to O—H and N—H stretching vibration. At the same time, two peaks at 2962 and 2928 cm-1 can be assigned to the C—H stretching vibrations of CH2 and CH3. Similar results have been reported in the literature (Ablouh et al., 2020), which explains that the vibrations for O—H, N—H, and C—H are in close occurrence with the band spectrums obtained in this study. The band of carbonyl C⚌O regions of the amides, between 1600 and 1500 cm−1, is of great importance because it could be used to distinguish α- and β-chitin. The FTIR spectra of the chitin show two amides I and II peaks. From the FTIR spectra, it could be observed that the amide I band was clearly divided into two peaks at 1659 and 1626 cm−1, specifying the vibration for α-chitin (Joseph et al., 2020, Pereira et al., 2014). The peak further specified the existence of α-chitin at 1558 cm−1 which corresponds to the N — H of the deformed amide II. The other two peaks at 1419 and 1377 cm−1 correspond to the asymmetrical deformation of the CH3 group and the stretching vibration of C — O, respectively. The FTIR spectra of the chitin examined in this study are similar to the result for α-chitin extracted from the shells of different organisms in previous studies (Abolghassem et al., 2019, Mohan et al., 2021). These results indicated that the chitin extracted from crustacean shell waste is in α-form.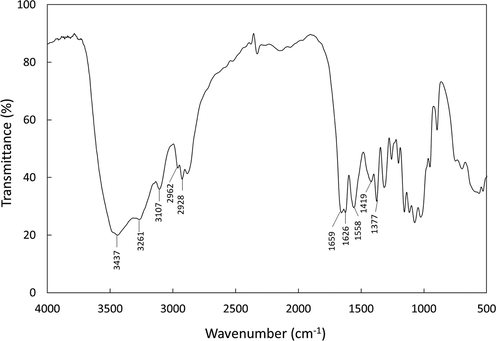
FTIR Spectra of the chitin extracted from shrimp shell waste.
Fig. 2 shows the XRD of chitin extracted from the shrimp shells waste. The XRD patterns of the extracted chitin show two sharp peaks around 9.5° and 19.5° that correspond to diffraction planes (0 2 0) and (1 1 0) of the crystal structure, respectively. Several weak peaks were noticed around 13°, 23°, and 26°. These peaks are characteristic of α-chitin (Goodrich and Winter, 2007, Kaya et al., 2015a, 2015b, 2015c). Thus, the XRD patterns support the result from FTIR, which demonstrated that the extracted chitin was α-chitin. Thus, for the discussion, the α-chitin is referred to the adsorbent prepared in this work.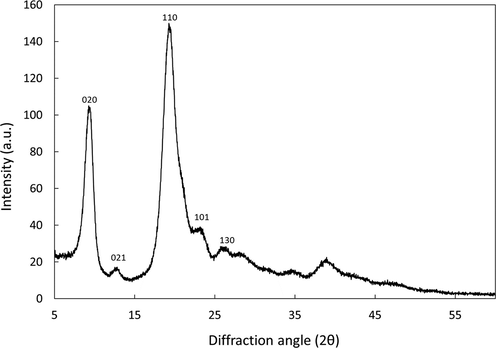
XRD of the α-chitin extracted from shrimp shell waste.
SEM has been a principal tool for portraying the surface morphology and essential physical properties of the adsorbent surface (Kaya et al., 2015a, 2015b, 2015c). It is clear from Fig. 3a that the prepared α-chitin possesses a rough and hard surface. Increasing the degree of magnification to 10000 × showed substantial numbers of pores and fibers, where there is a good possibility for dyes to be adsorbed and trapped in these pores.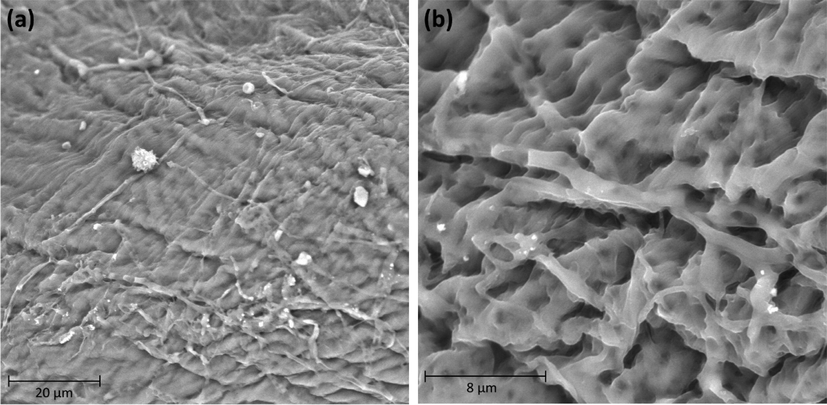
SEM of the α-chitin extracted from shrimp shell waste (a) 3000 × magnification and (b) 10000 × magnification.
To conclude, in this study, α-chitin could be obtained from shrimp shell waste with a high degree of purity. The FTIR and XRD showed that the obtained chitin was the α-chitin. The SEM pictures showed numerous pores that could be used to effectively adsorption of dye molecules on the adsorbent surface. Thus, the following section discusses the adsorption performance and behavior of dyes from aqueous solution onto chitin.
3.2 Adsorption
In this work, several factors that influence the adsorption of dyes onto adsorbents in an aqueous solution, such as contact time and initial concentration of dyes, were studied. The experimental data on the contact time could be used to determine the adsorption kinetics. In contrast, the isotherm adsorption could be estimated from the initial concentration of dyes. Those two parameters are crucial to evaluate the performance of adsorbents and elucidate the adsorption process.
Fig. 4 displays the influence of contact time on adsorption capacity. As shown, increasing contact time increases the amount of adsorbate, regardless of the studied dyes. However, it is interesting to highlight several different stages as adsorption takes place with increasing contact time. In the first stage, the adsorption capacity of Alizarin yellow R onto chitin was achieved rapidly, as high as 30 mg/g for the first 60 min. Increasing the contact time to 120 min leads to a slightly increased adsorbate amount onto chitin. In the last stage, a further increase of contact time to 150 min did not improve the adsorption capacity. It could be a sign that equilibrium was already established. A comparable trend of adsorption capacity against contact time was also observed for the other two dyes studied in this work. This trend could be explained as follows: in the beginning, the surface of chitin contains numerous vacant active sites that the dyes could occupy. Accordingly, in the first 60 min, the dyes could rapidly occupy the active site. Increasing contact time reduces the number of vacant sites, leading to the resistance to molecule diffusion. Consequently, the adsorption capacity decreased as observed experimentally. A similar observation was also observed for removing dyes using other biomass-based adsorbents (Bulut and Aydın, 2006, Yagub et al., 2012, Zhang et al., 2012).![Effect of contact time on the adsorption of dyes onto α-chitin [C0 = 250 mg/L, adsorbent dosage = 0.1 g, and temperature = 25 °C].](/content/184/2022/15/11/img/10.1016_j.arabjc.2022.104293-fig4.png)
Effect of contact time on the adsorption of dyes onto α-chitin [C0 = 250 mg/L, adsorbent dosage = 0.1 g, and temperature = 25 °C].
The kinetics of adsorption could be derived from the contact time dependence of adsorption capacity. Two kinetics models, namely the pseudo-first-order and the pseudo-second-order, were used to study the adsorption of dyes onto the chitin surface. The pseudo-first-order model adopts that the change rate of bound adsorbate over contact time is directly comparative to the change between equilibrium and current adsorption capacity (Han et al., 2011). In comparison, the pseudo-second-order model describes the adsorption process as a rate-limiting step that involves chemisorption. Accordingly, the data obtained from the contact time experiments were fitted to pseudo-first-order and pseudo-second-order kinetic models.
The pseudo-first-order equation described by the Lagergren kinetic equation was used in the linear form as (Lagergren, 1898):
Dyes
qe,exp
Pseudo-first order
Pseudo-second order
qe,pred
102 × k1
(min−1)
R2
qe,pred
103 × k2
(g/mg·min)
R2
Malachite green
25.92
23.45
4.64
0.8845
27.89
3.80
0.9991
Basic red 18
29.86
23.92
4.40
0.9748
32.81
2.80
0.9988
Alizarin yellow R
31.75
20.86
3.79
0.9890
34.65
2.70
0.9992
According to Equation (3), a linear plot of log (qe – qt) versus time at different initial dye concentrations could indicate if the adsorption process followed the pseudo-first-order kinetic model. It is, however, that the plot produces the R2 value varied between 0.8 and 0.98. It suggested that the dye adsorption process onto chitin did not follow the pseudo-first-order kinetic model. Furthermore, the calculated qe values using Equation (3) differ considerably from the value measured experimentally. Therefore, it confirms that the adsorption process of dyes onto α-chitin did not obey the pseudo-first-order kinetic model.
In the next step, the contact time dependence of adsorption capacity was fitted to the linear form of pseudo-second-order equation as follow:(Ho and McKay, 1999).
According to Equation (4), a plot of t/qt versus t should be linear if the adsorption follows the pseudo-second-order model. Fig. 5 shows the plot of t/qt versus t, whereas Table 3 presents the obtained k2, qe, and correlation coefficient values. As illustrated in Fig. 5, all the studied systems display a linear relationship between t/qt versus t. This observation is also observed by the excellence correlation coefficient R2 higher than 0.95. Furthermore, as shown in Table 3, the calculated qe using Equation (4) is close to the experimental qe values. It suggests that the adsorption of dyes onto chitin follows the pseudo-second-order kinetic model. Hence, the adsorption of dyes onto the α-chitin surface is most likely to be controlled by the chemisorption process (Yagub et al., 2014).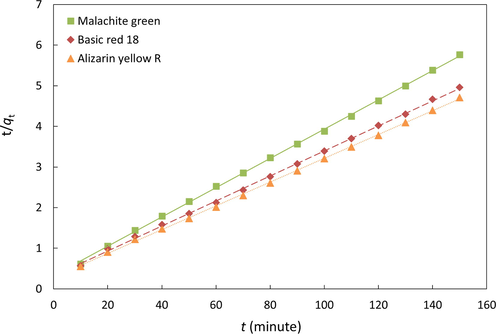
Pseudo-second-order kinetic model.
In addition to pseudo-first-order and pseudo-second-order kinetic models, the time dependence of adsorption capacity was also fitted to the equation proposed by Webber and Morris. This equation could be used to determine if intra-particle diffusion was the rate limit (Weber and Morris, 1963). The intra-particle diffusion is an empirical formula that correlates the square root of contact time and the amount of adsorbate as follows:
Based on Equation (5), the influence of intra-particle diffusion on the adsorption process could be determined when a linear plot is obtained between qt and t0.5. In addition, the linear plot point to that diffusion is the rate-limiting step if the plot passes through the origin and intercept C is zero. As shown in Fig. 6, the plot of qt and t0.5 produce three different linear lines for all the studied systems. It indicates three different stages involved in the adsorption of dyes onto α-chitin. The first stage refers to the rapid adsorption or external surface adsorption for up to 60 min. However, the linear portion does not pass through the origin, and the C is not equal to zero. It proposes that intraparticle diffusion is not the only rate-limiting mechanism in the adsorption process in this stage. In the second stage, the plot is nearly linear. However, it also does not pass through the origin. Lastly, the intra-particle diffusion began to diminish in the third stage, and the final equilibrium was attained. Thus, even though the plot qt and t0.5 produce three linear lines for each studied dyes, it does not pass through the origin, and the C is not equal to zero. Accordingly, it can be concluded that the adsorption of the studied dyes onto α-chitin does not follow intra-particle diffusion.![Plot of qt and t0.5 for the adsorption of dyes onto α-chitin [C0 = 250 mg/L, adsorbent dosage = 0.1 g, and temperature = 25 °C].](/content/184/2022/15/11/img/10.1016_j.arabjc.2022.104293-fig6.png)
Plot of qt and t0.5 for the adsorption of dyes onto α-chitin [C0 = 250 mg/L, adsorbent dosage = 0.1 g, and temperature = 25 °C].
3.3 Effect of initial concentration of dye and adsorption isotherm
The effect of initial dye concentration on adsorption capacity plays a vital part in understanding the adsorption behavior. It provides the essential driving force to overcome the mass transfer resistance between the dyes and α-chitin in an aqueous solution (Bulut and Aydın, 2006, Yagub et al., 2012, Zhang et al., 2012). In this study, a fixed amount of adsorbent, circa 0.1 g, was added to 25 ml of different concentrations of dyes solution from 50 to 250 mg/L to obtain adsorption capacity at equilibrium and removal efficiency versus initial dye concentration. As shown in Fig. 7, the number of dyes adsorbed increased with the increasing initial concentration of dye. This result could be addressed due to active sites available for the dyes to be adsorbed on chitin, thus increasing the adsorption capacity. However, an increase in the initial concentration of dyes has the opposite impact on removal efficiency. It could be attributed to the binding sites on chitin being saturated faster due to the upsurge in the number of competing dye molecules. At a low initial dye concentration, there is a high ratio of active sites to the number of dye molecules. Thus, the adsorbate could interact sufficiently with the active site on chitin resulting in higher removal efficiency. However, with increasing initial dye concentration, the number of active sites on the chitin surface is insufficient to facilitate the adsorbate, resulting in a decrease in the removal efficiency (Bulut and Aydın, 2006, Yagub et al., 2012, Zhang et al., 2012).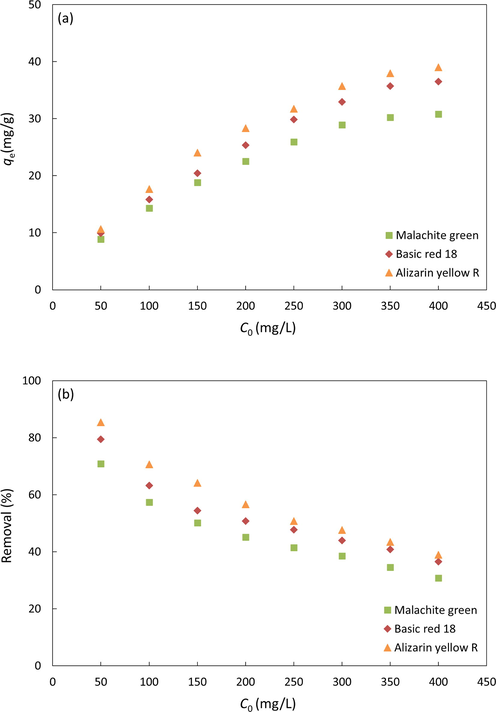
Effect of initial dye concentration on the adsorption of dye onto α-chitin.
The experimental data on the adsorption capacity at the different initial dye concentrations were then used to determine the adsorption isotherms. Adsorption isotherms can provide in-depth information on the interaction between adsorbates and adsorbents at various equilibrium concentrations. Three different isotherm models, namely Langmuir (Langmuir, 1916), Freundlich (Freundlich, 1906), and Temkin (Johnson and Arnold, 1995), have been used to fit the data to understand the adsorption process.
The Langmuir isotherm model assumes monolayer adsorbate coverage on an energetically identical homogenous adsorbent surface. The linear form of the Langmuir isotherm model form could be written as:
The Freundlich isotherm model is derived by assuming a heterogeneous surface with a non-uniform distribution of heat of adsorption over the surface. In its linear form, the Freundlich isotherm model can be written as follows:
The Temkin isotherm model is based on a uniform distribution of the binding energies, which considers the indirect interaction of adsorbate. The model assumes that the adsorption heat of molecules in the layer decreases linearly with the coating due to adsorbent-adsorbate interactions. The linear form of Temkin isotherm is given by Equation (8).
Table 4 list the parameters for each adsorption isotherm model at 298.15. Comparing the correlation coefficients for the studied system shows that Freundlich isotherm adsorption has the highest R2. It indicates that the Freundlich model was the most appropriate to describe the adsorption behavior of dyes onto the surface of α-chitin. It can be associated with the various functional groups and structures of chitin. It illustrates the heterogeneous surface of the adsorbent and the multiple layer adsorption that occurs on the surface of the adsorbent with irregular heat energy distribution (Tanhaei et al., 2020). The value of 1/n for Alizarin yellow R, Basic red 18, and Malachite green are 0.44, 0.43, and 0.38, which indicates the favorable adsorption of dyes (Al-Ghouti et al., 2005, Srivastava and Choubey, 2021).
Isotherm adsorption
Dyes
Malachite green
Basic red 18
Alizarin yellow R
Langmuir
qm (mg/g)
38.21
45.06
45.87
KL
0.0151
0.0158
0.0243
R2
0.9888
0.9731
0.9870
Freundlich
1/n
0.44
0.43
0.38
KF
2.7609
3.5340
5.0344
R2
0.9928
0.9917
0.9948
Temkin
br (J/mol)
308.57
278.48
290.27
KT
0.9942
0.9944
0.9965
R2
0.9759
0.9460
0.9728
3.4 Computational studies
Computational methods based on DFT are valuable tools for understanding the adsorption process better. The main goals of our computational study are to provide insight into the molecular mechanism that controls the adsorption of dye onto the α-chitin surface from an aqueous solution. The computational results were discussed based on the Highest Occupied Molecular Orbital (HOMO) and Lowest Unoccupied Molecular Orbital (LUMO). From the HOMO and LUMO energy, several FMO descriptors were then used to understand the dye- α-chitin adsorption sites. Finally, COSMO-RS was used to delve further into the dye-adsorbent interactions during the adsorption.
3.5 FMo
FMO theory applies the MO theory that describes HOMO and LUMO interactions (Fukui, 1982). Fig. 8 shows the HOMO and LUMO orbitals of the chitin and the studied dyes. Due to the enormous molecular weight, a tetramer of ((1 → 4)-2-acetamido-2-deoxy-β-d-glucan) was used as a model of α-chitin. This tetramer is deemed good enough to represent chitin as it consists of all functional groups in the adsorbent. As shown in Fig. 8, the HOMO density for chitin is localized throughout the terminal monomer. At the same time, the LUMO orbital is confined to the amide functional group at the other terminal monomer. It means that the terminal monomer of α-chitin is principally accountable for the adsorption centers due to electron delocalization.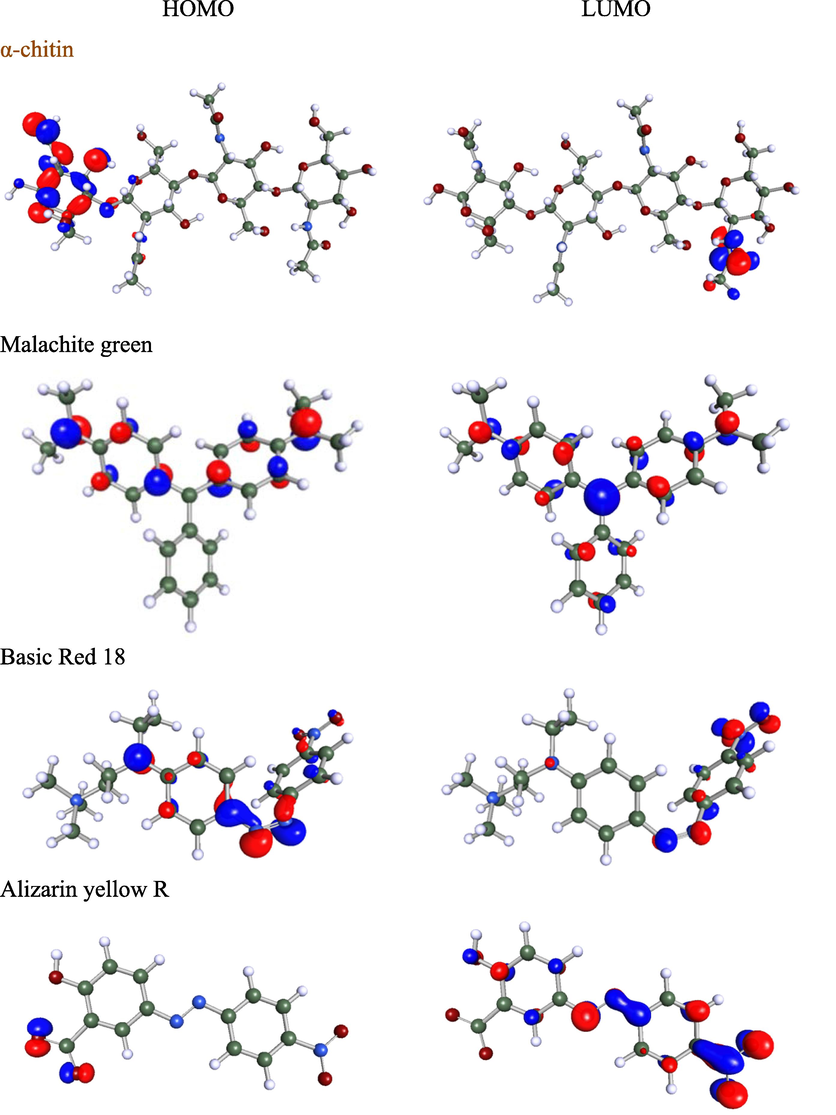
Molecular electrostatic potential (MEP) contour map, HOMO, and LUMO orbitals for α-chitin and studied dyes. The green, white, blue, and red balls indicate C, H, N, and O atoms.
Regarding the studied dyes, only the organic part was considered in the computational study. The remaining part of the dyes, such as Na+ and Cl- ions, do not affect the color and the adsorption behavior. As shown in Fig. 8, the HOMO orbital density for the Malachite green was distributed throughout the benzene rings, including their attached termini nitrogen atoms and excluding the nitrogen atom of the central ring. However, the LUMO was spread throughout the benzene rings and nitrogen atoms. A similar HOMO and LUMO distribution observation was also reported for the other triarylmethane by El Haouti et al. (El Haouti et al., 2019). The HOMO and LUMO were spread on the heteroatoms for the other two azo-based dyes. Thus, the heteroatoms are predicted as the main adsorption center of the dyes.
The FMO parameters derived from HOMO and LUMO can be used to study the global molecular reactivity of dye adsorbed on the chitin surface. The HOMO energy (EH) describes the electron-donating ability of the adsorbate molecule (Fukui, 1982). Accordingly, dye with a high EH value has a higher capability to donate electrons to appropriate adsorbents with low unfilled molecular orbital energy. Conversely, the LUMO energy (EL) designates the electron-accepting capability of the dye molecule. The lowest the EL value, the higher the capability of molecules to accept electrons. The calculated EL and EH energies are presented in Table 5. It was clear that all the studied dyes had similar EH values, whereas the EL varied among each other. It might indicate that their electron-accepting ability controls their adsorption onto the surface of chitin.
Malachite green
Basic red 18
Alizarin yellow R
EH (eV)
−5.186
−5.198
−5.172
EL (eV)
−3.700
−3.811
−4.039
ΔEgap (EV)
1.487
1.387
1.133
η (eV)
0.743
0.693
0.566
S (eV)
1.345
1.442
1.765
χ (eV)
4.443
4.504
4.605
μ (eV)
−4.443
−4.504
−4.605
ω (eV)
13.276
14.630
18.720
Based on the EL and EH, several quantum chemical parameters could be obtained, as follows (Fukui, 1982):
Based on the HOMO-LUMO energy gap (ΔEgap), Alizarin yellow R has the lowest value, followed by Basic red 18, and the highest is Malachite green. It indicates Alizarin yellow is the most reactive, whereas Malachite green is the least reactive. Another critical parameter is the electrophilicity index (ω), representing a degree of energy lowering due to maximal electron movement between donor and acceptor (Fukui, 1982). The high value of ɷ and chemical potential (µ) indicate a strong and more reactive electrophile (Parr et al., 1999). The values of the electrophilicity index for the studied dyes suggest that Alizarin yellow R is the strongest electrophile, whereas Malachite green is the weakest. It should be noted that the rank of HUMO-LUMO energy gap and electrophilicity index for the studied dyes is similar to their adsorption capacity. Therefore, it could be concluded that those two parameters govern the interaction of dyes during their adsorption onto the surface of α-chitin.
3.6 Cosmo-Rs
In order to get a better understanding of the type of interaction that rules the adsorption behavior of dyes onto α-chitin, a COSMO-RS simulation was then carried out. Fig. 9 shows the sigma profile of chitin and studied dyes. As a rule of thumb, the sigma profile is divided into three regions: (i) σ > 1 nm−2 represents the polar area related to the hydrogen bond donor-acceptor ability of the molecule, (ii) −1 < σ < 1 nm−2 indicates the non-polar area, and (iii) σ < -1 nm−2 represent the polar area related to the hydrogen bond donor capability. For the α-chitin molecule, the sigma profile spans the three regions, indicating the polar and non-polar properties of the adsorbent. The negative charge distribution pointing by red and yellow colors was located on the carboxyl functional group supporting their hydrogen bond acceptor ability. This region is the most appropriate for an electrophilic attack center. On the other polar region, the deep dark blue color assigned for the hydrogen of amino (N—H) and the hydroxyl (O—H) represents their capability as hydrogen bond donors. The green color of the charge distribution indicates the non-polar part of α-chitin that arises from the glucan ring.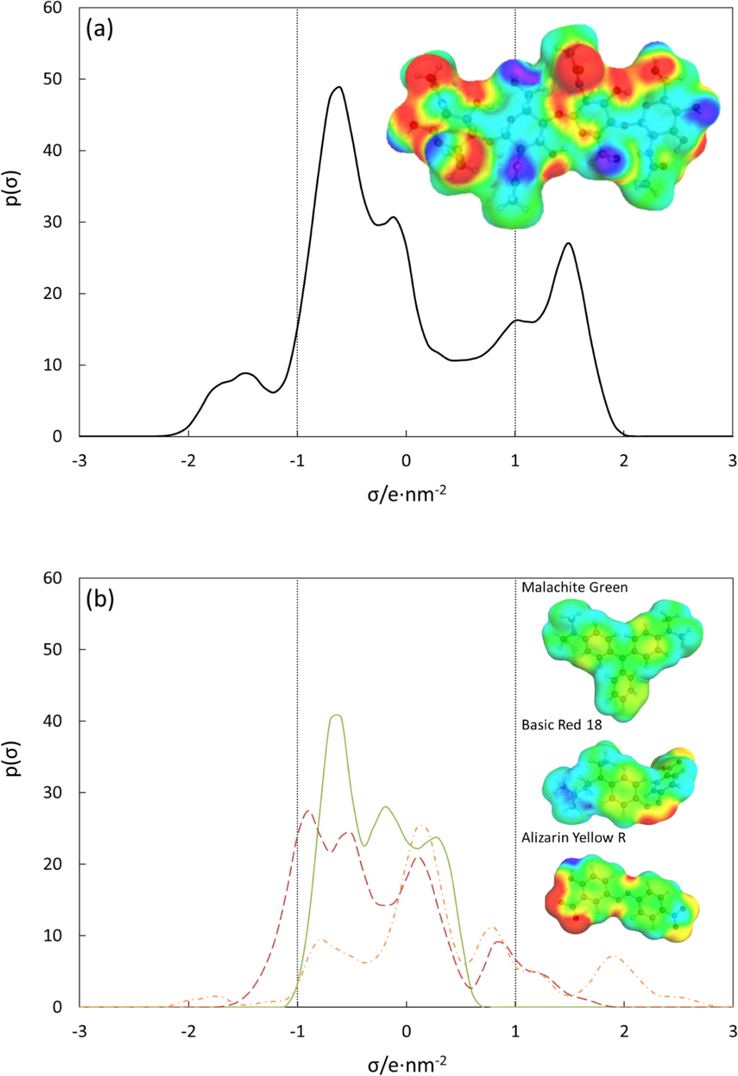
Sigma profile of (a) α-chitin and (b) dyes. Malachite green (full line), Basic red 18 (dashed line), and Alizarin yellow 18 (dashed and dotted line).
As shown in Fig. 9, the sigma profile of Malachite green spans primarily within the non-polar region and a small part in the hydrogen bond donor region. It suggests that the adsorption of Malachite green onto chitin might be ruled by the non-polar interaction with the adsorbent and scrawny hydrogen bond. Like Malachite green, the sigma profile of Basic red 18 is also centered in the non-polar region, with a shoulder-like peak near cut-off values. It suggests that non-polar interaction and, to some extent, the hydrogen bonding interaction with adsorbent govern the adsorption of Basic red 18. Interestingly, the sigma profile of Alizarin yellow R span powerfully throughout the three regions with a solid peak at 1.9 nm−2 and −1.8 nm−2, indicating its strong capability hydrogen bond acceptor and, to some extent, as a hydrogen bond donor. The ability of dyes to form a hydrogen bond could be addressed due to the presence of –NH2 and –OH functional groups of the adsorbent, as revealed from the FTIR spectrum. Thus, it could be predicted that the adsorption of Alizarin yellow R onto chitin is controlled by their ability to form hydrogen bonding with the adsorbent.
While the sigma profile provides information on qualitative interaction between the dyes and chitin, the excess enthalpy could give measurable values. Previous work has shown that the COSMO-RS model could identify the interaction that controls the adsorption of ionic liquids onto ZSM-5 (Kurnia et al., 2019). In COSMO-RS model, the total interaction energy (EINT) arise from three different specific interaction as follows (Kurnia and Coutinho, 2013):
Since the studied system is composed of dyes and α-chitin, Equation (15) can be rewritten as:
Fig. 10 presents the predicted excess enthalpy that can be used to infer the interaction between dyes and adsorbents (Kurnia and Coutinho, 2013, Kurnia et al., 2019). Fig. 10 shows that a favorable interaction between dyes and α-chitin arises from hydrogen bonding and Van der Waals forces. Meanwhile, the electrostatic-misfit contributed to the endothermicity of the system. The strong hydrogen bonding and Van der Walls forces of the dye-adsorbent system could cover up the energy loss due to repulsive interaction (positive electrostatic-misfit interaction). Interestingly, Fig. 10(a) displays that the contribution of α-chitin is almost similar for all studied dyes. On the opposite, the contribution of dyes is varied between each other. It indicates that the adsorbate might control the adsorption of dyes onto chitin. For Malachite green and Basic Red 18, it is evident from Fig. 10(b) that the Van der Waals forces of dyes contribute highly toward the adsorption of dyes onto chitin. At the same time, hydrogen bonding is the most significant interaction between Alizarin yellow R and chitin. Therefore, the COSMO-RS model could explain the interaction between dyes and α-chitin during adsorption.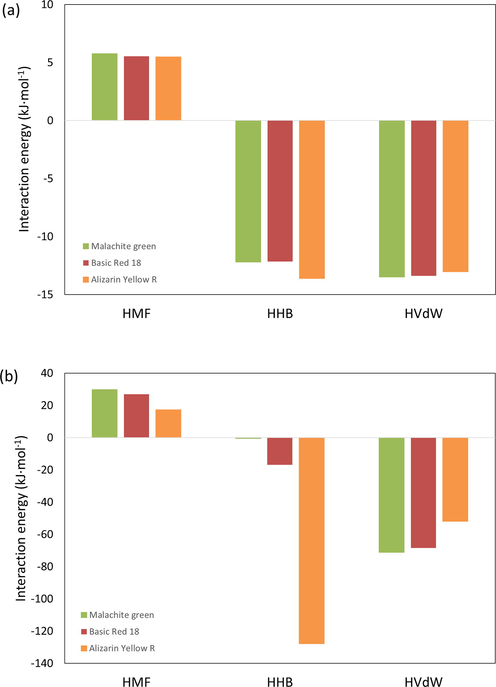
Interaction energy between dyes and chitin predicted using COSMO-RS at 298.15 as the contribution of (a) α-chitin and (b) dyes.
Thus, combining the computational result from FMO and COSMO-RS, the scenario for the adsorption of dyes onto α-chitin could be described as follows. For Malachite green, where the HOMO orbitals spread throughout the molecules, the adsorption onto chitin occurs due to the Van der Waals interaction between the non-polar part of the dyes and adsorbent. Meanwhile, when the hydrogen bonding interaction between the dyes and adsorbent occurs at the terminal part of chitin, where the HOMO and LUMO orbital reside. Therefore, as shown here, computational approaches could be used to get an insight into the molecular mechanism that controls the adsorption of dyes onto the adsorbent.
3.7 Comparison with other adsorbents
The chitin and its derivative, chitosan-based adsorbents, are regarded as one of the most efficient materials in wastewater treatment. It could be observed from Table 6 that pure chitin has higher efficiency in removing malachite green from an aqueous solution than chitosan. The abundant resources and modest preparation of chitin are still one of the attractive factors that make this adsorbent in removing dyes from aqueous solution. Another observation in Table 6 is that chitin and chitosan adsorption capability in powder or flake is low because of their crystallized structure. Subsequently, the adsorption only occurs on the amorphous part of the crystals, reducing the adsorption capacity (Vakili et al., 2014). Several modifications have been done to improve the adsorption capacity of chitin- and chitosan-based adsorbents. Nanochitosan and crab shell biochar seem to be the most promising chitin- and chitosan-based adsorbents. Therefore, further study should be directed in this way.
Adsorbent
qm (mg/g)
Ref
Malachite green
α-chitin
38.21
This work
Chitosan
4.40
(Sadiq et al., 2020)
Chitosan-ZnO
11
(Muinde et al., 2020)
Chitin hydrogels
29.5
(Tang et al., 2012)
Nanochitosan-STP
317.73
(Salamat et al., 2019)
Crab shell biochar
28,140
(Wu et al., 2022)
Basic red 18
α-chitin
45.06
This work
Chitosan-ethyl acrylate
158.7
(Sadeghi-Kiakhani et al., 2013)
Alizarin yellow R
α-chitin
45.87
This work
Sponge-like kaolin/chitosan (CS)/reduced graphene oxide
141.2
(Zhang et al., 2019)
4 Conclusions
The shrimp shell is a waste that can be used as a low-cost precursor of chitin to remove synthetic dyes from aqueous solutions. In this work, the removal of three synthetic dyes commonly used in the textile industry, namely Alizarin yellow R, Basic red 18, and Malachite green from aqueous solution onto chitin, was investigated in batch experiments and described by quantum chemical approaches. The FTIR and XRD analysis indicated that the obtained chitin from shrimp shells was α-chitin. At the same time, the SEM analysis revealed the existence of porous and fiber on the obtained chitin from shrimp shells. According to the results obtained when analyzing adjustment for the different models, the adsorption of dyes onto chitin follows pseudo-second-order models. Meanwhile, Freundlich gave a better fit for modeling the adsorption isotherms. The computational models support the relevance of the adsorption behavior of dyes onto chitin. The FMO indicated the most likely active sites for the adsorption, which are the terminal end of chitin and the heteroatoms of the dyes. This fact is supported by the FTIR result, which indicated the presence of –NH2 and –OH functional groups on the adsorbent. In addition, the calculated HOMO-LUMO energy gaps and electrophilic index of dyes have a similar rank with their adsorption behavior onto chitin. Meanwhile, COSMO-RS revealed that hydrogen bonding interaction was the main factor controlling Alizarin yellow R adsorption onto chitin. On the other hand, Van der Walls forces were the primary interaction that ruled Basic red 18 and Malachite green adsorption onto chitin.
5 Ethics Approval
Not available. In the course of work on this article, the authors did not conduct research on animals and humans in any form.
CRediT authorship contribution statement
Kiki Adi Kurnia: Conceptualization, Methodology, Formal analysis, Writing – original draft. Ardiani Putri Rahayu: Methodology, Investigation. Afifah Faradilla Islami: Methodology, Investigation. Yuly Kusumawati: Writing – review & editing, Funding acquisition. I Gede Wenten: Writing – review & editing. Anisa Ur Rahmah: Writing – review & editing. Saepurahman: Writing – review & editing. Diana Vanda Wellia: Writing – review & editing. Asep Saefumillah: Writing – review & editing.
Acknowledgment
This work was developed under the “Riset Kolaborasi Indonesia” program 2022 (reference number: 2328/IT1.BO7.1/KU.02/2022). KAK would like to acknowledge Institut Teknologi Bandung for the research contract with reference number 0676/IT1.B05/KP/2021.
Declaration of Competing Interest
The authors declare that they have no known competing financial interests or personal relationships that could have appeared to influence the work reported in this paper.
References
- Surface modification of α-chitin using an acidic treatment followed by ultrasonication: Measurements of their sorption properties. Int. J. Biol. Macromol.. 2020;151:492-498.
- [Google Scholar]
- Preparation of α-chitin-based nanocomposite as an effective biocatalyst for microwave aided domino reaction. Heliyon. 2019;5:e02036.
- [Google Scholar]
- Electronic structure calculations on workstation computers: The program system turbomole. Chem. Phys. Lett.. 1989;162:165-169.
- [Google Scholar]
- Recent advances in new generation dye removal technologies: novel search for approaches to reprocess wastewater. RSC Adv.. 2015;5:30801-30818.
- [Google Scholar]
- Thermodynamic behaviour and the effect of temperature on the removal of dyes from aqueous solution using modified diatomite: A kinetic study. J. Colloid Interface Sci.. 2005;287:6-13.
- [Google Scholar]
- Comparative performance of anodic oxidation and electrocoagulation as clean processes for electrocatalytic degradation of diazo dye Acid Brown 14 in aqueous medium. J. Hazard. Mater.. 2017;335:178-187.
- [Google Scholar]
- Textile wastewater treatment by AOPs for brine reuse. Process Saf. Environ. Prot.. 2017;109:420-428.
- [Google Scholar]
- The estimation of chitin and chitin nitrogen in crawfish waste and derived products. Analyst. 1950;75:185-189.
- [Google Scholar]
- Chitin isolation from crustacean waste using a hybrid demineralization/DBD plasma process. Carbohydrate Poly.. 2020;246
- [Google Scholar]
- A kinetics and thermodynamics study of methylene blue adsorption on wheat shells. Desalination. 2006;194:259-267.
- [Google Scholar]
- Current treatment technologies and mechanisms for removal of indigo carmine dyes from wastewater: A review. J. Mol. Liq.. 2020;318:114061
- [Google Scholar]
- Importance of Internal Porosity for Glucan Adsorption in Mesoporous Carbon Materials. Langmuir. 2015;31:7288-7295.
- [Google Scholar]
- Kinetics and Mechanism of Tartrazine Adsorption onto Chitin and Chitosan. Ind. Eng. Chem. Res.. 2012;51:6862-6868.
- [Google Scholar]
- COSMOtherm Version C30 Release 18 COSMOlogic GmbH & Co. KG, Leverkusen: Germany; 2018.
- Cationic dyes adsorption by Na-Montmorillonite Nano Clay: Experimental study combined with a theoretical investigation using DFT-based descriptors and molecular dynamics simulations. J. Mol. Liq.. 2019;290:111139
- [Google Scholar]
- Extraction, chemical modification and characterization of chitin and chitosan. Int. J. Biol. Macromol.. 2018;120:1181-1189.
- [Google Scholar]
- Natural waste materials containing chitin as adsorbents for textile dyestuffs: Batch and continuous studies. Water Res.. 2005;39:4142-4152.
- [Google Scholar]
- The Role of Frontier Orbitals in Chemical Reactions (Nobel Lecture) Angew. Chem., Int. Ed. Engl.. 1982;21:801-809.
- [Google Scholar]
- Development of a chitin/graphene oxide hybrid composite for the removal of pollutant dyes: Adsorption and desorption study. Chem. Eng. J.. 2015;280:41-48.
- [Google Scholar]
- α-Chitin Nanocrystals Prepared from Shrimp Shells and Their Specific Surface Area Measurement. Biomacromolecules. 2007;8:252-257.
- [Google Scholar]
- Nanofiltration membrane cross-linked by m-phenylenediamine for dye removal from textile wastewater. Polym. Adv. Technol.. 2019;30:360-367.
- [Google Scholar]
- Adsorption characteristics of methylene blue onto low cost biomass material lotus leaf. Chem. Eng. J.. 2011;171:1-8.
- [Google Scholar]
- Evaluation of sono-electrocoagulation for the removal of Reactive Blue 19 passive film removed by ultrasound. Sep. Purif. Technol.. 2016;165:107-113.
- [Google Scholar]
- Pseudo-second order model for sorption processes. Process Biochem.. 1999;34:451-465.
- [Google Scholar]
- Adsorption of methyl orange onto protonated cross-linked chitosan. Arabian J. Chem.. 2017;10:24-32.
- [Google Scholar]
- Adsorption of Methylene Blue on Bituminous Coal: Adsorption Mechanism and Molecular Simulation. ACS Omega. 2019;4:14032-14039.
- [Google Scholar]
- Adsorption of acid yellow dye on flakes of chitosan prepared from fishery wastes. Arabian J. Chem.. 2011;4:389-395.
- [Google Scholar]
- The temkin isotherm describes heterogeneous protein adsorption, Biochimica et Biophysica Acta (BBA) -. Protein Structure and Molecular Enzymology. 1995;1247:293-297.
- [Google Scholar]
- Extraction of nanochitin from marine resources and fabrication of polymer nanocomposites: Recent advances. Polymers. 2020;12:pp.
- [Google Scholar]
- First chitin extraction from Plumatella repens (Bryozoa) with comparison to chitins of insect and fungal origin. Int. J. Biol. Macromol.. 2015;79:126-132.
- [Google Scholar]
- Comparison of chitin structures isolated from seven Orthoptera species. Int. J. Biol. Macromol.. 2015;72:797-805.
- [Google Scholar]
- Fluctuation in physicochemical properties of chitins extracted from different body parts of honeybee. Carbohydr. Polym.. 2015;132:9-16.
- [Google Scholar]
- Adsorption of methylene blue cationic dye onto brookite and rutile phases of titanium dioxide: Quantum chemical and molecular dynamic simulation studies. Inorg. Chem. Commun.. 2021;129:108659
- [Google Scholar]
- A combined molecular dynamic simulation, DFT calculations, and experimental study of the eriochrome black T dye adsorption onto chitosan in aqueous solutions. Int. J. Biol. Macromol.. 2021;166:707-721.
- [Google Scholar]
- Shree Bharti, Acute toxicity of textile dye Methylene blue on growth and metabolism of selected freshwater microalgae. Environ. Toxicol. Pharmacol.. 2021;82:103552
- [Google Scholar]
- Overview of the Excess Enthalpies of the Binary Mixtures Composed of Molecular Solvents and Ionic Liquids and Their Modeling Using COSMO-RS. Ind. Eng. Chem. Res.. 2013;52:13862-13874.
- [Google Scholar]
- Understanding the adsorption of ionic liquids onto zeolite ZSM-5 from aqueous solution: experimental and computational modelling. PCCP. 2019;21:24518-24526.
- [Google Scholar]
- About the Theory of So-Called Adsorption of Soluble Substances. Kungliga Svenska Vetenskapsakademiens Handlingar 1898:1-39.
- [Google Scholar]
- The constitution and fundamental properties of solids and liquids. Part 1. Solids. J. Am. Chem. Soc.. 1916;38:2221-2295.
- [Google Scholar]
- Unraveling flux behavior of superhydrophilic loose nanofiltration membranes during textile wastewater treatment. J. Membr. Sci.. 2015;493:690-702.
- [Google Scholar]
- Adsorption of Reactive Blue 19 from aqueous solution by chitin nanofiber-/nanowhisker-based hydrogels. RSC Adv.. 2018;8:15804-15812.
- [Google Scholar]
- Textile Wastewater Dyes: Toxicity Profile and Treatment Approaches. In: Bharagava R.N., Chowdhary P., eds. Emerging and Eco-Friendly Approaches for Waste Management. Singapore: Springer Singapore; 2019. p. :219-244.
- [Google Scholar]
- Simultaneous degradation of anionic and cationic dyes from multi-dye systems using falling film photoreactor: performance evaluation, kinetic and toxicity analysis. J. Environ. Chem. Eng.. 2020;8
- [Google Scholar]
- Microbial decolourisation and degradation of textile dyes. Appl. Microbiol. Biotechnol.. 2001;56:81-87.
- [Google Scholar]
- Synthesis, Characterization, and Utilization of a Lignin-Based Adsorbent for Effective Removal of Azo Dye from Aqueous Solution, ACS. Omega. 2020;5:2865-2877.
- [Google Scholar]
- A study on structural comparisons of α-chitin extracted from marine crustacean shell waste. Carbohydrate Polymer Technologies and Applications. 2021;2:100037
- [Google Scholar]
- Adsorption of malachite green dye from aqueous solutions using mesoporous chitosan–zinc oxide composite material. Environmental Chemistry and Ecotoxicology. 2020;2:115-125.
- [Google Scholar]
- Advanced Oxidation Processes in Water/Wastewater Treatment: Principles and Applications. A Review, Critical Reviews in Environmental Science and Technology. 2014;44:2577-2641.
- [Google Scholar]
- Removal of model cationic dye by adsorption onto poly(methacrylic acid)/zeolite hydrogel composites: Kinetics, equilibrium study and image analysis. Sep. Purif. Technol.. 2014;122:384-394.
- [Google Scholar]
- The impact of the different types of acid solution on the extraction and adsorption performance of chitin from shrimp shell waste. Int. J. Biol. Macromol.. 2022;194:843-850.
- [Google Scholar]
- Preparation of chitosan-ethyl acrylate as a biopolymer adsorbent for basic dyes removal from colored solutions, Journal of Environmental. Chem. Eng.. 2013;1:406-415.
- [Google Scholar]
- Adsorption and desorption of malachite green by using chitosan-deep eutectic solvents beads. Int. J. Biol. Macromol.. 2020;164:3965-3973.
- [Google Scholar]
- Preparation of nanochitosan-STP from shrimp shell and its application in removing of malachite green from aqueous solutions. J. Environ. Chem. Eng.. 2019;7:103328
- [Google Scholar]
- Recent advances in the treatment of dye-containing wastewater from textile industries: Overview and perspectives. Process Saf. Environ. Prot.. 2020;143:138-163.
- [Google Scholar]
- Bacterial decolorization and degradation of azo dyes: A review. J. Taiwan Inst. Chem. Eng.. 2011;42:138-157.
- [Google Scholar]
- Overview of wastewater treatment methods with special focus on biopolymer chitin-chitosan. Int. J. Biol. Macromol.. 2019;121:1086-1100.
- [Google Scholar]
- Adsorption of industrial dyes on functionalized and nonfunctionalized asphaltene: A combined molecular dynamics and quantum mechanics study. J. Mol. Liq.. 2021;337:116433
- [Google Scholar]
- Investigation of adsorption of organic dyes present in wastewater using chitosan beads immobilized with biofabricated CuO nanoparticles. J. Mol. Struct.. 2021;1242:130749
- [Google Scholar]
- Rational design and synthesis of chitosan–quinoa polysaccharide composite aerogel and its adsorption properties for Congo red and methylene blue. New J. Chem.. 2021;45:9829-9837.
- [Google Scholar]
- Adsorption isotherms and kinetics studies of malachite green on chitin hydrogels. J. Hazard. Mater.. 2012;209–210:218-225.
- [Google Scholar]
- Efficient carbon interlayed magnetic chitosan adsorbent for anionic dye removal: Synthesis, characterization and adsorption study. Int. J. Biol. Macromol.. 2020;164:3621-3631.
- [Google Scholar]
- Synthetic organic dyes as contaminants of the aquatic environment and their implications for ecosystems: A review. Sci. Total Environ.. 2020;717:137222
- [Google Scholar]
- Typical low cost biosorbents for adsorptive removal of specific organic pollutants from water. Bioresour. Technol.. 2015;182:353-363.
- [Google Scholar]
- Application of chitosan and its derivatives as adsorbents for dye removal from water and wastewater: A review. Carbohydr. Polym.. 2014;113:115-130.
- [Google Scholar]
- Kinetics of Adsorption on Carbon from Solution. Journal of the Sanitary Engineering Division. 1963;89:31-60.
- [Google Scholar]
- Highly efficient and ultra-rapid adsorption of malachite green by recyclable crab shell biochar. J. Ind. Eng. Chem.. 2022;113:206-214.
- [Google Scholar]
- Equilibrium, Kinetics, and Thermodynamics of Methylene Blue Adsorption by Pine Tree Leaves. Water Air Soil Pollut.. 2012;223:5267-5282.
- [Google Scholar]
- Dye and its removal from aqueous solution by adsorption: A review. Adv. Colloid Interface Sci.. 2014;209:172-184.
- [Google Scholar]
- Molecular Dynamics Simulations of Adsorption of Catechol and Related Phenolic Compounds to Alumina Surfaces. J. Phys. Chem. C. 2015;119:7721-7731.
- [Google Scholar]
- Self-assembly of sponge-like kaolin/chitosan/reduced graphene oxide composite hydrogels for adsorption of Cr(VI) and AYR. Environ. Sci. Pollut. Res.. 2019;26:28898-28908.
- [Google Scholar]
- Kinetic, isotherm, and thermodynamic studies of the adsorption of methyl orange from aqueous solution by chitosan/alumina composite. J. Chem. Eng. Data. 2012;57:412-419.
- [Google Scholar]
- Recent advances for dyes removal using novel adsorbents: A review. Environ. Pollut.. 2019;252:352-365.
- [Google Scholar]


