

Translate this page into:
Simultaneous determination of four sedative-hypnotics in human urine based on dendritic structured magnetic nanomaterials
⁎Corresponding author. tangjuan@hebmu.edu.cn (Tangjuan Zhao)
-
Received: ,
Accepted: ,
This article was originally published by Elsevier and was migrated to Scientific Scholar after the change of Publisher.
Peer review under responsibility of King Saud University.
Abstract
A magnetic solid-phase extraction technique based on magnetic dendritic structured nanoparticles (Fe3O4@SiO2-NH2-G5) as adsorbent coupled with ultra-high performance liquid chromatography tandem mass spectrometry (UHPLC-MS/MS) has been developed to detect diazepam, midazolam, zolpidem, and zaleplon in human urine. With Fe3O4@SiO2-NH2 as the central core, dendrimer (G5) grafted alternately with cyanuric chloride and imidazole were bonded to the surface of the core to synthesize Fe3O4@SiO2-NH2-G5. The morphology and structure of the magnetic materials were characterized by transmission electron microscopy (TEM), Fourier transform infrared spectroscopy (FT-IR), X-ray diffraction (XRD), vibrating sample magnetometer (VSM), and dynamic light scattering (DLS). The key parameters affecting the extraction efficiency were optimized. A satisfactory performance was obtained under the optimum extraction conditions. The proposed method was validated, and the limits of detection of zaleplon, diazepam, zolpidem, and midazolam were 0.05, 0.05, 0.02, and 0.02 ng mL−1, respectively. The linear correlation coefficients r of the four analytes were > 0.996, the intra-day precision was between 2.4 % and 9.4 % with the recoveries between 88.3 % and 104.8 %, and the inter-day precision ranged from 3.9 % to 15.2 % with the recovery in the range of 94.1 %−108.3 %. The magnetic dendritic structure nanomaterial Fe3O4@SiO2-NH2-G5 was successfully used to extract sedative-hypnotic drugs from human urine samples. The Fe3O4@SiO2-NH2-G5-based magnetic solid-phase extraction method eliminates centrifugation and filtration steps as in conventional extraction. Only one step of vortex dispersion extraction could achieve the separation and purification of the target compounds. The proposed method was simple, rapid, environment-friendly, and suitable for the analysis of sedative-hypnotic drugs in human urine.
Keywords
Magnetic solid-phase extraction
Dendritic structured nanomaterials
Ultra-high performance liquid chromatography tandem mass spectrometry
Sedative-hypnotics
Human urine

1 Introduction
Diazepam, a long-acting benzodiazepine (BZDs), is the most commonly used drug to treat sleep-related disorders in China. Midazolam, a short-acting BZDs, is clinically favored because of its ability to rapidly induce sleep without any hangover and other after-effects. Although zolpidem and zaleplon, also known as “Z-hypnotics”, are structurally different from BZDs, their mechanism of action is similar to that of BZDs in that they act as central depressants by enhancing γ-aminobutyric acid (GABA)-ergic neurotransmission function and synaptic inhibition (European Monitoring Centre for Drugs, 2016). In recent years, worldwide sales of Z-hypnotics have been on the rise, with zolpidem being the most widely used Z-hypnotic. The four drugs are generally well tolerated, with common adverse effects such as memory disturbance, sleepiness, and sedation, and have the risk of unsafe road events and suicide in depressed patients. Their illegal sale can also induce robbery, sexual assault, and other criminal acts (Pettersson Bergstrand et al., 2016; Manchester et al., 2018). The abuse of sedative-hypnotic drugs is one of the most serious social problems in the world. Forensic and emergency medicine urgently needs to develop a simple, rapid, and sensitive analytical method to detect sedative-hypnotic drugs in humans for differential diagnosis, treatment, and forensic analysis of drug intoxication (Jones et al., 2012; Johnson-Davis et al., 2016; Rasanen et al., 2000).
However, the complex matrix of biological samples with low levels of target compounds, especially midazolam, zolpidem, and zaleplon with short half-lives and rapid drug clearance in vivo, making their detection more difficult. Therefore, there is a need for the development of a pretreatment method that can effectively isolate and purify the target compounds for analysis. The accuracy and reliability of the analytical results are determined by the effectiveness of the pretreatment (An et al., 2021). An ideal pretreatment method should be simple, rapid, sensitive, specific, and suitable to detect a large number of clinical samples or for routine analysis.
Several pretreatment methods have been developed for the extraction of BZDs from biological samples. Protein precipitation (Wessels et al., 2021), liquid–liquid extraction (LLE) (Jang et al., 2013), and solid-phase extraction (SPE) (Sofalvi et al., 2020) are usually used for pretreatment, but these traditional techniques are usually tedious and time-consuming. These complicated procedures not only cause the loss of the analyzed sample but also increase the chance of sample contamination which is a major source of error. Although the extraction efficiency has significantly improved by microwave-assisted extraction (Fernández et al., 2010; Woźniakiewicz et al., 2015), it is still essentially a liquid–liquid extraction with high consumption of organic reagents. In the past two decades, miniaturization techniques have attracted attention, and researchers have tried to develop high-throughput, low-solvent, and environment-friendly extraction techniques. Solid-phase microextraction (Walles et al., 2004; Mullett et al., 2002) and microextraction by packed sorbent (Ares-Fuentes et al., 2021; An et al., 2021; Magrini et al., 2016) are novel microextraction techniques with recoveries comparable to that by conventional SPE and less organic solvent use, but they still involve tedious operational steps. Hollow fiber-supported liquid-phase microextraction (Nazaripour et al., 2016) uses less solvent and is environmentally friendly, but it still has a longer extraction time of at least 30 min, which cannot meet the needs of rapid drug screening. Stir bar sorptive Extraction (Ahmad et al., 2019) is a high throughput and effective method, albeit with low recovery, and the coating tends to fall off. Dispersive liquid–liquid microextraction has the advantages of high enrichment capacity, short extraction time, and low cost, but the choice of extraction solvents for DLLME is limited; in addition, it may not be easy to form dispersions while analyzing biological samples. For the sample preparation process, dispersive solid-phase microextraction (D-µ-SPE) (Fernández et al., 2013; Fisichella et al., 2015) is favored because of its simplicity, rapidity, and efficiency. This technique disperses the sorbent into the solvent and increases the contact area with the target; thus, accelerating the arrival of sorption equilibrium and improving the extraction efficiency. Compared to DLLME, the D-µ-SPE (Asgharinezhad et al., 2014) technique can utilize a wide variety of solids and is highly versatile.
Magnetic-solid phase extraction (MSPE) is a dispersive solid-phase extraction technique that uses magnetic or magnetizable materials as sorbents (Duan et al., 2018; Xi et al., 2021; Zhang et al., 2021). The magnetic particles in the magnetic material are paramagnetic; therefore, the solution is separated from the target material by means of an external magnetic field. Compared to traditional extraction methods, this method does not require operational steps such as centrifugation, filtration, and concentration, and also circumvents the activation and column loading steps of the traditional solid-phase extraction methods, making it simple, efficient, time-saving, and environment-friendly technology (Qin, et al., 2021; Li, et al., 2020; Xiao, et al., 2017). In recent years, magnetic solid-phase extraction pretreatment techniques have shown good potential for application in analytical fields such as food, environment, and biology (Manousi et al., 2020; Yin et al., 2021).
The aim of this study was to develop a rapid and efficient MSPE method combined with liquid chromatography-mass spectrometric detection for the separation and analysis of diazepam, midazolam, zolpidem, and zaleplon in biological samples. In this study, a novel magnetic nanocomposite with dendritic structures have been successfully synthesized and used to isolate and purify the four hypnotics from human urine. The extraction reached equilibrium within a few minutes, and the desorbed solvent could be injected directly into the chromatographic mass spectrometry system, within a short extraction time, and fast analysis.
2 Experimental
2.1 Apparatus and test samples
The apparatuses used in this study were AB Sciex Triple Quad 5500 triple quadrupole tandem mass spectrometer (AB, USA), SHIMADZU LC-30AD ultra-high performance liquid chromatography system (Shimadzu, Japan), KQ3200E ultrasonic cleaner (Kunshan Ultrasonic Instruments Co., ltd., China), AB204-S standard type analytical balance (METTLER, Switzerland) TOLEDO), MIUL AB vortex mixer (Hangzhou Mio Instruments Co., ltd., China), Heal Force SMART-N high purity water machine (Shanghai Likang Instruments Co., ltd., China), JEM-2100F transmission electron microscope (Tokyo, Japan), Nicolet IS50 Fourier transform infrared spectrometer (FT-IR) (ThermoFisher Scientific, USA), Bruker D8 Advance Powder X-ray diffractometer (XRD, Bruker, Germany), Lake Shore 7407 vibrating sample magnetometer (VSM, Lakeshore, USA), and dynamic light scattering technique (DLS, Malvern Zetasizer Nano ZS90, UK).
Analytical reference standards of diazepam (purity: 99.2 %), midazolam (purity: 99.9 %), zaleplon (purity: 99.8 %), zolpidem (purity: 99.7 %) were purchased from National Institutes for Food and Drug Control (Beijing, China). Internal standard diazepam-D5 (1.0 mg mL−1 in 1 mL Methanol) and 3-Aminopropyltriethoxysilane (APTES) were purchased from Sigma-Aldrich Chemical Co., ltd (Shanghai, China). Methanol, acetonitrile, formic acid and ammonia solution (Fisher Chemical Company, Pittsburgh, PA) are all HPLC grade. Hydrochloric acid was obtained from Dikma Technologies (Beijing, China). Ferric chloride hexahydrate (FeCl3·6H2O), anhydrous ethanol, tetraethoxysilane (TEOS), sodium acetate anhydrous (NaAc), and tetrahydrofuran (THF) were purchased from Tianjin Kermel Chemical Reagent Co., ltd (Tianjin, China). Diisopropylethylamine (DIPEA) was obtained from J&K Scientific ltd (Shanghai, China). Ethylene glycol (EG), cyanuric chloride (CC), dichloromethane and polyethylene glycol (PEG-4000) were brought from Chengdu Aikeda Chemical Reagent Co., ltd (Chengdu, China). Imidazole (IMI) was supplied by Shanghai Aladdin Biochemical Technology Co., ltd (Shanghai, China).
2.2 Chromatographic-mass spectrometric conditions
2.2.1 Chromatography conditions
The chromatographic separation was carried on a column (Waters ACQUITY UPLC BEH C18; dimensions 1.7 µm, 2.1 × 100 mm), with mobile phase A: aqueous solution containing 0.1 % ammonia; mobile phase B: acetonitrile containing 0.1 % ammonia; gradient elution for 0–0.5 min, 25 % B; 0.5–2.5 min, 25–90 % B, 2.5–4.0 min, 90 % B, 4.0–4.01 min, 90–25 % B. The system was re-equilibrated with 25 % B for 2.99 min before the next sample run. The flow rate was 0.3 mL min−1, column temperature was 40 °C, and the injection volume was 5 µL.
2.2.2 Conditions for mass spectrometry
We used electrospray ion source (ESI source), positive ion mode, multiple reaction monitoring (MRM); curtain gas (N2, CUR): 35 psi, collisionally activated dissociation (CAD): 8 psi, IonSpray voltage (IS): 5500 V, temperature: 650 °C, ion source gas 1 pressure (N2, GS1): 65 psi, ion source gas 2 pressure (N2, GS2): 65 psi, entrance voltage (EP): 10 V, and collision cell exit potential (CXP): 14 V. The monitored ions of the analyte and parameters such as scan time, declustering voltage, and collision voltage are shown in Table 1.
Compounds
Precursor ion (m/z)
Product ion (m/z)
Dwell time (ms)
DP/V
CE/V
diazepam
285.1
193.1
50
60
41
285.1
154.1
50
50
41
midazolam
326.1
291.2
50
222
37
326.1
244.1
50
222
34
zolpidem
308.2
263.1
50
90
34
zaleplon
306.2
236.1
50
100
38
306.2
264.1
50
160
30
diazepam-D5
289.79
197.82
50
60
41
289.79
153.79
50
50
41
2.3 Preparation of magnetic nanomaterials
The solvothermal method (Deng et al., 2005; Zhao et al., 2021) was applied in preparation of Fe3O4 magnetite nanoparticles. Fe3O4@SiO2-NH2 was synthesized by using TEOS and APTES to form silica coating and amine groups to modify the external surface of Fe3O4 (Zhao et al., 2021; Shao et al., 2012). Subsequently, dendrimers were introduced onto the surface of Fe3O4@SiO2-NH2 based on the previous report (Zhao et al., 2021; Wang et al., 2010). Briefly, A 0.3 mol L−1 CC solution was firstly prepared by adding 1.25 g of CC and 2.5 mL of DIPEA to 25 mL of THF, and a 0.4 mol/L IMI solution was prepared by adding 0.68 g of IMI to 25 mL of THF. Then, 200 mg of Fe3O4@SiO2-NH2 was dispersed in the prepared CC solution and shaken 24 h at 30 °C. Subsequently, the products were washed with methanol, dichloromethane, and THF respectively with the help of external magnetic field. The obtained products were dispersed in the 0.4 mol L−1 IMI solution and shaken at 30 °C. After 24 h, the first generation (G1) was obtained and washed as described above. The product was denoted as Fe3O4@SiO2-NH2-G1. The second (Fe3O4@SiO2-NH2-G2) to fifth (Fe3O4@SiO2-NH2-G5) generation dendrimers were prepared following the preparation process of G1 (Fig. 1).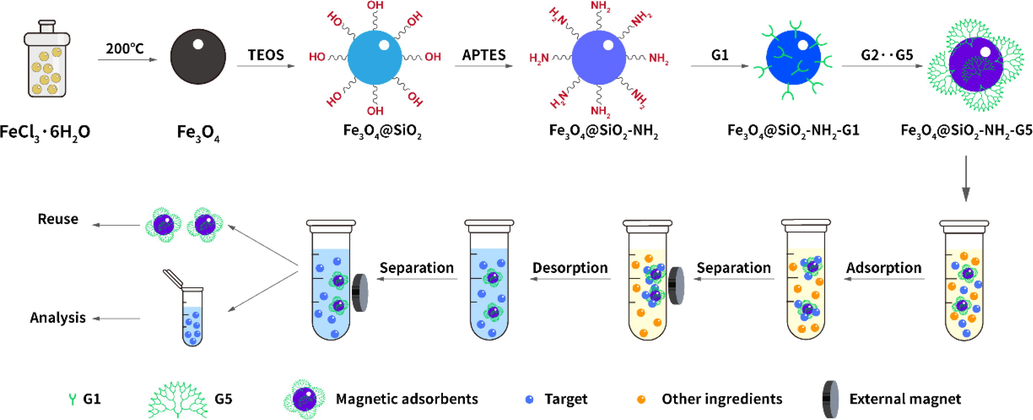
Schematic of preparation for Fe3O4@SiO2-NH2-G5 and its application in MSPE program.
2.4 Preparation of standard solutions and samples
2.4.1 Preparation of the standard solutions
Each standard was weighed separately and placed in a 10 mL flask. These were then dissolved with methanol, diluted to scale to obtain the stock solutions of diazepam, midazolam maleate, zolpidem tartrate, and zaleplon at 1 mg mL−1, and stored in a refrigerator at − 20 °C.
The stock solution was then accurately prepared with methanol at a concentration of 1000 ng mL−1 and serially diluted to 500, 250, 100, 50, 25, 10, 5, 2.5, 1, and 0.5 ng mL−1 as the working solution. An appropriate volume of 1 mg mL−1 of diazepam-D5 solution was precisely aspirated and diluted to 100 ng mL−1, and used as the internal standard solution.
2.4.2 Preparation of urine samples
To prepare a spiked urine sample, human blank urine (900 µL) was added to a 1.5 mL centrifuge tube containing 100 µL of mixed control working solution, and 100 µL of internal standard solution and 10 µL of 2.2 % ammonia solution were subsequently added and vortexed for 15 s.
About 12 mg of Fe3O4@SiO2-NH2-G5 was added to a 0.5 mL centrifuge tube containing 200 µL of urine sample, incubated for 2 min, and centrifuged instantly. Magnetic nanoparticles were then separated from the solution using a magnetic rack. The supernatant was discarded, and 200 µL of methanol/acetonitrile (v:v = 1:1) was added to the tube and vortexed for 30 s. Then, 5 µL of the resulting eluent was injected into the chromatographic system (Fig. 1).
Urine samples were collected from healthy volunteers from Hebei General Hospital. All experiments were performed in compliance with relevant laws and institutional guidelines and were approved by the ethics committee at Hebei General Hospital. Informed consents were obtained from human participants of this study.
2.5 Methods
The method was fully validated according to guidelines for quantitative analysis of biological samples of Chinese Pharmacopoeia.
2.5.1 Selectivity
To evaluate the interferences, six blanks of urine from different sources were injected separately for analysis. When the response of the interfering component was less than 20 % of the lower limit of quantification (LLOQ) of the analyte’s response and less than 5 % of the internal standard’s response, the endogenous substance was considered to have no effect on the detection of the analyte.
2.5.2 Standard curve and estimation of limit of quantification and limit of detection
In addition to blanks and zero concentration samples, at least six calibration concentrations were used. The concentration of the back-calculated calibration standard sample should generally be within ± l5% of the indicated value, and within ± 20 % at LLOQ.
A certain amount of blank urine was mixed with the above series of mixed control solutions to make a spiked urine sample of 0.05, 0.1, 0.25, 0.5, 1, 2.5, 5, and 10 ng mL−1 concentrations of the analyte. The internal standard solution was further added, and the urine sample was processed according to section 2.4.2 to prepare the test solution. Under the detection conditions mentioned in section 2.2, 5 µL of the test solution was loaded for analysis, and the peak area was recorded. The concentration of the analyte was used as the horizontal coordinate (x), and the ratio of the peak area of the analyte to that of the internal standard was the vertical coordinate (y), and the regression was performed by weighted (w = 1/x2) least-squares method.
The lowest concentration of the sample with S/N ≥ 10 meeting both accuracy and precision requirements (i.e., using five replicate samples, the RSD of its precision within 20 %, and the error within ± 20 % of the reference value) was used as the LLOQ, which was the lowest point of linearity. A series of samples with known concentrations close to the lowest concentration was added for detection, and a section of the baseline near the analyte peak was selected as a reference to calculate the signal-to-noise ratio (S/N) of the selected peak; the lowest concentration of the sample at S/N ≥ 3 was the limit of detection (LOD.).
2.5.3 Precision and accuracy
Five quality control (QC) samples, their low, medium, and high concentration of the analytes, were prepared from human blank urine and detected continuously for three days. The corresponding drug concentrations were calculated using the accompanying standard curves to investigate the intra-day and inter-day precision and accuracy. Intra-day variation was evaluated using five successive injections within a day, and inter-day variation was estimated on three consecutive days. The intra-day and inter-day recoveries and RSDs were evaluated via analyzing spiked blank urine (0.125, 0.8 and 8 ng mL−1) on the same day and three consecutive days, respectively.
2.5.4 Matrix effects and extraction recoveries
The matrix effect and the extraction recovery were obtained from three concentration levels (low, middle and high calibrators), each in quintuplicate. As mentioned by Matuszewski et al (Matuszewski et al., 2003), three sets of data (A, B, C) were used to obtain matrix effects and extraction recoveries. The matrix effect calculated in terms of matrix factor (MF). MF = B/A, where B is the analyte peak area of urine spiked with the reference standard after extraction and A is the peak area of the reference standard in methanol containing equivalent amount of the analyte neat sample. If MF is between 0.85 and 1.15, it means that no matrix effect is present; if MF less than 0.85, it means that there is ionization suppression; whereas if MF > 1.15, it means that there is ionization enhancement. The extraction recovery was calculated in terms of R = C/B × 100 %, where C is the analyte peak area of blank urine spiked with a reference standard before extraction.
2.5.5 Stability of processed samples
Stability of processed samples were determined at 4 °C for 24 h. Stability of the analytes in matrix were evaluated using low and high QC samples and analyzed after three freeze–thaw cycles (−20 °C to 20 °C). Standard curves were constructed from freshly prepared calibration specimens. The quality control products were analyzed according to the standard curves; the measured concentrations were compared with the indicated concentrations. The deviation of the mean value of each concentration from the indicated concentration was within ± 15 %.
3 Results and discussion
3.1 Characterization of magnetic materials
The morphologies of Fe3O4, Fe3O4@SiO2 and Fe3O4@SiO2-NH2-G5 were investigated by using TEM. According to Fig. 2, Fe3O4, Fe3O4@SiO2 and Fe3O4@SiO2-NH2-G5 show good disperse. In Fig. 2a, it can be seen that the Fe3O4 present approximately spherical shape. In Fig. 2d and 2e, the images distinctly shows that the core–shell structure of Fe3O4@SiO2-NH2-G5, which Fe3O4 in middle of core is black and the surrounding SiO2-NH2-G5 layer is gray. Fe3O4@SiO2 has the similar core–shell structure to Fe3O4@SiO2-NH2-G5 (Fig. 2b and 2c). TEM images reveal that the thickness the outer SiO2 layer is about 20 nm and the SiO2-NH2-G5 layer is about 30 nm (Fig. 2c and 2f). These results showed that the Fe3O4@SiO2-NH2-G5 could be synthesized using the method.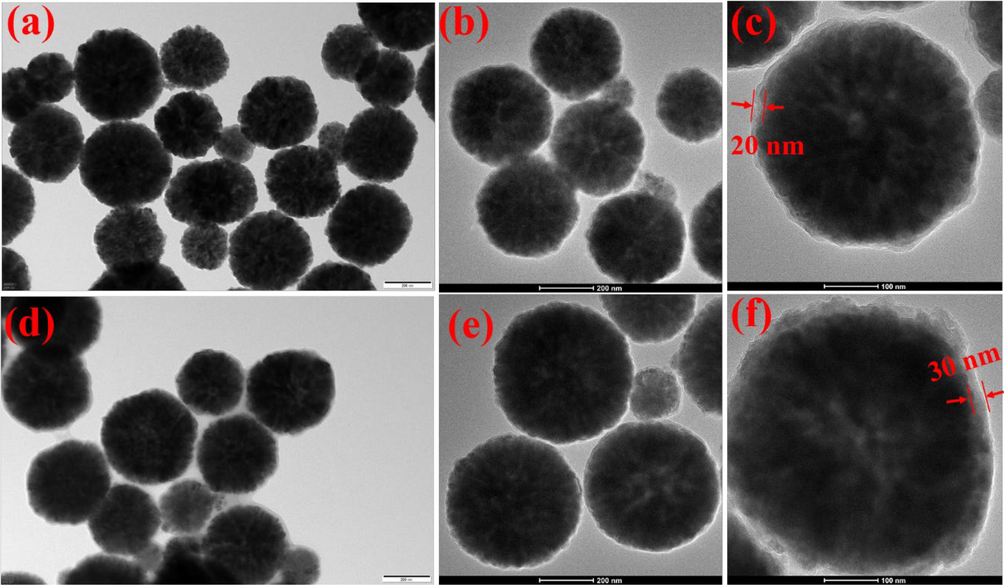
TEM images of (a) Fe3O4, (b, c) Fe3O4@SiO2, and (d, e, f) Fe3O4@SiO2-NH2-G5.
The chemical structures of the synthesized magnetic nanoparticles at different stages were identified by FT-IR spectra. In the spectrum of Fe3O4 (Fig. 3Ⅰa), the adsorption peaks at about 578 cm−1, 3422 cm−1 and 1629 cm−1 were assigned to Fe-O vibration of Fe3O4 and stretching and bending vibration of water molecules on the surface of Fe3O4, separately. In Fig. 3Ⅰb, the peaks located at about 1082 cm−1, 788 cm−1 and 947 cm−1 could be attributed to the asymmetric stretching vibration, symmetric stretching vibration and bending vibration of Si-O, respectively. It proved that the surfaces of Fe3O4 were encapsulated with silica shells successfully. In Fig. 3Ⅰc, the peaks around 1403 cm−1 and 1600 cm−1 were assigned to stretching vibration of C—N and bending vibration of N—H, which indicated that the surface of Fe3O4@SiO2 was successfully incorporated with the amino-group (Aslani et al., 2018; Zhang et al., 2013). In Fig. 3Ⅰd, the peaks at 1442 cm−1 and 1594 cm−1 were attributed to the stretching vibrations of C⚌C and C⚌N from cyanuric chloride and imidazole molecules.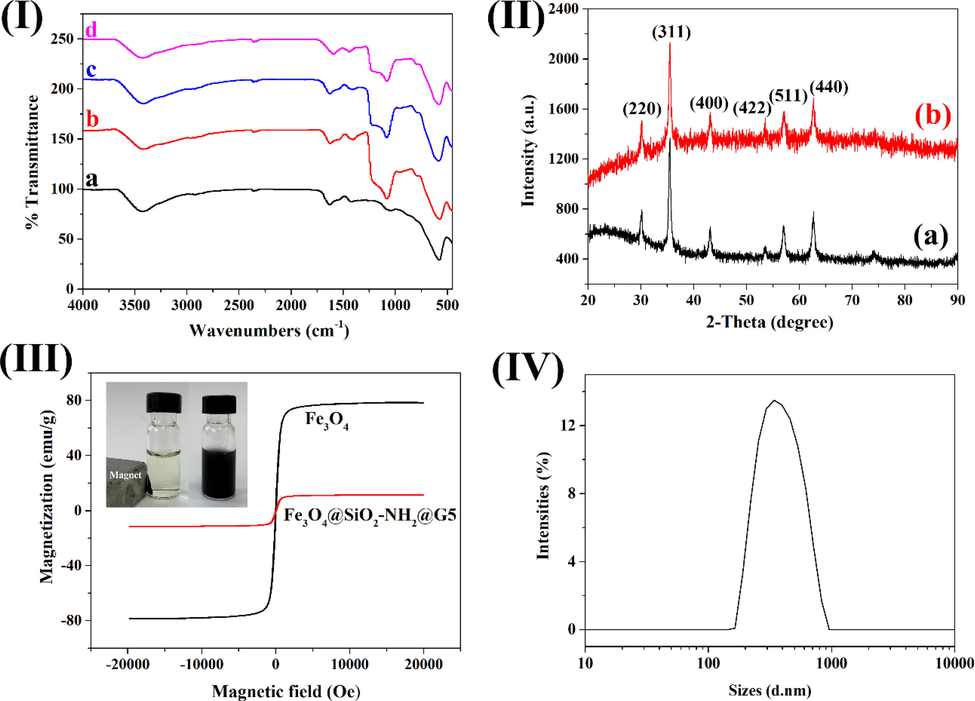
Characterization of the magnetic materials. (Ⅰ) FT-IR images of (a) Fe3O4, (b) Fe3O4@SiO2, (c) Fe3O4@SiO2-NH2 and (d) Fe3O4@SiO2-NH2-G5. (Ⅱ) XRD patterns of (a) Fe3O4 and (b) Fe3O4@SiO2-NH2-G5. (III) VSM images of Fe3O4 and Fe3O4@SiO2-NH2-G5, and the photo of magnetic separation process of Fe3O4@SiO2-NH2-G5 (inset down). (Ⅳ) Size distribution of Fe3O4@SiO2-NH2-G5.
XRD analysis of Fe3O4 and Fe3O4@SiO2-NH2-G5 were recorded using Cu Kα radiation over the angular ranging from 20° to 90° (Fig. 3Ⅱ). In XRD spectra, both Fe3O4 and Fe3O4@SiO2-NH2-G5 presented six characteristic adsorption peaks at 2θ = 30.11°, 35.42°, 43.06°, 53.54°, 56.96°, and 62.62° (Shi et al., 2019). Those peaks were indexed to the cubic structure of Fe3O4 of (2 2 0), (3 1 1), (4 0 0), (4 2 2), (5 1 1) and (4 4 0) planes matching with standard magnetite XRD patterns (JCPDS 19–0629). The XRD data indicated that the synthesized process did not change the crystal structure of the core–shell materials.
Sufficient magnetism of the magnetic material was a prerequisite to ensure the extraction process. VSM analysis was employed to assess the magnetic properties of Fe3O4 and Fe3O4@SiO2-NH2-G5. The magnetic hysteresis loops of magnetic materials were measured at room temperature (Fig. 3III). The VSM images presented the similar magnetic hysteresis loops of materials. Also, the curves exhibited zero coercivity and remanence, indicating all the magnetic materials were super-paramagnetic. The saturation magnetization of Fe3O4 and Fe3O4@SiO2-NH2-G5 were 78.4 emu g−1 and 11.4 emu g−1, respectively. Compared with Fe3O4, the decrease in magnetization values for Fe3O4@SiO2-NH2-G5 could be attributed to the shielding effect of the silica shell and NH2-G5 on the surface of Fe3O4. Overall, the magnetic response of Fe3O4@SiO2-NH2-G5 was sufficient to separate magnetic materials from aqueous solutions in practical application.
The particle size distribution of Fe3O4@SiO2-NH2-G5 was performed using intensity distribution by DLS. Fig. 3Ⅳ shows the average diameter and size distribution of Fe3O4@SiO2-NH2-G5 nanoparticles. The mean hydrodynamic size of Fe3O4@SiO2-NH2-G5 was 403 nm, the particle size being situated in the range between 164 and 825 nm.
3.2 Optimization of solid-phase extraction conditions
3.2.1 Selection of magnetic nanoparticles
We experimentally investigated the adsorption efficiency of Fe3O4@SiO2-NH2 (G0) and the first-generation product Fe3O4@SiO2-NH2-G1 (G1) to the fifth-generation product Fe3O4@SiO2-NH2-G5 (G5) for the four analytes. Magnetic nanoparticles (9 mg) were added to 0.2 mL of mixed standard sample solution (pH = 9) for the test and eluted using 0.2 mL of methanol, as shown in Fig. 4a. The adsorption of Fe3O4@SiO2-NH2 for the four analytes was poor, less than 12 %. From the results, the extraction efficiencies of the materials for the analytes increased with the increase of the dendritic structure. The dendritic structure increases the contact area between the adsorbents and the analytes. However, compared with Fe3O4@SiO2-NH2-G4 (G4), G5 had no significant increase in the adsorption effect of midazopm and zopidam, which may be due to steric hindrance. Considering the time and reagent consumables spent in the material synthesis process, the fifth-generation product was selected for follow-up testing.
(a) The effect of different generations on the extraction efficiency of four sedative hypnotics; the effect of (b) adsorbent amount (C = 100 ng mL−1, pH = 7), (c) pH (C = 100 ng mL−1, contact time = 2 min, adsorbent amount = 12 mg), (d) extraction time (C = 100 ng m−1L, pH = 7, adsorbent amount = 12 mg) on extraction efficiency of Fe3O4@SiO2-NH2-G5.
3.2.2 Optimization of the amount of magnetic material
In the solid-phase extraction technique, the extraction efficiency is directly affected by the amount of adsorbent. Usually, increasing the amount of adsorbent can provide more adsorption sites. The effect of different doses of adsorbent, including 1.5, 4, 9, 12, and 15 mg, on the adsorption efficiency of the analytes was investigated. The experiments were conducted by adding magnetic nanoparticles to 0.2 mL of mixed standard sample solution. The results suggest an increase in the recoveries of the four analytes with the increase in dosage from 1.5 mg to 12 mg, while the sorption recoveries did not increase significantly when the dosage of magnetic nanoparticles continued to increase (Fig. 4b). Thus, we finally selected 12 mg as the optimal dosage.
3.2.3 Optimization of extraction time
The process of extraction involves a mass transfer equilibrium between the sorbent and the analyte in solution, so it is strongly influenced by the extraction time. Vortexing can improve the mass transfer rate in the extraction process, also being a good choice for adsorbents that are easily dispersed. The experiment investigated the influence of vortexing extraction time of 0.5 min, 1 min, 2 min, 3 min, and 5 min on the extraction recoveries of the analytes, and the results are shown in Fig. 4c. With the increase in the extraction time, a stable recovery was achieved after 2 min of vortexing, which was finally selected as the duration for optimal extraction.
3.2.4 Optimization of the sample solution pH
The pH of the sample solution affects the existing form and physicochemical properties of the analyte and adsorbent. To obtain excellent extraction efficiency, the effect of pH 3, 5, 7, 9, and 10 on the sample solution was investigated by adjusting with hydrochloric acid or ammonia solutions. As shown in Fig. 4d, diazepam, midazolam, and zolpidem had poor adsorption efficiency under acidic conditions, zaleplon had the worst adsorption efficiency under neutral conditions, and the four analytes exhibited high adsorption efficiency under alkaline conditions. The pKa values of four sedative-hypnotics were less than 7. The sedative-hypnotics could be adsorbed on Fe3O4@SiO2-NH2-G5 via π–π interaction, hydrogen bonding and hydrophobic interaction over the sample pH from 3 to 7. When the pH of the sample solution exceeded 7, all analytes were neutral. Therefore, main driving force was π–π interaction as the sample pH over 7. When the pH of the sample solution was 9, the recoveries of analytes were maximized. In the whole, pH 9 was selected as the optimal pH for the extraction.
3.2.5 Optimization of desorption solvent
Desorption solvent is also an important parameter to assess the efficiency of solid-phase extraction. To ensure complete elution of the analytes from the magnetic nanoparticles, an appropriate eluent should be selected. The elution efficiency of analytes with methanol and acetonitrile in different volume ratios including 5:0, 4:1, 1:1, 1:4 and 0:5 was investigated. The results indicate that the highest elution efficiency was achieved at a 1:1 vol ratio of methanol to acetonitrile (Fig. 5a), which was thus chosen as the final elution solvent.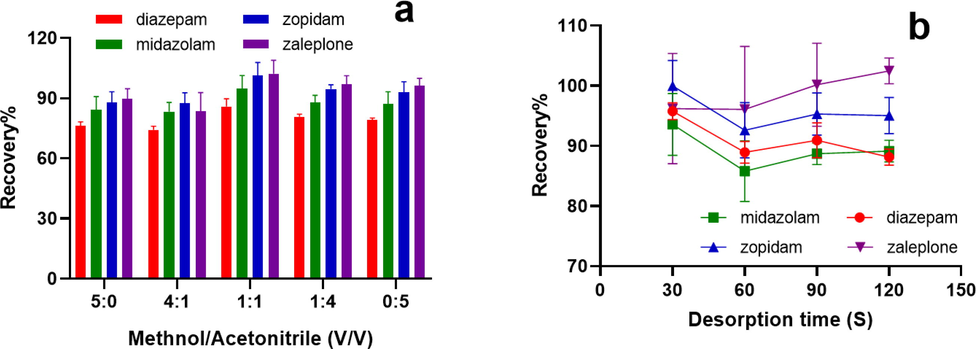
Effect of (a) desorption solvent volume and (b) desorption time on desorption efficiency of Fe3O4@SiO2-NH2-G5.
3.2.6 Optimization of desorption time
To ensure complete desorption of the target analyte, desorption time for the test was optimized. The effect of desorption time of 30 s, 60 s, 90 s, and 120 s on desorption efficiency was investigated. As can be seen in Fig. 5b, the target analytes could be completely desorbed at 30 s. This proved that Fe3O4@SiO2-NH2-G5 magnetic nanoparticles could be used as effective adsorption materials for the four compounds.
3.2.7 Reusability evaluation
Reusability is one of the important performances of the MSPE method. To evaluate the reusability of Fe3O4@SiO2-NH2-G5, the composite was reused multiple experiments and the recoveries of analytes were investigated. After the first adsorption–desorption experiment, the Fe3O4@SiO2-NH2-G5 was washed with methanol and ultrapure water for three times and dried. Subsequently the Fe3O4@SiO2-NH2-G5 was reused for next extraction cycle. The results indicated that the extraction capacity of Fe3O4@SiO2-NH2-G5 did not decrease significantly after reusing for 5 times, but the recoveries gradually decreased in six successive cycles due to the loss of the composite. In addition, the batch-to-batch reproducibility of the materials were investigated. The extraction recoveries from three different batches of the material were between 91 % and 109 %, with RSDs within 10 %. It showed that the materials synthesized by the method have good repeatability. On the whole, the results confirmed that the Fe3O4@SiO2-NH2-G5 was sufficiently stable as the adsorbent in MSPE.
3.2.8 Adsorption mechanism
The adsorption mechanism of Fe3O4@SiO2-NH2-G5 on the four sedative-hypnotics was discussed. The dendritic structure allows Fe3O4@SiO2-NH2-G5 to make full contact with sedative-hypnotics molecules. The dendritic structure composed of CC and IMI forms a large π-electron system. As is shown in Fig. 6, the four analytes are all weakly basic compounds with π-electron system. Analytes in the sample solution with pH of 9 were neutral. When Fe3O4@SiO2-NH2-G5 comes into contact with analytes, the π-π interaction is engendered, and the analytes can be adsorbed.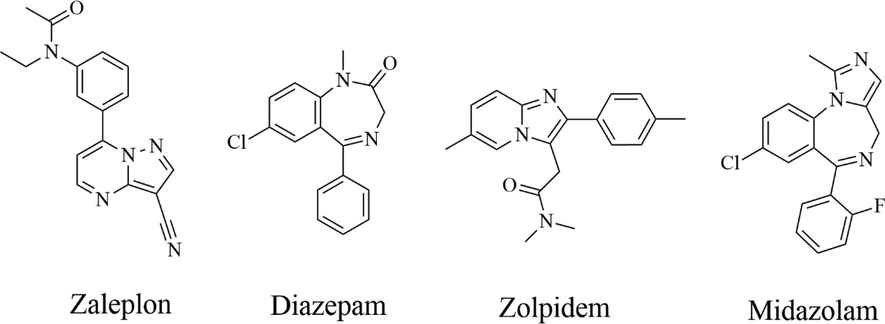
The chemical structural formula of the four analytes.
3.3 Methodology
3.3.1 Selectivity
Urine from six different sources was used in the experiment. Under the optimized chromatographic and mass spectrometric conditions, spiked samples and blank urine were injected for detection, and there were no signals interfering with the four analytes in the blank urine. The extracted ion chromatograms of the four analytes at LLOQ level and the internal standard were presented in Fig. 7. It could be seen that, there were no interference peaks near the analytes.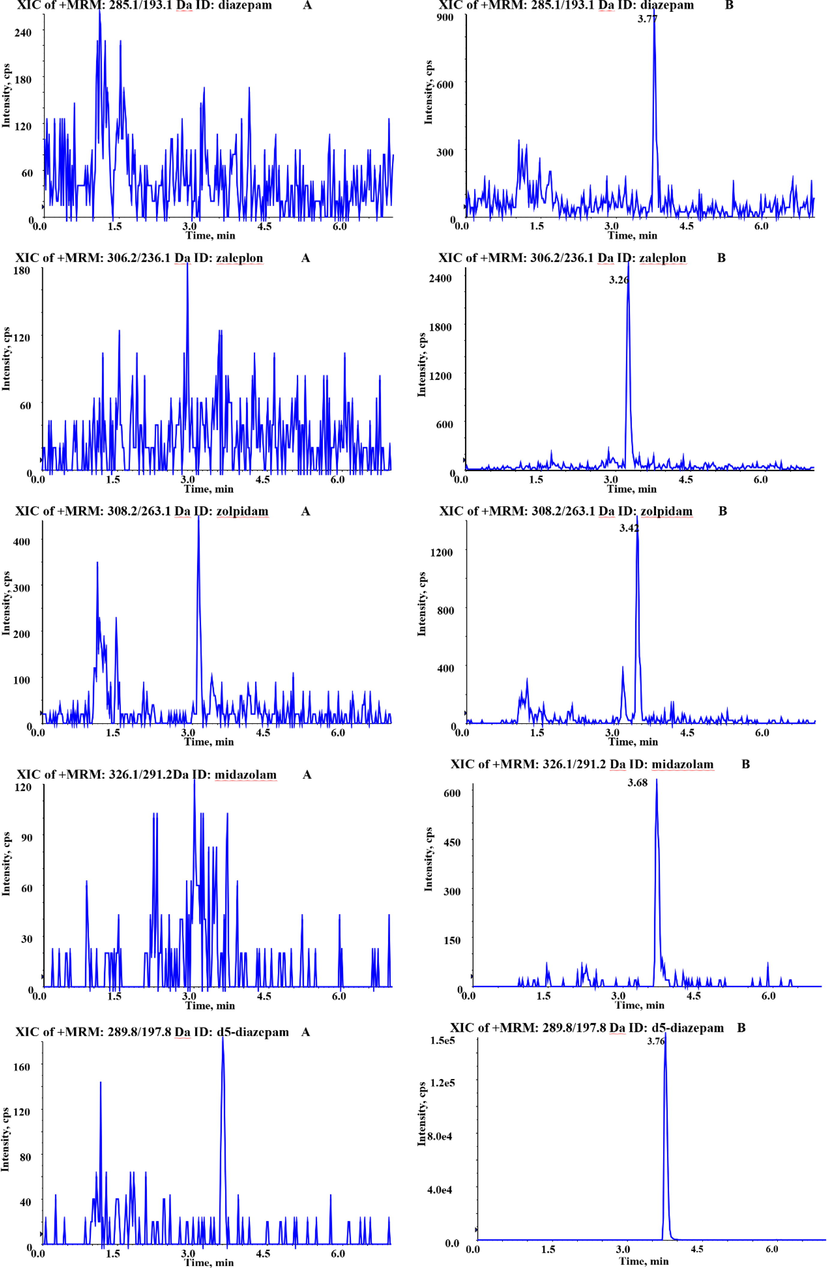
The typical chromatograms of blank urine samples (A) and blank urine spiked with reference substance (at the LLOQ level) (B).
3.3.2 Linearity, LLOQ and LOD
The linear equations for zaleplon, diazepam, zolpidem and midazolam were y = 0.0802x–0.00167, y = 0.114x–0.00231, y = 0.392x–0.00248, and y = 0.243x–0.00444, respectively, and their respective linear ranges were 0.1–10 ng mL−1, 0.1–10 ng mL−1, 0.05–10 ng mL−1 and 0.05–10 ng mL−1; the linear correlation coefficients r were 0.9966, 0.9972, 0.9965, and 0.9980, respectively. Thus, the four analytes showed good linearity in the given concentration range. The LLOQs of zaleplon, diazepam, zolpidem, and midazolam were 0.1, 0.1, 0.05, and 0.05 ng mL−1, respectively, and the LODs were 0.05, 0.05, 0.02, and 0.02 ng mL−1, respectively.
3.3.3 Precision and accuracy
The acceptance criteria of intra-day and inter-day precision and accuracy of the analytes should be within ± 15 % and 85 %–115 %, separately. The intra-day precision of the four substances ranged from 2.4 % to 9.4 %, and their recoveries ranged from 88.3 % to 104.8 %. The inter-day precision ranged from 3.9 % to 15.2 %, and their recoveries ranged from 94.1 % to 108.3 % (Table 2). Thus, the precision and accuracy of the method were good.
Analytes
Spiked (ng mL−1)
Intra-day (n = 5)
Inter-day (n = 5)
Found (ng mL−1)
Recovery (%)
RSD (%)
Found (ng mL−1)
Recovery (%)
RSD (%)
0.125
0.121 ± 0.009
96.5
7.5
0.130 ± 0.010
104.2
7.4
diazepam
0.8
0.84 ± 0.02
104.5
2.4
0.86 ± 0.06
106.9
7.3
8
7.88 ± 0.63
98.5
8.0
8.23 ± 0.45
102.8
5.5
0.125
0.114 ± 0.008
91.2
6.6
0.118 ± 0.007
94.1
6.2
midazolam
0.8
0.81 ± 0.08
100.8
9.4
0.82 ± 0.02
102.7
2.1
8
7.97 ± 0.59
99.6
7.4
8.54 ± 0.50
106.7
5.8
0.125
0.118 ± 0.008
94.7
7.2
0.119 ± 0.006
95.6
5.1
zolpidem
0.8
0.84 ± 0.10
104.8
1.4
0.77 ± 0.06
95.9
8.0
8
8.01 ± 0.31
100.1
3.9
8.67 ± 0.59
108.3
6.8
0.125
0.110 ± 0.004
88.3
3.4
0.132 ± 0.020
105.4
15.2
zaleplon
0.8
0.79 ± 0.06
99.2
7.0
0.80 ± 0.03
100.0
3.9
8
7.29 ± 0.48
91.1
6.5
8.36 ± 1.00
104.5
12.0
3.3.4 Matrix effects and extraction recoveries
The matrix effect factor of zaleplon in urine samples was 0.77–0.85, and the recoveries were in the range of 49.5 %–64.7 %. For the other three substances, except for midazolam, which had a matrix effect factor of 0.72 at low concentration, all other analytes had matrix effect in the range of 0.91–1.03, with > 65.3 % recoveries (Table 3). Zaleplon exhibited some matrix effect and lower extraction recovery, but its matrix effect factor remained stable at low, medium, and high concentrations and did not affect the accuracy of the method.
Analytes
Concentration (ng mL−1)
Matrix effect
Extraction recovery (%)
0.125
0.97
69.1
diazepam
0.8
0.92
67.2
8
0.91
65.3
0.125
0.72
71.7
midazolam
0.8
0.91
70.1
8
0.83
68.0
0.125
0.94
71.4
zolpidem
0.8
1.03
68.2
8
0.95
71.0
0.125
0.85
49.5
zaleplon
0.8
0.77
64.7
8
0.84
59.2
3.3.5 Stability
The stability of prepared samples was investigated at two concentrations, 0.125 ng mL−1 and 8 ng mL−1. The deviations from their indicated concentrations were 19.0 %, 17.6 %, −5.6 %, and −4.8 % at the low concentration point, and −0.1 %, −0.4 %, 4.2 %, and 14.1 % at the high concentration point, respectively. At low concentration points, zaleplon and zolpidem exhibited greater deviations, while the four substances were basically stable when stored at 4 °C for 24 h.
After three freeze–thaw cycles for zaleplon, zolpidem, diazepam, and midazolam, the deviations of their measured concentrations from the actual concentrations at the low concentration points were 13.3 %, −6.1 %, −4.2 %, and 3.7 %, respectively; and the deviations of the measured concentrations from the indicated concentrations at the high concentration points were 7.4 %, −14.8 %, −4.3 %, and −7.8 %, respectively. This suggests that zaleplon, zolpidem, diazepam, and midazolam were stable after three freeze–thaw cycles.
3.4 Method comparison
The proposed MSPE method (Fe3O4@SiO2-NH2-G5 as adsorbent) was compared with some reported methods of sedative-hypnotics determination in terms of extraction time, recovery and LOD (Table 4). The proposed method showed shorter extraction time, low LOD in comparison, and desirable recovery. In addition, the proposed method had a lower detection limit than other methods listed, which indicated an excellent extraction efficiency of the proposed method. It is worth noting that this method requires less urine volume (200 μL) than other methods (Zhang et al., 2018; Ghani et al., 2021). Moreover, the MSPE program eliminated the steps of additional centrifugation or filtration in virtue of an external magnetic field, which simplified the sample preparation process and saved the analysis time. Based on the above analysis, the prepared Fe3O4@SiO2-NH2-G5 can be considered as a promising extractant for the determination of BZDs and Z-hypnotics from biomatrix. PPT: Protein precipitation method; LLE: Liquid-liquid extraction; QuEChERS: a quick, easy, cheap, effective, rugged, and safe extraction method; HT-BAμE:High throughput bar adsorptive microextraction; HF-VMME:Hollow fiber vesicular-mediated microextraction; MEPS: Microextraction by packed sorbent; SPE: Solid phase extraction; LC-MS/MS: Liquid chromatography-tandem mass spectrometry; GC–MS: gas chromatography-mass spectrometry; HPLC-DAD: High performance liquid chromatograph-diode array detection.
Analytes
Matrix
Extraction method
Analytical method
Extraction time (min)
Recovery (%)
LOD (ng mL−1)
Ref.
Midazolam
urine plasma
PPT
LC-MS/MS
7
>99
less than5
(Wessels et al., 2021)
midazolam
plasma
LLE
LC-MS
>20
–
10
(Rochani et al., 2020)
Diazepam
Midazolam
Zaleplon
Zolpidemplasma
LLE
LC-MS/MS
20
87–124
82–93
87–90
90–115501,101
(Montenarh et al., 2014)
Diazepam
plasma
urineQuEChERS
GC–MS
–
52–89
85–125–
(Westland et al 2013)
Diazepam
urine
HT-BAμE
HPLC-DAD
1.8
98.8–103.8
2
(Ahmad et al., 2019)
Midazolam
Diazepamurine
HF-VMME
HPLC-DAD
50
92.4
93.60.7
0.5(Rezaei et al., 2013)
Zaleplon
Zolpidemplasma
MEPS
LC-MS/MS
20
100–123
92–1091
0.5(Ares-Fuentes et al., 2021)
Diazepam
Midazolam
Zaleplon
Zolpidemurine
SPE
HPLC-DAD
5
92.4–104.7
92.1–103.8
92.9–99.0
94.2–105.60.2
0.4
0.4
0.4(An et al., 2021)
Midazolam
plasma
SPE
HPLC-PDA
>50
101.0
1430
(Dalla Costa et al., 2019)
Midazolam
urine
MSPE
LC-MS
60
89.8
0.01
(Zhang et al., 2018)
Diazepam
urine
MSPE
HPLC-UV
15
96
0.15
(Ghani et al., 2021)
Diazepam
Midazolam
Zaleplon
Zolpidemurine
MSPE
LC-MS/MS
4
96.5–104.5
91.2–100.8
88.3–99.2
94.7–104.80.05
0.02
0.02
0.05This work
4 Conclusion
To conclude, a novel magnetic dendritic structured nanomaterial was synthesized for the successful extraction and separation of four hypnotics from human urine. The use of nanomaterials as adsorbent and the dispersive extraction method allowed sufficient contact and increased the interaction between the analytes and the sorbents; thus, improving the extraction efficiency and shortening the extraction time. MSPE was combined with UHPLC-MS/MS for the determination of four hypnotics in human urine samples with high method sensitivity and low detection limits of as low as pg level. The method is simple, rapid, sensitive, environment-friendly, economical, and can meet the requirement for rapid detection of sedative-hypnotics in emergency medicine and forensic screening.
CRediT authorship contribution statement
Jing An: Conceptualization, Methodology, Validation, Formal analysis, Data curation, Writing – original draft, Writing – review & editing, Supervision. Xin Wang: Formal analysis, Supervision. Haojing Song: Visualization. Tangjuan Zhao: Methodology, Validation, Formal analysis, Investigation, Data curation. Hongyan Ren: Visualization. Weijun Kang: Formal analysis, Supervision. Zhanjun Dong: Formal analysis, Supervision. Lingmei Niu: Funding acquisition. Hongmei Shi: Funding acquisition.
Acknowledgments
The work was supported by the Natural Science Foundation of Hebei Province (No. H2020206516), the Youth Foundation of Hebei Educational Committee (No. QN2020129), the Hebei Province Science and Technology Support Program (No. 14273002D), the National Natural Science Foundation of China (Nos. 81773481, 81872628 and 82073601), and the Post-Doctoral Scientific Research Program of Hebei Province (No. B2021003039).
Declaration of competing interest
The authors declare that they have no known competing financial interests or personal relationships that could have appeared to influence the work reported in this paper.
References
- High throughput bar adsorptive microextraction: a novel cost-effective tool for monitoring benzodiazepines in large number of biological samples. Talanta. 2019;199:195-202.
- [Google Scholar]
- Application of hollow fiber centrifugal ultrafiltrate purification as the pretreatment technology for traditional Chinese medicine: its application for analysis of honokiol and magnolol in TCM preparations containing Cortex Magnoliae Officinalis. Ann. Palliat. Med.. 2021;10:6359-6366.
- [Google Scholar]
- Development of a simple nanofiber-based solid phase extraction procedure coupled with high performance liquid chromatography analysis for the quantification of eight sedative-hypnotic drugs in human urine samples. Microchem. J.. 2021;168:106475
- [Google Scholar]
- An analytical strategy for designer benzodiazepines and Z-hypnotics determination in plasma samples using ultra-high performance liquid chromatography/tandem mass spectrometry after microextraction by packed sorbent. J. Pharm. Biomed. Anal.. 2021;194:113779
- [Google Scholar]
- Dispersive micro-solid-phase extraction of benzodiazepines from biological fluids based on polyaniline/magnetic nanoparticles composite. Anal. Chim. Acta. 2014;844:80-89.
- [Google Scholar]
- Immobilization of trypsin onto Fe3O4@SiO2-NH2 and study of its activity and stability. Colloid Surf. B. 2018;170:553-562.
- [Google Scholar]
- Bioanalytical method to detect midazolam in plasma. Biomed. Chromatogr.. 2019;33:e4564.
- [Google Scholar]
- Monodisperse magnetic single-crystal ferrite microspheres. Angew. Chem. Int. Ed.. 2005;44:2782-2785.
- [Google Scholar]
- Duan, X.M, Liu, J., Hao, J.F., Wu, L.M., HE, B.J., Qiu, Y., Zhang, J., He, Z.L., Xi, J.B., Wang, S., 2018. Magnetically recyclable nanocatalyst with synergetic catalytic effect and its application for 4-nitrophenol reduction and Suzuki coupling reactions. Carbon 130, 806-813
- European Monitoring Centre for Drugs and Drug Addiction and Europol, 2016. EU Drug Markets Report: In-Depth Analysis, EMCDDA–Europol Joint publications. Publications Office of the European Union, Luxembourg.
- Experimental design for optimization of microwave-assisted extraction of benzodiazepines in human plasma. Anal. Bioanal. Chem.. 2010;397:677-685.
- [Google Scholar]
- A rapid ultrasound-assisted dispersive liquid-liquid microextraction followed by ultra-performance liquid chromatography for the simultaneous determination of seven benzodiazepines in human plasma samples. Anal. Chim. Acta. 2013;767:88-96.
- [Google Scholar]
- High-throughput dispersive liquid/liquid microextraction (DLLME) method for the rapid determination of drugs of abuse, benzodiazepines and other psychotropic medications in blood samples by liquid chromatography–tandem mass spectrometry (LC-MS/MS) and application to forensic cases. Microchem. J.. 2015;123:33-41.
- [Google Scholar]
- Glutathione-stabilized Fe3O4 nanoparticles as the sorbent for magnetic solid-phase extraction of diazepam and sertraline from urine samples through quantitation via high-performance liquid chromatography. J. Sep. Sci.. 2021;44(6):1195-1202.
- [Google Scholar]
- Development of an LC-MS/MS method for the simultaneous determination of 25 benzodiazepines and zolpidem in oral fluid and its application to authentic samples from regular drug users. J. Pharm. Biomed. Anal.. 2013;74:213-222.
- [Google Scholar]
- A retrospective analysis of urine drugs of abuse immunoassay true positive rates at a national reference laboratory. J. Anal. Toxicol.. 2016;40:97-107.
- [Google Scholar]
- Polydrug abuse: a review of opioid and benzodiazepine combination use. Drug Alcohol Depend.. 2012;125:8-18.
- [Google Scholar]
- Facile preparation of reduced graphene oxide/ZnFe2O4 nanocomposite as magnetic sorbents for enrichment of estrogens. Talanta. 2020;208:120440
- [Google Scholar]
- Microextraction by packed sorbent (MEPS)-UHPLC-UV: A simple and efficient method for the determination of five benzodiazepines in an alcoholic beverage. J. Pharm. Biomed. Anal.. 2016;125:48-53.
- [Google Scholar]
- The emergence of new psychoactive substance (NPS) benzodiazepines: a review. Drug Test Anal.. 2018;10:392-393.
- [Google Scholar]
- Magnetic solid-phase extraction of organic compounds based on graphene oxide nanocomposites. Molecules. 2020;25:1148.
- [Google Scholar]
- Strategies for the assessment of matrix effect in quantitative bioanalytical methods based on HPLC–MS/MS. Anal. Chem.. 2003;75:3019-3030.
- [Google Scholar]
- Detection and quantification of benzodiazepines and Z-drugs in human whole blood, plasma, and serum samples as part of a comprehensive multi-analyte LC-MS/MS approach. Anal. Bioanal. Chem.. 2014;406:803-818.
- [Google Scholar]
- Bio-compatible in-tube solid-phase microextraction capillary for the direct extraction and high-performance liquid chromatographic determination of drugs in human serum. J. Chromatogr. A. 2002;963:325-334.
- [Google Scholar]
- Automated hollow-fiber liquid-phase microextraction followed by liquid chromatography with mass spectrometry for the determination of benzodiazepine drugs in biological samples. J. Sep. Sci.. 2016;39:2595-2603.
- [Google Scholar]
- Development and application of a multi-component LC-MS/MS method for determination of designer benzodiazepines in urine. J. Chromatogr. B. 2016;1035:104-110.
- [Google Scholar]
- MIL-101(Fe)-derived magnetic porous carbon as sorbent for stir bar sorptive-dispersive microextraction of sulfonamides. Mikrochim. Acta. 2021;188(10):340.
- [Google Scholar]
- Benzodiazepine findings in blood and urine by gas chromatography and immunoassay. Forensic Sci. Int.. 2000;112:191-200.
- [Google Scholar]
- Supramolecular solvent-based hollow fiber liquid phase microextraction of benzodiazepines. Anal. Chim. Acta. 2013;804:135-142.
- [Google Scholar]
- Simultaneous quantitative LC-MS method of ketamine, midazolam and their metabolites (dehydronorketamine, norketamine and 1hydroxymidazolam) for its application in patients on extracorporeal membrane oxygenation (ECMO) therapy. J. Pharm. Biomed. Anal.. 2020;178:112947
- [Google Scholar]
- Preparation of Fe3O4@SiO2@layered double hydroxide core-shell microspheres for magnetic separation of proteins. J. Am. Chem. Soc.. 2012;134:1071-1077.
- [Google Scholar]
- Immobilization of high temperature-resistant GH3 β-glucosidase on a magnetic particle Fe3O4-SiO2-NH2-Cellu-ZIF8/zeolitic imidazolate framework. Enzyme Microb. Tech.. 2019;129:109347
- [Google Scholar]
- Development and validation of an LC-MS-MS method for the detection of 40 benzodiazepines and three Z-drugs in blood and urine by solid-phase extraction. J. Anal. Toxicol.. 2020;44:708-717.
- [Google Scholar]
- Monitoring of drugs and metabolites in whole blood by restricted-access solid-phase microextraction coupled to liquid chromatography-mass spectrometry. J. Chromatogr. A. 2004;1025:85-92.
- [Google Scholar]
- A fast and simple method for the simultaneous analysis of midazolam, 1-hydroxymidazolam, 4-hydroxymidazolam and 1-hydroxymidazolam glucuronide in human serum, plasma and urine. J. Chromatogr. B. 2021;1162:122476
- [Google Scholar]
- QuECRS hEextraction of benzodiazepines in biological matrices. J. Pharm. Anal.. 2013;3:509-517.
- [Google Scholar]
- Development of the MAE/UHPLC-MS-TOF method for determination of benzodiazepines in human bio-fluids for toxicological analysis. J. Pharm. Biomed. Anal.. 2015;108:97-101.
- [Google Scholar]
- Continuous flow reduction of organic dyes over Pd-Fe alloy based fibrous catalyst in a fixed-bed system. Chem. Eng. Sci.. 2021;231:116303
- [Google Scholar]
- Analysis of flavors and fragrances by HPLC with Fe3O4@GO magnetic nanocomposite as the adsorbent. Talanta. 2017;166:262-267.
- [Google Scholar]
- Recent applications of magnetic solid phase extraction in sample preparation for phytochemical analysis. J. Pharm. Biomed. Anal.. 2021;192:113675
- [Google Scholar]
- Substrate-Assisted Encapsulation of Pd-Fe Bimetal Nanoparticles on Functionalized Silica Nanotubes for Catalytic Hydrogenation of Nitroarenes and Azo Dyes. ACS Appl. Nano Mater.. 2021;4:5854-5863.
- [Google Scholar]
- Fabrication of magnetic zinc adeninate metal-organic frameworks for the extraction of benzodiazepines from urine and wastewater. J. Sep. Sci.. 2018;41(8):1864-1870.
- [Google Scholar]
- Pb(II) removal of Fe3O4@SiO2-NH2 core–shell nanomaterials prepared via a controllable sol–gel process. Chem. Eng. J.. 2013;215–216:461-471.
- [Google Scholar]
- Cyanuric chloride-imidazole dendrimer functionalized nanoparticles as an adsorbent for magnetic solid phase extraction of quaternary ammonium compounds from fruit and vegetable puree based infant foods. J. Chromatogr. A. 2021;1636:461735
- [Google Scholar]


