

Translate this page into:
Determination of oleandrin and adynerin in rat plasma by UPLC–MS/MS and their pharmacokinetic study
⁎Corresponding author. jianshema@gmail.com (Jianshe Ma)
-
Received: ,
Accepted: ,
This article was originally published by Elsevier and was migrated to Scientific Scholar after the change of Publisher.
Abstract
Oleandrin and adynerin are the main toxic components of oleander, an evergreen shrub or a small tree of the oleander family, which belongs to the class of cardiac glycosides exhibiting delayed action. The pharmacokinetic differences of oleandrin and adynerin in rats were studied by ultra-performance liquid chromatography–tandem mass spectrometry (UPLC–MS/MS) under two different administration modes: oral (5 mg/kg) and sublingual intravenous injection (1 mg/kg). The chromatographic column was UPLC BEH C18 (50 mm × 2.1 mm, 1.7 μm), and the column temperature was set at 40 °C. The mobile phase was acetonitrile–water (containing 0.1 % formic acid), with gradient elution, the flow rate was 0.4 mL/min, and the elution time was 4 min. Electrospray (ESI) positive ion mode detection with multiple reaction monitoring mode (MRM) was used for quantitative analysis: oleandrin m/z 577 → 145, adynerin m/z 534 → 113, and internal standard m/z 237 → 135. The established UPLC–MS/MS method was successfully applied to the pharmacokinetics in rats after administering oleandrin and adynerin. The bioavailability of oleandrin and adynerin was found to be low, 7.0 % and 93.1 %; respectively.
Keywords
Adynerin
Bioavailability
Oleandrin
Pharmacokinetics
UPLC–MS/MS

1 Introduction
Nerium oleander, also known as oleander or European oleander, is an evergreen shrub or a small tree of the oleander family, with ornamental value(Farkhondeh et al., 2020). Oleander is used to treat heart disease, asthma, cancer, epilepsy, and wound infections, and has anti-inflammatory properties(Singh et al., 2013, Calderon-Montano et al., 2015, Mohapatra et al., 2021). It is also one of the most poisonous plants in the world(Bandara et al., 2010). Incidents of human and livestock poisoning and even death due to oleander have been reported from time to time(Gonzalez-Stuart and Rivera 2018, Karthik et al., 2020, Guru et al., 2021). The ingestion of oleander produces typical clinical symptoms of cardiac glycoside toxicity, primarily gastrointestinal discomfort, nausea, and vomiting, followed by neurologic symptoms, including weakness, confusion, and cardiac symptoms; bradycardia and atrioventricular block lead to fibrillation usually due to conduction problems(Ceci et al., 2020, Amend et al., 2021). Oleandrin and adynerin are the main toxic components of oleander, which are cardiac glycosides exhibiting delayed action and are distributed in various parts of oleander plants, including stems, leaves, buds, flowers, nectar, sap, products of combustion, and so on (Ying et al., 2018, Suchard and Greb 2021). However, the use of oleander is severely limited due to its narrow therapeutic window. Therefore, it is necessary to establish a method to detect the concentrations of oleandrin and adynerin in vivo.
The current in vivo detection methods of oleandrin mainly include thin-layer chromatography(Blum and Rieders 1987), fluorescence spectrophotometry(Datta and Dasgupta 1997, Poindexter et al., 2007), high-performance liquid chromatography(Namera et al., 1997, Hamad et al., 2002), high-performance liquid chromatography-mass spectrometry(Tor et al., 2005, Rui et al., 2017, Zhai et al., 2018, Ying et al 2018, Wang et al,2000, Anna Carfora et al 2020), Ultra-performance liquid chromatography-mass spectrometry(Gosetti F.et al.,2019, Malysheva SV et al., 2020) A few methods have been reported for simultaneous in vivo determination of oleandrin and adynerin (Rui et al., 2017, Ying et al., 2018). Liquid chromatography–tandem mass spectrometry (LC–MS/MS) combines the advantages of high separation efficiency of liquid chromatography and strong identification of MS compounds. It was the ideal method for the in vivo determination of oleandrin and adynerin. Song et al. established the LC–MS/MS method for determining oleandrin and adynerin in human blood with a run time of 10 min for each sample(Rui et al., 2017) and another 7 min needed for the LC–MS/MS method; the method was developed by Ying et al(Ying et al., 2018). The comparative features of present method with existing methods was showed in Table 1.
Reference
Compound
Matrix
Extraction
Analytical method
Recovery(%)
Reporting Limit
Internal Standard
Retention time(min)
Kimio Hamada
Oleandrin
Bovine Blood
LLE
HPLC
88.8–98.7
1.5 ng/mL
Namera A
Oleandrin
Human Blood
LLE
HPLC
90
0.02ug/g
Jianbo Ying
Oleandrin
AdynerinBlood
LLE
HPLC-MS/MS
90–92
90–980.5 ng/mL
0.5 ng/mL
2.87
2.93
Elizabeth R. Tor
Oleandrin
Urine
Serum
Livermethylene chloride
methylene chloride
acetonitrileHPLC-MS/MS
97 ± 5
107 ± 7
98 ± 61 ng/mL
7.2
Anna Carfora
Oleandrin
Human Blood/Urine
LLE
HPLC-MS/MS
88
1 ng/mL
4.12
Zhai Jin-xiao
Oleandrin
Blood
LiverLLE(ethyl acetate)
HPLC-MS/MS
˃ 70.5
1 ng/mL
2 ng/mL
4.80
Wang Xiaomin
Oleandrin
Human Plasma
SPE
HPLC-MS/MS
90
1 ng/mL
Ouabain
7.4
Song Rui
Oleandrin
AdynerinHuman Blood
acetonitrile
HPLC-MS/MS
76.5–95.7
75.2–93.20.5 ng/mL
0.5 ng/mL
3.75
3.86
Svetlana V. Malysheva
Oleandrin
Human Urine
SPE
UPLC-MS/MS
84 ± 10
0.1 ng/mL
Digoxin-d3
5.97
Gosetti F.
Oleandrin
Bovine Blood
SPE
UPLC-MS/MS
62.9–80.5
0.11 ng/mL
Pharmacokinetic properties are important indicators to evaluate the drug ability of active compounds; however, to the best of our knowledge, no pharmacokinetic study on oleandrin and adynerin has been reported. Also, although biological detection methods are involved, no specific pharmacokinetic parameters have been provided. The pharmacokinetic study of oleandrin and adynerin might provide useful information for the metabolism of oleander in vivo. The UPLC–MS/MS technology is advantageous owing to its high sensitivity, low detection limit, and low sample consumption and is thus widely used in chemical components, drug metabolism, impurities identification, and other drug analyses. In this study, a method based on UPLC–MS/MS was established for determining oleandrin and adynerin in rats, and the pharmacokinetics under different administration routes (gavage and sublingual intravenous injection) were investigated.
2 Materials and methods
2.1 Reagents and animals
Oleandrin (purity ≥ 98 %, Fig. 1a), adynerin (purity ≥ 98 %, Fig. 1b), and curdione (internal standard, purity ≥ 98 %, Fig. 1c) were purchased from ChengDu Mansite Pharmaceutical Co., ltd. (ChengDu, Sichuan, China). Chromatographically pure acetonitrile and methanol were purchased from Merck ltd (Darmstadt, Germany). The ultrapure water (resistance > 18 mΩ) used in the experiment was prepared using the Milli-Q purification system (Darmstadt, Germany). Sprague–Dawley (SD) rats (males, 220–250 g) were obtained from the Animal Experiment Center of Wenzhou Medical University (Wenzhou, China).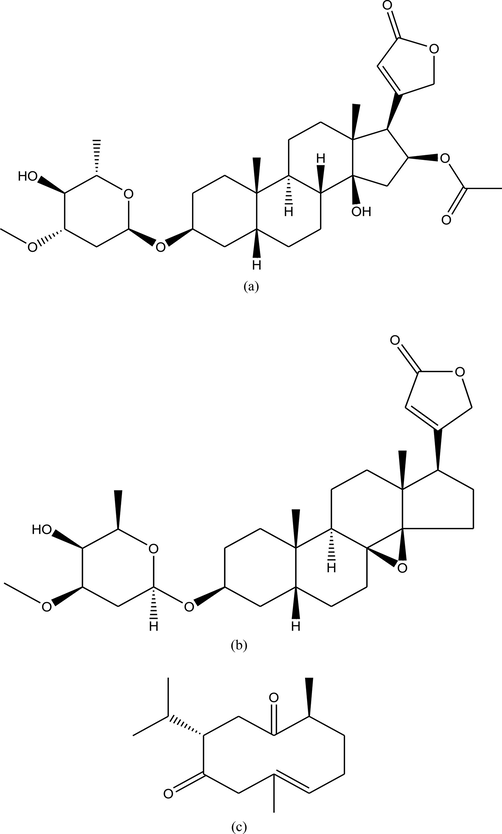
Chemical structures of oleandrin (a), adynerin (b), and internal standard (c).
2.2 Instrument conditions
Waters’ XEVO TQ-S micro triple quadrupole tandem mass spectrometer was used to detect oleandrin and adynerin. Data acquisition and instrument control were performed using Masslynx 4.1 software (Waters Corp.).
Chromatographic conditions: the chromatographic column was UPLC BEH C18 (50 mm × 2.1 mm, 1.7 μm), and the column temperature was set at 40 °C. The mobile phase was acetonitrile–water (containing 0.1 % formic acid), with gradient elution, the flow rate was 0.4 mL/min, and the elution time was 4 min:0 min–0.2 min, acetonitrile 10 %; 0.2 min–1.0 min, acetonitrile 10 %–70 %; 1.0 min–2.5 min, acetonitrile 70 %–90 %; 2.5 min–2.8 min, acetonitrile 90 %–10 %; 2.8 min–4.0 min, acetonitrile 10 %.
MS conditions: nitrogen was used as cone gas (50 L/h) and desolvation gas (1000 L/h). The capillary voltage was set at 3.2 kV; the ion source temperature was 147 °C; and the desolvation temperature was 500 °C. Electrospray ionization (ESI) positive ion mode with multiple reaction monitoring mode (MRM) was used for quantitative analysis: oleandrin m/z 577 → 145 (cone voltage 30 V, collision voltage 22 V), adynerin m/z 534 → 113 (cone voltage 14 V, collision voltage 12 V), and internal standard m/z 237 → 135 (cone voltage 36 V, collision voltage 14 V; Fig. 2).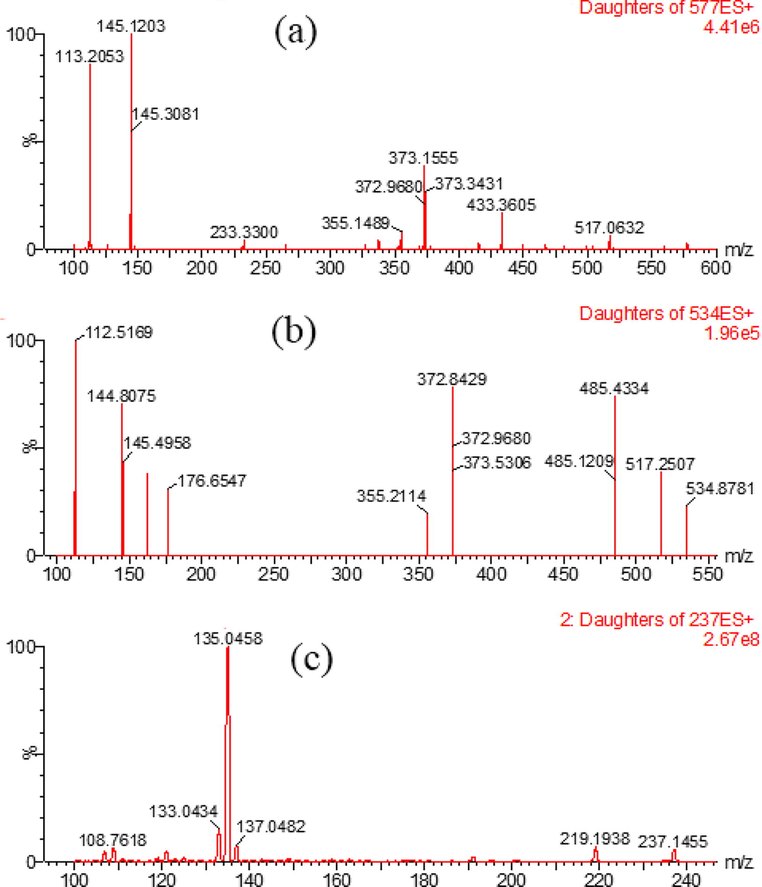
Mass spectrum of oleandrin (a), adynerin (b), and internal standard (c).
2.3 Standard curve
The stock solutions of oleandrin, adynerin, and internal standard were prepared in methanol (500 µg/mL), which were then diluted with methanol to obtain standard working solutions of oleandrin and adynerin at different concentrations. Both stock and working solutions were stored at 4 °C. Appropriate amounts of oleandrin and adynerin working solutions were added to blank rat plasma, and the concentrations of the alkaloids in the rat plasma were 0.5, 2, 10, 20, 50, 100, 200, 500, and 1000 ng/mL; the standard curve range was 0.5–1000 ng/mL. Quality control samples were prepared in a similar manner at three different plasma concentrations (1, 85, and 850 ng/mL).
2.4 Sample processing
About 50 μL of the plasma sample was thawed in a 1.5-mL Eppendorf (EP) tube, and 150 μL of acetonitrile–methanol (9:1, v/v; containing 100 ng/mL of internal standard curdione) was added to the vortex mixer for 1.0 min and centrifuged at 13,000 rpm and 4 °C for 10 min. About 100 μL of the supernatant was transferred into the liner tube of the injection bottle, and the injection volume of 2 μL was used to carry out the UPLC–MS/MS analysis.
2.5 Pharmacokinetics
Oleandrin, at the rates of 1 mg/kg and 5 mg/kg, was administered sublingually (IV) and orally (PO), respectively, to six rats in each group. Adynerin, at the rates of 1 mg/kg and 5 mg/kg, was administered sublingually (IV) and orally (PO), respectively, with six rats in each group. All experimental procedures and protocols were approved by the Animal Care Committee of Wenzhou Medical University (Wydw 2019–0982). About 0.4 mL of blood was drawn from the tail vein, after 0.0833, 0.25, 1, 2, 4, 6, 8, 12, and 24 h, collected in heparinized test tubes, and centrifuged at 13,000 rpm for 10 min. Further, 100 μL of the supernatant serum was then transferred to a fresh 1.5-mL EP tube and stored at − 80 °C until analysis. Pharmacokinetic parameters were statistically calculated using the pharmacokinetic software (DAS version 2.0).
3 Results
3.1 Selectivity
As shown in Fig. 3, the retention time of oleandrin, adynerin, and internal standard was 1.98 min, 2.03 min, and 2.25 min, respectively. Oleandrin, adynerin, and internal standard were efficiently separated by an optimized gradient elution procedure, and no endogenous components were observed at the retention time, which rendered this method to have good selectivity.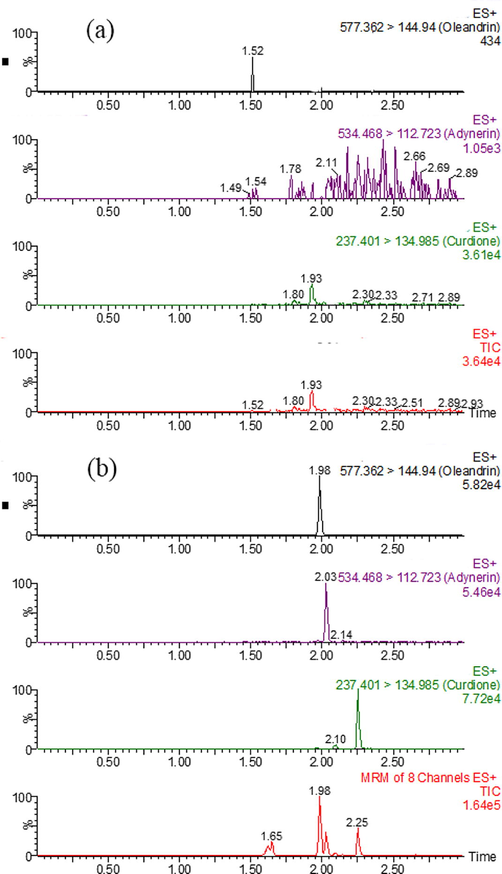
UPLC–MS/MS of oleandrin, adynerin, and internal standard in the rat plasma: (a) blank rat plasma, (b) blank rat plasma spiked with oleandrin, adynerin, and internal standard.
3.2 Standard curve
The calibration curves of oleandrin and adynerin in rat plasma showed good linearity in the range of 0.5–1000 ng/mL, with r ˃ 0.99. A typical regression equation of oleandrin in the rat plasma was as follows:
where × 1 is the concentration of oleandrin in the plasma and y1 is the ratio of the peak area of oleandrin to the internal standard. A typical regression equation of adynerin in the rat plasma was as follows:
where × 2 represents the concentration of adynerin in the plasma and y2 represents the ratio of the peak area of adynerin to the internal standard. The lower limit of quantification of oleandrin and adynerin in the rat plasma was 0.5 ng/mL, and their detection limit (LOD) was 0.15 ng/mL with a signal-to-noise ratio of 3.
3.3 Precision, accuracy, recovery, and matrix effects
The intra- and inter-day precision of oleandrin was within 13 %; the intra- and interday accuracies ranged from 91 % to 108 %; the recovery was ˃ 89 %; and the matrix effect ranged from 90 % to 97 %. The intra- and inter-day precision of adynerin was within 14 %; the intra- and inter-day accuracies ranged from 98 % to 109 %; the recovery was ˃ 86 %, and the matrix effect ranged from 86 % to 94 % (Table 2).
Compound
Concentration (ng/mL)
Accuracy (%)
Precision (RSD%)
Matrix effect (%)
Recovery (%)
Intra-day
Inter-day
Intra-day
Inter-day
0.5
91.7
107.4
12.0
12.4
90.1
91.7
Oleandrin
1
100.8
99.5
10.8
10.9
96.5
89.1
85
92.4
101.0
5.7
6.6
96.0
89.3
850
105.9
94.2
6.0
8.9
95.0
96.0
0.5
98.9
105.8
11.4
13.7
93.9
86.8
Adynerin
1
102.3
101.9
3.3
3.1
90.0
90.5
85
98.9
98.9
3.0
7.4
91.8
88.7
850
104.7
108.3
6.0
2.0
86.3
92.0
3.4 Stability
The rat plasma was placed in the autosampler for 2 h, and the plasma samples were pretreated and stored at room temperature for 24 h. After three freeze–thaw cycles, the stability test was performed at − 20 °C for 30 days. The accuracy of oleandrin was between 92 % and 111 %, and the relative standard deviation (RSD) was within 12 %; the accuracy of adynerin was between 91 % and 107 %, and the RSD was within 14 % (Table 3). These data indicated that oleandrin and adynerin had good stability.
Compound
Concentration (ng/mL)
Autosampler (4 °C, 12 h)
Ambient (2 h)
–20 °C (30 days)
Freeze–thaw
Accuracy
RSD
Accuracy
RSD
Accuracy
RSD
Accuracy
RSD
1
104.2
7.5
108.5
7.6
104.5
11.7
92.8
11.0
Oleandrin
85
96.5
5.7
106.9
8.6
92.9
5.0
110.4
8.7
850
102.2
4.5
98.2
5.2
108.1
8.8
102.9
7.3
1
105.3
6.5
99.3
3.4
91.5
13.2
93.4
11.2
Adynerin
85
102.2
5.8
106.4
5.7
104.2
6.6
93.0
4.8
850
96.0
4.1
105.0
1.8
102.2
4.9
103.6
5.6
3.5 Pharmacokinetics
The concentration–time curves of oleandrin and adynerin in the rat plasma are shown in Fig. 4. The main pharmacokinetic parameters are listed in Table 4, and the oral bioavailability of oleandrin and adynerin was low, 7.0 % and 93.1 %, respectively.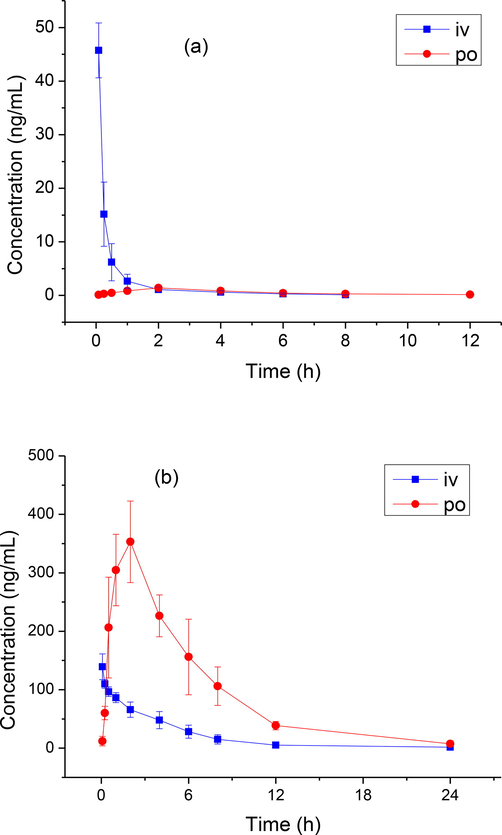
Concentration–time curve of rats after intravenous (IV, 1 mg/kg) and oral (PO, 5 mg/kg) administration of oleandrin (A) and adynerin (B).
Compound
Group
AUC(0–t) ng/mL × h
AUC(0–∞) ng/mL × h
t1/2z h
CLz/F L/h/kg
Vz/F L/kg
Cmax ng/mL
Oleandrin
PO, 5 mg/kg
6.8 ± 1.4
7.4 ± 1.4
2.9 ± 0.3
693.8 ± 118.8
2979.1 ± 785.0
1.4 ± 0.2
IV, 1 mg/kg
19.3 ± 4.1
19.9 ± 4.2
2.2 ± 0.5
52.2 ± 11.5
164.1 ± 54.2
45.8 ± 5.1
Adynerin
PO, 5 mg/kg
2287.5 ± 350.6
2336.9 ± 382.8
4.2 ± 0.6
2.2 ± 0.3
13.1 ± 2.1
357.6 ± 69.1
IV, 1 mg/kg
491.4 ± 81.4
495.3 ± 85.5
3.0 ± 1.1
2.1 ± 0.3
8.5 ± 2.0
139.3 ± 22.0
4 Discussion
Oleander has cardiotonic, diuretic, antitumor, analgesic, antitussive, anti-inflammatory, and other effects(Wang et al., 2000, Calderon-Montano et al., 2013, Pan et al., 2015). Its main chemical components are cardiac glycosides, steranes, terpenes, flavonoids, and so on(Mohapatra et al., 2021). Of these, cardiac glycosides exist in a large variety, are high in content in oleander, and were found to be the most important active ingredient of all. Oleandrin was the strongest antitumor active monomer compound in oleander, but its poor drug-like properties, low water solubility (<10 μg/mL), and narrow therapeutic window severely limited its use as an antitumor agent. Therefore, it was necessary for us to examine its pharmacokinetics.
The optimal MS conditions were obtained by optimizing the spray needle voltage, drying gas temperature, capillary voltage, and shock energy. On comparing the positive and negative modes, oleandrin and adynerin were found to be more suitable for ESI positive detection and to have higher sensitivity. Then, the MS ion scan was carried out by selecting a fragment ion with higher abundance as the quantitative ion and optimizing the MS parameters such as cone voltage and collision energy. The obtained MS parameters were as follows: the selected quantitative transitions were oleandrin m/z 577 → 145 (cone voltage 30 V, collision voltage 22 V); adynerin m/z 534 → 113 (cone voltage 14 V, collision voltage 12 V); and internal standard m/z 237 → 135 (cone voltage 36 V, collision voltage 14 V). The use of MRM mode was beneficial for improving the accurate qualitative and quantitative abilities of trace target compounds in complex sample matrices.
In this experiment, the effects of plasma and different protein precipitants on the extraction efficiency were investigated. The plasma samples of oleandrin and adynerin with concentrations of 100 ng/mL were prepared from the rat blank plasma, and the extraction efficiency of acetonitrile, methanol, 10 % trichloroacetic acid, methanol–acetonitrile (1:1, v/v), and methanol–acetonitrile (1:9, v/v) were tested. The results showed that methanol–acetonitrile (1:9, v/v) had the highest extraction efficiency, and it was selected as the precipitant. In this study, only 50 μL of plasma was needed for the sample treatment, and only 0.5 mL of blood sample was needed as reported in the literature(Ying et al., 2018).
Oleandrin and adynerin are rapidly metabolized in rats, with the half-life (t1/2) of oral administration being 2.9 ± 0.3 h and 4.2 ± 0.6 h, respectively. The oral bioavailability of oleandrin was 7.0 %, whereas that of adynerin was 93.1 %; the difference in the bioavailability of the two alkaloids might be due to the difference in their structural formulas. In this study, a method for the determination of oleandrin and adynerin in the rat plasma by UPLC–MS/MS technology was established. Each sample analysis only needed 4 min, and was applicable to pharmacokinetics and bioavailability in the rat plasma.
Declaration of Competing Interest
The authors declare that they have no known competing financial interests or personal relationships that could have appeared to influence the work reported in this paper.
References
- Investigation of cardiac glycosides from oleander in a human induced pluripotent stem cells derived cardiomyocyte model. Toxicol. Lett.. 2021;350:261-266.
- [CrossRef] [Google Scholar]
- A review of the natural history, toxinology, diagnosis and clinical management of Nerium oleander (common oleander) and Thevetia peruviana (yellow oleander) poisoning. Toxicon.. 2010;56:273-281.
- [CrossRef] [Google Scholar]
- Oleandrin distribution in a fatality from rectal and oral Nerium oleander extract administration. J. Anal. Toxicol.. 1987;11:219-221.
- [CrossRef] [Google Scholar]
- A hydroalcoholic extract from the leaves of Nerium oleander inhibits glycolysis and induces selective killing of lung cancer cells. Planta. Med.. 2013;79:1017-1023.
- [CrossRef] [Google Scholar]
- Does the Nerium oleander extract PBI-05204 have potential for pancreatic cancer therapy? Invest. New Drugs. 2015;33:787.
- [CrossRef] [Google Scholar]
- Anna Carfora,Rafaella Petrella·,Renata Borriello et al.2020. Fatal poisoning by ingestion of a self–prepared oleander leaf infusion. Forensic Science, Medicine and Pathology. 17, pages120–125. https://doi.org/10.1007/s12024-020-00338-w.
- Outbreak of Oleander (Nerium oleander) Poisoning in Dairy Cattle: Clinical and Food Safety Implications. Toxins (Basel). 2020;12
- [CrossRef] [Google Scholar]
- Interference of oleandrin and oleandrigenin in digitoxin immunoassays: minimal cross reactivity with a new monoclonal chemiluminescent assay and high cross reactivity with the fluorescence polarization assay. Ther. Drug Monit.. 1997;19:465-469.
- [CrossRef] [Google Scholar]
- Toxicity effects of Nerium oleander, basic and clinical evidence: a comprehensive review. Hum. Exp. Toxicol.. 2020;39:773-784.
- [CrossRef] [Google Scholar]
- Yellow Oleander Seed, or “Codo de Fraile” (Thevetia spp.): a review of its potential toxicity as a purported weight-loss supplement. J. Diet. Suppl.. 2018;15:352-364.
- [CrossRef] [Google Scholar]
- UHPLC-MS/MS determination of oleandrin in blood and tissues of dairy cattle poisoned by oleander (Nerium oleander) Anal. Methods. 2019;11:5562.
- [CrossRef] [Google Scholar]
- Severe oleander poisoning presenting with hyperkalaemia and unusual electrocardiographic changes. Eur. J. Case Rep. Intern. Med.. 2021;8:003044
- [CrossRef] [Google Scholar]
- Determination of bovine blood oleandrin by high-performance liquid chromatography and postcolumn derivatization. J. Chromatogr. Sci.. 2002;40:515-518.
- [CrossRef] [Google Scholar]
- Acute oleander poisoning: a study of clinical profile from a tertiary care center in South India. J. Family Med. Prim. Care. 2020;9:136-140.
- [CrossRef] [Google Scholar]
- Malysheva SV, Mulder PPJ, Masquelier J. 2020.Development and Validation of a UHPLC-ESI-MS/MS Method for Quantification of Oleandrin and Other Cardiac Glycosides and Evaluation of Their Levels in Herbs and Spices from the Belgian Market. Toxins (Basel). Apr 9;12(4):243. https://doi.org/10.3390/toxins12040243.
- Leaf extract of Nerium oleander L. inhibits cell proliferation, migration and arrest of cell cycle at G2/M phase in HeLa cervical cancer cell. Anticancer Agents Med. Chem.. 2021;21:649-657.
- [CrossRef] [Google Scholar]
- Rapid quantitative analysis of oleandrin in human blood by high-performance liquid chromatography. Nihon Hoigaku Zasshi. 1997;51:315-318.
- [Google Scholar]
- PBI-05204, a supercritical CO(2) extract of Nerium oleander, inhibits growth of human pancreatic cancer via targeting the PI3K/mTOR pathway. Invest. New Drugs. 2015;33:271-279.
- [CrossRef] [Google Scholar]
- Oleandrin produces changes in intracellular calcium levels in isolated cardiomyocytes: a real-time fluorescence imaging study comparing adult to neonatal cardiomyocytes. J. Toxicol. Environ. Health A. 2007;70:568-574.
- [CrossRef] [Google Scholar]
- Rapid detection of oleandrin and adynerin in human blood by HPLC-MS/MS. Chinese J. Forens. Med.. 2017;32:514-517.
- [Google Scholar]
- Nerium oleander derived cardiac glycoside oleandrin is a novel inhibitor of HIV infectivity. Fitoterapia. 2013;84:32-39.
- [CrossRef] [Google Scholar]
- Negligible oleandrin content of hot dogs cooked on Nerium oleander skewers. J. Med. Toxicol.. 2021;17:57-60.
- [CrossRef] [Google Scholar]
- Determination of oleandrin in tissues and biological fluids by liquid chromatography-electrospray tandem mass spectrometry. J. Agric. Food Chem.. 2005;53:4322-4325.
- [CrossRef] [Google Scholar]
- LC/MS/MS analyses of an oleander extract for cancer treatment. Anal. Chem.. 2000;72:3547-3552.
- [CrossRef] [Google Scholar]
- HPLC-MS/MS determination of oleandrin and adynerin in blood with solid phase supported liquid-liquid extraction. Med. Plant. 2018;9:5-8.
- [CrossRef] [Google Scholar]
- Determination of oleandrin in blood and liver samples by LC-MS/MS. Fa Yi Xue Za Zhi. 2018;34:585-589.
- [CrossRef] [Google Scholar]


