

Translate this page into:
Integration of metabolomics and network pharmacology to validate the mechanism of Schisandra chinensis(Turcz.)Baill - Acorus tatarinowii Schott ameliorating the Alzheimer's disease by regulating the aromatase activity to affect local estrogen in brain of AD model rats
⁎Corresponding author. cmubbwei@126.com (Binbin Wei)
-
Received: ,
Accepted: ,
This article was originally published by Elsevier and was migrated to Scientific Scholar after the change of Publisher.
Peer review under responsibility of King Saud University.
Abstract
Alzheimer's disease (AD) is a latent and progressive neurodegenerative disease. Schisandra chinensis(Turcz.)Baill - Acorus tatarinowii Schott (Sc-At) are effective in treating neurological disorders.
Purpose of this study is to explore the mechanism of Sc-At in AD treatment. First, untargeted ultra-performance liquid chromatography quadrupole-time of flight/mass spectrometer (UPLC-QTOF/MS) metabolomics was employed to detect the rat brain metabolism. Then, network pharmacology was used to determine the potential anti-AD targets. Bioinformatics, and molecular docking were conducted for further analysis. A MetScape study examined the association between differential metabolites and potential targets. Finally, the targeted ultra-performance liquid chromatography tandem mass spectrometry (UPLC-MS/MS) metabolomics and the potential protein activity studies were carried out to elucidate the mechanisms. The results showed that Sc-At improved the neuronal cell alignment disorder in hippocampal CA1 region of AD rats. In brain metabolomics, 30 differential metabolites were screened in the study model versus blank group. The network pharmacology analyzed 54 targets of Sc-At anti-AD where, 14 were correlated with amyloid β-protein (Aβ). Aromatase was selected as an important hub target having the best binding power in molecular docking simulation predictions and also correlated with Aβ. Further tests showed that the brain aromatase activity, and the downstream product 17β-Estradiol levels were elevated in AD rats treated with Sc-At. This work may provide new perspectives for the pharmacological effects and the action mechanisms of natural compounds extracts in treating AD progression.
Keywords
Alzheimer’s disease
Schisandra chinensis(Turcz.)Baill - Acorus tatarinowii Schott
UPLC-QTOF/MS
Metabolomics
Aromatase

- Aβ
-
amyloid β-protein
- AD
-
Alzheimer's disease
- At
-
Acorus tatarinowii Schott
- C-T-P-D
-
Compound-Target-Pathway-Disease
- DHA
-
docosahexaenoic acid
- ESI
-
Electron Spray Ionization
- Sc
-
Schisandra chinensis(Turcz.)Baill
- DL
-
drug likeness
- H & E
-
Hematoxylin-Eosin
- IS
-
Internal standard
- MW
-
molecular weight
- MWM
-
Morris water maze
- MTBE
-
methyl tert-butyl ether
- NMDA
-
N-methyl-d-aspartate
- OB
-
oral bioavailability
- OPLS-DA
-
orthogonal partial least squares discriminant analysis
- PCA
-
principal components analysis
- PLS-DA
-
Partial least squares Discriminant Analysis
- QC
-
Quality control
- QED
-
Quantitative estimate of drug-likeness
- TCM
-
traditional Chinese medicine
- UPLC-QTOF/MS
-
Ultraperformance liquid chromatography quadrupole-time of flight/mass spectrometer
- UPLC-MS/MS
-
Ultra performance liquid chromatography tandem mass spectrometry
- VIP
-
Variable importance in the projection
Abbreviations
1 Introduction
Alzheimer's disease is one of the leading causes of dementia. Its clinical manifestations are memory impairment and executive dysfunction (Qi, 2019). Currently, the two main classes of drugs approved by the FDA for clinical use are cholinesterase inhibitors and N-methyl-d-aspartate (NMDA) receptor antagonists. The multi-target, efficient, and low toxicity drugs for treating Alzheimer's disease need further developments (Vaz and Silvestre, 2020). Studies have shown that traditional Chinese medicine (TCM), Sc has some active ingredients with apparent protection against neurodegenerative diseases, mainly through anti-inflammatory, anti-oxidant, and inhibiting cell apoptosis (Tingxu, 2021). At is listed as top grade in “ <Shen Nong Ben Cao Jing>, described as ”long service, not forgetting, not confused, and prolonging life“ (Wumu, 2020). These two traditional Chinese medicines are often used in animal models to study and treat neurodegenerative diseases (Zhong, 2020).
Studies have shown that occurrence and development of AD are related to the estrogen content in brain. In the brain, aromatase is the rate-limiting enzyme for converting androgens to estrogen. The aromatase activity may have estrogen-mediated neuroprotective effects. The brain estrogen deficiency might be a risk factor for pathological development of AD (Yue, et al., 2005). In clinical practice, estrogen replacement therapy has been used to treat AD. The prolonged treatment can reduce the risk of AD and can even delay its onset.
There are however many experimental studies which indicate that estrogen replacement therapy does not improve recognition levels and may increase the risk of breast and ovarian cancers (Saeed, 2021). It is therefore vital to find a safe alternative to estrogen drugs. Natural bioactive compounds often offer reliable therapeutic options (Iqubal, 2021). Phytoestrogens are the non-steroidal natural compounds with estrogenic effects. They are mainly composed of isoflavones, lignans, coumestans, mycoestrogens, etc. Our previous studies have shown that most of the active ingredients in Sc-At are lignans and isoflavones. Moreover, Sc-At can regulate plasma metabolites to the average levels in AD model rats. However, the mechanism and target of Sc-At in treating AD have not been completely understood.
Metabolomics is a discipline developed in recent years based on genomics and proteomics. It focuses on small molecular metabolites participating in metabolic pathways and transforms small changes in genes and proteins into changes in metabolites (Yang, 2021). To further explore what causes the changes in metabolites, based on the characteristics of TCM, network pharmacology analyzes the relationship between different components of TCM, establishes the overall relationship between active ingredients and targets, diseases. The drug-disease network can find the potential target of Sc-At in AD treatment. Metabolomics screen the differential metabolites of Sc-At in AD model rats. Network pharmacology finds the targets of Sc-At for AD treatment and analyzes enzymes regulating the differential metabolites. Molecular docking simulations predict the key enzymes and validate their activity. The findings suggest that the two complement each other.
Herein, Sc-At key targets and mechanisms for treating AD are explored based on metabolomics and network pharmacology. It is proposed that Sc-At may ameliorate Alzheimer's disease by regulating the aromatase activity to affect local estrogen in the brain of AD rats. The flowchart is given in Fig. 1.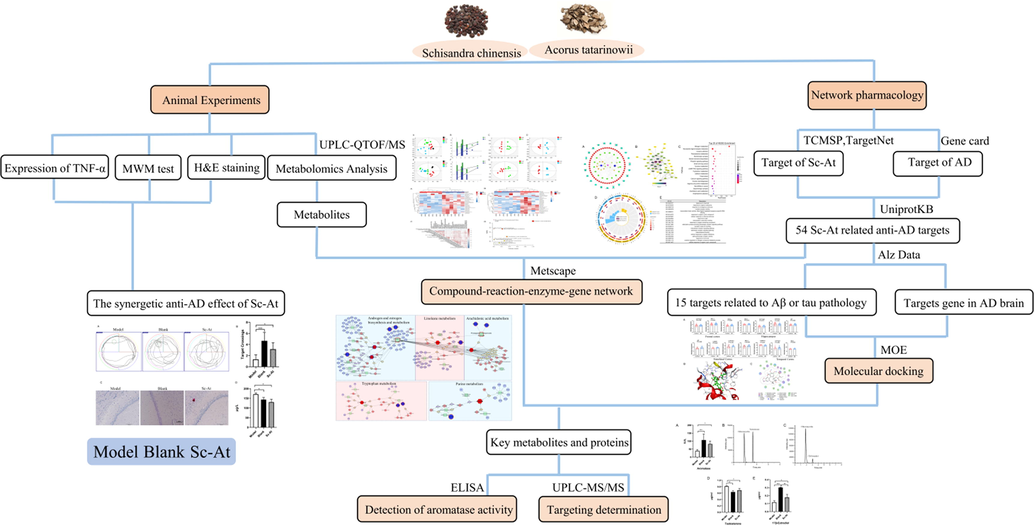
Workflow for dissecting the combination mechanisms of Sc-At for treating AD.
2 Material and methods
2.1 Reagents
Sc and At were purchased from Shenyang Tianyitang (China) and identified by UPLC. Samples were stored in the author's laboratory. Aβ25-35 was obtained from Bioss (BJ10228890, China). TNF- α kit was purchased from Beijing Chenglin Biotechnology Co., ltd (E-30633, China). Aromatase kit was obtained from Shanghai MLBIO Biotechnology Co., ltd (ML734808, China). BCA protein quantification kit was from Beyotime (P0012, China). d-galactose, Standard 17β-Estradiol and chloramphenicol were acquired from Shanghai Yuanye Biotechnology Co., ltd (R24O11H128688, YN1124DA14, D23S10G98511, China). Standard testosterone was purchased from Dr. Ehrenstorfer GmbH (G1088065, Germany). Acetonitrile and methanol were procured from Merck (I1133629 105, I1143835 114, Germany). Ultrapure water was from Watsons (China). Formic acid and ammonium acetate were purchased from Thermo Fisher Scientific (202674,153073, USA). Leucine Enkephalin was from Waters Corporation (W12011813, USA). All other reagents were of HPLC grade.
2.2 Preparation of drugs extract
The drug extraction method was followed according to our group's previous component screening method. Sc-At extracts were prepared by ultrasonic ethanol extraction. Sc and At were weighed as 50 g (1:1, w/w), soaked them in 90 % ethanol for 1 h and extracted them twice with 90 % ethanol for 2 h. The extract was concentrated in vacuum and lyophilized into powder. It was formulated into 1.5 g /mL Sc-At solution in distilled water, put the mixture for ultrasonic dispersion to obtain a soluble solution and stored at 4 °C (Chen, 2022).
2.3 Animals and drug administration
The animal experiments were approved by the animal ethics committee of China Medical University (CMU2019257). Liaoning Changsheng Biotechnology Co. ltd provided 8-week-old male Wistar rats (weight 200 g ± 20 g) and were kept at 24 ± 2 °C with humidity of 55 ± 5 %. A 12 h light–dark cycle was set and rats were given access to standard diet and water. After one week of environmental adaptation, they were randomly divided into three groups: Blank, Model, and Sc-At. Model, and Sc-At groups were given 120 mg/kg/d of d-galactose and 40 mg/kg/d of aluminum trichloride (Chiroma, 2018). From 5th week, Sc-At group began to receive 2.5 g/kg/d Sc-At treatment. Until the 8th week, both Model and Sc-At groups were injected with 10 μg/side of Aβ 25–35 into bilateral ventricles (Zuo, 2018; McDonald et al., 2021). Sc-At group continued to get Sc-At for 1 week. The previous results showed significant difference in serum estrogen levels between ovariectomized APP mice and sham-operated APP mice, however there was no difference in brain estrogen levels (Yue, et al., 2005). Therefore, castration was not performed in this experimental design.
2.4 Morris water maze (MWM) test
MWM device consisted of circular pool with 50 cm depth and 160 cm diameter, circular platform with 10 cm diameter escape platform, tracking camera acquisition equipment, and computer analysis system. It was divided into four quadrants on average. The escape platform was fixed in the center of fourth quadrant, and various geometric shapes were set around the pool wall to assist the positioning memory of experimental rats. The day before the experiment, pool was cleaned, peculiar smell was removed, and pool was filled with water until the depth was about 1.5 cm above the escape platform. An appropriate amount of black ink was then added to the water, stirred to make it turbid for hiding the escape platform. Water temperature was adjusted to 25 ± 2 °C and the experimental environment was set to the best light. The original platform was removed on the 6th day, and rats were placed at any water entry point in the water. All rats were at the same water entry point and numbers of times the rats crossed original platform in 2 min were recorded.
2.5 Sample collection
Samples were collected after MWM test. Rats groups were decapitated and brain tissue samples were collected on day 73. Half were fixed in 10 % formalin and the other half stored at −80 °C.
2.6 Hematoxylin-Eosin (H & E) staining
Brain tissue fixed in 10 % formalin was removed, dehydrated with ethanol solution, embedded in paraffin, and sliced into 5 μm with section cutter. Staining was done with H & E, observed, and photographed under visible light microscope (Hyman, 1984).
2.7 TNF-α inflammatory factor expression assay
AD is a chronic inflammatory disease and studies have reported that TNF-α signaling exacerbates Aβ and tau protein pathology, and inhibition of TNF-α expression delays cognitive impairment in AD patients. The experiments were performed according to the commercial TNF-α Elisa kit.
2.8 Untargeted metabolomics
2.8.1 Sample preparation
The brain tissue samples were taken out from −80 °C storage and thawed to 4 °C. They were homogenized at 4 °C for 60 s with 35 Hz frequency and weighed 50 mg (±5 mg) tissue followed by the addition of 1.5 mL methanol: water (1:1). The mixture was vortexed for 60 s, kept at −20 °C for 20 min and centrifuged at 4 °C for 15 min at 12000 rpm to precipitate the proteins. The supernatant was taken and dried with nitrogen. The 100 μL of 50 % methanol was used to redissolve, and vortexed for 60 s. Quality control (QC) samples were prepared by mixing all brain tissue samples equally and centrifuged at 4 °C for 15 min at 12000 rpm. The supernatant was collected for testing and QC sample was inserted to every 6 test samples for checking the stability and performance of the instrument.
2.8.2 UPLC-QTOF/MS analysis
Xevo G2-XS QTOF/MS (Walter, Milford, USA) was employed to analyze the brain samples through Waters ACQUITY UHPLC system controlled by Masslynx (Version 4.1, Walter, Milford, USA). Chromatographic separations were performed on ACQUITY UPLC® HSS T3 column (100 mm × 2.1 mm, 1.8 μm, Waters, USA) at 40 °C with flow rate 0.4 mL/min and injection volume 3 μL. The mobile phase consisted of 0.1 % formic acid in water (solution A) and acetonitrile (solution B). The gradient elution was 0–2 min, 95 % B; 2–21 min, 95 %-5% B; 21–23 min, 95 % B. MS detections were made in positive and negative electrospray ionization modes (ESI+/-). The optimized conditions were as follows: Ion source temperature, 120 °C, de-solvent gas temperature, 540 °C, de-solvent gas flow, 800 L/h, cone voltage 45 v; In ESI+, capillary voltage, 3.0 kV; in ESI-, capillary voltage, 2.5 kV; MSE mode was used to ensure the accuracy of spectral acquisition in the scanning range of m/z 100–1200 Da. A locked spray interface was utilized to obtain the accurate masses at flow rate of 10 μL/min and a locked mass of leucine enkephalin at 200 pg/μL concentration was used to monitor ESI+/ESI- (ESI+: 556.2771; ESI-: 554.2615).
2.8.3 Data processing and analysis
UPLC-QTOF/MS data of brain tissue samples was imported into ProgenesisQi2.3 for peak extraction, peak matching, and peak alignment. The data was normalized using the total ionic strength. The analysis was then carried out using SIMCA14.1 for partial least squares discriminant analysis (PLS-DA) and orthogonal partial least squares discriminant analysis (OPLS-DA). Differential metabolites were screened based on Variable importance in the projection (VIP) > 1 and t-test (P < 0.05). The differential metabolites were identified from HMDB database (http://www.hmdb.ca). Pathway analysis was conducted with MetaboAnalyst5.0 (https://www.metaboanalyst.ca/).
2.9 Network pharmacological analysis
The active components of Sc-At were screened from TCMSP database (https://tcmsp-e.com/) according to the oral bioavailability (OB) ≥ 30 % and drug likeness (DL) ≥ 0.18. Quantitative estimate of drug-likeness (QED) were evaluated through ETCM database (http://www.tcmip.cn/ETCM/index.php/Home/Index/), QED: >0.67 (Good), QED: 0.67–0.49 (Moderate), and QED < 0.49 (Weak) (Xu, 2020). The canonical smiles of active ingredients were obtained through PubChem database (https://pubchem.ncbi.nlm.nih.gov/). The corresponding target was predicted through TargetNet database (http://targetnet.scbdd.com/) using canonical smiles of active ingredients, and selected prob = 1.0. Prediction of disease targets was made using GeneCards database (https://www.genecards.org/) with chosen score of ≥ 30. The target of Sc-At in AD treatment was obtained by Venn diagram (http://bioinformatics.psb.ugent.be/webtools/Venn/). These targets were imported into UniProtKB (http://www.uniprot.org/) to standardize the gene and protein names. A protein–protein interaction (PPI) network was established by STRING 11.0 (https://string-db.org/). Hub genes were identified based on degree. Enrichment of KEGG pathway was done through David database (https://david.ncifcrf.gov/tools.jsp). GO enrichment analysis was also performed. C-T-P-D networks were constructed by Cytoscape 3.7.2.
2.10 Bioinformatics analysis of Sc-At targets related to Aβ and tau pathology
The correlations between potential targets and AD disease were further explored. Screened targets were imported to CFG Rank module of AlzData database (http://www.alzdata.org/index.html) for the difference analysis, Pathology cor (Aβ): correlation of target gene expression with AD pathology in Aβ line AD mouse models, Pathology cor (tau): correlation of target gene expression with AD pathology in tau line AD mouse models, CFG: total CFG score of target gene, 1 CFG point was added if any of the above evidence was significant; CFG point ranged from 0 to 5 (Xu, 2018).
Sc-At's normalized expression targets against AD in control and AD groups of GEO dataset were analyzed by “Differential expression” module of AlzData database (Zeng, 2021). The brain regions were divided into four areas: hippocampus, frontal cortex, entorhinal cortex, and temporal cortex. The respective statistical analysis was carried out. Visualization was made using GraphPad Prism software. Values were presented as mean ± SD. A total of 11 datasets from GEO database were used.
2.11 Molecular docking
The 3D structure of Sc-At active ingredient was obtained from Chemical Book (https://www.chemicalbook.com/ProductIndex.aspx). The crystal structures of hub targets were acquired from PDB (https://www1.rcsb.org/). The protein was introduced into MOE (2015.10), and the structure was optimized by adding hydrogen atoms and removing water. A site finder was used to select the best docking pocket. Compounds were treated with minimum energy, the molecular docking parameter replacement was set to triangle matcher, rescoring 1 to ASE, refinement to the forcefield, rescoring 2 to ASE, and default for other parameters. Finally, the docking results were achieved.
2.12 Analysis of related metabolites and targets
The compound-reaction-enzyme-gene network was constructed to further reveal the relation between metabolites and potential targets (Li, 2021). KEGG IDs of 30 screened differential metabolites and the gene symbols of hub targets were imported into MetScape plugin of Cytoscape software to construct a pathway-based correlation network map.
2.13 Aromatase activity verified by ELISA
The aromatase activity in rat brain was detected through commercial ELISA kit by following the manufacturer’s instructions. The protein concentration was determined by BCA protein quantification kit and the actual protein activity was calculated for each sample.
2.14 Targeted metabolomics
2.14.1 Standard solutions
The 2 mg of 17β-Estradiol, testosterone, and chloramphenicol standard products were weighed and placed in 10 mL volumetric flask. Methanol solution containing 0.1 % ascorbic acid was added to dissolve and dilute to the mark for the standard stock solution (200 μg/mL). The solution was stored at −20 °C in dark. The 1.0 mL of standard stock solution of 17β-Estradiol and testosterone was taken in 10 mL volumetric flask. Methanol solution containing 0.1 % ascorbic acid was added to the mark, and diluted to 20 μg/mL, 10 μg/mL, 2 μg/mL, 1 μg/mL, 200 ng/mL, and 100 ng/mL. The 1.0 mL of chloramphenicol standard stock solution was taken in 10 mL volumetric flask and methanol solution containing 0.1 % ascorbic acid was added to the mark to obtain internal standard (IS) solution (20 μg/mL). 0.5 mL of each standard solution was taken and added with 50 μL of IS solution to measure and draw the standard curve.
2.14.2 Sample preparation
The 50 mg ± 5 mg brain homogenate was weighed and 1 mL methyl tert-butyl ether (MTBE) was added. It was vortexed for 60 s, kept at −20 °C for 20 min, and centrifuged at 4 °C for 5 min at 13000 rpm. The supernatant was collected. 200 μL MTBE was added to the precipitate for further extraction and repeated the above stated steps. The obtained supernatant was combined with the earlier supernatant. The content was blow dried with nitrogen, redissolved in 100 μL of 45 % methanol (aq) containing 2 mmol/L ammonium acetate with 0.1 % formic acid. The mixture was centrifuged at 4 °C for 5 min at 13000 rpm. 80 μL was taken and added with 10 μL of 200 μg/mL chloramphenicol for detection (Rossi, 2010).
2.14.3 UPLC-MS/MS analysis
Agilent 1290 UPLC-ABTripleQuad 3500 MS/MS system was employed having ACQUITY UPLC® HSS T3 column (100 mm × 2.1 mm, 1.8 μm, Waters, USA) operated at 25 °C with the flow rate 0.3 mL/min and injection volume 2 μL. The mobile phase consisted of 10 mmol/L ammonium acetate (solution A) and acetonitrile (solution B). The gradient elution was performed as follows: 0–0.5 min, 35 % B; 0.5–5 min, 35 %-65 % B; 5–5.10 min, 65 %-35 % B; 5.10–7 min, 35 % B. The ionization parameters: curtain gas (CUR), 20 (arbitrary units); ion source gas 1 (GS1), 50 (arbitrary units); ion source gas 2 (GS2), 50 (arbitrary units); source temperature (TEM), 500 °C; entrance potential (EP), 10 V. The dwell time of each MRM transition was 50 ms.
2.14.4 Data processing
The standard curve of 17β-Estradiol and testosterone from the rat brain was generated by plotting the least square linear regression relationship between the peak area ratio of the analyte to IS (y) and the concentration ratio of the analyte to IS (x). All values were represented as the mean ± SD. The data analysis was made by ANOVA using GraphPad Prism 9.0. The p < 0.05 was considered statistically significant for all the tests.
2.15 Statistical analysis
The data was expressed as the mean ± SD. Statistical analysis was performed by one-way analysis of variance (ANOVA) using GraphPad Prism 9.0. A p-value of < 0.05 was statistically significant.
3 Results
3.1 MWM test
In the space exploration experiment on 6th day, the number of crossing platform for model group decreased compared to the blank group. The number of crossing platform of Sc-At increased compared to the model group. The results showed that Sc-At had significant effect on increasing the number of crossing platform of AD rats (Fig. 2A-B).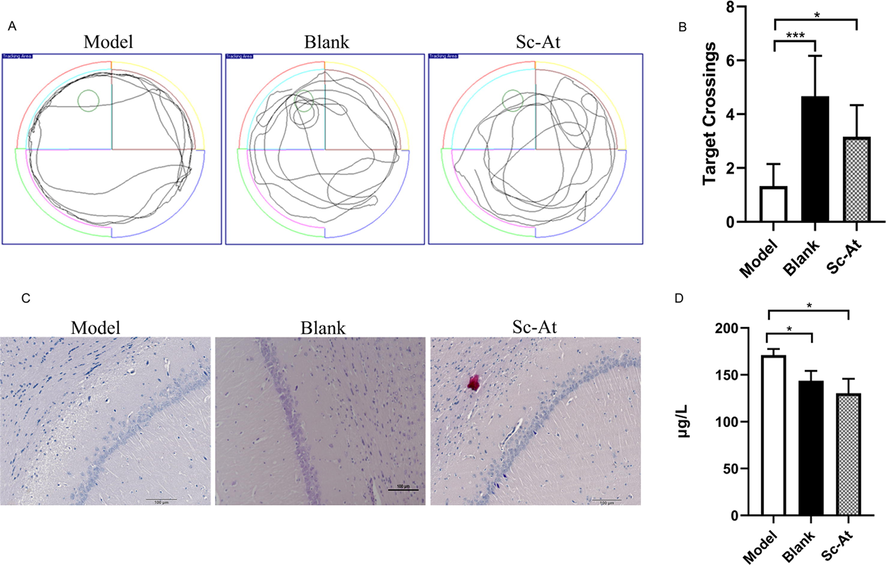
(A) In MWM test, the motion trajectories of three groups of rats. (B) In MWM test, the times of crossing the platform of the three groups of rats were compared (n = 6, ***P < 0.001, *P < 0.05). (C) The results of H & E staining in the hippocampus of rat brain tissue. (D) Expression of TNF-α in rat brain tissue. (n = 3, *P < 0.05).
3.2 H & E staining
The neuronal layer cells in hippocampal CA1 area were observed by H & E staining. The neurons in blank group's CA1 region of hippocampus were tightly arranged with large and regular nuclei. The neurons in CA1 area of hippocampus in model group were sparse and disordered. Compared with model group, the rats in Sc-At group showed that the neurons in CA1 area of hippocampus in rats were arranged more neatly, and the numbers of cells were also significantly greater (Fig. 2C).
3.3 Expression of TNF-α in rat brain tissue
In the model group, expression of TNF-α was significantly higher than that in blank group and Sc-At groups. (Fig. 2D).
3.4 Analysis of untargeted metabolomics results
3.4.1 Data analysis
The brain tissue samples were detected in positive and negative modes and QC was inserted to every-six samples to evaluate the instrument's stability. The representative total ion chromatography through ESI + and ESI- is shown in Fig. 3. The supervised PLS-DA diagram showed that QC group gathered together proved the high stability of instrument, the samples within the group were gathered together while samples between the groups were different. The model group was far from the blank, indicating difference between the two. Sc-At group was closer to the blank, revealing that the metabolic disorder caused by disease had been recovered after its administration and treatment, (ESI+, R2Y = 0.896, Q2 = 0.655; ESI-, R2Y = 0.998, Q2 = 0.757). The results of 200- Permutation test for PLS-DA analysis showed that PLS-DA model was not over-fitted, and the model results were reliable. OPLS-DA diagram showed that the model group was significantly separated from the blank, and differential metabolites were being tracked in this model. These results showed that Sc-At improved the metabolic disorder in the brain of AD rats (Fig. 4A-H). (OPLS-DA parameters of each group and Permutation test results are shown in Table S1 and Figure S1).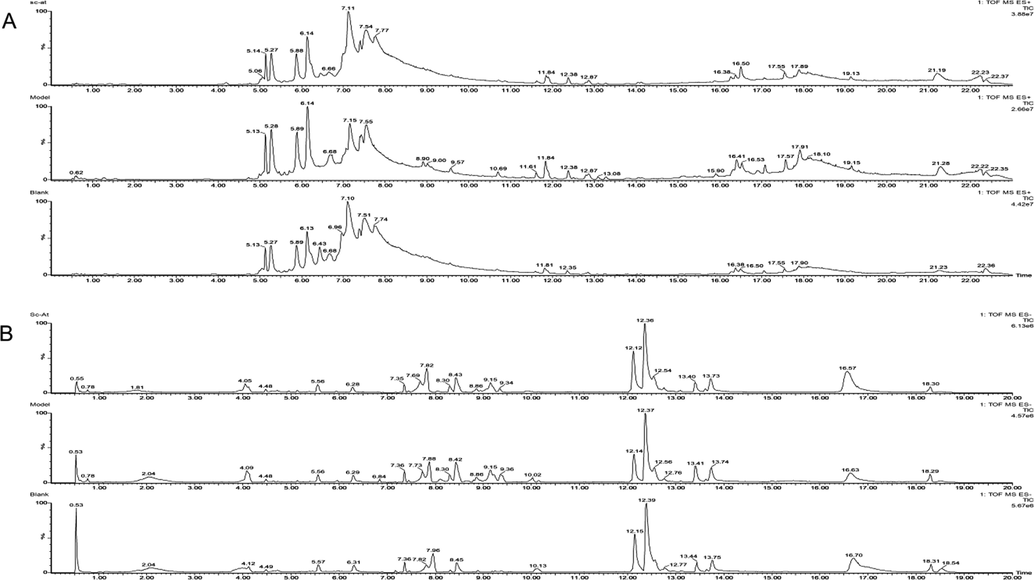
Representative total ion chromatography of (A) ESI+ (B) ESI-.
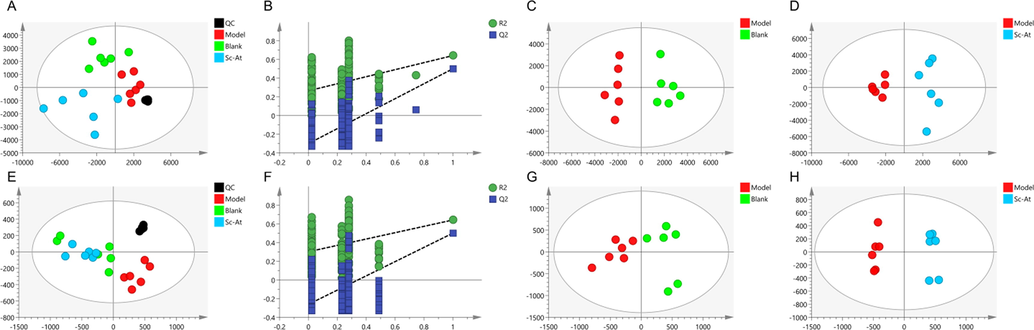
Results of metabolomic analysis of brain tissue based on liquid mass spectrometry. ESI+ (A) PLS-DA score plots. (B) PLS-DA analysis of 200 permutation test (C) OPLS-DA score plots Model vS Blank. (D) OPLS-DA score plots Model vS Sc-At. ESI- (E) PLS-DA score plots. (F) PLS-DA analysis of 200 permutation test (G) OPLS-DA score plots Model vS Blank. (H) OPLS-DA score plots Model vS Sc-At.
3.4.2 Screening differential metabolites and pathway enrichment
789 metabolites were identified in ESI + mode and 254 in ESI- mode. According to VIP > 1 and P < 0.05, 30 metabolites were differentially expressed between the model and blank groups, 18 differential metabolites between the Sc-At and model groups, 19 differential metabolites between Sc-At and blank groups. The differential metabolites between the Model and Blank groups are mentioned in Table 1. Compared with the blank, the content of 26 metabolites in model group decreased after administration, the content of 2 metabolites increased after administration, and the trend is reflected in Figure S2. Differential metabolites for model and Sc-At groups are in Table S2, differential metabolites for the blank and Sc-At groups are in Table S3. The unsupervised clustering heat map of differential metabolites between the model and blank groups, the blank and Sc-At groups was drawn, and correlation between differential metabolites was analyzed (Fig. 5A-C).
Description
Compound ID
Formula
Adducts
m/z
VIP
Anova (p)
Mass Error (ppm)
Fold change
Scan mode
Trend (M/B)
3-Dehydroxycarnitine
HMDB0006831
C7H15NO2
M + K
184.07
1.13
2.13E-03
4.63
1.71
ESI+
↓
N-Formyl-l-glutamic acid
HMDB0003470
C6H9NO5
M + Na, M + K
198.04
1.57
4.06E-09
2.83
1.53
ESI+
↓
Proflavine
HMDB0015255
C13H11N3
M + NH4
227.13
1.61
2.45E-06
−1.49
1.91
ESI+
↓
Eplerenone
HMDB0014838
C24H30O6
M + H, M + Na, M + K, M + NH4, M + H-H2O
415.21
3.14
6.76E-04
4.32
1.82
ESI+
↓
16-alpha-Hydroxyandrosterone
HMDB0013156
C25H47NO5
M + K
480.31
2.79
2.22E-03
2.56
3.95
ESI+
↓
LysoPE(18:0/0:0)
HMDB0011130
C23H48NO7P
M + H, M + Na, M + H-H2O
482.32
4.05
1.10E-02
1.13
2.24
ESI+
↓
LysoPC(16:0)
HMDB0010382
C24H50NO7P
M + H
496.34
2.43
1.77E-03
1.15
1.64
ESI+
↓
LysoPC(18:2(9Z,12Z))
HMDB0010386
C26H50NO7P
M + H
520.34
1.23
2.91E-03
4.53
3.62
ESI+
↓
LysoPC(18:1(11Z))
HMDB0010385
C26H52NO7P
M + H, M + Na
522.36
6.63
1.07E-05
0.51
2.33
ESI+
↓
LysoPC(18:0)
HMDB0010384
C26H54NO7P
M + H, M + Na
524.37
4.26
8.78E-03
0.18
2.85
ESI+
↓
LysoPC(20:4(5Z,8Z,11Z,14Z))
HMDB0010395
C28H50NO7P
M + H
544.34
4.49
2.09E-04
1.43
1.86
ESI+
↓
LysoPC(22:6(4Z,7Z,10Z,13Z,16Z,19Z))
HMDB0010404
C30H50NO7P
M + H
568.34
3.95
4.41E-04
1.46
1.93
ESI+
↓
Ceramide (d18:1/18:0)
HMDB0004950
C36H71NO3
M + Na
588.53
5.85
1.19E-03
3.44
4.89
ESI+
↑
PC(16:0/16:0)
HMDB0000564
C40H80NO8P
M + H
734.57
12.51
4.11E-02
3.07
1.53
ESI+
↓
PC(14:0/20:3(5Z,8Z,11Z))
HMDB0007881
C42H78NO8P
M + H
756.56
4.60
1.78E-03
4.30
5.23
ESI+
↓
PE(18:3(6Z,9Z,12Z)/20:5(5Z,8Z,11Z,14Z,17Z))
HMDB0009137
C43H70NO8P
M + K
798.45
3.66
2.32E-07
−1.99
2.07
ESI+
↓
PE(18:3(9Z,12Z,15Z)/22:0)
HMDB0009171
C45H84NO8P
M + K
836.55
1.12
2.58E-03
−2.72
1.41
ESI+
↓
PE(20:2(11Z,14Z)/24:1(15Z))
HMDB0009311
C49H92NO8P
M + H-H2O
836.66
1.45
3.70E-02
4.74
2.94
ESI+
↓
trans-2-Enoyl-OPC6-CoA
HMDB0011121
C37H58N7O18P3S
M + H-H2O
996.28
2.20
8.12E-07
2.59
1.43
ESI+
↓
l-Tryptophan
HMDB00929
C11H12N2O2
M−H
203.08
1.11
3.16E-03
−1.77
1.58
ESI-
↓
Palmitoleic acid
HMDB03229
C16H30O2
M−H
253.22
1.03
1.23E-03
1.50
1.52
ESI-
↓
Inosine
HMDB00195
C10H12N4O5
M−H
267.07
3.29
2.52E-03
2.18
1.22
ESI-
↑
Linoleic acid
HMDB00673
C18H32O2
M−H
279.23
2.34
4.33E-02
2.31
1.56
ESI-
↓
Elaidic acid
HMDB00573
C18H34O2
M−H
281.25
3.48
5.82E-04
2.83
1.42
ESI-
↓
Mesterolone
HMDB06036
C20H32O2
M−H
303.23
8.35
1.40E-04
2.84
1.37
ESI-
↓
8,11,14-Eicosatrienoic acid
HMDB02925
C20H34O2
M−H
305.25
1.02
6.10E-04
1.58
2.03
ESI-
↓
Docosahexaenoic acid
HMDB02183
C22H32O2
M−H
327.23
7.57
2.45E-05
3.24
1.71
ESI-
↓
Adrenic acid
HMDB02226
C22H36O2
M−H
331.27
1.67
6.36E-06
2.71
1.64
ESI-
↓
DG(18:1(9Z)/18:2(9Z,12Z)/0:0)
HMDB07219
C39H70O5
M + K-2H
655.47
1.38
3.25E-07
1.81
4.74
ESI-
↓
TG(16:0/16:1(9Z)/20:4(5Z,8Z,11Z,14Z))[iso6]
HMDB05380
C55H96O6
M + K-2H
889.67
1.71
4.27E-02
0.82
10.00
ESI-
↑
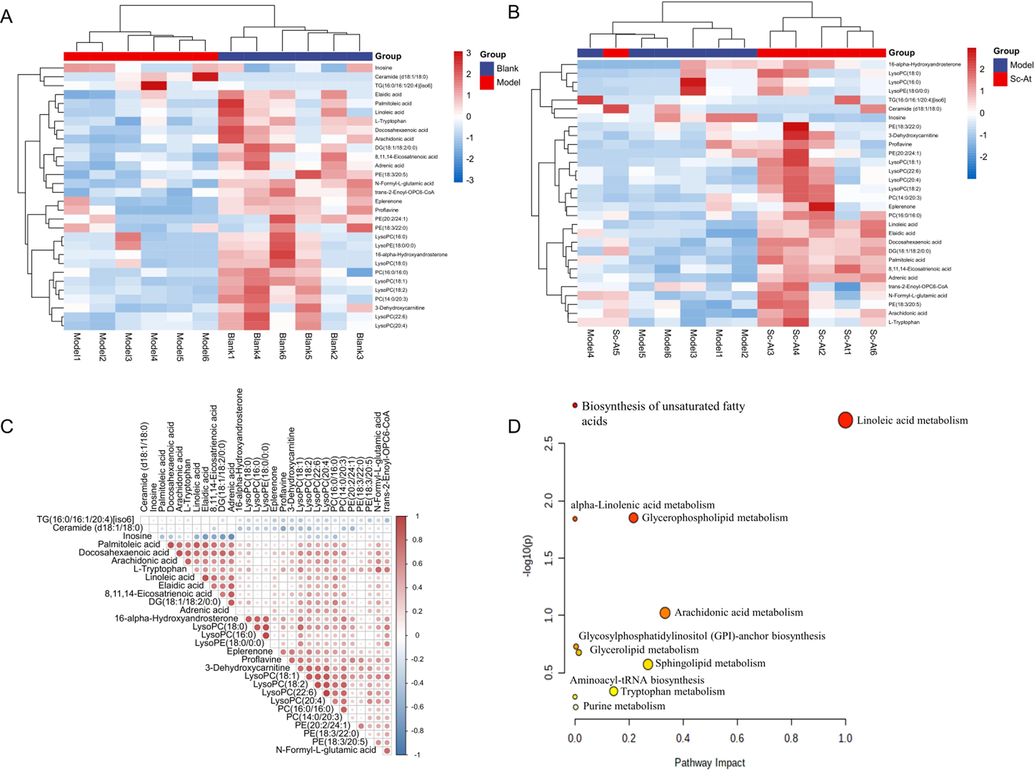
Unsupervised clustering heat map of the differential metabolites between (a) the model and the blank group, (b)the blank group and the sc-at group (c)correlation analysis between different metabolites (d) kegg pathway analysis of brain samples collected from ad rats.
Further, the metabolic pathways affected by Sc-At treatment of AD were explored, and the obtained differential metabolites were enriched through MetaboAnalyst5.0, Linoleic acid metabolism, Biosynthesis of unsaturated fatty acids, Glycerophospholipid metabolism, and alpha-Linolenic acid metabolism pathway were significantly affected(P < 0.05) (Fig. 5D, Table S4).
3.5 Network pharmacological analysis results
According to OB ≥ 30 % and DL ≥ 0.18, 9 active compounds had been identified in Sc and 5 in At. TargetNet database predicted the target of active compounds, and 71 targets were predicted. AD-related targets finally determined 14 active compounds by regulating 54 AD related targets and constructed the component-target-pathway network diagram (Fig. 6A). PPI network was made by Cytoscape to further explore the key genes of Sc-At in AD treatment. Hub genes were calculated according to degree where ESR1, PTGS2, and CYP19A1 were the hub genes (Fig. 6B). The role of potential targets in AD treatment was further studied, KEGG pathway was enriched and the top 20 according to P-value were selected to construct the bubble diagram, including the steroid hormone biosynthesis and tyrosine metabolism (Fig. 6C). Moreover, GO enrichment analysis was carried out and top 20 were screened according to p-value. The response to lipid process in biological system was closely related to the development of AD (Fig. 6D-E).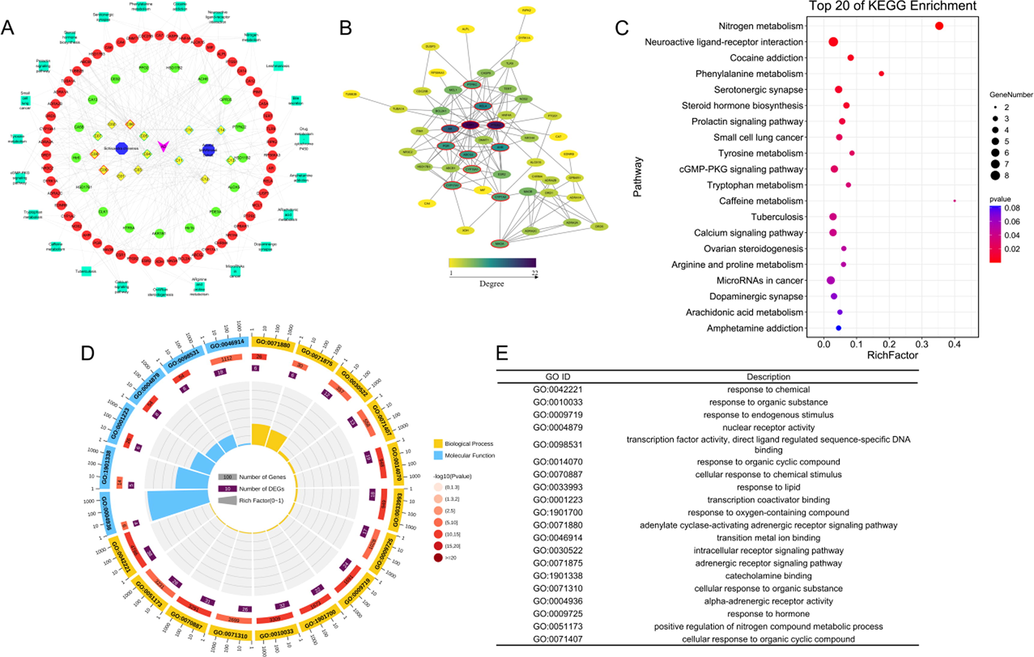
Network pharmacology analysis of Sc-At treating AD. (A) The constructions and analysis of Compound-Target-Pathway-Disease (C-T-P-D) network of Sc-At. Candidate compounds (yellow diamond) and different pathological properties (good: red border, moderate: blue border, week: green border and N/A: grey border), putative targets (green ellipse) and AD-associated proteins (red ellipse), pathways (green rectangle) and diseases (purple V) formed the C-T-P-D network of Sc-At. (B) The PPI network of Sc-At treatment on AD. Node color reflects its degree. The nodes with red borders represent the hub genes. (C) The KEGG pathways enrichment analysis by David database. (D-E) GO enrichment analysis.
3.6 Bioinformatics analysis of Sc-At targets related to Aβ and tau pathology
The relationship between target, and Aβ and tau protein was explored where 14 out of 54 potential targets were correlated with Aβ and 7 with tau protein. Higher the CFG, higher was the correlation with AD. The score of CYP19A1 was 3 (Table S5).
Compared to the controls, ADRA2A and TUBA1A were higher in AD patients while AR, MCL1, and RELA were lower. These results indicated that Sc-At related anti-AD targets were closely associated with the pathology of Aβ and tau (Fig. 7A).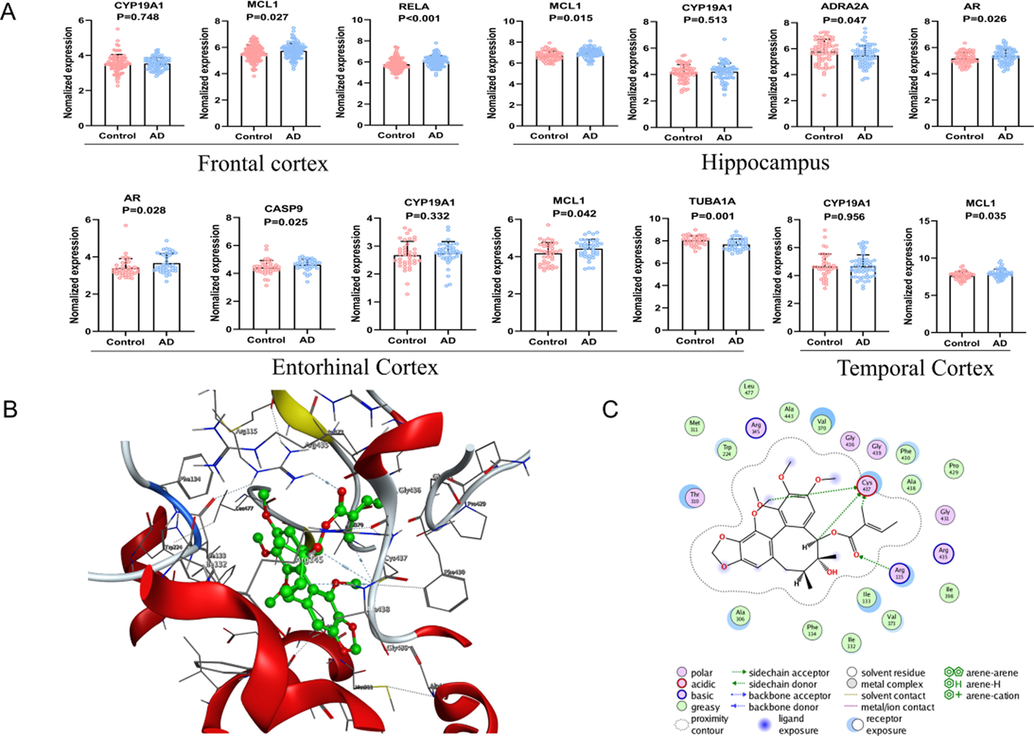
(A) Targets of Sc-AT against AD in the control and AD groups of the GEO dataset. (Entorhinal cortex, n = 39 in each group. Hippocampus, n = 66 in the control group, n = 74 in the AD group. Frontal Cortex, n = 88 in the control group, n = 73 in the AD group. Temporal cortex, n = 39 in the control group, n = 52 in the AD group. Values are presented as the mean ± SD.) Molecular docking results. (B)The 3D interaction diagrams of aromatase. (C) The 2D interaction diagrams of aromatase.
3.7 Molecular docking simulation
Molecular docking simulation prediction was carried out according to the key targets screened by network pharmacology, and the targets of strong correlation with AD achieved by bioinformatics analysis. S was scored according to Gibbs free energy. The docking score for CYP19A1 was optimal (Table S6), for example between CYP19A1 and Schizandrer B, hydrogen bond was formed through Cys at position 437. The results are shown in Fig. 7B-C.
3.8 Comprehensive analysis of metabolomics and network pharmacology
PTGS, XDH, and CYP19A1 were the key targets as shown in Fig. 8. Related metabolites were arachidonic acid, linoleic acid, inosine, estrogen, etc. They may play essential role in treating AD by Sc-At.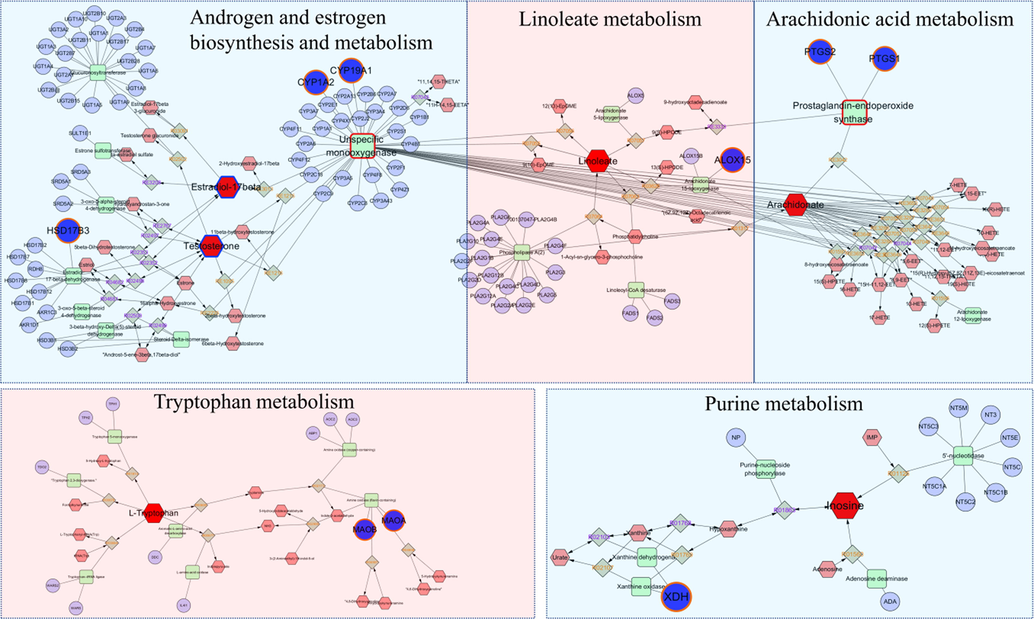
The compound-reaction-enzyme-gene networks of the key metabolites and targets. The red hexagons, grey diamonds, green round rectangle, and blue circles represent the differential metabolites, reactions, proteins, and genes, respectively, and the target determination metabolites with a blue border. The key metabolites, proteins, and genes were magnified.
3.9 Detection of aromatase activity by ELISA
Based on the molecular docking results, the scores of CYP19A1 and active compounds in Sc-At were the highest, and AlzData database showed that CYP19A1 had correlation with AD pathology. However, the verification experiment of GEO database showed that compared with the control, the gene CYP19A1 of AD group had no significant changes in all regions of brain tissue (Prange-Kiel, 2016). The aromatase activity was tested as per the findings of relevant literature on therapeutic mechanism of effective components in Sc and At. The aromatase activity in model group decreased compared to the blank and increased after Sc-At treatment. The enzyme activities of three groups are shown in Fig. 9A.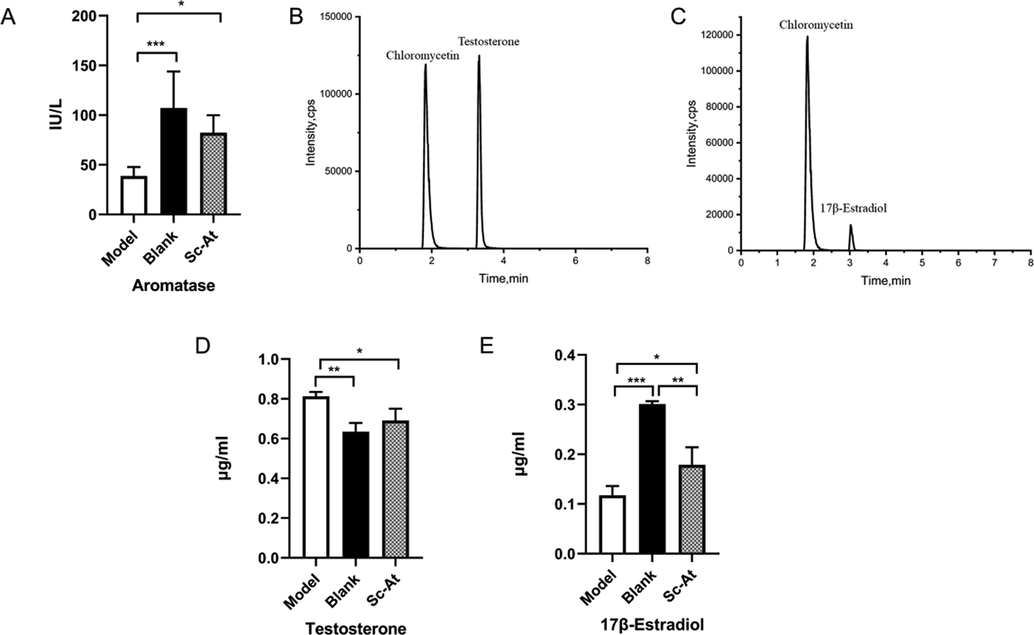
(A)Effect of Sc-At extracts on aromatase activity in the brain of Rats. The chromatogram obtained through the final UPLC/MS/MS showed good resolution among the two compounds. (B)Testosterone and Chloramphenicol(C)17β-Estradiol and Chloramphenicol. Testosterone and 17β-Estradiol levels in rat brain. (D)Testosterone (E)17β-Estradiol. ALL data were expressed as means ± SD, (n = 3, *P < 0.05, **P < 0.01, ***P < 0.001).
3.10 Analysis of targeted metabolomics results
Each compound's standard solution (2 μg/mL) was infused for MS/MS optimization (Table 2). The chromatograms of test substance and IS chloramphenicol are shown below. IS was well separated from testosterone (Fig. 9B) and 17β-Estradiol (Fig. 9C). The standard curves of testosterone and 17β-Estradiol had an excellent linear relationship. Results showed that the content of testosterone in model group increased compared with the blank, while content of 17β-Estradiol decreased. The testosterone content decreased in Sc-At group compared to the model group, while the content of 17β-Estradiol increased (Fig. 9D-E).
compound
Ionization mode
parent ion(m/z)
daughter ion (m/z)
declustering potential
collision energy(eV)
17β-Estradiol
ESI-
271.2
183.2
−100
−57
Testosterone
ESI+
289.0
97.0
75
30
Chloramphenicol
ESI-
320.9
257.0
−80
–22
Chloramphenicol
ESI+
323.2
304.9
75
12
4 Discussion
Sc and At are the two traditional Chinese medicines improving the mental health, capacity, and intelligence. They are often used in treating the dizzy epilepsy, forgetfulness, and deafness. MWM test and H & E staining results were different for the model and blank groups, indicating that AD rats were successfully modeled and compared with Sc-At group where Sc-At proved to have therapeutic effect on AD.
The network pharmacological screening showed that Sc-At had the characteristics of multiple compounds and multiple targets in AD treatment. The analysis of brain metabolomics found that AD caused brain metabolic disorder in rats. Sc-At treatment improved the metabolic disorder, explored its causes, and found the relationship between CYP19A1 and the metabolites. The molecular docking results showed that Schizandrer B in Sc-At and CYP19A1 had the best binding force. There was no difference in the gene expression between AD and control groups based on differential expression analysis. Combined with the relevant literature on therapeutic mechanism of Sc-At, it was decided to verify it from the perspective of testing the aromatase activity.
Aromatase is the rate-limiting enzyme for converting androgen to estrogen (Bogus, 2019). Free estrogen is the type of hormone playing its role, of which 17β-Estradiol has the vital biological activity (Morselli, 2018). Recent studies had shown that estrogen may act on neurons related to learning, memory, and cognition by promoting the expression of choline acetyltransferase, establishing and maintaining the synaptic connections (especially hippocampal neurons), affecting other molecules related to learning and memory such as asparagine, and promoting the expression of nerve growth factor receptor, finally regulating and improving the learning, memory and cognitive functions (Silva et al., 2001). It had been shown that 17β-Estradiol reduced the production of Aβ in neuroblastoma cells, and at 200 nM concentration of 17β-Estradiol, the Aβ1-42 production was reduced by about 50 % (Xu, 1998). It was also reported that 17β-Estradiol attenuated the Aβ-induced apoptosis in rat hippocampal neurons because of 17β-Estradiol affecting the Bcl-X expression, which was consistent with the results predicted by the network pharmacology in this study (Pike, 1999). It was also found that the addition of estradiol to SH-SY5Y cells and fetal rat cortex primary cultures increased the total Tau protein expression and decreased the proline-directed tau phosphorylation. The addition of okadaic acid to human and rat cells resulted in tau hyperphosphorylation where estradiol was found to prevent okadaic acid-induced tau hyperphosphorylation at both proline- and non-proline-directed sites (Alvarez-de-la-Rosa, 2005). Results of this study showed that aromatase activity was decreased in the model group compared to the blank and 17β-Estradiol content was also decreased. The enzyme activity increased after Sc-At treatment, and 17β-Estradiol content also increased. It is suggested that Sc-At can increase the aromatase activity and thus increase the estrogen content to play an anti-AD effect.
Based on network pharmacology, it was found in this study that Sc-At may act on PTGS2 and PTGS1. Some studies have shown that PTGS can participate in coding cyclooxygenase-2 (COX-2), and COX-2 can convert arachidonic acid to prostaglandin E2 (PGE2) having pro-inflammatory effect (Ren, 2020). The inflammation can cause tissue cell damage, cell deformation, or necrosis, and finally lead to the loss of neurons. Besides network pharmacology, we also conducted brain metabolomics to screen the arachidonic acid metabolic pathway. The results showed that active component in Sc-At had superior binding force with PTGS2, which simultaneously changed the content of arachidonic acid.
Unsaturated fatty acids are abundantly expressed in the brain and have roles including neurotransmission and neuroinflammation. In previous studies, decreased brain docosahexaenoic acid (DHA) levels were found in AD patients. DHA has shown to attenuate postsynaptic dendritic proteins, and NMDA receptors in AD mice. DHA is also associated with learning and memory. DHA is the major source of conversion to phosphatidylserine and enhances the in vitro phosphatidylserine synthesis. DHA reduction in membranes causes impairment of phosphatidylserine-mediated transport and activation of AKT and RAF1 which play role in promoting neurogenesis. In this study, the biosynthetic pathway of unsaturated fatty acids was regulated, and DHA content in this pathway was elevated after Sc-At treatment relative to the model group. So, one of the mechanisms of Sc-At treatment of AD may act by regulating the biosynthetic pathway of unsaturated fatty acids.
Lysophosphatidylcholine (LPC) is biologically active, involved in phospholipid metabolism, and participates in signal transduction, gene expression, and cell proliferation. Abnormal phospholipid metabolism on the nerve cell membrane is the characteristic pathological change of AD which leads to cell membrane disintegration and loss of neurons in the pathogenesis of AD. Results showed that the content of LPC in model group decreased compared to the blank, and increased after Sc-At treatment. At the same time, more LPC metabolites were screened. It indicated that Sc-At can have anti-AD effect by regulating the phospholipid metabolism.
Hypoxanthine nucleoside, also known as inosine, is produced by adenosine deamination. It is reported that the adenosine phosphate deaminase activity in the brain of AD patients increases which accelerates the degradation of adenosine phosphate into adenosine to increase the inosine content. This study showed that inosine content in the brain tissue of model group was higher than that of the blank. After Sc-At administration, the inosine levels were downregulated compared with those of the model group, demonstrating that Sc-At can act by affecting the purine metabolism.
Long-chain sphingosine bases and fatty acids produce ceramide. Studies have shown that in neurodegenerative diseases such as AD, membrane related oxidative stress is abnormally active which leads to the ceramide accumulation and decreases sphingosine. Abnormal oxidative stress has role in developing AD. Enrichment studies of metabolomic pathways showed that the model group led to a disorder of sphingolipid metabolism which was improved by Sc-At treatment, demonstrating that Sc-At played role in AD treatment by regulating the sphingolipid metabolism.
5 Conclusion
The study revealed the targets and mechanisms of Sc-At for treating Alzheimer's disease based on metabolomics, network pharmacology, bioinformatics, molecular docking, and potential protein activity studies. The findings provided new ideas to investigate the therapeutic mechanism of herbal medicines. The results also revealed that Sc-At alleviated the metabolic disorders caused by Aβ. Moreover, it may help treating AD via its effects on aromatase activity and estrogen levels.
Author contribution
Bin-bin Wei designed the research; Wenqian Hao, Jian Chen, Ying Zhang, Tingting Mou, Jing Wang, Chengqin Zhang, Shuo Gu, Tiantian Zhao, Yue Sun, Meirong Cui performed research; Wenqian Hao analyzed data and wrote the paper.
Acknowledgments
This work was supported by the National Science Foundation of China (No. 81703519), Shenyang city Science and Technology Program (No: 21-108-9-12), Natural Science Research Program Of yichang city (A20-3-028) and National Science Foundation of China (No. 81903793).
Declaration of Competing Interest
The authors declare that they have no known competing financial interests or personal relationships that could have appeared to influence the work reported in this paper.
References
- Estradiol prevents neural tau hyperphosphorylation characteristic of Alzheimer's disease. Ann. N. Y. Acad. Sci.. 2005;1052:210-224.
- [Google Scholar]
- Chronic antipsychotic treatment modulates aromatase (CYP19A1) expression in the male rat brain. J. Mol. Neurosci. : MN. 2019;68(2):311-317.
- [Google Scholar]
- Explore the therapeutic composition and mechanism of Schisandra chinensis-Acorus tatarinowii Schott on Alzheimer's disease by using an integrated approach on chemical profile, network pharmacology, and UPLC-QTOF/MS-based metabolomics analysis. Oxid. Med. Cell Longev.. 2022;2022:6362617.
- [Google Scholar]
- d-galactose and aluminium chloride induced rat model with cognitive impairments. Biomed. Pharmacother. = Biomed. Pharmacother.. 2018;103:1602-1608.
- [Google Scholar]
- Alzheimer's disease: cell-specific pathology isolates the hippocampal formation. Science. 1984;225:1168-1170.
- Current quest in natural bioactive compounds for Alzheimer's disease: multi-targeted-designed-ligand based approach with preclinical and clinical based evidence. Curr. Drug Targets. 2021;22(6):685-720.
- [Google Scholar]
- Integrated metabolomics and network pharmacology to reveal the mechanisms of hydroxysafflor yellow A against acute traumatic brain injury. Comput. Struct. Biotechnol. J.. 2021;19:1002-1013.
- [Google Scholar]
- A toxic synergy between aluminium and amyloid beta in yeast. Int. J. Mol. Sci.. 2021;22(4)
- [Google Scholar]
- Impact of estrogens and estrogen receptor-α in brain lipid metabolism. Am. J. Physiol. Endocrinol. Metabol.. 2018;315(1)
- [Google Scholar]
- Estrogen modulates neuronal Bcl-xL expression and beta-amyloid-induced apoptosis: relevance to Alzheimer's disease. J. Neurochem.. 1999;72(4):1552-1563.
- [Google Scholar]
- Aromatase expression in the hippocampus of AD patients and 5xFAD mice. Neural Plast.. 2016;2016:9802086.
- [Google Scholar]
- Effect of Alpinia oxyphylla-Schisandra chinensis herb pair on inflammation and apoptosis in Alzheimer's disease mice model. J. Ethnopharmacol.. 2019;237:28-38.
- [Google Scholar]
- Network pharmacology combined with metabolomics approach to investigate the protective role and detoxification mechanism of Yunnan Baiyao formulation. Phytomed. : Int. J. Phytother. Phytopharmacol.. 2020;77:153266
- [Google Scholar]
- Serum steroid profiling for congenital adrenal hyperplasia using liquid chromatography-tandem mass spectrometry. Clin. Chim. Acta; Int. J. Clin. Chem.. 2010;411(3–4):222-228.
- [Google Scholar]
- Molecular mechanisms of sex hormones in the development and progression of Alzheimer's disease. Neurosci. Lett.. 2021;764
- [Google Scholar]
- Schisandra chinensis protects against dopaminergic neuronal oxidative stress, neuroinflammation and apoptosis via the BDNF/Nrf2/NF-κB pathway in 6-OHDA-induced Parkinson's disease mice. Food Funct.. 2021;12(9)
- [Google Scholar]
- Alzheimer's disease: Recent treatment strategies. Eur. J. Pharmacol.. 2020;887:173554
- [Google Scholar]
- Bajitianwan attenuates D-galactose-induced memory impairment and bone loss through suppression of oxidative stress in aging rat model. J. Ethnopharmacol.. 2020;261
- [Google Scholar]
- Estrogen reduces neuronal generation of Alzheimer beta-amyloid peptides. Nat. Med.. 1998;4(4):447-451.
- [Google Scholar]
- A systematic integrated analysis of brain expression profiles reveals YAP1 and other prioritized hub genes as important upstream regulators in Alzheimer's disease. Alzheimer's Dement. : J. Alzheimer's Assoc.. 2018;14(2):215-229.
- [Google Scholar]
- Pharmacological mechanisms underlying the neuroprotective effects of Miq. on Alzheimer's disease. Int. J. Mol. Sci.. 2020;21(6)
- [Google Scholar]
- Biomarkers for the clinical diagnosis of Alzheimer’s disease: metabolomics analysis of brain tissue and blood. Front. Pharmacol. 2021
- [Google Scholar]
- Yue, X., et al., Brain estrogen deficiency accelerates Abeta plaque formation in an Alzheimer's disease animal model. Proceedings of the National Academy of Sciences of the United States of America, 2005. 102(52): p. 19198-19203.
- The main alkaloids in and their anti-Alzheimer's disease mechanism determined by a network pharmacology approach. Int. J. Mol. Sci.. 2021;22(7)
- [Google Scholar]
- A novel polysaccharide from Acorus tatarinowii protects against LPS-induced neuroinflammation and neurotoxicity by inhibiting TLR4-mediated MyD88/NF-κB and PI3K/Akt signaling pathways. Int. J. Biol. Macromol.. 2020;163:464-475.
- [Google Scholar]
- RKIP-mediated NF-κB signaling is involved in ELF-MF-mediated improvement in AD rat. Int. J. Med. Sci.. 2018;15(14):1658-1666.
- [Google Scholar]
Appendix A
Supplementary material
Supplementary data to this article can be found online at https://doi.org/10.1016/j.arabjc.2022.104457.
Appendix A
Supplementary material
The following are the Supplementary data to this article:Supplementary data 1
Supplementary data 1


