Translate this page into:
A well-trained artificial neural network for predicting the optimum conditions of MWCNT–ZnO (10:90)/ SAE 40 nano-lubricant at different shear rates, temperatures, and concentration of nanoparticles
⁎Corresponding authors. s.eftekhari@iaukhsh.ac.ir (S. Ali Eftekhari), Toghraee@iaukhsh.ac.ir (Davood Toghraie)
-
Received: ,
Accepted: ,
This article was originally published by Elsevier and was migrated to Scientific Scholar after the change of Publisher.
Peer review under responsibility of King Saud University.
Abstract
ANN model has high accuracy for estimating the
of MWCNT–ZnO/ SAE 40 nano-lubricant.
of MWCNT –ZnO (10:90)/ SAE 40 nano-lubricant was predicted using an ANN. This ANN achieves 0.9995 and 0.00048 values for R2 and MSE. The temperature and SR have a significant influence on the output.
has a direct but negligible effect on
.
Abstract
Fluid limitation in various industries due to their poor thermal conductivity has led to the improvement of the properties of the base fluid as a new method. With the development of nanofluid research, nanofluids are produced by adding metal nanoparticles and multi-walled carbon nanotubes (MWCNT). Due to the inability of theoretical models to predict the viscosity of nano-lubricants ( ), mathematical models, especially artificial neural networks (ANNs), investigate the effect of various parameters on the properties of nanofluids and have replaced most of the usual statistical methods. This study investigates the effect of temperature, shear rate (SR), and volume fraction of nanoparticles ( ) on of MWCNT –ZnO (10:90)/ SAE 40 nano-lubricant. Also, a nonlinear polynomial with terms up to power 3 is fitted in the experimental data, and its accuracy is compared to that of ANN in MATLAB. It was proposed that the ANN model has high accuracy (slightly better concerning nonlinear polynomial) for estimating the present study, the of MWCNT–ZnO (10:90)/SAE 40 nano-lubricant. This ANN achieves 0.9995 and 0.00048 values for R2 and MSE, while the nonlinear polynomial showed 0.9983 and 4.0223 values, respectively, for the same parameters, which shows the good training status of the ANN. According to obtained results, the temperature and SR significantly influence the output. The experimental results showed that by increasing the temperature from 25 to 50 ˚C, the of the nano-lubricant decreased from 397.5 to 90.5 cP ( = 1 % and SR = 400 rpm). So, the results show that with increasing temperature to 50 ˚C, the viscosity of the nano-lubricant decreases by about 77 %. With increasing SR from 400 to 1000 rpm(at T = 50 ˚C and = 1 %), the viscosity of the nano-lubricant decreases from 90.5 to 85.3 cP. On the other hand, has a direct but negligible effect on . In other words, the nanoparticle fraction change from 0 to 1 %, changes the from 150 cP to around 200 cP. This model can be used as a design tool in future research or as an objective function in optimization problems.
Keywords
Artificial neural network (ANN)
Multi-walled carbon nanotubes (MWCNT)
SAE 40-nano lubricant
ZnO
Least square method
- MWCNT
-
Multi-walled carbon nanotubes
- ANN
-
Artificial Neural Network
- SR
-
Shear rate
- logsig
-
Logarithm Sigmoid Function
- tansig
-
Tangent Hyperbolic Sigmoid Function
- MLP
-
Multi-layer Perceptron
- LM
-
Levenberg-Marquart
- MSE
-
Mean Square Error
Abbreviations
Nomenclature
- T (oC)
-
temperature
- R2
-
Correlation Coefficient
- (rpm)
-
Shear rate
- (cP)
-
Dynamic viscosity of nanofluid
- φ
-
Volume fraction
1 Introduction
It may be safe to say that in the last two decades, significant changes have been made in many engineering sciences and techniques, and a major part of these changes is related to nanotechnology and the research conducted in this field (Sun et al., 2021; Keshtegar et al., 2020; Safa et al., 2020; Bagheri et al., 2020; Zhang et al., 2015; Zhang et al., 2018; Cui et al., 2022; Zhang et al., 2016). Scientists and researchers in the field of nanotechnology conducted their research on nanofluids, nanopowders, nanosheets, and nanoscales in general, and found interesting results (A, c., k, s., s, k., 2021; Issa, 2022; Chen and Marco, 2022; Giahi et al., 2021; Mansouri et al., 2017; Suhad et al., 2021; Domyati, 2022; Dwijendra et al., 2022). The most important fields of application of nanotechnology are fluid mechanics and heat transfer. Fluids have many applications in different fields such as lubrication, heat transfer, etc. in different devices (Wang et al., 2022; Wangjian et al., 2021; Narimani, 2022; Yang et al., 2019; Yang et al., 2017), and their rheological and thermal properties are very important. Fluid limitation in various industries due to their poor thermal conductivity has led to the improvement of the properties of the base fluid as a new method. So that the idea of dispersing solid particles in base fluids, which started with millimeters and micrometers, was completed with the use of nanoparticles, and today nanofluids as fluids with high heat transfer capacity are a good alternative to conventional fluids like water, ethylene glycol (EG), and oil (Das et al., 2007). With the development of nanofluid research today, nanofluids can be prepared by adding metal nanoparticles and multi-walled carbon nanotubes (MWCNT) (Ghalandari et al., 2020). is an important parameter in fluid transfer. Determination of nanofluid viscosity is necessary to accurately calculate the rate of increase in production, pumping power, convective heat transfer coefficient, etc. Studies show that the volume fraction of nanoparticles, nanofluid temperature, type of base fluid, shear rate, etc., affect the viscosity of all nanofluids, including hybrid nanofluids (Ahammed et al., 2016; Mishra et al., 2014; Alarifi et al., 2019).
Experimental results of researchers; like Fedele et al. (Fedele et al., 2012); Minakov et al. (Minakov et al., 2021), Nguyen et al. (Nguyen et al., 2007), show that the increase in
is better than the increase in their thermal conductivity, and various factors such as nanoparticle concentration, temperature, and SR affect the
. Afshari et al. (Afshari et al., 2018) investigated the effect of concentration and temperature on the
of MWCNT–alumina/water (80 %)– EG (20 %) nanofluid. Their results show that
has a direct relationship with the
. Goodarzi et al. (Goodarzi et al., 2019) investigated the effects of temperature and nanoparticle concentration on the
of ZnO-MWCNT/SAE 10 W40 engine oil hybrid nanofluid. The results show that the nanofluid has Newtonian behavior at all
and temperatures. With increasing the
, the
increases. Also, the
decreases with increasing temperature at a constant
. High costs, time-consuming laboratory tests, and the need for complex equipment are the most problems of such tests. Due to the difficulty in laboratory methods, using mathematical models, especially ANNs, investigated various parameters' effects on the charachteristics of different systems considered by researchers (Zepeng et al., 2021; Yufei et al., 2021; He et al., 2020). The use of ANNs is a cheaper, more efficient, and highly reliable alternative for estimating nanofluids' properties. The advantage of ANNs compared to conventional traditional methods is high speed and complex relationship solving. When ANN has been trained, it can predict the required output parameters using the given input parameters (Tian et al., 2021). Researchers like Akhgar et al. (Akhgar and Toghraie, 2018) and Alrashed et al. (Alrashed et al., 2018) used the ANNs to predict the properties of nanofluids, including MWCNT nanoparticles. They showed that adding these materials to the base fluid improves the nanofluid properties.Table 1.
Training function
Training Algorithm
Performance
trainbfg
BFGS Quasi-Newton
42.523
trainbr
Bayesian regularization back propagation
0.32
traincgb
Conjugate Gradient with Powell/Beale Restarts
22.85
traincgf
Fletcher-Powell Conjugate Gradient
20.41
traincgp
Polak-Ribiére Conjugate Gradient
30.37
traingda
Gradient descent with adaptive learning rate back propagation
180.83
traingdx
Variable Learning Rate Back propagation
70.04
trainrp
Resilient Back propagation
12.99
trainscg
Scaled Conjugate Gradient
23.21
trainlm
Levenberg-Marquardt
0.63
Results from the study of MWCNT-carbon/SAE 10 W40-SAE 85 W90, in which the temperature and concentration of nanoparticles define as the ANN input, shows that the effect of temperature on is better. According to the recommended value of R2, ANN has a good performance in predicting the (Maddah et al., 2018). Toghraie et al. (Toghraie et al., 2020) considered temperature, SR, and concentration as inputs and effective factors for predicting the of WO3-MWCNTs / Engine Oil hybrid nanofluid in the ANN model. The results showed that the ANN method is suitable for predicting the properties of this nanofluid so that the proposed model fits the experimental data with a R2 = 0.99. Hemmat et al. (Esfe and Toghraie, 2021) predicted the of Al2O3/engine oil using ANN.the results showed that the ANN estimates laboratory data more accurately.
Parashar et al. (Parashar et al., 2021) investigated the dynamic viscosity of MXene palm oil. Their results show that the decreases with increasing temperature. The mean square error, mean average percentage error, and correlation coefficient (R2) were 4.733E-05, 0.507 %, and 0.99975, respectively. Mohammadian et al. (Mohamadian et al., 2018) proposed a model for predicting the of Ag/water nanofluid using an ANN. Temperature, and nanoparticle size was defined as model input variables. The values were obtained for the R2 are 0.9996, which indicates the complete accuracy of the proposed model. Their results show that the use of ANN leads to better results. The results of other researchers also confirm these results (Esfe and Toghraie, 2021; Toghraie et al., 2019; Shahsavar et al., 2019; Longo et al., 2017).
According to the review of previous articles, the ANN method is suitable for predicting nanofluid properties. As a result, in this paper, the effect of temperature, the volume fraction of nanoparticles, and shear rate on the viscosity of the hybrid lubricant (taken from Hemmat Esfe et al. 2017), which contains SAE 40 as the base fluid and a combination of multi-walled carbon nanotubes and zinc oxide (ZnO) as added nano particles, was investigated using the ANN and nonlinear fitting polynomial. In this work, a new modeling network with the highest accuracy is implemented for the prediction of Nanofluid dynamic viscosity and compared with the 3-dimensional nonlinear fitting function in MATLAB Measurements were performed in the temperature range of 25 to 50 ˚C, the volume fraction of nanoparticles in the range of 0 to 1 %, and different shear rates (50 to 1000 rpm). This model can be used as a design tool in future research or as an objective function in optimization problems.
2 Material and methods
2.1 ANN construction
Artificial intelligence has found great attention due to its potential and abilities in contrast to statistical methods such as Taguchi or determinant of optimal design methods (Sadr et al., 2017). For example, curve fitting of experimental data for optimization (Babajamali et al., 2022), classification of raw information, and prediction of signal future using time series prediction are some of the capabilities of these intelligent systems. In this manuscript, various topologies for ANN are investigated to obtain the optimum model for predicting the
of MWCNT –ZnO (10:90)/ SAE 40 nano-lubricant. To this end, a multi-layer Perceptron (MLP) network is implemented with different neurons in the hidden layer. To investigate the performance of ANN, various indexes can be used (Esfe et al., 2022; Esfe et al., 2022; Xia et al., 2022), and here, Mean Square Error (MSE) and R2 are used as performance indexes to assess different network performances and determine the optimum network for
prediction. According to the random nature of ANNs, the ANN is trained 10 times in each case, and the best situation is selected for comparison to other constructions. Due to the nonlinear relation of input–output parameters, the transfer function of hidden layer neurons must be of nonlinear type tangant hyperbolic sigmoid or Logarithm sigmoid (tansig or logsig) (Esfe et al., 2022; Moshayedi et al., 2022; Xie et al., 2022). Based on previous experiences of the authors, the tansig function has better performance (Esfe et al., 2021). Hence, this function is used for hidden layer neurons, while this paper uses a linear one for the output layer (Tian et al., 2021; Esfe and Toghraie, 2021; Azimi et al., 2017). As the training function, there is a variety of algorithms used. In this paper, several algorithms were used, and their performance is compared in Table 2. Among these trainig functions, the Levenberg-Marquart (LM) shows acceptable results and performance with low computation efforts for small-medium size ANNs. Also, this algorithm had reasonable performance among the others. Hence, this algorithm (trainlm) is used to investigate ANN further. The schematic configuration of this ANN is presented in Fig. 1.
Nonlinear term
coefficient
Standard deviation
−103.4333
12.5865
−1.8509
0.3987
0.0021
0.0145
245.2420
22.7036
0.0624
0.0158
−0.0010
0.0007
−4.1721
1.0974
0.0000
0.0000
0.0162
0.0240
19.6426
22.2098
−0.0105
0.0007
0.0000
0.0000
1.5357
0.0764
0.0000
0.0000
0.0026
0.0021
−80.7641
2.6758
0.0000
0.0000
0.0001
0.0000
−0.1330
0.0323
1
1593.4006
31.2158
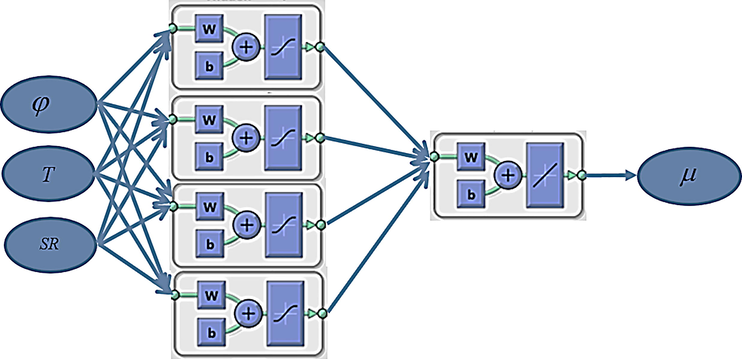
Schematic configuration of used ANN for prediction of
.
Fig. 1, W shows the weighting vector connecting the inputs to each neuron or the hidden layer neurons’ output to the output layer neuron. The b values represent the bias values. This figure shows the input parameters with , T, and ST, representing the volume fraction of nanoparticles, temperature, and SR, respectively. The only output of the ANN is the constructed using a linear activation function. Different values are considered for input parameters, and after experiments, the is obtained. This article used the experimental data of reference (Issa, 2022). The experiments were repeated at volume fractions of 0.05 %, 0.1 %, 0.2 %, 0.4 %, 0.6 %, and 0.8 %, with temperature range of 5–55 °C, and shear rates from 666.5 to 13,330 s−1. The viscosity of the hybrid nano lubricant was measured using the Brookfield digital viscometer (CAP2000). The is in the range of 0 to 1 % with 9 levels, the temperature is chosen between 25 and 50 ˚C with 6 levels, and the SR is considered in the range of 50 to 1000 rpm in 10 different levels. After obtaining the samples from experiments, the first step is to train the ANN. Usually, 70 % of data is used for training, 15 % for validation, and the rest for testing. Therefore, 192 samples were used for training and 41 for validation and test. It is worth mentioning that these portions of data are selected randomly in each training iteration by the algorithm.
To assess the effect of various training functions on the ANN performance, 10 different training algorithms were used, and their performance is compared in Table 1 as follows.
2.2 Nonlinear curve fitting method
This method is developed and programmed based on QR factorization and general least squares by John R. D'Errico (D’Errico, 2005). Polyfitn is a powerful and simple algorithm for determining polynomial coefficients using the linear least-squares technique. Also, the chosen method of solution gives standard errors of the coefficients. The theory can be found in Draper and Smith's research (Draper and Smith, 1998). To have a more stable algorithm, the QR factorization with pivoting is used for solving the system. Because it is much more stable concerning simple and pivoted QR version. Moreover, automatic variable scaling is used for illconditioning prevention.
With the experimental data presented in Table 1, a nonlinear polynomial based on three input parameters is assumed to predict the dynamic viscosity of Nanofluid as below.
The coefficients aij must be determined using the least square method. In the implemented notation, the first indexes show the variables' power, and the second defines the term number in the equation. The next section compares the obtained fitting equation and its accuracy to the ANNs results.
3 Results
To have better insight into the raw data, the deviation of
is plotted against three input parameters in Figs. 2-4. Fig. 2 shows that this nano lubricant's viscosity does not change much (increases slightly) with increasing volume fraction. The results of Fig. 3 show that the viscosity of the present nano lubricant decreases with increasing temperature from 25 to 50 ˚C (Chu et al., 2021). This is due to the weakening of molecular attractions between lubricant molecules and hybrid nanoparticles. The results obtained from Fig. 4 show that the viscosity of the nano-lubricant generally decreases significantly with increasing shear rate (Li et al., 2020). Increasing the shear rate reduces the interaction of molecules and nanoparticles. And the free space between most molecules and the particle also increases; Finally, the viscosity of this nano-lubricant decreases.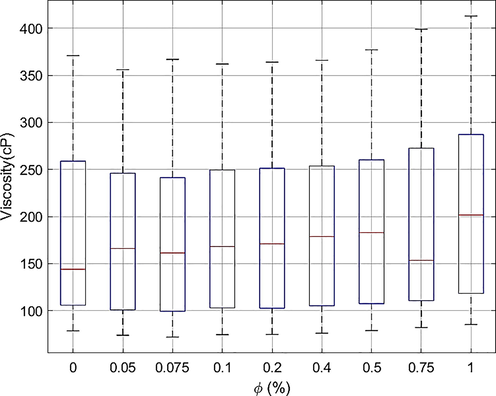
Effect of
on the
deviation.
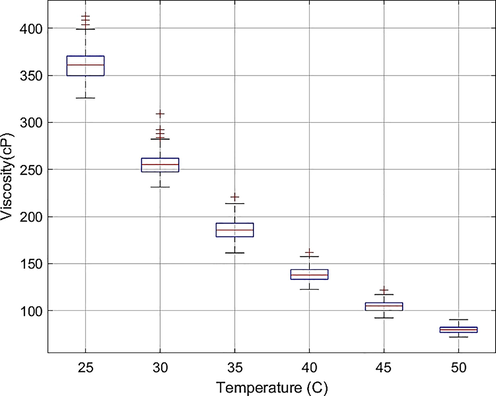
Effect of temperature on the
deviation.
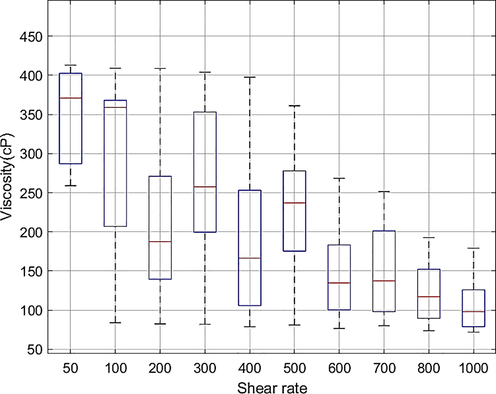
Effect of SR on the
deviation.
3.1 ANN results
Using 274 samples, different ANNs with various neurons from 1 to 20 in the hidden layer were trained. The results are presented in Fig. 5 for training, validation, and test data with different colors. The x-axis shows the number of neurons in the hidden layer in each figure. The y-axis presents two parameters, R2 and MSE, in the left and right hand of the graph, respectively. To determine the best ANN topology, the MSE and R2 of each network are computed for each portion of data. These indexes are computed as follows:
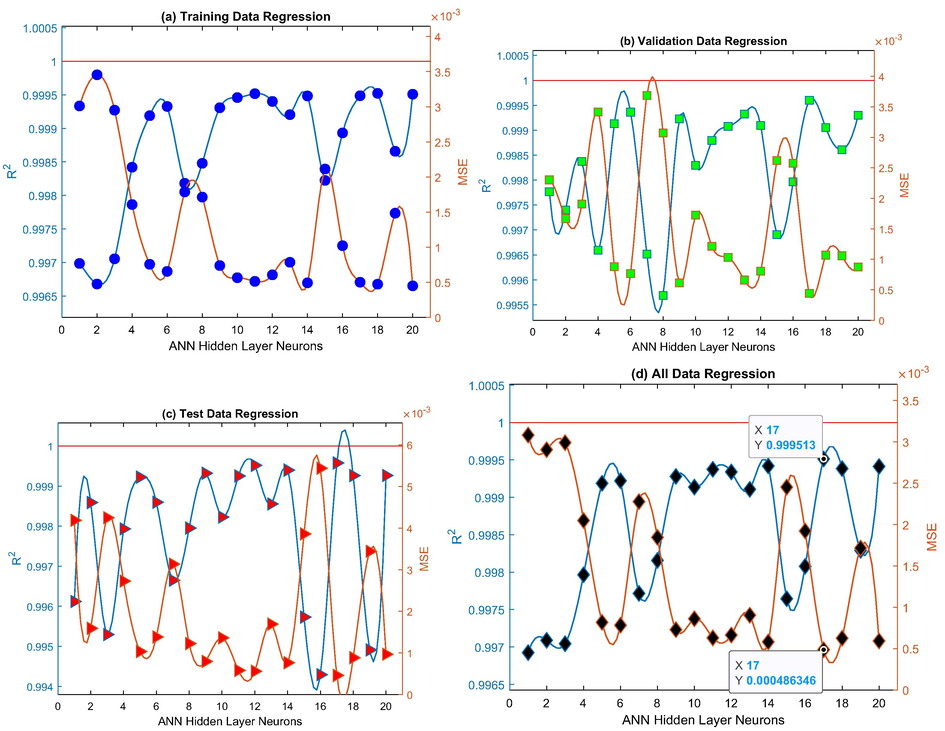
MSE and R2 of different ANN topologies for (a) Training data, (b)Validation data, (c) Test data, and (d) All data.
The training parameters are shown in Fig. 6.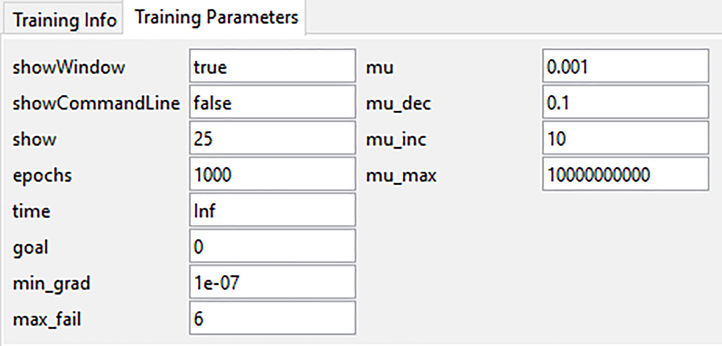
ANN training parameters.
ANNs training starts from the random condition, hence increasing the network complexity will not necessarily increase its performance. According to these figures, increasing the number of hidden layer neurons will generally increase network performance alongside decreasing the MSE value. Among the investigated topologies, the network with 17 neurons in a hidden layer showed the highest R2 value as 0.9995 and the lowest MSE equal to 0.0005. Therefore, this network is considered for modeling the input–output relationship of
for this nano-lubricant. In Fig. 7, the performance of this ANN is depicted for three different data portions. The training data are plotted in blue, validation data in green, and the test data in red. The best condition of the network is determined in this graph with a green circle on the 17th epoch. This point is determined according to the number of validation fails considered here equal to 6 times. In other words, when the ANN is getting to overlearn data, its number of validation fails increases, showing the network is not learning the overall data trend but only maintaining the MSE value as low as possible. Therefore, the best condition of ANN would be the epoch having the lowest validation error.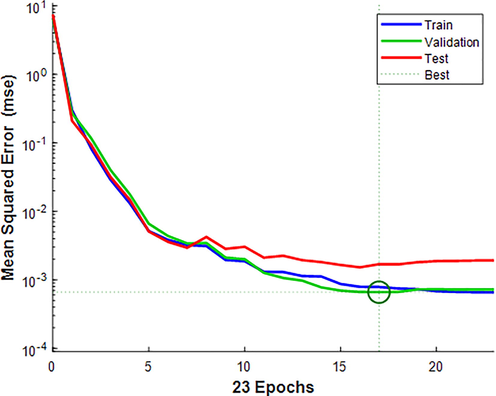
Performance of ANN with 17 neurons in the hidden layer.
It is clear from Fig. 7 that the ANN performance is low at the initial iterations. Still, after several iterations, the MSE value decreases exponentially, showing the training condition of the network. To be sure about the training condition of the ANN, the correlation plot of training, validation, test, and all data are presented in Figs. 8-11, respectively. In these figures, different data are specified with different colors.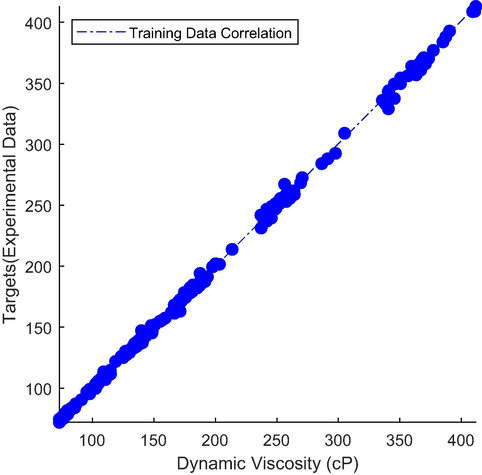
Correlation plot of training data for the optimum ANN.
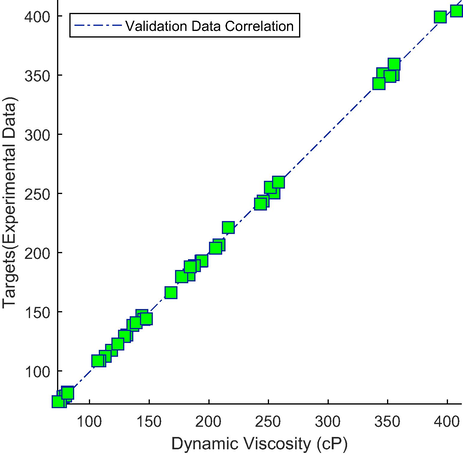
Correlation plot of validation data for the optimum ANN.
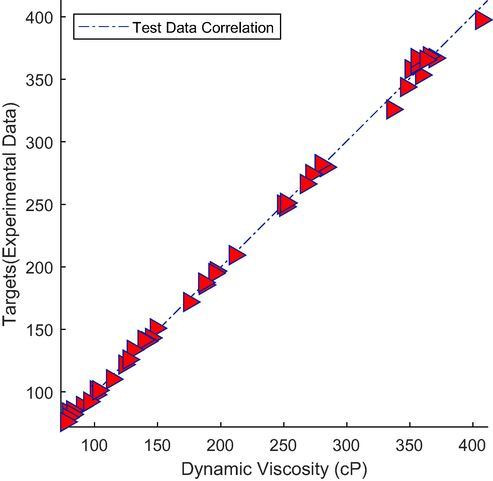
Correlation plot of test data for the optimum ANN.
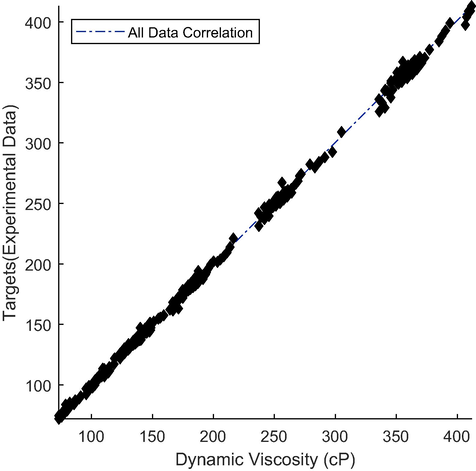
Correlation plot of all data for the optimum ANN.
Targets and output values are shown on the vertical and horizontal axes. In a well-trained ANN, the output and target values should be coincident. In this situation, the line slope would be 1 with 0 bias. Based upon these figures, all data are almost located on the bisector of the plane. Hence there is a very good correlation between the real output of the ANN and target values (Experimental data) that proves the goodness of the trained ANN for predicting
versus three input parameters. In Fig. 12, the real output of the ANN is compared to the experimental data for various temperatures with different colors. Again, there is a good match between these data in this figure.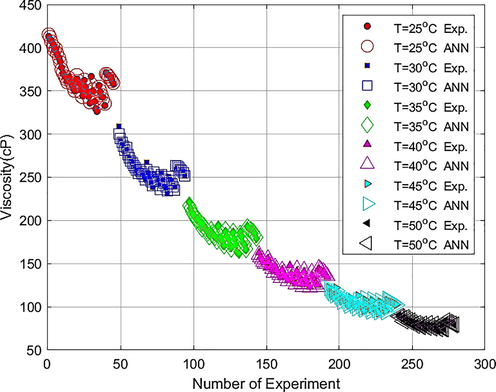
Comparison of experimental data and the real output of the ANN.
For another checkpoint, the error histogram is shown in Fig. 13. This graph shows that most samples have errors close to zero (orange line), and the normal distribution of errors proves a good experimental data set and a well-trained ANN.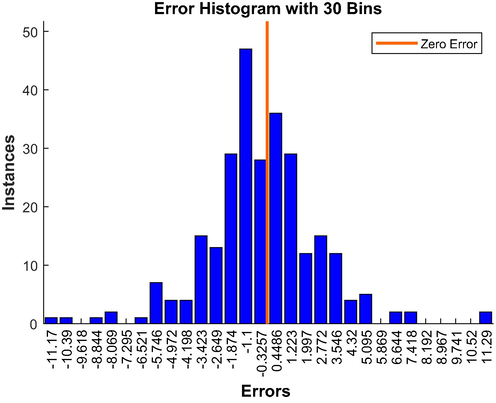
Error histogram for
.
Fig. 14 shows the error percentage of all samples for different temperatures.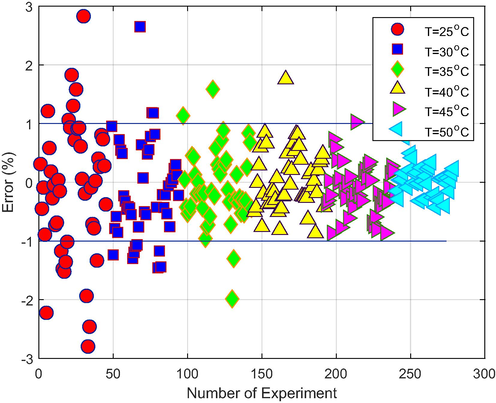
Error percentage of network output data versus various temperatures.
This figure shows that most errors are in the margin, which is quite acceptable. Another important point is that the deviation of error is decreased with increasing temperature. In other words, the highest deviation is observed around while the lowest variation arises in lower than . The reason for decreasing error deviation is that by increasing temperature, the viscosity value would decrease drastically and its error would also lower. According to Figs. 2-4, the significant temperature highly influences the viscosity. On the other hand, the nanoparticle volume fraction in the experimented range has the least effect on the output.
3.2 Nonlinear curve fitting results
Using the least square method, a nonlinear polynomial with the highest degree of 3 can predict the nonlinear relation of three inputs and the dynamic viscosity as the sole output. The obtained equation can be used for design and modeling systems using MWCNT –ZnO (10:90)/ SAE 40 nano-lubricant, likewise the optimized ANN. Also, this equation can be used for optimization as an objective.
The obtained equation is presented as follows:
To assess the presented models' accuracy, R2, Adj-R2, and RMSE are computed as listed in Table 3:
R2
Adj-R2
MSE
0.9983
0.9981
4.0223
To better compare ANN and nonlinear polynomials, the error of individual samples is depicted in Fig. 15 for both methods. ANN has slightly lower errors.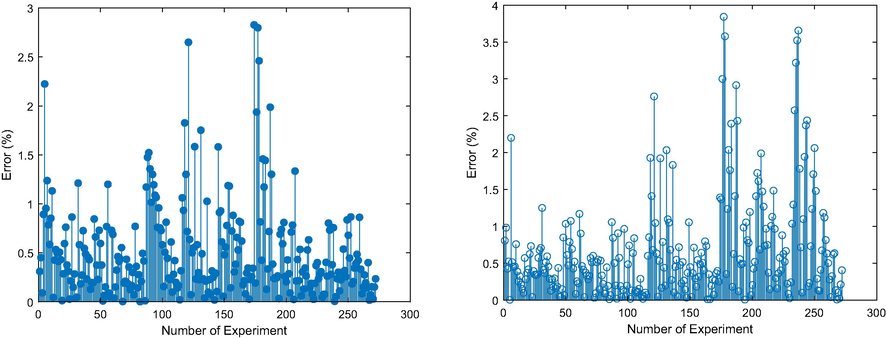
Comparison of ANN error (Left) and nonlinear polynomial error (Right).
In Fig. 16, the 3D plot of dynamic viscosity versus temperature and nanoparticle volume fraction is presented.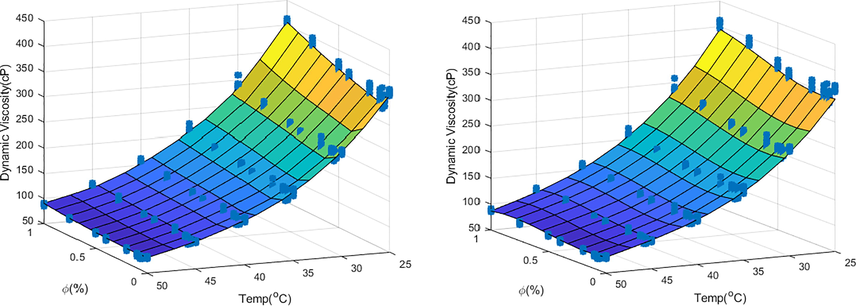
Comparison of ANN prediction (Left) and nonlinear polynomial prediction (Right).
According to this figure, both methods can accurately model the output, i.e., dynamic viscosity. As the last assessment, in Fig. 17, the predicted and target values for all samples are compared for both methods.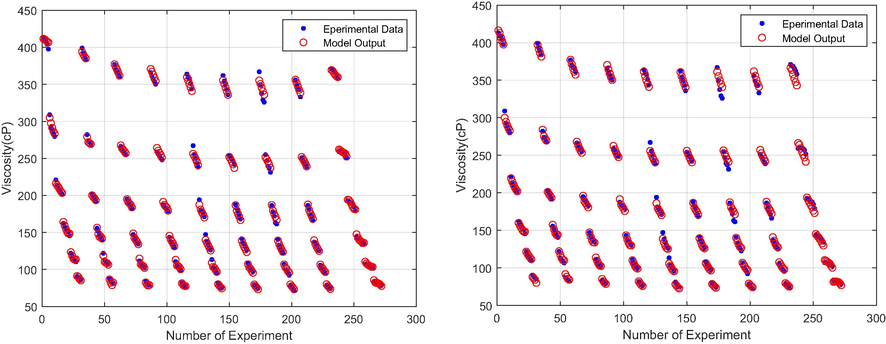
Comparison of ANN output and targets (Left) and nonlinear polynomial output and targets (Right).
In Fig. 17, the real output of the two methods is depicted in red circles, and the experimental data points are shown in blue dots. Therefore, a higher coincidence of red circles and blue dots represent a lower error. Although both methods have acceptable predictions from the above figure, ANN generally has better predictions due to the better coincidence of dots and circles.
4 Conclusion
In this manuscript, three input parameters' influence is investigated on the of MWCNT –ZnO (10:90)/ SAE 40 nano-lubricant. For this reason, two methods, including ANN and nonlinear polynomials, are used. Input parameters are considered to be , temperature, and SR. The following conclusions can be summarized based on the obtained results.
-
The optimum topology for ANN has 17 neurons in the hidden layer with a tansig transfer function and 1 linear neuron in the output layer.
-
This network achieved 0.9995 and 0.00048 values for R2 and MSE, respectively, showing the network's good training status.
-
Various indexes such as Error Histograms, correlation, and Error percentage plots proved the well-trained network's capability to predict the .
-
The temperature and shear rate significantly influence the output among the three input parameters. Moreover, their effect is inverse because increasing these parameters will lower the of MWCNT –ZnO (10:90)/ SAE 40 nano-lubricant.
-
On the other hand, the has a direct but negligible effect on .
-
To be more precise, increasing temperature from T = 25 to 50 ˚C changes the from 350 cP to around 100 cP.
-
Nonlinear polynomial coefficients with 20 terms of powers up to 3 were determined using the least square method. The R2 and MSE values are equal to 0.9983 and 4.0223, respectively.
-
Although both methods showed high prediction potential, ANN methods have slightly better accuracy.
By obtaining ANN or nonlinear polynomials, one can design systems based on nano lubricants or optimize the system as an objective function. Also, the attained results in this manuscript can be used by academics and industrial counterparts.
Declaration of Competing Interest
The authors declare that they have no known competing financial interests or personal relationships that could have appeared to influence the work reported in this paper.
References
- A, C., K, S., S, K. (2021). Synthesis of Copper(II) Schiff Base Complex and Its Mixed Thin Layer with ZnO Nanoparticles. Iranian Journal of Chemistry and Chemical Engineering (IJCCE), 40(3), 758-764. doi: 10.30492/ijcce.2020.38104
- Experimental investigation of rheological behavior of the hybrid nanofluid of MWCNT–alumina/water (80%)–ethylene-glycol (20%) J. Therm. Anal. Calorim.. 2018;132(2):1001-1015.
- [Google Scholar]
- Effect of volume concentration and temperature on viscosity and surface tension of graphene–water nanofluid for heat transfer applications. J. Therm. Anal. Calorim.. 2016;123(2):1399-1409.
- [Google Scholar]
- An experimental study on the stability and thermal conductivity of water-ethylene glycol/TiO2-MWCNTs hybrid nanofluid: developing a new correlation. Powder Technol.. 2018;338:806-818.
- [Google Scholar]
- On the rheological properties of MWCNT-TiO2/oil hybrid nanofluid: An experimental investigation on the effects of shear rate, temperature, and solid concentration of nanoparticles. Powder Technol.. 2019;355:157-162.
- [Google Scholar]
- The numerical modeling of water/FMWCNT nanofluid flow and heat transfer in a backward-facing contracting channel. Phys. B Condens. Matter. 2018;537:176-183.
- [Google Scholar]
- An optimization on the DIN1. 2080 alloy in the electrical discharge machining process using ANN and GA. J. Modern Process. Manuf. Prod.. 2017;6(1):33-47.
- [Google Scholar]
- Pareto multi-objective optimization of tandem cold rolling settings for reductions and inter stand tensions using NSGA-II. ISA Trans. 2022
- [Google Scholar]
- Seismic hydro-dynamic analysis of pipes with internal and external fluid under nanoparticles as reinforcement phase. Int. J. Hydromech.. 2020;3(3):252-267.
- [Google Scholar]
- Recent advances in the medical field with the revolution of nanotechnology. Rev. Adhes. Adhes.. 2022;10(2)
- [Google Scholar]
- Examining rheological behavior of MWCNT-TiO2/5W40 hybrid nanofluid based on experiments and RSM/ANN modeling. J. Mol. Liq.. 2021;333:115969
- [Google Scholar]
- Grindability of titanium alloy using cryogenic nanolubricant minimum quantity lubrication. J. Manuf. Process.. 2022;80:273-286.
- [CrossRef] [Google Scholar]
- J. D’Errico, “Surface fitting using gridfit,” MATLAB central file exchange, vol. 643, 2005
- Nanofluids: science and technology. John Wiley & Sons; 2007.
- Characterization of biofabrication copper (II) oxide nanoparticles and investigate the photocatalytic efficiency. Eur. Chem. Bull.. 2022;11(2):1-6.
- [CrossRef] [Google Scholar]
- Applied regression analysis. John Wiley & Sons; 1998.
- Dwijendra, N.K.A., Patra, I., Ahmed, Y.M. et al. Carbonyl sulfide gas detection by pure, Zn- and Cd-decorated AlP nano-sheet. Monatsh Chem (2022).https://doi.org/10.1007/s00706-022-02961-5.
- A well-trained artificial neural network for predicting the rheological behavior of MWCNT–Al2O3 (30–70%)/oil SAE40 hybrid nanofluid. Sci. Rep.. 2021;11(1):1-11.
- [Google Scholar]
- Prediction the dynamic viscosity of MWCNT-Al2O3 (30:70)/Oil 5W50 hybrid nano-lubricant using principal component analysis (PCA) with artificial neural network (ANN) Egypt. Informatics J. 2022
- [Google Scholar]
- An optimal feed-forward artificial neural network model and a new empirical correlation for prediction of the relative viscosity of Al2O3-engine oil nanofluid. Sci. Rep.. 2021;11
- [Google Scholar]
- A novel integrated model to improve the dynamic viscosity of MWCNT-Al2O3 (40: 60)/Oil 5W50 hybrid nano-lubricant using artificial neural networks (ANNs) Tribol. Int. 2022108086
- [Google Scholar]
- Application of artificial intelligence and using optimal ANN to predict the dynamic viscosity of Hybrid nano-lubricant containing zinc oxide in commercial oil. Colloids Surf. A Physicochem. Eng. Asp.. 2022;647:129115
- [Google Scholar]
- Viscosity and thermal conductivity measurements of water-based nanofluids containing titanium oxide nanoparticles. Int. J. Refrig.. 2012;35(5):1359-1366.
- [Google Scholar]
- Applications of nanofluids containing carbon nanotubes in solar energy systems: a review. J. Mol. Liq.. 2020;313:113476
- [Google Scholar]
- Photochemical degradation of an environmental pollutant by pure ZnO and MgO doped ZnO nanocatalysts. Iran. J. Chem. Chem. Eng. (IJCCE). 2021;40(1):83-91.
- [CrossRef] [Google Scholar]
- Experimental evaluation of dynamic viscosity of ZnO–MWCNTs/engine oil hybrid nanolubricant based on changes in temperature and concentration. J. Therm. Anal. Calorim.. 2019;136(2):513-525.
- [Google Scholar]
- Examination of rheological behavior of MWCNTs/ZnO-SAE40 hybrid nanolubricants under various temperatures and solid volume fractions. Experimental Thermal and Fluid Science.. 2017;80:384-390.
- [Google Scholar]
- Using of artificial neural networks (ANNs) to predict the thermal conductivity of zinc oxide–silver (50%–50%)/water hybrid Newtonian nanofluid. Int. Commun. Heat Mass Transfer. 2020;116:104645
- [Google Scholar]
- Rapid enzymatically reduction of zincum gluconicum for the biomanufacturing of zinc oxide nanoparticles by mycoextracellular filtrate of penicillium digitatum (Pdig-B3) as a soft green technique. Arch. Razi Inst.. 2022;77(1):101-110.
- [CrossRef] [Google Scholar]
- Optimisation of nanocomposite pipes under internal fluid reinforced by FRP and CNTs under seismic load. Int. J. Hydromech.. 2020;3(3):213-227.
- [Google Scholar]
- Using of artificial neural networks (ANNs) to predict the rheological behavior of magnesium oxide-water nanofluid in a different volume fraction of nanoparticles, temperatures, and shear rates. Math. Methods Appl. Sci. 2020
- [Google Scholar]
- Application of artificial neural network (ANN) for modeling oxide-based nanofluids dynamic viscosity. Int. Commun. Heat Mass Transf.. 2017;83:8-14.
- [Google Scholar]
- Prediction and modeling of MWCNT/Carbon (60/40)/SAE 10 W 40/SAE 85 W 90 (50/50) nanofluid viscosity using artificial neural network (ANN) and self-organizing map (SOM) J. Therm. Anal. Calorim.. 2018;134(3):2275-2286.
- [Google Scholar]
- Study of methyl tert-butyl ether (MTBE) photocatalytic degradation with UV/TiO2-ZnO-CuO nanoparticles. J. Chem. Health Risks. 2017;7(1):19-32.
- [CrossRef] [Google Scholar]
- Systematic experimental study of the viscosity of nanofluids. Heat Transf. Eng.. 2021;42(12):1024-1040.
- [Google Scholar]
- Applying GMDH artificial neural network to predict dynamic viscosity of an antimicrobial nanofluid. Nanomed. J.. 2018;5(4):217-221.
- [Google Scholar]
- Deep learning application pros and cons over algorithm. EAI Endorsed Trans. AI Robot.. 2022;1:1-13.
- [Google Scholar]
- Research on synthesis of heterocyclic structures using ZnO NPs as catalyst. J. Synth. Chem.. 2022;1:62-83.
- [CrossRef] [Google Scholar]
- C. Nguyen, F. Desgranges, G. Roy, N. Galanis, T. Maré, e. Boucher, and H. A. Mintsa, “Temperature and particle-size dependent viscosity data for water-based nanofluids–hysteresis phenomenon,” International journal of heat and fluid flow, vol. 28, no. 6, pp. 1492-1506, 2007.
- An artificial neural network approach for the prediction of dynamic viscosity of MXene-palm oil nanofluid using experimental data. J. Therm. Anal. Calorim.. 2021;144(4):1175-1186.
- [Google Scholar]
- The effect of electrical discharge machining parameters on alloy DIN 1.2080 using the Taguchi method and determinant of optimal design of experiments. J. Nav. Archit. Mar. Eng.. 2017;14(1):47-64.
- [Google Scholar]
- Selection of the most influential parameters on vectorial crystal growth of highly oriented vertically aligned carbon nanotubes by adaptive neuro-fuzzy technique. Int. J. Hydromech.. 2020;3(3):238-251.
- [Google Scholar]
- Experimental investigation and develop ANNs by introducing the suitable architectures and training algorithms supported by sensitivity analysis: measure thermal conductivity and viscosity for liquid paraffin based nanofluid containing Al2O3 nanoparticles. J. Mol. Liq.. 2019;276:850-860.
- [Google Scholar]
- Evaluating the biological activities of biosynthesized ZnO nanoparticles using Escherichia coli. Caspian J. Environ. Sci.. 2021;19(5):809-815.
- [CrossRef] [Google Scholar]
- On the rheological properties of multi-walled carbon nano-polyvinylpyrrolidone/silicon-based shear thickening fluid. Nanotechnol. Rev. (Berlin). 2021;10(1):1339-1348.
- [CrossRef] [Google Scholar]
- Using perceptron feed-forward artificial neural network (ANN) for predicting the thermal conductivity of graphene oxide-Al2O3/water-ethylene glycol hybrid nanofluid. Case Stud. Therm. Eng.. 2021;26:101055
- [Google Scholar]
- Designing an artificial neural network (ANN) to predict the viscosity of silver/ethylene glycol nanofluid at different temperatures and volume fraction of nanoparticles. Physica A. 2019;534:122142
- [Google Scholar]
- Application of artificial neural networks (ANNs) for predicting the viscosity of tungsten oxide (WO3)-MWCNTs/engine oil hybrid nanofluid. Int. J. Thermophys.. 2020;41(12):1-17.
- [Google Scholar]
- Tribology of enhanced turning using biolubricants: a comparative assessment. Tribol. Int. 2022107766
- [CrossRef] [Google Scholar]
- Research on rheological properties and constitutive equation of GHL explosive. J. Ordnance Equip. Eng.. 2021;42(10):103-108.
- [Google Scholar]
- Using feed-forward perceptron Artificial Neural Network (ANN) model to determine the rolling force, power and slip of the tandem cold rolling. ISA Trans. 2022
- [Google Scholar]
- A Hybrid Improved Neural Networks Algorithm Based on L2 and Dropout Regularization. Math. Probl. Eng.. 2022;2022
- [Google Scholar]
- Maximum undeformed equivalent chip thickness for ductile-brittle transition of zirconia ceramics under different lubrication conditions. Int. J. Mach. Tool Manu.. 2017;122:55-65.
- [CrossRef] [Google Scholar]
- Predictive model for minimum chip thickness and size effect in single diamond grain grinding of zirconia ceramics under different lubricating conditions. Ceram. Int.. 2019;45(12):14908-14920.
- [CrossRef] [Google Scholar]
- Optimization design of radiator for armored vehicle based on RBF neural network[J] J. Ordnance Equip. Eng.. 2021;42(02):68-75.
- [Google Scholar]
- Research on keeping the formation for multiple aircrafts based on deep convolutional neural networks[J] J. Ordnance Equip. Eng.. 2021;42(02):15-22.
- [Google Scholar]
- Experimental evaluation of the lubrication performance of MoS2/CNT nanofluid for minimal quantity lubrication in Ni-based alloy grinding. Int. J. Mach. Tool Manu.. 2015;99:19-33.
- [CrossRef] [Google Scholar]
- Experimental evaluation of cooling performance by friction coefficient and specific friction energy in nanofluid minimum quantity lubrication grinding with different types of vegetable oil. J. Clean. Prod.. 2016;139:685-705.
- [CrossRef] [Google Scholar]
- Experimental assessment of an environmentally friendly grinding process using nanofluid minimum quantity lubrication with cryogenic air. J. Clean. Prod.. 2018;193:236-248.
- [CrossRef] [Google Scholar]


