

Translate this page into:
Diethylenetriamine/diamines/copper (II) complexes [Cu(dien)(NN)]Br2: Synthesis, solvatochromism, thermal, electrochemistry, single crystal, Hirshfeld surface analysis and antibacterial activity
⁎Corresponding author. warad@najah.edu (Ismail Warad)
-
Received: ,
Accepted: ,
This article was originally published by Elsevier and was migrated to Scientific Scholar after the change of Publisher.
Peer review under responsibility of King Saud University.
Abstract
Two dicationic water soluble mixed triamine/diamine copper (II) complexes, of general formula [Cu(dien)NN]Br2 (1–2) [dien = diethelenetriamine and NN is en = ethylenediamine or Me4en = N,N′,N,N′-tetramethylethylenediamine] were prepared under ultrasonic mode with a relatively high yield. These complexes were characterized by elemental microanalysis, UV visible IR spectroscopy, and thermal and electrochemical techniques. In addition, complex 2 structure was solved by X-ray single crystal and Hirshfeld surface analysis. The complex exhibits a distorted square pyramidal coordination environment around Cu(II) centre. The solvatochromism of the desired complexes was investigated in water and other suitable organic solvents. The results show that the Guttmann’s DN parameter values of the solvents have mainly contributed to the shift of the d–d absorption band towards the linear increase in the wavelength of the absorption maxima of the complexes. The complex 1 showed higher antibacterial activity against the studied microorganisms compared to complex 2. Both complexes revealed promising antibacterial activities.
Keywords
Cu(II) complexes
Solvatochromism
Diamines
Single-crystal
Antibacterial

1 Introduction
The syntheses of Cu(II) with N-donors complexes are important research lines, due to biomedical and catalysis applications (Balasubramanian et al., 2006; Balasubramanian et al., 2007; Rosu et al., 2011; Sathyadevi et al., 2012; Vyas et al., 2011; Karvembu et al., 2003; Frey et al., 2001; Mevellec et al., 2001). Mixed-ligand copper(II) complexes with poly-nitrogen donors have been also investigated in a pharmaceutical field, due to their inherent anticancer, antioxidant and antimicrobial potentials (Karvembu et al., 2003; Frey et al., 2001; Mevellec et al., 2001; Sigman and Perrin, 1993; Leiter et al., 1963; Krishnamurti et al., 1980; Koepf-Maier and Koepf, 1987; Takamiya, 1960).
Copper(II) complexes have been found to exhibit prominent antimicrobial and anticancer potential activity by inducing apoptosis. They have been also found to be active both in vitro and in vivo, strongly binding and cleaving DNA (Koepf-Maier and Koepf, 1987; Takamiya, 1960; Ng et al., 2008; Barve et al., 2009; Zhang et al., 2004). In general, redox-active agents that damage DNA in vitro are thought to exhibit apoptotic activities in live cells by inducing oxidative stress and/or DNA damage (Cardaci et al., 2004).
The study of solvatochromic behaviour of complexes has been of importance, and it provides a quantitative access to recognize solvent behaviour and the role of the solvent in sphere coordination (El-Ayaan et al., 2001).
The solvatochromism phenomena in metal complexes resonated mainly into two types: direct and indirect attachments of the solvent molecules onto the metal ion centre in the complexes (Sone and Fukuda, 1990; Linert et al., 1993).
Diethelenetriamine (dien) and their derivative ligands with tridentate N-donor ligands are suitably placed to form two 5-member-chelate-metal complexes (Al-Noaimi et al., 2014; Mousa et al., 2014). Although these complexes, with such tridentate amine ligands, have been thoroughly investigated, only one example that combines both bidentate amine and tridentate amine for preparation of mononuclear [Cu(II)(triamine)(diamine)]X2 complexes has been isolated and characterized by X-ray single crystal diffraction up to date (Mousa et al., 2014). The authors have recently investigated the spectroscopic and biological activity of [Cu(dipn)(N-N)]Br2 [dipn = dipropylenetriamine, N-N = ethylenediamine (en) and propylenediamine (pn)] (Mousa et al., 2014); the structure of [Cu(dipn)(pn)]Br2 was resolved by X-ray single crystal analysis. Herein, we reported the synthesis, solvatochromism and the spectroscopic properties of two new dicationic copper(II) complexes of general formula [Cu(dien)(diamine)]Br2 through a simple, high yield procedure. Spectral, thermal and electrochemical analysis was investigated to identify the desired complexes. The structure of complex 2 is confirmed by X-ray single crystal diffraction combined with Hirshfeld surface analysis.
2 Methods
2.1 Chemicals
All the reagents, diethylenetriamine (dien), the diamines and CuBr2·2H2O used were of analytical grade and purchased from Sigma–Aldrich and used as received.
2.2 Physical measurements
Microanalyses (C, H, N) were performed, using an Elementar-Vario EL analyzer. The FT-IR spectra (4000–400 cm−1) were obtained from KBr discs with a Perkin–Elmer 621 spectrophotometer. Thermal analyses, thermogravimetry (TG) and differential thermal analysis (DTA) were carried out with TA Instruments SDT-Q600 in air. Electronic spectra were recorded in water at room temperature (RT) on a Pharmacia LKB-Biochrom 4060 spectrophotometer. The electrochemical properties of the complex 2 were investigated by cyclic voltammetry in DMF solutions containing 0.1 M of TBAPF6 as a supporting electrolyte. Cyclic voltammograms were recorded at a scan rate of 0.1 V vs Ag/AgCl. The Hirshfeld surface analysis of complex 2 was carried out using the program CRYSTAL EXPLORER 3.1 (Wolff et al., 2007).
2.3 Single-crystal X-ray data collection
Crystals of complexes 2 were grown by slow evaporation of water. Suitable block-like elongated blue crystals were mounted with epoxy on a glass fibre and collected with monochromated Mo Kα radiation (λ = 0.71073 Å) on a Bruker SMART Apex II diffractometer equipped with a CCD area detector at 150(2) K. The crystal was positioned at 40 mm from the CCD and the spots were measured using a 20 s counting time. Data reduction was carried out using the SAINT-NT software package (Bruker, 2007). Multi-scan absorption correction was applied to all intensity data using the SADABS program (Sheldrick, 1996). The structure was solved by a combination of direct methods with subsequent difference Fourier syntheses and refined by full matrix least squares on F2 using the SHELX-2013 suite (Sheldrick, 2008). All non-hydrogen atoms were refined with anisotropic thermal displacements. The C-H hydrogen atoms were included in the structure refinement in geometrically idealized positions and Uiso = 1.2Ueq (parent carbon atom). The N—H and O—H hydrogens were obtained by different electron density syntheses and refined by O…H distance restraints of 0.83 Å. Molecular and crystal packing diagrams were drawn with Platon software package (Spek, 2009). Details of crystal data collection and refinement are given in Table 1.
Empirical formula
C10H31Br2CuN5O
Mw
460.76 m/z
Crystal system
Monoclinic
Spacegroup
P21/n
a [Å]
8.4202(15)
b [Å]
24.246(4)
c [Å]
9.0117(16)
α [°]
90
β [°]
98.549(9)
γ [°]
90
V [Å3]
1819.3(6)
Z
4
Dc [Mg m−3]
1.682
μ [mm−1]
5.594
F(0 0 0)
932
Crystal size [mm]
0.20 × 0.10 × 0.06
θ range data collection
1.680–29.299°
Index ranges
−10 ⩽ h ⩽ 11, −32 ⩽ k ⩽ 33, −12 ⩽ l ⩽ 12
Reflections collected
32,881
Unique reflections, [Rint]
4967 [0.0601]
Final R indices
R1, wR2 [I > 2σI]
0.0285, 0.0581 [3905]
R1, wR2 (all data)
0.0444, 0.0628
Goodness of fit on F2
0.997
2.4 Synthetic general procedure for complexes (1–2)
1 mmol of CuBr2·2H2O was dissolved in 20 ml of methanol, and 1.1 mmol of diethylenetriamine and 1.1 mmol diamine mixture dissolved in 2 ml was added to the Cu(II) solution. The reaction mixture was subjected to stirring and ultrasound waves for approximately 30 min until the solution turned deep blue. The solvents were then removed under vacuum and the remaining solid was washed with isopropanol and dichloromethane (to remove excessive amines) and dried under vacuum. Crystals of 2·H2O, suitable for X-ray diffraction, were obtained through slow evaporation of water from the solution of the complexes.
2.4.1 [Cu(dien)en]Br2 (1)
Yield 90%, m.p. = 125 °C. MS m/z 226.2 [M-2Br]+ for C6H21Br2CuN5 Calculated: C, 18.64; H, 5.47; N, 18.11. Found C, 18.31; H, 5.25; N, 18.02%, IR (KBr, νcm−1): 3360 (vH2O), 3380 and 3280 and 3120 (vH-N), 2930 (vC-H), 1580 (vN-H), 1160 (vN-C), 540 (vCu-N).UV–Vis. in water: λmax (εmax/M−1 cm−1): 250 nm (1.50 × 10³ M−1 L−1) and 605 nm (2.80 × 10² M−1 L−1).
2.4.2 [Cu(dien)Me4en] Br2·(H2O) (2)
Yield 85%, m.p. = 145 °C. MS m/z 282.2 [M-2Br]+, for dry sample of complex 2 was investigated, C10H29Br2CuN5 Calculated: C, 27.13; H, 6.60; N, 15.82. Found C, 27.02; H, 6.44; N, 15.38%, IR (KBr, νcm−1): 3380 (vH2O), 3340, 3270 and 3120, (vH-N), 2920 (vC-H), 1560 (vN-H), 1180 (vN-C), 505 (vCu-N). UV–Vis. in water: λmax (εmax/M−1 cm−1): 255 nm (1.20 × 10³ M−1 L−1) and 625 nm (3.10 × 10² M−1 L−1).
2.5 Antimicrobial assay
The antimicrobial activity of the two prepared complexes was tested against the following microbial strains: Escherichia coli (ATCC 25922), Staphylococcus aureus (ATCC 25213),) Klebsiella pneumoniae (ATCC 13883), Bacillus subtilis (ATCC 6633), and Bacterial strains were stocked onto a nutrient agar slant. All slants were stored at 4 °C. A disc diffusion method was used to study the antimicrobial activity of the synthesized complexes (1 and 2). Stock complexes 1 and 2 were initially dissolved in ethanol and sterilized by filtration using 0.45 μm membrane filters. A Sterile 6 mm diameter filter paper disc was soaked with 0.2 mg/disc of the sterile complexes 1 and 2, and were placed in triplicates onto Muller–Hinton agar (Oxoid, England) plates for bacterial strains. These plates were previously inoculated separately with 100 μL (1.0 × 10⁸ CFU m L−1) of fresh culture of bacteria suspension. The plates were incubated for 24 h at 37 °C. After incubation, the inhibition zone around each disc was measured and recorded. Reported inhibition zones are the average calculated for three replicates. Discs soaked with sterile water were used for negative control, while standard antibacterial tetracycline (30 μg/disc, Oxoid, Basingstoke, UK) were used as positive controls in the assay.
3 Results and discussion
3.1 Synthesis of complexes 1–2
Mixed triamine-diamine ligand copper(II) complexes of the general formula [Cu(dien)NN]Br2 (1–2) were synthesized in good yields under ultrasonic mode. The reaction can be visually monitored by observation of the colour change from brown to blue when adding the N-donor ligands. The displacement of internal coordination sphere bromide ionic ligands from CuBr2 by dien and en ligands to the outer sphere as seen in Scheme 1, was carried out very fast in one port under ultrasonic radiation mode reaction. Carrying out the reaction in the absence of ultrasonic radiation decreased the rate of reaction and revealed undesirable oily side products. These complexes were distinguished by using elemental analysis and spectral methods. Based on water solubility and conductivity, these complexes appeared to be dicationic halide salt. The X-ray crystal structure of 2·H2O supports such suggestion and shows a distorted square pyramidal geometry Cu(II) dicationic ion.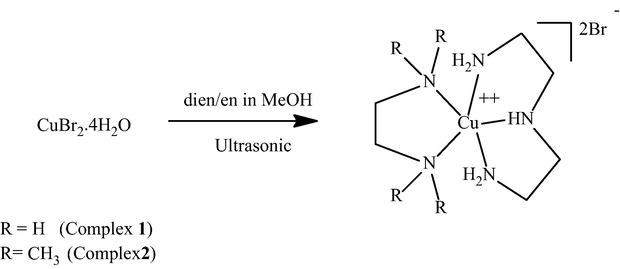
Synthesis of desired complexes 1–2.
3.2 Crystal structure for complex 2 with one H2O molecule
Complex 2·H2O –crystallized in the monoclinic with P21/n space group. Selected bond distances and angles are given in Table 2. Hydrogen bond dimensions are illustrated in Table 3. The crystal structure of [Cu(dien)Me4en]Br2·H2O (2·H2O) is built up from an asymmetric unit composed of one Cu(dien)Me4en)2+ cation and two Br− counter ions and one crystallization water molecule. The molecular structure of Complex 2·H2O presented in Fig. 1, with the adopted labelling scheme, shows the nitrogen diamine and triamine atoms protonated as revealed by the last difference Fourier maps calculated along the structure refinement.
Bond lengths/Å
Cu—N(1)
2.0452(19)
Cu—N(8)
2.2873(17)
Cu—N(4)
2.0246(19)
Cu—N(13)
2.0929(17)
Cu—N(7)
2.0354(19)
Bond angles/°
N(1)—Cu—N(4)
82.91(8)
N(4)—Cu—N(8)
102.35(8)
N(1)—Cu—N(7)
154.17(8)
N(4)—Cu—N(13)
173.60(8)
N(1)—Cu—N(8)
105.55(8)
N(7)—Cu—N(8)
98.47(7)
N(1)—Cu—N(13)
94.61(8)
N(7)—Cu—N(13)
97.25(7)
N(4)—Cu—N(7)
82.81(8)
N(8)—Cu—N(13)
83.99(6)
D—H⋯A
H⋯A/Å
D⋯A/Å
D—H⋯A/°
N(1)—H(1A)…Br(1) [1 − x, −y, 1 − z]
2.53(3)
3.444(2)
174(2)
N(1)—H(1B)…Br(1)
2.89(3)
3.561(2)
143(2)
N(4)—H(4)…O(100)
2.13(3)
2.904(4)
161(3)
N(7)—H(7A)…Br(2)
2.59(3)
3.410(2)
171(2)
N(7)—H(7B)…Br(2) [−1/2 + x, 1/2 − y, −1/2 + z]
2.53(3)
3.375(3)
167(2)
O(100)—H(10D)…Br(2) [1/2 + x, 1/2 − y, −1/2 + z]
2.45(2)
3.256(2)
165(3)
O(100)—H(10E)…Br(1) [1 + x, y, z]
2.48(3)
3.292(3)
171(3)
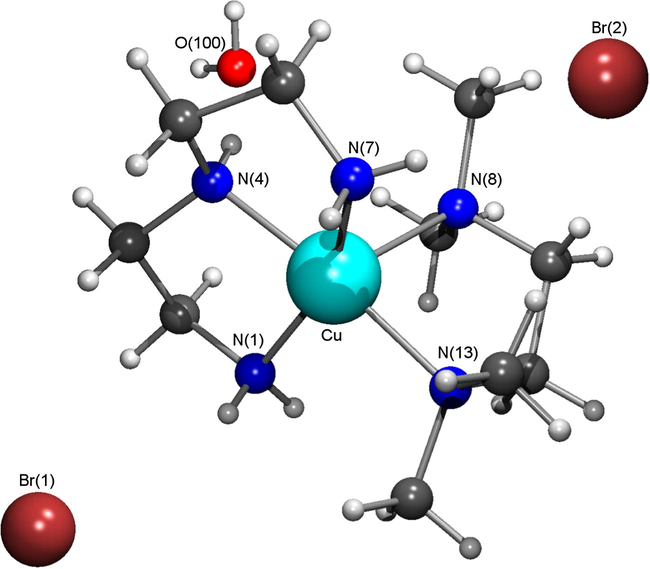
Molecular structure of complex 2·H2O and relevant elements are adopted into atomic labeling scheme.
The geometry coordination around the copper centre can be described as a square pyramid distorted towards a trigonal bipyramidal arrangement by a τ value of 0.32. This trigonal index was calculated using the formula τ = (β − α)/60 previously defined by Addison et al. (1984), with τ assuming the values of 0 or 1 for ideal square-pyramidal and trigonal bipyramidal geometries, respectively. In complex 2, β and α correspond to N(4)—Cu—N(13) and to N(1)—Cu—N(7) angles, respectively. The equatorial coordination of the copper centre is composed of four nitrogen atoms from diethelenetriamine (N1, N4 and N7) and N,N,N,N-tetramethylethylendiamine (N13). The N(8) occupies the apical pyramidal position at 2.2873(17) Å, and this axial elongation is due to Jahn-Teller effect characteristic of copper(II) complexes. These Cu—N distances ranging from 2.0246(19) to 2.2873(17) Å, are within the expected values of the copper(II) complexes with these types of amine ligands (CSD Cambridge database, 2014).
The structural features of the present compounds are very similar to what was reported by the authors [Cu(dipn)(N—N)]Br2 (Mousa et al., 2014 and Spek, 2009).
The N⋯O, N⋯Br and O⋯Br intermolecular distances found in the crystal lattice are consistent with the existence of a 3-D dimensional network (see Fig. 2) of N—H⋯O, N—H⋯Br and O—H⋯Br hydrogen bonding interactions between [Cu(dien)Me4en]2+ cations, water crystallization molecules and Br− anions, and with N⋯Br and O⋯Br distances ranging from 3.256(3) to 3.561(3) Å, and a single N—H⋯O hydrogen bond with a N⋯O distance of 2.904(4) Å.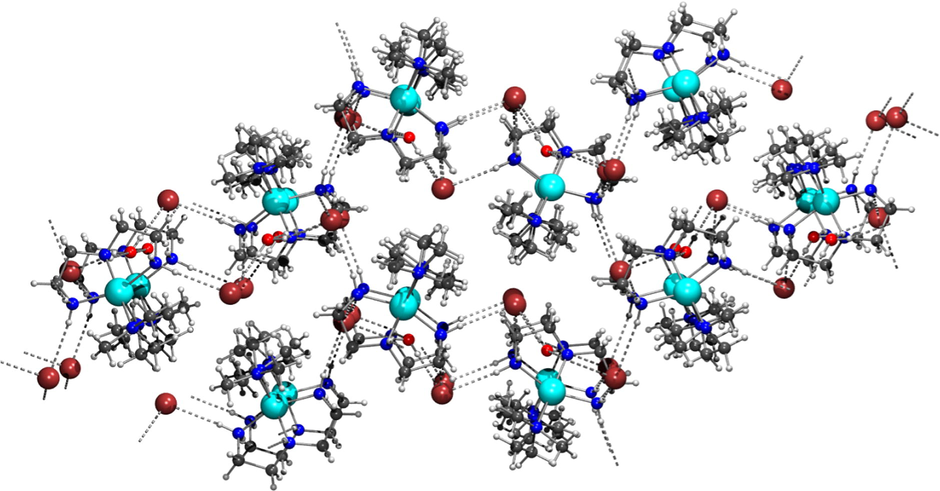
Crystal packing diagram of complex 2 along the a-axis. The hydrogen bonds are drawn in grey dashed lines.
3.3 Hirshfeld surface analysis for complex 2
The Hirshfeld surfaces analysis is sort of theoretical calculations usually performed to illustrate the mood of the intermolecular interactions between molecule and surrounding molecules using XRD structure input CIF file. The Hirshfeld surface of complex 2 is – shown in Fig. 3. The red spots over the surface indicate the inter-contacts involved hydrogen bonds (Balasubramanian et al., 2007; Patel et al., 2005). The dark-red spots on the dnorm surface rise as a result of the short interatomic contacts, i.e., strong hydrogen bonds, while the other intermolecular interactions appear in light-red spots.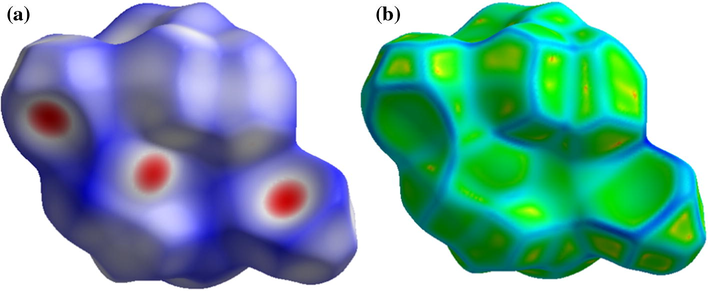
(a) dnorm mapped and (b) curedness on Hirshfeld surface analysis of complex 2. Colour scale ranges between 0.18 au (blue) and 1.4 au (red).
The 2D Finger print plots over the Hirshfeld surfaces show the presence of inter-contacts H…H (64.6%), H…Br (34.4%) and H…Cu (1.0%) (Fig. 4). The major contribution is from H…H, while the least contribution is from H…Cu.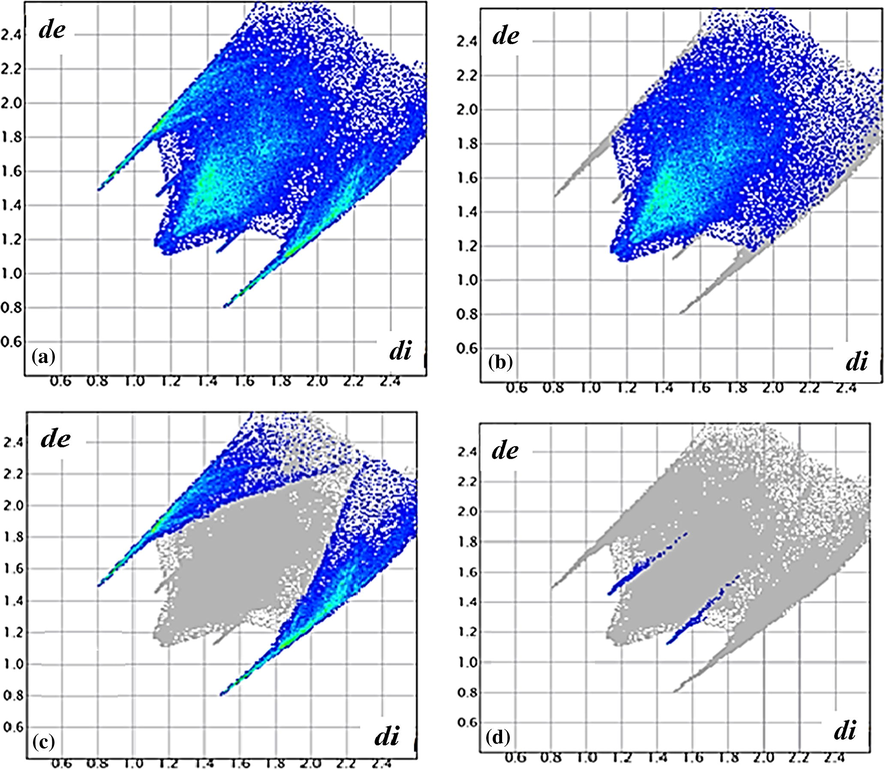
de/di fingerprint relation of complex 2, (a) H…all (b) H…H, (c) H…Br and (d) H…Cu.
The outline of the full fingerprint is shown in grey, di is the closest internal distance from a given point on the Hirshfeld surface and de is the closest external contacts (Spackman and Jayatilaka, 2009; Spackman and McKinnon, 2002).
3.4 Visible and ultraviolet spectral data
The electronic absorption spectra of 1 and 2 were measured in distilled water at room temperature. The spectra of the two complexes in water exhibit high intense π to π electron transitions in the UV region, around 250 nm (for complex 1) and 255 nm (for complex 2), along with a low intensity d to d electron transitions band around 610 nm (for complex 1) and 625 nm (for complex 2), as seen in Fig. 5.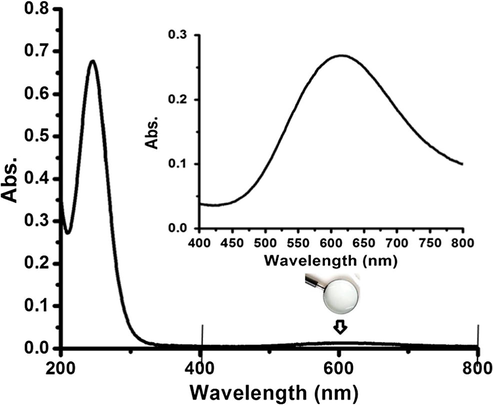
UV–Vis. spectrum of complex 2 dissolved in water at RT.
Interestingly, by subjecting the same complex 2 dissolved in DMSO to UV–visible at RT, as shown in Fig. 6, d to d electron transition bands become broader with a shift at ∼700 nm. A new sharp band at 315 nm was recorded as metal-to-ligand charge-transfer (MLCT), the π to π∗ electron transition bands did not change. This observation may be due to the replacement of water molecule from the complex structure by the DMSO molecule.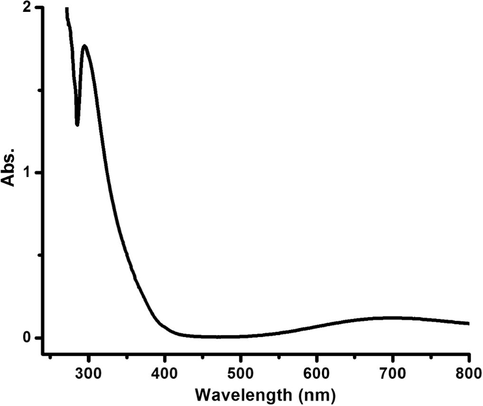
UV–Vis spectrum of complex 2 dissolved in DMSO at RT.
3.5 Solvatochromism of complex 1
Complex 1 demonstrates solvatochromic in a number of selected polar solvents like water, EtOH, DMF and DMSO owing to its dicationic natural solubility. The electronic absorption spectra of such complexes were characterized by a broad structure band in the visible region attributed to the d to d electron transition of the Cu(II) centre. The visible spectral changes of complex 1 in some selected solvents are illustrated in Fig. 7.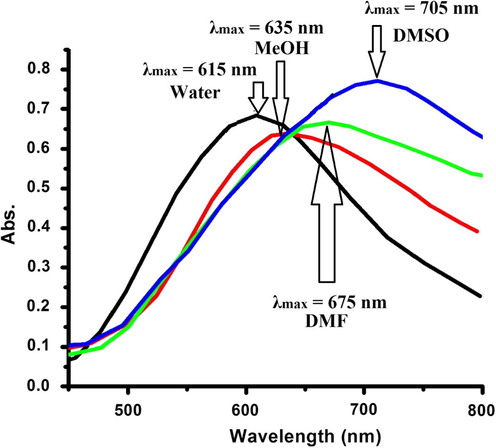
Absorption spectra of complex 1 in some selected solvents.
The wavelength of the absorption maxima (λmax) of complex 1 in some selected solvents shifted to higher values due to the direct coordination of polar solvent molecules onto the vacant sites of the square pyramid of Cu(II) centre with different strength.
To explore the solvent effects on the absorption spectra of the complexes, λmax, values were plotted vs. Guttmann’s donor DN and acceptor CN using solvatochromic (Eq. (1)) as in Fig. 8. The solvent parameters used include Guttmann’s donor DN, acceptor numbers AN, electron pair donating ability β and hydrogen bonding ability α.
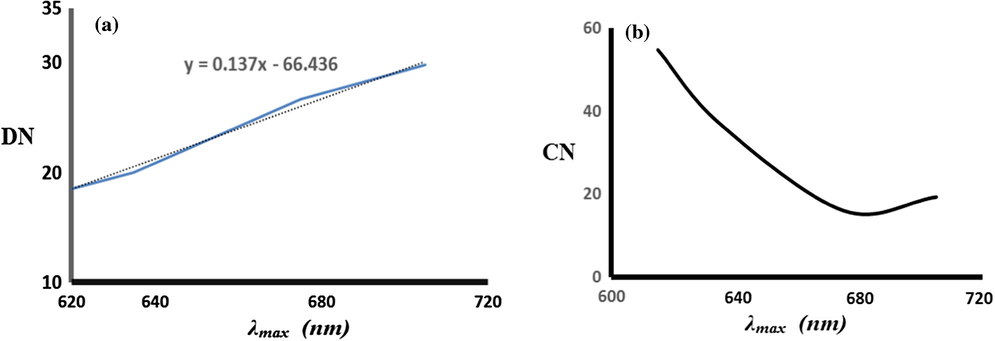
Dependence of the λmax of complex 1 on the solvent Guttmann’s donor DN (a) and acceptor CN (b).
Fig. 8 reveals the linear relationship between λmax values and DN but not CN, which indicates Lewis acidity of the complex against solvents donation. The results confirm the dominant contribution of DN parameter in the solvatochromism of the complex due to coordination of polar solvent molecules and the axial site of the Cu(II) centre with different strength leading to a change in the geometry of the complex from square pyramid to octahedron (El-Ayaan et al., 2001; Sone and Fukuda, 1990; Linert et al., 1993).
3.6 IR Spectral investigation
Several main peaks were detected, due to functional group vibrations. Peaks at ∼3380 cm−1 and 1480 cm−1, assigned, to ν(O-H) and ν(bend), respectively, are the characteristic of H2O, which indicate the existence of molecular lattice water. The three bands at 3340–3100 and 1600–1500 cm−1 assigned to νs(N—H), νas(N—H) and δ(N—H), respectively, are shifted to wave numbers lower than those encountered in the free ligand, confirming the coordination of the N-donor groups with copper (Patel et al., 2005). The strong bands – around 2900–2800 cm−1 are indexed to the stretching vibration of C—H of CH2 in the dien and CH3-group of Me4en diamine ligands (Nagaraj et al., 2014). The appearance of broad bands at ∼600–500 cm−1may be attributed to ν(Cu-N) bond vibrations (Tabassum et al., 2013; González-Álvarez et al., 2013). Bands that appear in the ∼290–250 cm−1 region were assigned to the ν(Cu-Br) vibration (Manikandamathavan et al., 2012). IR spectra of complexes 1 and 2 are given in Fig. 9.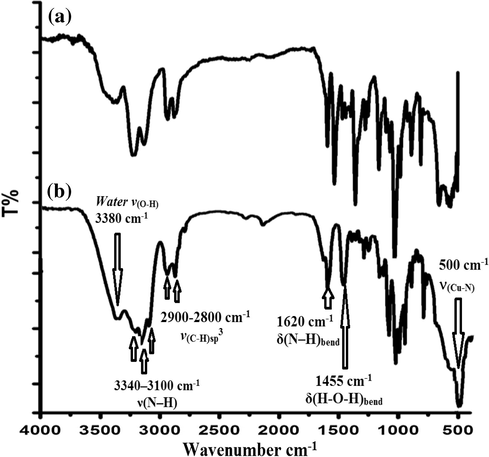
FT-IR spectra of complex 1 (a) and complex 2 (b).
3.7 Thermogravimetric analyses of complex 2
The TG/DTA curves were obtained at a heating rate of 5 °C min−1 in an open atmosphere over the temperature range of 0–900 °C. The thermo-gravimetric analyses of complex 2 reveal the occurrence of four consecutive processes, namely, mono-dehydration, Me4en followed by dien ligand pyrolysis and inorganic residue formation, as seen in Fig. 10. The first step represents the loss of the uncoordinated water molecule in the range of 90–100 °C, losing ∼3.5% at 92 °C, showing an endothermic sign of DTA. The second decomposition stage initiates at 160 °C and ends at 200 °C, losing ∼25% of weight, due to Me4en ligand de-structure, with DTA exothermic signs at 190 °C. The third decomposition step is registered between 210 and 350 °C losing ∼23% of weight, due to the dien ligand loss, with DTA exothermic signs at 306 °C and CuBr2 product formation. The fourth step starts at 500 °C and ends at 650 °C, with DTA exothermic signs at 602 °C which leads to the removal of bromide ions from CuBr2 and reacts with oxygen to form copper oxide with 31.5% net weight loss. The final residue was analysed by IR spectra and identified as copper oxide (CuO, 17%) (Mousa et al., 2014).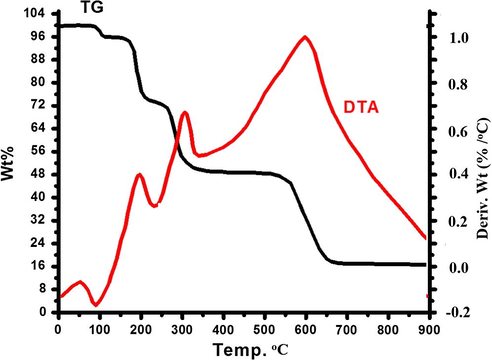
TG/DTA thermal curve of the complex 2.
3.8 Electrochemical behaviour of complex 2
The experimental results proved that the reduction in complex 2 proceeds through a quasi-reversible one electron process with unity anodic to cathodic current (Ipa/Ipc) ratio, generating the Cu(I) species, which has a lifetime long enough to be detected by cyclic voltammetry as it is illustrated in Fig. 11.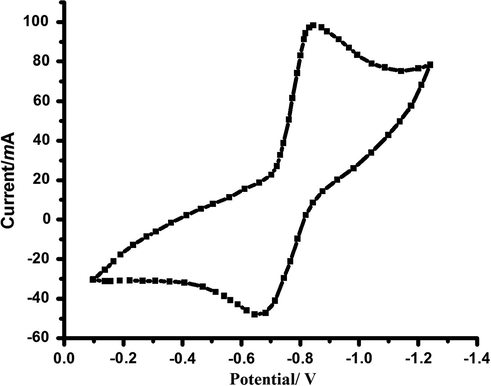
Cyclic voltammogram of complex 2 in DMF solution, at scan rates 0.1 V/s.
The redox process can be formulated as follows:
The quasi-reversibility associated with the reduction process probably arises as a consequence of a geometry change from the originally square pyramid towards a distorted tetrahedral environment around the Cu(I) species (Mousa et al., 2014).
3.9 Antimicrobial studies
The inhibition efficiencies of the desired copper(II) complexes 1 and 2 were tested against two Gram-positive (S. aureus and B. subtilis) and two Gram-negative bacteria (E. coli and K. pneumonia) (Fig. 12).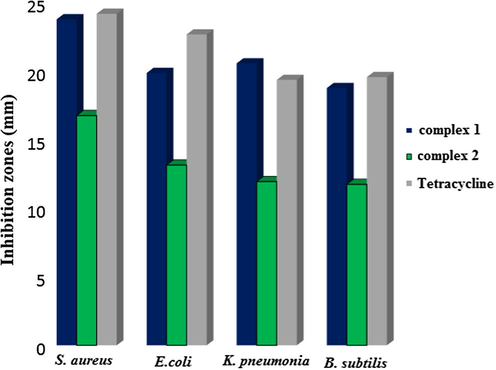
Antimicrobial activity inhibition zones in mm of the complexes 1 and 2 (1 mg/ml) against various microbial strains (S. aureus, E. coli, K. pneumonia and B. subtilis).
The highest activity of the complex 1 was against S. aureus with an inhibition zone of 23.7 mm; complex 1 also exhibited a strong activity against E. coli, K. pneumonia and B. subtilis, with inhibition zones of 19.8, 20.5 and 18.7 mm, respectively. A strong promising activity of complex 1 was observed against all the tested microorganisms with inhibition zones of greater than 18 mm. The highest activity of complex 2 was against S. aureus with an inhibition zone of 16.7 mm; complex 2 exhibited moderate activity against E. coli, K. pneumonia and B. subtilis, with inhibition zones of 13.1, 11.9 and 11.7 mm, respectively. Complex 2 exhibits a moderate promising activity against all the tested microorganisms with inhibition zones of less than 12 mm.
Fig. 12 shows the mm inhibition zone diameter against the bacterial strains, with the data for one standard antibiotic – added for comparison. The complex 1 has higher antibacterial activity against the studied microorganisms, while the activity complex 2 is lower. Nevertheless, both complexes show promising results as antibacterial agents. Complexes 1 and 2 were able to target Gram-positive and Gram-negative bacteria indicating a broad-spectrum of antimicrobial activity for both complexes. Such a broad-spectrum activity could be mediated by targeting essential steps in microbial growth or by causing metabolic toxicity (Srinivasan et al., 2001).
The minimum inhibitory concentration MIC of complexes 1 and 2 was determined using the broth microdilution method. The applied protocol was similar to that of CLSI (Okeke et al., 2001). Briefly, complexes 1 and 2, were dissolved in 100% ethanol to achieve a concentration of 1000 μg/ml. These solutions were serially diluted (2-fold) 10 times with nutrient broth (HIMEDIA, India). Well number 11 was considered a negative control of bacterial growth, while well number 12 contained nutrient broth only and was the positive control of bacterial growth. The achieved 10 concentrations of complexes 1 and 2 were 0.97, 1.95, 3.90, 7.81, 15.62, 31.25, 62.5, 125, 250 and 500 μg/ml. Overnight grown bacterial isolates were applied to all wells except the negative control. The final standard bacterial concentration in each well was adjusted to 1 μl of 5 × 10⁷ (CFU/ml) of each. After inoculation of bacteria, the plates were covered and incubated at 37 °C for 24 h. Broth microdilution method was performed in duplicate for each isolate.
The lowest compound concentration (highest dilution) that inhibited the growth of tested microorganisms, which did not show any visible growth in the test media, was considered the minimum inhibitory concentration (MIC). The MIC values of complexes 1 and 2 against growth of bacteria expressed in μg/mL are seen in Table 4.
Compound
Staphylococcus aureus (μg/ml)
Escherichia coli (μg/ml)
Klebsiella pneumoniae (μg/ml)
B. subtilis (μg/ml)
Complex 1
7.8
31.2
15.6
15.6
Complex 2
31.2
62.5
125.0
62.5
As shown in Fig. 12 complex 1 produces the highest inhibition zone against all tested bacteria and it also inhibits bacteria growth at lower concentration in comparison with complex 2 (Table 4).
It is clear to us that, primary diamine with 2H on N atoms as in complex 1 in general enhanced the antibacterial activity; meanwhile, replacing the N hydrogens by alkyl groups using another diamine such Me4en as in complex 2 caused the antibacterial deactivation. In order to verify this proposal we are planning to prepare the same complexes using several types of diamine ligands and then compare their antibacterial activities.
4 Conclusions
Two triamine/diamines/Cu(II) water soluble cationic complexes were synthesized and characterized with high yields under fast ultrasonic mode. The displacement of internal coordination sphere bromide in CuBr2 by dien and en ligands to the outer sphere was accelerated with the help of ultrasonic radiation. The structures of the desired complexes were determined by several spectral, thermal, and potentiometric analyses. Complex 1 demonstrated positive solvatochromism due to coordination of polar solvent molecules with different DN to the axial site of the Cu(II) centre which changed the geometry of the complexes from square planar to octahedral one. The single crystal X-ray diffraction data for complex 2 showed that copper ion is in a distorted square pyramid environment. Complex 1 revealed higher activity against several types of bacteria compared to Complex 2.
Supplementary material
Crystallographic data for the structure of complex 2 was deposited with the Cambridge Crystallographic Data Centre, CCDC No. 1437266. Copies of this information may be obtained free of charge from the Director, CCDC, 12 Union Road, Cambridge CB2 1EZ, UK (e-mail: deposit@ccdc.cam.ac.uk or www: http://www.ccdc.cam.ac.uk).
Acknowledgements
The authors would like to extend their sincere appreciation to the Deanship of Scientific Research at King Saud University for its funding of this Research group NO (RG-0257-1435-1436).
References
- J. Chem. Soc., Dalton Trans.. 1984;7:1349-1356.
- Spectrochim. Acta Part A Mol. Biomol. Spectrosc.. 2014;122:273-282.
- Spectrochim. Acta Part A Mol. Biomol. Spectrosc.. 2007;68:50-54.
- Spectrochim. Acta Part A Mol. Biomol. Spectrosc.. 2006;65:678-683.
- Inorg. Chem.. 2009;48:9120-9132.
- Bruker, B.A., 2007. Inc., Madison, Wisconsin, USA.
- Int. J. Cancer. 2004;112:596-606.
- CSD Cambridge database, 1.17, 2014.
- Monatsh. Chem.. 2001;132:1279-1284.
- Polyhedron. 2001;20:3231-3237.
- Dalton Trans.. 2013;42:10244-10259.
- Inorg. Chem. Commun.. 2003;6:486-490.
- Chem. Rev.. 1987;87:1137-1152.
- Cancer Res.. 1980;40:4092-4099.
- J. Natl. Cancer Instit.. 1963;14:365-409.
- J. Chem. Soc., Dalton Trans.. 1993;22:3181-3190.
- Eur. J. Med. Chem.. 2012;57:449-458.
- J. Chem. Soc., Perkin Trans.. 2001;1:3128-3131.
- Spectrochim. Acta Part A Mol. Biomol. Spectrosc.. 2014;127:225-230.
- Colloids Surf. B. 2014;122:151-157.
- Dalton Trans.. 2008;4:447-454.
- J. Ethnopharmacol.. 2001;78:119-127.
- Spectrochim. Acta Part A Mol. Biomol. Spectrosc.. 2005;62:261-268.
- Polyhedron. 2011;30:154-162.
- Polyhedron. 2012;31:294-306.
- SADABS. Germany: University of Göttingen; 1996.
- Acta Cryst.. 2008;A64:112-122.
- Chem. Rev.. 1993;93:2295-2316.
- Rev. Inorg. Chem.. 1990;11:123-133.
- Cryst. Eng. Commun.. 2009;11:19-32.
- Cryst. Eng. Commun.. 2002;4:378-392.
- Acta Cryst.. 2009;D65:148-155.
- J. Ethnopharmacol.. 2001;74:217-220.
- Eur. J. Med. Chem.. 2013;60:216-232.
- Nature. 1960;185:190-191.
- Spectrochim. Acta Part A Mol. Biomol. Spectrosc.. 2011;84:256-268.
- Crystal Explorer 2.1. Perth, Australia: University of Western Australia; 2007.
- Inorg. Biochem.. 2004;98:2099-2106.


