

Translate this page into:
Facile synthesis of Ni-decorated multi-layers graphene sheets as effective anode for direct urea fuel cells
⁎Corresponding authors at: Petrochemical Research Chair, Department of Chemistry, College of Science, King Saud University, Riyadh 11451, Saudi Arabia. melnewehy@ksu.edu.sa (Mohamed H. El-Newehy), nasser@jbnu.ac.kr (Nasser A.M. Barakat)
-
Received: ,
Accepted: ,
This article was originally published by Elsevier and was migrated to Scientific Scholar after the change of Publisher.
Peer review under responsibility of King Saud University.
Abstract
A large amount of urea-containing wastewater is produced as a by-product in the fertilizer industry, requiring costly and complicated treatment strategies. Considering that urea can be exploited as fuel, this wastewater can be treated and simultaneously exploited as a renewable energy source in a direct urea fuel cell. In this study, multi-layers graphene/nickel nanocomposites were prepared by a one-step green method for use as an anode in the direct urea fuel cell. Typically, commercial sugar was mixed with nickel(II) acetate tetrahydrate in distilled water and then calcined at 800 °C for 1 h. Raman spectroscopy, X-ray diffraction (XRD), scanning electron microscope (SEM), transmission electron microscope (TEM) and energy dispersive spectroscopy (EDS) were employed to characterize the final product. The results confirmed the formation of multi-layers graphene sheets decorated by nickel nanoparticles. To investigate the influence of metal nanoparticles content, samples were prepared using different amounts of the metal precursor; nickel acetate content was changed from 0 to 5 wt.%. Investigation of the electrochemical characterizations indicated that the sample prepared using the original solution with 3 wt.% nickel acetate had the best current density, 81.65 mA/cm2 in a 0.33 M urea solution (in 1 M KOH) at an applied voltage 0.9 V vs Ag/AgCl. In a passive direct urea fuel cell based on the optimal composition, the observed maximum power density was 4.06 × 10⁻³ mW/cm2 with an open circuit voltage of 0.197 V at room temperature in an actual electric circuit. Overall, this study introduces a cheap and beneficial methodology to prepare effective anode materials for direct urea fuel cells.
Keywords
Graphene
Nickel
Nanocomposites
Urea electrooxidation
Fuel cell

1 Introduction
Owing to the depletion of fossil fuels, researchers turn to utilizing different strategies to develop new energy devices. Exploiting wastewaters, such as urea-contaminated water, for power generation is highly recommended as it provides an additional advantage for the environment. Besides animal and human urine, industrial plants produce large amounts of urea-polluted wastewaters. For instance, in the urea synthesis process from ammonia and carbon dioxide, for each mole of urea synthesized, 1 mol of water is formed in addition to the water used in the feed (∼0.7 mol/mol of urea). The produced wastewater contains ∼0.3–1.5 wt.% urea. In this wastewater, decomposition of urea to ammonia, nitrogen oxides, and nitric acid can contribute to pollution by leading to acid rain. Therefore, this wastewater should be treated before discharging which requires costly techniques. Meanwhile, urea is a promising fuel as it can be electrolyzed to produce hydrogen or used directly in fuel cells to generate electricity. The energy generated from urea is higher than that obtained from liquid or compressed hydrogen, where the theoretical efficiency of the direct urea fuel cell (DUFC), which is 102.9% at room temperature, is higher than that of hydrogen fuel cell (83% under similar conditions). The operating mechanism of DUFC can be represented by the following reactions (Lan et al., 2010b; Lan and Tao, 2011; Xu et al., 2014; Barakat et al., 2016c):
For the theoretical open circuit voltage (OCV) of urea the fuel cell; 1.147 V at room temperature which is slightly lower than that of hydrogen fuel cell (1.23 V at room temperature).
Accordingly, a fuel cell stack can effectively treat urea-containing industrial wastewaters and simultaneously lead to production of considerable electrical energy. However, designing an effective electrocatalyst for the urea oxidation reaction to be exploited as anode is not an easy task. In previous studies, several kinds of materials were used as electrocatalysts for urea electro-oxidation including noble-metal based catalysts such as Ru–TiO2 (Wright et al., 1986), Ti–Pt (Simka et al., 2009), and Ti–(Pt–Ir) (Simka et al., 2007), and non-noble-metal ones such as Ni (Boggs et al., 2009), boron-doped thin-film diamond and SnO2–Sb2O5 (Cataldo Hernández et al., 2014).
Nickel is an efficient catalyst for urea electrooxidation as it shows high current densities at comparatively lower overpotentials than other metals. Recently, Ni-containing electrocatalysts have witnessed rapid development: metallic Ni (Boggs et al., 2009; Lan and Tao, 2011; Vedharathinam and Botte, 2012), nickel nanotubes (Ji et al., 2013), nickel nanowires (Yan et al., 2014; Guo et al., 2015), nickel hydroxide (Wang et al., 2011, 2012; Ji et al., 2013; Vedharathinam and Botte, 2013; Wu et al., 2014a), Ni–Co bimetallic hydroxide (Yan et al., 2012b; Xu et al., 2014), nickel oxide (Wu et al., 2014b), graphene oxide-nickel nanocomposites (Wang et al., 2013), Ni-graphene (Barakat et al., 2016a) (Wang et al., 2013), ionic liquid-Ni(II)-graphite composites (Chen et al., 2015), NiMoO4·xH2O nanosheets (Liang et al., 2015), porous nickel@carbon sponge (Ye et al., 2015), Ni&Mn nanoparticles (Barakat et al., 2016b), CoNi film (Vilana et al., 2016), etc.
Two-dimensional (2D) crystalline materials have a number of unique properties that make them interesting for both fundamental studies and future applications. The first material in this class is graphene, a single atomic layer of carbon. Graphene has a number of remarkable mechanical, thermal and electrical properties. Besides its excellent thermal and electrical conductivities, graphene has a large specific surface area and excellent chemical stability which are highly preferable characteristics for support materials in composite electrocatalysts (Allen et al., 2010; Li and Kaner, 2008; Rao et al., 2009). In this context, graphene-based nanocomposites catalysts are expected to improve the performance of the direct urea fuel cell electrode.
Several methods have been introduced for graphene synthesis including mechanical exfoliation (Avouris and Dimitrakopoulos, 2012; Novoselov et al., 2004), chemical vapor deposition (CVD) (Hagstrom et al., 1965), and chemical reduction of graphene oxide (Barakat and Motlak, 2014a; Barakat et al., 2014, 2015). The mentioned processes are the widest used ones; however they suffer from high cost, low yield, and long time-consuming procedures. Moreover, most of the introduced procedures for the synthesis of metal nanoparticles-decorated graphene nanocomposites consist of multiple-steps and use expensive precursors. From the instrumentation point of view, the chemical routes are the cheapest strategy; however, these procedures require several chemicals during the preparation steps which are disadvantageous. Industrially, utilizing commercial and abundant precursors is desirable from an economic point of view. Recently, sugar was introduced as a promising precursor for graphene with good industrial applications (Gupta et al., 2012a; Zhu et al., 2010). Accordingly, graphene has been synthesized from low-value or negatively valued raw carbon-containing materials (e.g. cookies, chocolate, grass, plastics, roaches, and dog feces) (Ruan et al., 2011). Moreover, Akhavan et al. (2014) have introduced the preparation of graphene from various natural and industrial carbonaceous wastes such as vegetation wastes (wood, leaf, bagasse, and fruit wastes), animal wastes (bone and cow dung), a semi-industrial waste (newspaper), and industrial waste (soot powders produced in exhaust of diesel vehicles).
In this work we prepared graphene/nickel nanocomposites from inexpensive materials by a one-step method to be exploited as anode material for direct urea fuel cells. The graphene sheets were prepared by calcination of commercial sugar at 800 oC. Similarly, the graphene/nickel nanocomposites (Gr/Ni) were prepared at different concentrations of nickel acetate; 1, 2, 3, 4 and 5 wt.%. The sample prepared from 3 wt.% metallic precursor exhibited higher catalytic activity than that of the other concentrations and high stability as well. A direct urea fuel cell was fabricated using Gr/Ni at 3 wt.% as the anode electrode, platinum/carbon (20% of platinum) as the cathode, and an anion exchange membrane.
2 Experimental
2.1 Preparation of electrocatalysts
A one-step synthesis method was used to prepare the electrocatalysts. Typically, 1 g of commercial sugar obtained from the local market and nickel(II) acetate tetrahydrate (Ni(CH3COO)2·4H2O, 98%, Alfa Aesar) was used as precursors for graphene and nickel, respectively. Sugar and metallic precursor weights were estimated so as to have final solutions containing 0, 1, 2, 3, 4 and 5 wt.% nickel acetate. Later, the solid mixtures were dissolved in 20 mL distilled water. Then, the solutions were heated from room temperature to 800 °C at a heating rate of 3 °C min−1 under an argon atmosphere with a holding time of 1 h. The obtained products were used as it is without any further treatments.
2.2 Physical characterization
Raman spectra were collected on a spectrometer (JY H800UV) equipped with an optical microscope at room temperature. For excitation, 488 nm line from an Ar+ ion laser (Spectra Physics) was focused, with an analyzing spot of about 1 mm, on the sample under the microscope. X-ray diffraction (XRD) analysis was conducted on a Rigaku X-ray diffractometer (XRD, Rigaku, Japan) using Cu Kα radiation (λ = 0.154056 nm). The scanning electron microscopy (SEM) images were recorded on a JEOL JSM-5900 electron microscope, Japan. Transmission electron microscopy (TEM) images were taken on a JEOL JEM-2010 electron microscope, Japan, operated at 200 kV equipped with energy dispersive spectroscopy (EDX).
2.3 Electrochemical studies
Cyclic voltammetry (CV) and chronoamperometry (CA) analyses for urea electro-oxidation were controlled by a VersaStat4 potentiostat device. A typical three electrode electrochemical cell was utilized in which the graphene/nickel samples, platinum wire, and saturated Ag/AgCl electrode (0.1981 V vs. SHE) served as working, counter, and reference electrodes, respectively. Preparation of the working electrode was carried out by mixing 2 mg of the functional material, 20 μL Nafion solution (5 wt.%) and 400 μL isopropanol. The solution was sonicated for 30 min at room temperature. Twenty-five microliters from the prepared solution was cast on the active area of a glassy carbon electrode and the electrode was dried at 80 °C for 30 min.
2.4 Fuel cell fabrication and analysis
Preparation of the fuel cell electrodes was executed by mixing 6 mg of Gr/Ni with 800 μL isopropanol and 40 μL Nafion (5 wt.%) in an ultrasonic water bath for 30 min to obtain catalyst ink. Then, the prepared solution was loaded on a carbon cloth sheet (2.5 × 2.5 cm, Electro Chem. Inc., USA). After that, the coated electrode was dried in an air oven at 80 °C for 30 min. Similarly, the cathode was prepared by loading a suspension containing Pt/C (20 wt.% Pt) nanoparticles (3 mg Pt/C in 800 μL isopropanol and 40 μL Nafion) on a carbon cloth sheet (2.5 × 2.5 cm); the loaded carbon cloth was dried at 80 °C for 30 min prior to serving as cathode.
Commonly, KOH solution is used as the electrolyte in conventional alkaline fuel cells, but CO2 is one of the urea electrooxidation products and the reaction between CO2 and KOH is a typical problem (Varcoe et al., 2007). Consequently, an anion exchange polymer membrane (AEM, AMI-7001, AMFOR INC.) that is a compatible with CO2 (Unlu et al., 2009) was used as electrolyte. The anion exchange membrane was immersed in 1 M KOH solution and heated at 50 °C for 2 h, and then left in the solution for 10 h as a pretreatment procedure. Gold-coated stainless steel plates with incisions as flow channels were used as current collectors at the cathode and anode. Aqueous solution of 0.33 M urea in 1 M KOH was fed into a chamber as a fuel at the anode (passive cell). At the cathode, the oxygen in air atmosphere was used as electron acceptor.
Fig. 1 shows a domestic simple circuit (self-made) which was used to measure the fuel cell performance and the current-voltage characterization. This circuit reveals the fuel cell as part of an electric circuit which views I-V performance data for a fuel cell in a more useful form (Benziger et al., 2006). According to this circuit, the fuel cell serves as power source for the electric circuit so it is convenient to consider it as a battery. The open circuit voltage (OCV) can be expressed as the cell emf value when the internal resistance (Rin) is considered zero, or the cell voltage that can be measured in the absence of current. The cell voltage is a linear function of current, and can be described by the following equation:
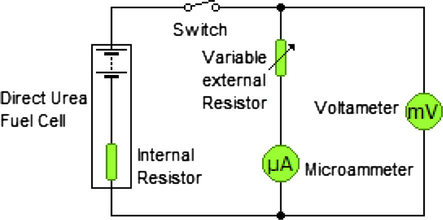
Domestic simple circuit for the current-voltage characterization.
3 Results and discussions
Overall, one of the simplest methods to get carbon is the dehydration of sugar as an abundant precursor, where C12H22O11 is converted completely to carbon element and water molecules by heating, as shown in the following reaction. However, the presence of water in the proposed methodology can enhance the obtained carbon structure (Gupta et al., 2012b):
In order to detect the structure of the produced carbon, Raman spectroscopy was invoked as an effective technique based on the location and intensity of the relative peaks. Fig. 2A shows the Raman spectra of the product obtained from Ni-containing composite (3 wt.% sample) and Ni-free samples. Typical result spectra contain two peaks at 1343 and 1582 cm−1 corresponding to the well-defined D and G bands, respectively. Obviously, the D band has a slightly higher intensity than the G band which indicates the reduction in the size of the in-plane sp2 domains and confirms the formation of the graphene structure as well. Furthermore, a band located at 2196 cm−1, which is attributed to the nickel nanoparticles intercalated into graphene can be observed (Stankovich et al., 2007; Guo et al., 2009). Fig. 2B displays the Raman spectra of the different samples. As shown, increasing the nickel content influences the intensity of the D and G peaks. Overall, Raman results indicated that the obtained graphene is multi-layered (possibly more than 10 layers). Besides these two main bands, the 2D band appearing at ∼2680 cm−1 can provide useful information about the structure of the synthesized graphene (Akhavan, 2015). Typically, the 2D/G ratio is inversely proportional to the number of graphene layers. For instance, 2D/G > 1.6 reveals single-layer graphene, while small ratio indicates multilayer graphene (more than 5) (Kim et al., 2009; Calizo et al., 2007). Based on the obtained results, the 2D/G ratio of the nickel-free graphene was 0.46 and it decreased to ∼0.36 after addition of nickel in all formulations. This finding indicates that the presence of nickel led to increase in the number of graphene layers.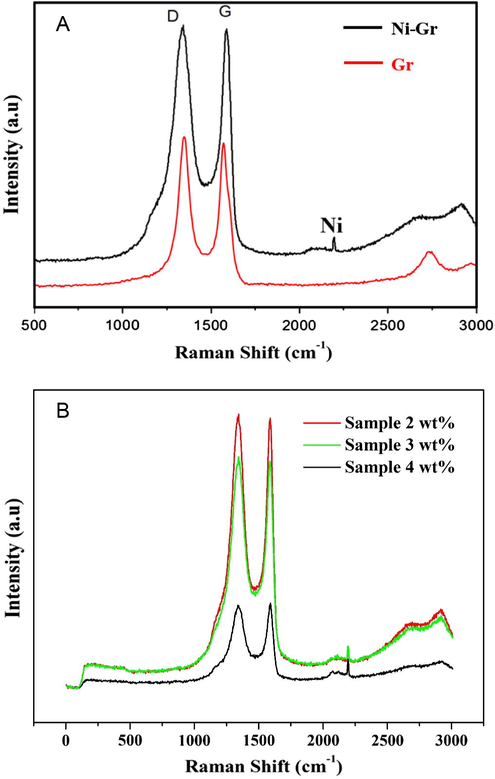
Raman spectra of the prepared (A) Ni-decorated and pristine graphene and (B) samples with different loadings.
To verify the Gr/Ni product crystal structures, crystallinity, and crystal sizes, the obtained samples were examined by X-ray diffraction analysis. Fig. 3 reveals that the cubic crystal system of nickel was consistent with the standard crystallographic spectrum of nickel (Hull., Phys. Rev. 1921, Ref. Code: 01-1258) (Hull, 1921). Comparing the d-spacing of the valuable X-ray card with that obtained experimentally, the obtained peaks (2θ) at 44.43°, 51.76° and 76.31° are in agreement with the (1 1 1), (2 0 0) and (2 2 0) planes, respectively of the standard. In addition, no states of oxides, hydroxides, or secondary phases appeared. Comparison between charts of Gr/Ni for different concentrations of Ni yielded that the peaks became higher and sharper with increasing nickel concentration, which indicates increase in the nickel nanoparticle crystallinity. This result reveals increase in the crystal size of the nickel nanoparticles because the crystal size and the width of the peak are inversely proportional (Drits et al., 1997).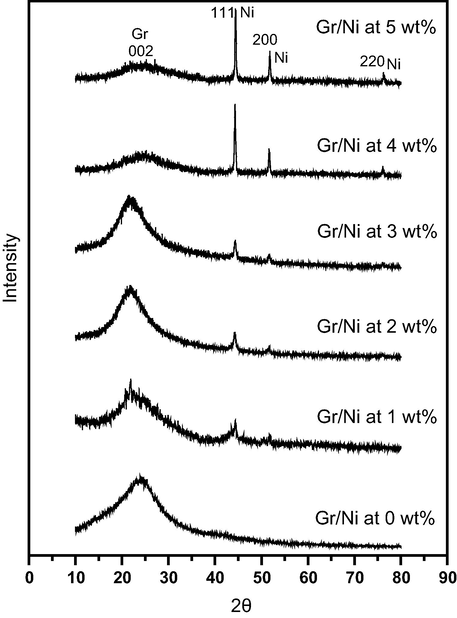
XRD patterns of Gr/Ni with different Ni loadings (0, 1, 2, 3, 4, and 5 wt.%).
The crystallite size (D) of the obtained Ni NPs in Gr/Ni at all concentrations was calculated using the Debye–Scherer’s formula (Eq. (7)) from the full width at half-maximum (FWHM) (Γ) of the nickel’s peaks (Scherrer, 1918; Burton et al., 2009).
As the proposed synthesis process is based on using aqueous solution, the observed graphitization yield was around 17 wt.%. Compared to other materials, the obtained graphitization yield is considered a low value. However, it is acceptable with respect to the utilized precursor; the carbon content in sucrose is around 26.67 wt.%. On the other hand, considering that the formed intermediates (NiO and NiCO3) have high melting points, it is safe to claim that no losses in the nickel metal occured during the decomposition of the metal salt. In other words, based on the meting point of NiO and Ni (1955 and 1455 °C, respectively) and the strong reducing power of the formed gases (hydrogen and carbon monoxide), it can be confidently claimed that all the nickel content in the utilized precursor was obtained in the final product. Accordingly, the nickel content in the final products was calculated to be 1.41, 2.79, 4.12, 5.42, and 6.69 wt.% for the samples synthesized from initial solutions having 1, 2, 3, 4, and 5 wt.% nickel acetate, respectively. It is noteworthy mentioning that these calculations almost match the EDX analysis results (data are not shown).
To confirm the composition and investigate the surface morphology of the obtained Gr/Ni samples, scanning electron microscope (SEM) analysis was invoked. As shown in Fig. 4a, the sheets of graphene at 0 wt.% consisted of thin and wrinkled sheets linked together. Fig. 4b–f shows the formation of nickel nanoparticles on the graphene sheets.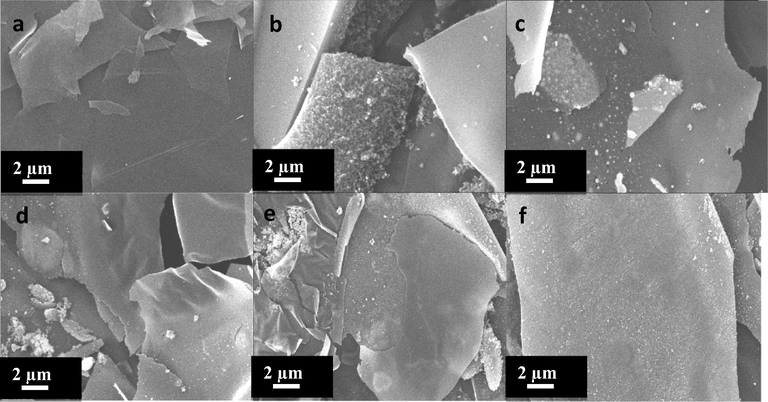
SEM images of Gr/Ni with different concentrations of Ni: (a–f) 0, 1, 2, 3, 4, and 5 wt.%, respectively.
TEM results are presented in Fig. 5. Fig. 5A and B shows the spherical shape of the nickel nanoparticles for Gr/Ni 3 wt.% concentration of nickel acetate. The average particle size of the nickel nanoparticles was estimated at 27.43 nm which is close to the XRD results. Furthermore, the elemental mapping images (Fig. 5C–E) reveal that no impurities states appear in the Gr/Ni at 3 wt.% sample. The proposed preparation process is considered an one-pot procedure for synthesis of metal nanoparticles-decorated graphene. Therefore, besides the good application, the introduced procedure saves time and chemicals to prepare such functional materials compared to conventional multi-step routes (Barakat and Motlak, 2014b).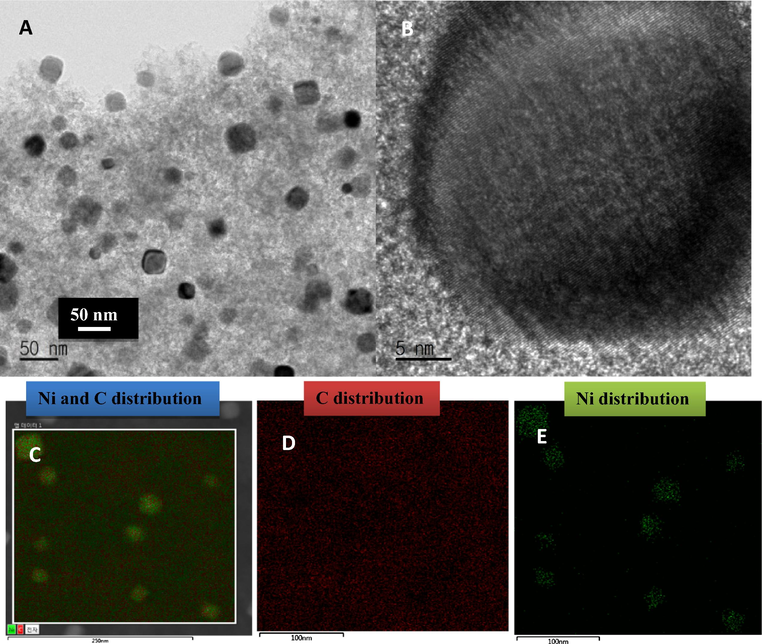
TEM and EDS images of Gr/Ni with 3 wt.% concentration of Nickel.
For comparison, Fig. 6 exhibits the typical cyclic voltammetry (CV) of the Gr/Ni 0, 1, 2, 3, 4 and 5 wt.% and pure Ni (Ni nanopowder <100 nm, 99.9%, Sigma-Aldrich) electrodes measured in 1 M KOH solution at a scan rate of 50 mV s−1. Reduction and oxidation current peaks were observed between 0.65 and 0.35 V, which correspond to the reversible conversion of Ni2+ to Ni3+ according to the following reaction (Vedharathinam and Botte, 2012):
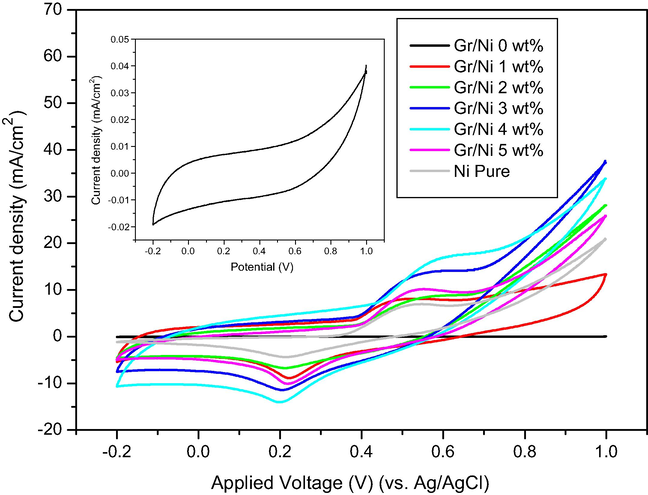
CV plots of Gr/Ni with different concentrations of nickel (0, 1, 2, 3, 4 and 5 wt.%) and Ni-pure electrodes in 1 M KOH at a scan rate of 50 mV s−1. Inset figure is the CV plot of Gr/Ni at 0 wt.% electrode in 1 M KOH at a scan rate of 50 mV s−1.
As observed from the inset figure (Fig. 6), the pure graphene (Gr/Ni at 0 wt.%) does not show any reduction or oxidation current peaks, which is due to the absence of nickel in the electrode.
The oxidation current density of Gr/Ni at 1, 2, 3, 4 and 5 wt.% is higher than pure Ni as shown in Fig. 6. This finding can be attributed to the influence of the graphene support which increases the active surface area of the catalyst. Subsequently, it reveals more active sites and increases oxidation current. Moreover, the known high adsorption capacity can have a very efficient role. The electroactive surface areas (ESA) of the samples were estimated by the following equation (Xia et al., 2009; Lee et al., 2007; Li et al., 2011; Wang et al., 2012):
Sample
Gr/Ni 1 wt.%
Gr/Ni 2 wt.%
Gr/Ni 3 wt.%
Gr/Ni 4 wt.%
Gr/Ni 5 wt.%
Pure Ni
ESA (cm2 mg−1)
23.6
21.5
35.8
44.3
27.7
12.4
Fig. 7 displays the voltammograms of the samples in the presence of 0.33 M urea (in 1 M KOH) at a scan rate of 50 mV/s. Compared to Fig. 6, a significant increase in the current density was obtained after urea addition for pure Ni and all the prepared formulations. As a result of the increase in the active surface area of the nickel catalysts by graphene sheets, the current density of Gr/Ni samples is higher than the current density of pure Ni. Therefore, the graphene sheets enhance the electron transfer for urea oxidation. However, the Gr/Ni electrode obtained from the 3 wt.% sample affords the highest current density (81.65 mA cm−2 at an applied voltage of 0.9 V vs. Ag/AgCl), as shown in the inset figure. This finding can be explained in two parts. First, compared to the low nickel contents (1 and 2 wt.%), the best sample possesses higher functional material (Ni); this hypothesis is supported by the linear increase in the current density at low Ni content (up to 3 wt.%). Second, in case of the higher contents (4 and 5 wt.%), according to the XRD results, the particle size of nickel in these samples is larger than that in Gr/Ni at 3 wt.%. Thus, it is reasonable that the active surface area of nickel particles in Gr/Ni at 3 wt.% is higher than that of Gr/Ni at 4 and 5 wt.%, and consequently the current density of Gr/Ni at 3 wt.% is higher than that of Gr/Ni at 4 and 5 wt.%. The onset potential for urea electrooxidation on the Gr/Ni electrodes is approximately the same for all samples, which is around 0.38 V.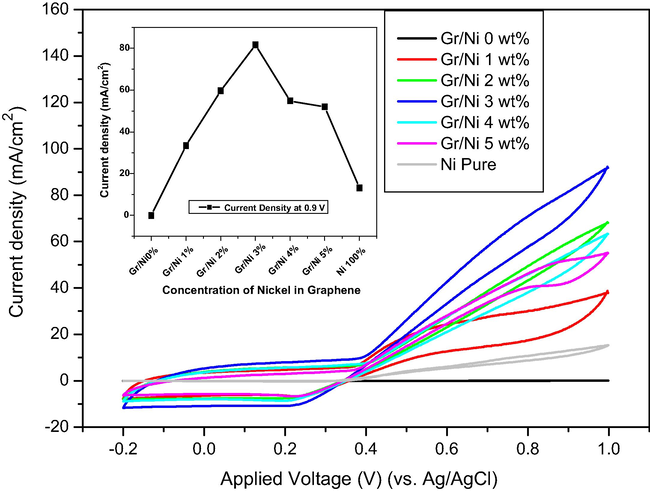
CV plots of Gr/Ni with different concentrations of nickel (0, 1, 2, 3, 4 and 5 wt.%) and pure Ni electrodes in 1 M KOH with 0.33 M urea at a scan rate of 50 mV s−1. Inset figure is the relationship between the current density (mA cm−2) and the concentration of nickel (wt.%) at a potential of 0.9 V.
The influence of urea concentration on the catalytic performance of the Gr/Ni at 3 wt.% electrode solution was investigated (Fig. 8). According to Eq. (1), the suitable ratio of [OH−]/[CO(NH2)2] is around 8, and it is appropriate for 0.125 M urea to react with 1 M KOH (Guo et al., 2015). Therefore, as the concentration of 0.33 M urea is very close to the ideal ratio, the current density obtained with the best electrode (Ni content 3 wt.%) is higher than other concentrations of urea.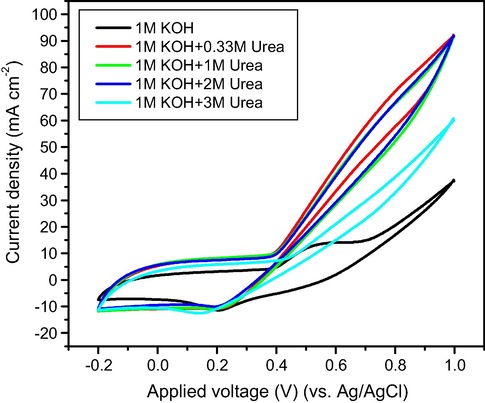
CV plots of Gr/Ni (3 wt.%) electrode in 1 M KOH with different concentrations of urea (0, 0.33, 1, 2 and 3 M) at a scan rate of 50 mV s−1.
It is known that transition metals possess good stability in alkaline medium than acidic. To affirm this hypothesis, the stability of the Gr/Ni at 3 wt.% electrode was assayed by chronoamperometry (see Fig. 9). Apparently, the electrode maintains its activity toward urea electrooxidation in 0.33 M urea/1 M KOH solution for at least 10,000 s at an applied cell voltage of 0.5 V. Therefore, it can be claimed that the Gr/Ni at 3 wt.% electrode has a good stability for applications.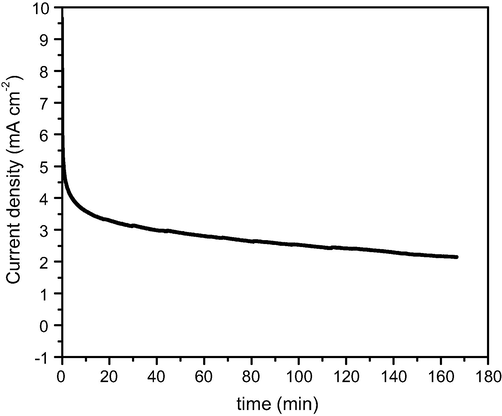
Chronoamperometry plots of Gr/Ni (3 wt.%) electrode in 1 M KOH, with 0.33 M urea at an applied voltage of 0.5 V.
As aforementioned, the main target of this study is building a direct urea fuel cell to generate power and simultaneously oxidize urea to environmentally safe products. As concluded from Fig. 8 and also based on the urea oxidation reaction, low urea concentration solutions are more favorable. Fig. 10 demonstrates the performance of the assembled direct urea fuel cell using the best sample as anode with 0.33 M urea solution as fuel and natural oxygen in air atmosphere as the electron acceptor. The cell was operated at room temperature to mimic industrial conditions. As shown, the cell achieved an appreciable maximum power density (Pmax) of 4.06 × 10⁻³ mW cm−2.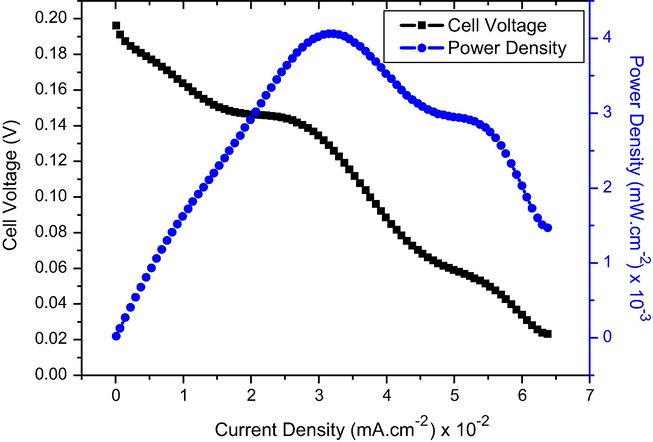
Polarization and power density curves of DUFC using Gr/Ni (3 wt.%) as anode catalyst and Pt/C (20%) as cathode catalyst.
Actually, DUFCs show low power than other fuel cells because the internal resistance of the fuel cell is the parameter that most affects. Therefore, the internal resistance of the cell has been calculated. Eq. (4) can be reduced to Eq. (14) to estimate the internal resistance (Rin) and the open circuit voltage (OCV) by plotting the relation between (1/RL) and (1/Vcell) as shown in Fig. 11:
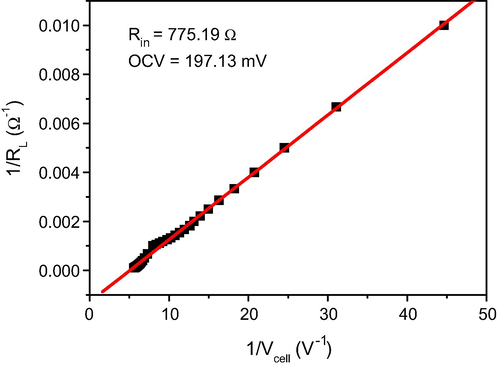
The relationship between (1/RL) and (1/Vcell).
According to Eq. (14) and Fig. 11, the open circuit voltage (OCV) is 197.13 mV and the internal resistance (Rin) of the DUFC is 775.19 Ω, which is a very high internal resistance for a power source in an electric circuit. Actually, this high resistance can be attributed to the utilized membrane. Subsequently, most of the power was exhausted to overcome the internal resistance; hence, the produced power was reduced.
Although the produced power looks smaller than in direct alcohol fuel cells, it is believed that this is a good finding as power could be generated simultaneously with wastewater treatment. Moreover, the results emphasize the distinct role of graphene as the utilized metal amount is very small with a considerable output of power. Therefore, the interactive contribution of graphene and nickel in addition to the large active surface area of graphene sheets can promote the performance of the DUFC even at low concentrations of nickel. It is noteworthy that pure nickel acetate powder has been sintered at the same calcination temperature. The obtained power revealed similar CV results to those obtained from purchased nickel powder (Fig. 6). However, in the fuel cell, no power was obtained as a negative OCV was obtained.
There was a big difference between the current density obtained from the CV measurements and from the cell. The big decrease in the current density can be attributed to internal cell resistance. The internal resistance (Rint) can be determined from the linear polarization curve, where it equals the slope of this curve (ΔE/ΔI), ∼2670 Ω. This value is considered the average resistance of the cell; it is a very big value for the cell resistance and it can be attributed to the utilized commercial anion exchange membrane. Overall, the instant internal resistance depends on the external load and the generated current density and can be divided into three regions. The first appears at low current and high potential in the polarization curve. Within this region, the generated electrons need to overcome the back potential provided to the cell from the external load to produce current. The second zone, called the ohmic resistance zone, has a vital role in determining the point of the maximum achievable power. The ohmic resistance is mainly related to the cell components as it represents the resistances of the electrodes, membrane, electrolyte and external connections. The third zone is called the mass transfer resistance. Fig. 12 displays the relation between the cell resistance and the current density. As shown, at low current density (high voltage), the cell resistance was high and then decreased sharply with decreasing voltage and increasing current density. This measurement is considered a real evaluation of the cell resistance during the working stage. The results strongly encourage enhancing the electrical conductivity of the membrane which will be the next target.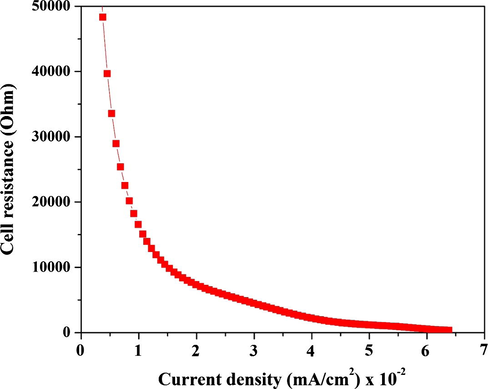
Influence of the current density on the instant internal resistance of the assembled cell.
Overall, the main advantage of the study is in obtaining an efficient electrocatalyst for direct urea fuel cells from cheap and abundant precursors. Table 2 shows a comparison between the electrocatalytic performance of the introduced decorated graphene and other anodes, as can be observed, the proposed anode shows good performance.
Electrode
Electrolyte
Urea solution concentration
Maximum current (mA/cm2)
Generated power (mW/cm2)
Ref.
NiMn-CNFs
1 M KOH
2 M
27
–
Barakat et al. (2016b)
NiCo(OH)2
5 M KOH
0.33 M
37
–
Yan et al. (2012b)
Ni electrode
5 M KOH
0.33 M
95
–
Vedharathinam and Botte (2012)
NiOH nanoribbons
5 M KOH
0.33 M
9
–
Wang et al. (2012)
Ni–Zn
5 M KOH
0.33 M
67
–
Yan et al. (2012a)
Ni–Zn–Co
5 M KOH
0.33 M
24
–
Yan et al. (2012a)
Ni/C
–
1 M
–
0.2 (Pt/C cathode; modified membrane
Lan et al. (2010a)
Ni/C
–
1 M
–
0.09 (Ag/C anode and modified membrane
Lan et al. (2010a)
GO–Ni
1 M KOH
0.33 M
35
–
Wang et al. (2013)
Ionic liquid-Ni(II)-graphite
1 M NaOH
10 mM
2
–
Chen et al. (2015)
Ni-decorated graphene
1 M KOH
0.33 M
85
4 (Pt/C cathode, commercial cation membrane
This study
4 Conclusions
Nickel nanoparticles-decorated graphene can be synthesized from commercial sugar and nickel acetate by an one-step process. Briefly, sintering of an aqueous solution composed of sugar and the metal salt led to full graphitization of sugar to form multi layered graphene sheets and complete reduction in nickel to form pristine nickel nanoparticles attached to a carbonaceous support. As an electrocatalyst for urea oxidation, to have the best activity, the metal content should be optimized 3 wt.% of nickel acetate in the original solutions revealed the best performance. The proposed Ni/Gr composite can be exploited as an active anode in direct urea fuel cells for the simultaneous treatment of urea-containing industrial wastewater and power generation. The obtained results can be attributed to the large active surface area of graphene sheets and the synergistic contribution of graphene and nickel.
Acknowledgments
This project was funded by the National Plan for Science, Technology and Innovation (MAARIFAH), King Abdulaziz City for Science and Technology, Kingdom of Saudi Arabia, Award Number (11-ENE1917-02).
References
- Bacteriorhodopsin as a superior substitute for hydrazine in chemical reduction of single-layer graphene oxide sheets. Carbon. 2015;81:158-166.
- [Google Scholar]
- Synthesis of graphene from natural and industrial carbonaceous wastes. RSC Adv.. 2014;4(39):20441-20448.
- [Google Scholar]
- CoxNiy-decorated graphene as novel, stable and super effective non-precious electro-catalyst for methanol oxidation. Appl. Catal., B. 2014;154:221-231.
- [Google Scholar]
- Nickel nanoparticles-decorated graphene as highly effective and stable electrocatalyst for urea electrooxidation. J. Mol. Catal. A: Chem.. 2016;421:83-91.
- [Google Scholar]
- Effective and stable CoNi alloy-loaded graphene for ethanol oxidation in alkaline medium. J. Electrochem. Soc.. 2014;161(12):F1194-F1201.
- [Google Scholar]
- From secondary to primary role in alkaline fuel cells: Co-decorated graphene as effective catalyst for ethanol oxidation. ECS Electrochem. Lett.. 2015;4(1):F5-F8.
- [Google Scholar]
- Ni&Mn nanoparticles-decorated carbon nanofibers as effective electrocatalyst for urea oxidation. Appl. Catal. A. 2016;510:180-188.
- [CrossRef] [Google Scholar]
- CoNi bimetallic nanofibers by electrospinning: nickel-based soft magnetic material with improved magnetic properties. J. Phys. Chem. C. 2010;114(37):15589-15593.
- [CrossRef] [Google Scholar]
- Production of smooth and pure nickel metal nanofibers by the electrospinning technique: nanofibers possess splendid magnetic properties. J. Phys. Chem. C. 2008;113(2):531-536.
- [CrossRef] [Google Scholar]
- Cobalt nanofibers encapsulated in a graphite shell by an electrospinning process. J. Mater. Chem.. 2009;19(39):7371-7378.
- [Google Scholar]
- CoxNiy-decorated graphene as novel, stable and super effective non-precious electro-catalyst for methanol oxidation. Appl. Catal., B. 2014;154–155:221-231.
- [CrossRef] [Google Scholar]
- Nickel nanoparticles-decorated graphene as highly effective and stable electrocatalyst for urea electrooxidation. J. Mol. Catal. A: Chem.. 2016;421:83-91.
- [CrossRef] [Google Scholar]
- The power performance curve for engineering analysis of fuel cells. J. Power Sourc.. 2006;155(2):272-285.
- [CrossRef] [Google Scholar]
- Urea electrolysis: direct hydrogen production from urine. Chem. Commun. (Camb). 2009;32:4859-4861.
- [CrossRef] [Google Scholar]
- Preparation and characterization of microporous Ni coatings as hydrogen evolving cathodes. J. Appl. Electrochem.. 2000;30:107-111.
- [Google Scholar]
- On the estimation of average crystallite size of zeolites from the Scherrer equation: a critical evaluation of its application to zeolites with one-dimensional pore systems. Micropor. Mesopor. Mater.. 2009;117(1–2):75-90.
- [CrossRef] [Google Scholar]
- Temperature dependence of the Raman spectra of graphene and graphene multilayers. Nano Lett.. 2007;7(9):2645-2649.
- [Google Scholar]
- Electrochemical oxidation of urea in aqueous solutions using a boron-doped thin-film diamond electrode. Diam. Relat. Mater.. 2014;44:109-116.
- [CrossRef] [Google Scholar]
- Easy-to-prepare electrochemical platform composed of ionic liquid-Ni(II)-graphite composites: laboratory study on electrochemical oxidation of urea, alcohols, and glucose. Electrochim. Acta. 2015;182:113-121.
- [CrossRef] [Google Scholar]
- Thermal decomposition of nickel acetate tetrahydrate: an integrated study by TGA, QMS and XPS techniques. J. Mol. Catal. A: Chem.. 2005;228(1–2):283-291.
- [CrossRef] [Google Scholar]
- XRD measurement of mean crystallite thickness of illite and illite/smectite: reappraisal of the Kubler index and the Scherrer equation. Clays Clay Miner.. 1997;45(3):461-475.
- [Google Scholar]
- Preparation of nickel nanowire arrays electrode for urea electro-oxidation in alkaline medium. J. Power Sourc.. 2015;278:562-568.
- [Google Scholar]
- A green approach to the synthesis of graphene nanosheets. ACS Nano. 2009;3(9):2653-2659.
- [CrossRef] [Google Scholar]
- Graphene from sugar and its application in water purification. ACS Appl. Mater. Interf.. 2012;4(8):4156-4163.
- [Google Scholar]
- Graphene from sugar and its application in water purification. ACS Appl. Mater. Interf.. 2012;4(8):4156-4163.
- [CrossRef] [Google Scholar]
- Surface structures on the clean platinum (1 0 0) surface. Phys. Rev. Lett.. 1965;15(11):491.
- [Google Scholar]
- In situ UV visible reflectance spectroscopic investigation of the Nickel electrode-Alkaline solution interface. Electrochim. Acta. 1986;31(3):335-342.
- [Google Scholar]
- Chemical analysis by X-ray diffraction. Ind. Eng. Chem. Anal. Ed.. 1938;10(9):457-512.
- [Google Scholar]
- X-ray crystal analysis of thirteen common metals. Phys. Rev.. 1921;17(5):571-588.
- [CrossRef] [Google Scholar]
- Formation of open-ended nickel hydroxide nanotubes on three-dimensional nickel framework for enhanced urea electrolysis. Electrochem. Commun.. 2013;29:21-24.
- [CrossRef] [Google Scholar]
- Large-scale pattern growth of graphene films for stretchable transparent electrodes. Nature. 2009;457(7230):706-710.
- [Google Scholar]
- Preparation of nano-sized nickel as anode catalyst for direct urea and urine fuel cells. J. Power Sourc.. 2011;196(11):5021-5026.
- [CrossRef] [Google Scholar]
- A direct urea fuel cell–power from fertiliser and waste. Energy Environ. Sci.. 2010;3(4):438-441.
- [Google Scholar]
- A direct urea fuel cell – power from fertiliser and waste. Energy Environ. Sci.. 2010;3(4):438-441.
- [CrossRef] [Google Scholar]
- Growing Pt nanowires as a densely packed array on metal gauze. Am. Chem. Soc.. 2007;129:10634-10635.
- [Google Scholar]
- Morphology-controlled synthesis and electrocatalytic characteristics of platinum structures on micro-patterned carbon nanotube platforms. J. Appl. Electrochem.. 2011;41(12):1425-1431.
- [CrossRef] [Google Scholar]
- Enhanced electrooxidation of urea using NiMoO4 xH2O nanosheet arrays on Ni foam as anode. Electrochim. Acta. 2015;153:456-460.
- [CrossRef] [Google Scholar]
- Microbial fuel cells: methodology and technology. Environ. Sci. Technol.. 2006;40(17):5181-5192.
- [Google Scholar]
- The hydrogen evolution reaction on nickel surfaces stabilized by H-absorption. Electrochim. Acta. 1994;39(10):1385-1391.
- [Google Scholar]
- Electric field effect in atomically thin carbon films. Science. 2004;306(5696):666-669.
- [Google Scholar]
- Bestimmung der Größe und der inneren Struktur von Kolloidteilchen mittels Röntgenstrahlen. Gottinger Nachr.. 1918;2:98-100.
- [Google Scholar]
- Influence of anode material on electrochemical decomposition of urea. Electrochim. Acta. 2007;52(18):5696-5703.
- [CrossRef] [Google Scholar]
- Electrochemical treatment of aqueous solutions containing urea. J. Appl. Electrochem.. 2009;39(7):1137-1143.
- [Google Scholar]
- Synthesis of graphene-based nanosheets via chemical reduction of exfoliated graphite oxide. Carbon. 2007;45(7):1558-1565.
- [CrossRef] [Google Scholar]
- Anion exchange membrane fuel cells: experimental comparison of hydroxide and carbonate conductive ions. Electrochem. Solid-State Lett.. 2009;12(3):B27-B30.
- [CrossRef] [Google Scholar]
- Poly(ethylene-co-tetrafluoroethylene)-derived radiation-grafted anion-exchange membrane with properties specifically tailored for application in metal-cation-free alkaline polymer electrolyte fuel cells. Am. Chem. Soc.. 2007;19:2686-2693.
- [Google Scholar]
- Understanding the electro-catalytic oxidation mechanism of urea on nickel electrodes in alkaline medium. Electrochim. Acta. 2012;81:292-300.
- [CrossRef] [Google Scholar]
- Direct evidence of the mechanism for the electro-oxidation of urea on Ni(OH)2 catalyst in alkaline medium. Electrochim. Acta. 2013;108:660-665.
- [CrossRef] [Google Scholar]
- Influence of the composition and crystalline phase of electrodeposited CoNi films in the preparation of CoNi oxidized surfaces as electrodes for urea electro-oxidation. Appl. Surf. Sci.. 2016;360:816-825.
- [CrossRef] [Google Scholar]
- Exfoliated nickel hydroxide nanosheets for urea electrolysis. Electrochem. Commun.. 2011;13(10):1135-1138.
- [CrossRef] [Google Scholar]
- Enhanced electrocatalytic oxidation of urea based on nickel hydroxide nanoribbons. J. Power Sourc.. 2012;217:498-502.
- [CrossRef] [Google Scholar]
- Electrochemically reduced graphene oxide–nickel nanocomposites for urea electrolysis. Electrochim. Acta. 2013;89:732-736.
- [CrossRef] [Google Scholar]
- Electrooxidation of urea at the ruthenium titanium oxide electrode. AIChE J.. 1986;32(9):1450-1458.
- [Google Scholar]
- Nickel hydroxide electrode with a monolayer of nanocup arrays as an effective electrocatalyst for enhanced electrolysis of urea. Electrochim. Acta. 2014;144:194-199.
- [CrossRef] [Google Scholar]
- Hydrothermal growth of vertically-aligned ordered mesoporous nickel oxide nanosheets on three-dimensional nickel framework for electrocatalytic oxidation of urea in alkaline medium. J. Power Sourc.. 2014;272:711-718.
- [CrossRef] [Google Scholar]
- Synthesis and application of Pt nanocrystals with controlled crystallographic planes. J. Phys. Chem. C. 2009;113:18115-18120.
- [Google Scholar]
- Nickel-cobalt bimetallic anode catalysts for direct urea fuel cell. Sci. Reports. 2014;4:5863-5868.
- [CrossRef] [Google Scholar]
- Electrochemical decomposition of urea with Ni-based catalysts. Appl. Catal., B. 2012;127:221-226.
- [Google Scholar]
- Nickel and cobalt bimetallic hydroxide catalysts for urea electro-oxidation. Electrochim. Acta. 2012;61:25-30.
- [Google Scholar]
- Nickel nanowires as effective catalysts for urea electro-oxidation. Electrochim. Acta. 2014;134:266-271.
- [CrossRef] [Google Scholar]
- Highly porous nickel@carbon sponge as a novel type of three-dimensional anode with low cost for high catalytic performance of urea electro-oxidation in alkaline medium. J. Power Sourc.. 2015;283:408-415.
- [CrossRef] [Google Scholar]
- Reducing sugar: new functional molecules for the green synthesis of graphene nanosheets. ACS Nano. 2010;4(4):2429-2437.
- [Google Scholar]


